Detachment Problem – Application in Prevention of Information Leakage in Stock Markets
Abstract
In this paper, we introduce Detachment Problem within the context of the well-established independent cascade model. It can be seen as a generalized Vaccination Problem, where we acknowledge that an individual may belong to multiple circles. The aim is to optimally cut the individuals’ ties to these circles to minimize the overall information transfer in a social network under a scenario where a limited number of investor-circle pairs can be operated. When an individual is isolated from a particular circle, it leads to the eliminating of the connections to all the members of that circle, yet the connections to other circles remain. This approach contrasts with the conventional vaccination problem, which generally involves selecting a subset of vertices for total elimination. In our case, the connections of individuals to the circles are selectively, rather than entirely, eliminated.
Contextually, this article focuses on private information flows, specifically within networks formed by memberships in circles of insiders. Our quasi-empirical study uses simulated information flows on a truly observable network, and the statistical properties of the simulated information flows are matched with real-world data. In a broader context, this paper presents the Detachment Problem as a versatile approach for optimal social distancing, applicable across various scenarios.
We propose and define a concept of expected proportional outside influence, or EPOI, as measure of how widespread information leak is. We also implement a greedy algorithm for finding a set of detachments to minimize EPOI. For comparison, we devise a simple heuristic based on minimal cut, to separate the most influential circles from each other. We provide evidence that the greedy algorithm is not optimal, and it is sometimes outperformed by the simple heuristic minimum cut algorithm, However, the greedy algorithm outperforms the cut algorithm in most cases. Further avenues of research are discussed.
keywords:
Detachment problem , Vaccination problem , Immunization problem , Influential spreaders , Influence maximization , Insider information , Independent cascade , Financial markets1 Introduction
The propagation of ideas, fake news, influence, and diseases through social networks has been examined from numerous angles, encompassing fields such as technology adoption, the spread of rumors, viral marketing initiatives, and epidemiology, among others (Kempe et al., 2003; Nowzari et al., 2016; Li et al., 2018; Sharma et al., 2019). This paper defines and introduces a new problem, which we term the Detachment Problem.
In the Detachment Problem, an individual is connected to one or more circles. A circle is simply a set which connects all its members in some way. In our data this is the set a board of directors and high level managers of a company, i.e., the set of insiders, but it can be participants in a given meeting, a school class, etc in other applications. The objective is to optimally select a given number of individual-circle pairs and remove the selected individuals from the selected circles, to minimize the information transfer in a social network. When a vertex is isolated from a given circle, it leads to the eliminating its connections to all the members of that circle. However, the connections to other circles remain. We address the detachment problem assuming the dynamics of information spread follow the well-established cascade model, known as the independent cascade model (Goldenberg et al., 2001; Kempe et al., 2003).
The Detachment Problem can be seen as a generalized case of the vaccination or immunization problem, i.e., selecting an individual and either immunize or, in the case of the detachment problem, partially isolate, from a given social network (for vaccination and immunuzation problems, see, for example, Pastor-Satorras and Vespignani, 2002; Gallos et al., 2007; Prieto Curiel and González Ramírez, 2021). While conventional vaccination approaches focus on immunizing a subset of vertices (individuals), the Detachment Problem differs as it does not entail the complete removal of a vertex. Instead, it involves cutting off its connections to specific circles. Additionally, this problem bears a strong resemblance to the task of identifying influential spreaders or nodes within a network, or influence maximization, as discussed in various studies (Kitsak et al., 2010; Chen et al., 2012; Morone and Makse, 2015; Lü et al., 2016). However, the distinctive aspect of the Detachment Problem lies not in identifying and removing a vertex (individual) but in eliminating its ties with certain circles to which it belongs.
The framework for the Detachment Problem outlined in the paper is highly generic, with a primary emphasis on methodology. This problem is applicable in a variety of contexts, ranging from the regulation of financial markets to the containment of infectious diseases. To concretize the usefulness of the framework, we focus on private information flows, in particular, in networks that emerge from memberships in circles of insiders. The go-to model we use is the well-known independent cascade model (IC), which captures a simplified susceptible-infected-recovered (SIR) model in a network of individuals. The problem of influence maximization is that of finding a subset of vertices to ”infect” in order to maximize the diffusion of information, and it has received significant attention in the literature. From the perspective of the application, this article addresses the question of preventing the spread of illicit information, which might lead to, for example, insider trading.
We study the problem by modeling a particular network of insiders, i.e., board members and key executives of companies listed in the Helsinki Stock exchange in the year 2009. These persons form a social network, and their known connections come from being members of the same inner circle in a company. As many key personnel hold key positions in multiple companies, this network represents a plausible medium through which inside information might spread (Ahern, 2017; Berkman et al., 2020; Baltakienė et al., 2022; Baltakys et al., 2023). Publicly traded companies are obligated to announce important information publicly, but the insiders of these companies gain access to such information before the information is made public. The use of such information to make profitable trades in the stock market before the information is publicized is known as insider trading, and it is illegal in most jurisdictions. Insider trading is estimated by various sources to result in massive illicit gains and as such create a pernicious and hard-to-detect cost in the economy, which makes our research question a pertinent one. What is more, our model and results point to regulatory recommendations and allow us to quantify the effect of the implementation of said recommendations.
2 Model and Problem formulation
2.1 Induced network
Definition 1.
Let be a set of vertices, and where be a collection of sets of vertices called circles. The network induced by is the graph where
In other words, there is an edge between two vertices if there is a circle in which both belong.
We associate a weight for each , to denote a probability that passes information forward to . Then we call an information flow network.
2.2 The Independent Cascade Model
The so-called Independent cascade model (Goldenberg et al., 2001; Kempe et al., 2003) describes a simple process by which information starting from an initial set of vertices spreads through such a network. It is a variant of the Susceptible - Infected - Recovered, or SIR-model, in which each vertex is infected at most once in some time step, will attempt to infect all of its neighbours in the next, and will be recovered and totally inert in all the subsequent time steps.
Let . We define a cascade from as random sequence where each and for each we have
and for every there is some such that and . The cascade is generated by the following process, which we call the independent cascade process or IC-process:
-
1.
The initially infected set is the set , and set .
-
2.
If is empty, then stop; the cascade is finished and .
-
3.
Let be a set.
-
4.
For each and such that and is not yet infected: Add to the set with probability ; if is added to mark it as influenced.
-
5.
Set and go to 2.
Given an information flow network and an initial set , we denote by
I.e, is the expected number of vertices in the cascade and the function is known as the influence function. There is no closed-form solution to the computation of the influence function (that we know of), and it has been proposed that the computation of the influence function is P#-complete(Shakarian et al. (2015))
2.3 The Detachment problem
Let be a collection of circles and let be the information flow network induced by . Let be a distribution over , or, equivalently, a distribution over the set . We define the expected proportional outside influence or EPOI of the information flow network as
In other words, the EPOI of the network is the expected proportion of non-circle members influenced when a random circle is the source of a cascade.
Given a collection of circles , we define the detachment of a vertex from a given circle such that , as the collection
and we generalize this to detaching a set of pairs in the obvious way, i.e,
We now define the -detachment problem:
Problem 1.
Find the detachment such that and is minimized.
3 Algorithms and Transformations
3.1 Bridge-block graph
Definition 2.
Let be a set of vertices and let be a collection of circles. The Bridge-Block network (BBN) induced by is a bipartite graph , where
-
1.
, is the set of blocks, i.e., each circle is called a block of the BBN.
-
2.
, is the set bridges, i.e., each vertex that belongs to more than one circle, is called a bridge of the BBN
-
3.
, i.e., a block and a bridge have an edge between them, if and only if the bridge belongs to the block.
We will use the bridge-block graph in our algorithms, and make use of the fact that a detachment of from , is equivalent to removing exactly one edge, namely from the bridge-block graph induced by .
3.2 Greedy algorithm
A simple greedy algorithm for solving Problem 1 is given in Algorithm 1. The strategy is very simple, but we present it here for illustrative purpose. The algorithm itself is amenable to many heuristics and optimizations, such as omitting vertices that have a particularly low centrality measure. We will discuss these heurisics in a further chapter.
3.3 Min-cut
Because the computation of the EPOI is time consuming with Monte Carlo, there is definitely a rationale for exploring methods that do not need the evaluation of the EPOI, and rely purely on heuristics of the graphs instead.
Theorem 1.
A (minimum) cut that separates two circles in a BBN is equivalent to a detachment
4 Empirical and random data
4.1 Empirical data
We will make use of data that comes from insider registries of companies publicly listed on the Helsinki Stock exchange. We use the year 2007 as our benchmark year, i.e., is chosen as the set of insiders for the company on the last day of 2006. is the set of people who are considered insiders of a given company . The BBN of the insiders is not fully connected, so we only choose the companies that are in the largest connected component of the generated BBN. Our data has companies, with a total of insiders, of whom are bridges, i.e., individuals who are insiders in more than one company.
4.2 Random data generation
The process of generating randomized input for the algorithm involves a systematic procedure designed to mimic the statistical properties of the empirical data and with some modifications as to the parameters. We fixed the ratios
The generative process generates the circles via a distribution that is a mix of uniform distibution and preferential selection, using a coefficient . The circle assignment was a four-stage process.
-
1.
The first process assigns each element a unique circle as follows:
-
(a)
First we assign one element to each of the circles.
-
(b)
Let be the set of assigned elements on iteration . One unassigned element is picked, and the circle for it is chosen so that the probability of being assigned into circle is
-
(c)
Repeat until each element has been assigned a circle.
-
(a)
-
2.
The BBN is then forced into being connected by generating bridges
-
(a)
An element is picked using uniform distribution, and its circle is chosen as the root circle. Note that this means larger circles have higher probability of being chosen.
-
(b)
At every iteration, a random element that is not yet connected, is chosen and added to a randomly chosen connected circle, thereby creating a bridge and connecting all the elements from its the circle to the graph.
-
(c)
this is repeated until all circles are connected to the root.
-
(a)
-
3.
The rest of the bridges are then created by choosing non-bridge elements at random and adding them to random circles.
-
4.
The bridges are then added to further circles by choosing circles using the same mixed distribution as in the first stage.
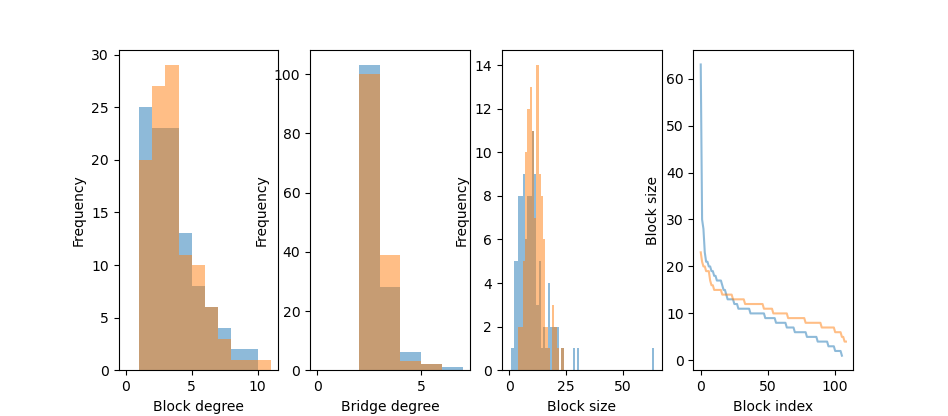
Figure 1 shows graphically a comparison of some graph characteristics of empirical and generated graphs, with , and chosen to be equal to those measured empirically, and . The empirical data had three abnormally large circles that this generative model fails to march, but otherwise the properties are very similar.
The transmission probabilities between nodes were generated from a Beta-distribution with parameters , which gives the expected value of at , and a standard deviation . We empirically determined that the expected EPOI is very robustly about 0.79 over all the random graphs in our class, including the empirical data.
5 Results
We generated 96 random graphs with number of vertices ranging from 100 to 1980 with the process described in the previous section. The objective was to gauge the robustness and scalability of our two methods. We observed a relatively stable EPOI over our data, and a modest but stable deterioration of the algorithms as the size of the graph increases, which is to be expected. Below we report the result for a sample of 15 of these random graphs.
| n | Min-cut | EPOI cut | EPOI greedy | std of EPOI | base EPOI |
|---|---|---|---|---|---|
| 280 | 2 | 0.766 | 0.705 | 0.000 | 0.809 |
| 320 | 3 | 0.720 | 0.641 | 0.000 | 0.789 |
| 680 | 1 | 0.768 | 0.720 | 0.000 | 0.783 |
| 740 | 2 | 0.756 | 0.713 | 0.000 | 0.770 |
| 860 | 2 | 0.779 | 0.736 | 0.000 | 0.790 |
| 880 | 1 | 0.766 | 0.754 | 0.000 | 0.779 |
| 900 | 2 | 0.785 | 0.755 | 0.000 | 0.798 |
| 1000 | 1 | 0.789 | 0.783 | 0.000 | 0.800 |
| 1020 | 3 | 0.734 | 0.742 | 0.000 | 0.786 |
| 1040 | 1 | 0.766 | 0.743 | 0.000 | 0.775 |
| 1500 | 1 | 0.782 | 0.775 | 0.000 | 0.790 |
| 1860 | 2 | 0.777 | 0.757 | 0.000 | 0.783 |
| 1920 | 3 | 0.766 | 0.744 | 0.000 | 0.778 |
| 1960 | 3 | 0.754 | 0.736 | 0.000 | 0.774 |
| 1980 | 1 | 0.789 | 0.783 | 0.000 | 0.793 |
| Empirical (967) | 3 | 0.712 | 0.650 | 0.000 | 0.729 |
The greedy algorithm performed better than the cutting algorithm in all but one case. In order to better understand what created the difference, we conducted a number of comparisons of graph characteristics but found no explaining factor. Further research is warranted in this respect.
6 Discussion
This short paper demonstrates the idea of the detachment problem, and is still under work. We try to present here the main ideas of detachment, the sort of networks that it might work on, and one heuristic approach.
Full combinatorial optimization is still intractable in this case, and the cutting algorithm does not seem to provide a satisfactory heuristic even compared with the greedy algorithm. Our tentative results already demonstrate that in realistic problems, the greedy algorithm is not optimal, which is not surprising. What may be surprising, is that a very simple heuristic algorithm outperforms it on a problem with realistic characteristics.
References
- Ahern (2017) Ahern, K. R., 2017. Information networks: Evidence from illegal insider trading tips. Journal of Financial Economics 125 (1), 26–47.
- Baltakienė et al. (2022) Baltakienė, M., Baltakys, K., Kanniainen, J., 2022. Trade synchronization and social ties in stock markets. EPJ Data Science 11 (1), 54.
- Baltakys et al. (2023) Baltakys, K., Baltakienė, M., Heidari, N., Iosifidis, A., Kanniainen, J., 2023. Predicting the trading behavior of socially connected investors: Graph neural network approach with implications to market surveillance. Expert Systems with Applications 228, 120285.
- Berkman et al. (2020) Berkman, H., Koch, P., Westerholm, P. J., 2020. Inside the director network: When directors trade or hold inside, interlock, and unconnected stocks. Journal of Banking & Finance 118, 105892.
- Chen et al. (2012) Chen, D., Lü, L., Shang, M.-S., Zhang, Y.-C., Zhou, T., 2012. Identifying influential nodes in complex networks. Physica a: Statistical mechanics and its applications 391 (4), 1777–1787.
- Gallos et al. (2007) Gallos, L. K., Liljeros, F., Argyrakis, P., Bunde, A., Havlin, S., 2007. Improving immunization strategies. Physical Review E 75 (4), 045104.
- Goldenberg et al. (2001) Goldenberg, J., Libai, B., Muller, E., 2001. Talk of the network: A complex systems look at the underlying process of word-of-mouth. Marketing letters 12 (3), 211–223.
- Kempe et al. (2003) Kempe, D., Kleinberg, J., Tardos, É., 2003. Maximizing the spread of influence through a social network. In: Proceedings of the ninth ACM SIGKDD international conference on Knowledge discovery and data mining. pp. 137–146.
- Kitsak et al. (2010) Kitsak, M., Gallos, L. K., Havlin, S., Liljeros, F., Muchnik, L., Stanley, H. E., Makse, H. A., 2010. Identification of influential spreaders in complex networks. Nature physics 6 (11), 888–893.
- Li et al. (2018) Li, Y., Fan, J., Wang, Y., Tan, K.-L., 2018. Influence maximization on social graphs: A survey. IEEE Transactions on Knowledge and Data Engineering 30 (10), 1852–1872.
- Lü et al. (2016) Lü, L., Chen, D., Ren, X.-L., Zhang, Q.-M., Zhang, Y.-C., Zhou, T., 2016. Vital nodes identification in complex networks. Physics reports 650, 1–63.
- Morone and Makse (2015) Morone, F., Makse, H. A., 2015. Influence maximization in complex networks through optimal percolation. Nature 524 (7563), 65–68.
- Nowzari et al. (2016) Nowzari, C., Preciado, V. M., Pappas, G. J., 2016. Analysis and control of epidemics: A survey of spreading processes on complex networks. IEEE Control Systems Magazine 36 (1), 26–46.
- Pastor-Satorras and Vespignani (2002) Pastor-Satorras, R., Vespignani, A., 2002. Immunization of complex networks. Physical review E 65 (3), 036104.
- Prieto Curiel and González Ramírez (2021) Prieto Curiel, R., González Ramírez, H., 2021. Vaccination strategies against covid-19 and the diffusion of anti-vaccination views. Scientific Reports 11 (1), 6626.
- Shakarian et al. (2015) Shakarian, P., Bhatnagar, A., Aleali, A., Shaabani, E., Guo, R., Shakarian, P., Bhatnagar, A., Aleali, A., Shaabani, E., Guo, R., 2015. The independent cascade and linear threshold models. Diffusion in Social Networks, 35–48.
- Sharma et al. (2019) Sharma, K., Qian, F., Jiang, H., Ruchansky, N., Zhang, M., Liu, Y., 2019. Combating fake news: A survey on identification and mitigation techniques. ACM Transactions on Intelligent Systems and Technology (TIST) 10 (3), 1–42.