[1]\fnmQuan \surQi
1]\orgdivSchool of Information Science and Technology, \orgnameShihezi University, \orgaddress \cityShihezi, \postcode832000, \stateXinjiang, \countryChina
Edge-Enabled Anomaly Detection and Information Completion for Social Network Knowledge Graphs
Abstract
In the rapidly advancing information era, various human behaviors are being precisely recorded in the form of data, including identity information, criminal records, and communication data. Law enforcement agencies can effectively maintain social security and precisely combat criminal activities by analyzing the aforementioned data. In comparison to traditional data analysis methods, deep learning models, relying on the robust computational power in cloud centers, exhibit higher accuracy in extracting data features and inferring data. However, within the architecture of cloud centers, the transmission of data from end devices introduces significant latency, hindering real-time inference of data. Furthermore, low-latency edge computing architectures face limitations in direct deployment due to relatively weak computing and storage capacities of nodes. To address these challenges, a lightweight distributed knowledge graph completion architecture is proposed. Firstly, we introduce a lightweight distributed knowledge graph completion architecture that utilizes knowledge graph embedding for data analysis. Subsequently, to filter out substandard data, a personnel data quality assessment method named PDQA is proposed. Lastly, we present a model pruning algorithm that significantly reduces the model size while maximizing performance, enabling lightweight deployment. In experiments, we compare the effects of 11 advanced models on completing the knowledge graph of public security personnel information. The results indicate that the RotatE model outperforms other models significantly in knowledge graph completion, with the pruned model size reduced by 70%, and hits@10 reaching 86.97%.
keywords:
Social network knowledge graph; Knowledge graph embedding (KGE); Information completion; Public safety; Edge computing1 Introduction
Law enforcement agencies have consistently utilized data analysis to aid in daily management and investigative processes, particularly achieving significant advancements in the realm of public safety [1]. Properly storing and easily accessing data can enhance individual analytical, judgment, and decision-making capabilities [2]. However, events related to collective security still necessitate law enforcement agencies to have a clear understanding of the social relations within the community.
In the early stages, information processing technologies were not sufficiently advanced, resulting in highly fragmented individual information. Law enforcement agencies lacked in-depth analysis of social relations among individuals, leading to the belated perception of many potential correlations only after risks or incidents occurred. This reliance on experienced law enforcement personnel and manual intervention for extensive data matching became prevalent. However, with the rapid development of big data, artificial intelligence technologies, and hardware computing capabilities, delving into and analyzing social relations has become an essential means for proactively predicting and managing collective security events [3].
Knowledge graphs, as a graphical knowledge representation technology describing entities, relations, and facts, are frequently employed in the analysis of interpersonal relations. They constitute a semi-structured data model composed of a set of entities and the relations among them. The structure of Knowledge graphs is typically built upon ontologies, aiming to present the semantics and associations of information, facilitating machines in better understanding and reasoning about this information. Knowledge graphs can be utilized to represent individuals, organizations, groups, or concepts in social networks, elucidating the relations between them. This aids in the discovery of potential influencers, information propagation paths, and group structures within social networks.
Most artificial intelligence models employed for exploring social relations in public safety heavily rely on traditional cloud-centric architectures. In a cloud-centric framework, all data needs to be uploaded to remote servers for processing, potentially raising concerns about data privacy insecurity. If these servers are subjected to hacking attempts, there is a risk of personal information leakage. Additionally, this approach introduces certain delays and consumes a significant amount of network bandwidth [4]. However, edge computing involves processing data and computations close to the data source, resulting in faster data processing and lower latency. In the realm of public safety, edge computing primarily processes data on the devices generating the data, rather than transmitting all data to the cloud. Retaining data locally can significantly mitigate the risk of data leaks and enhance privacy security in the field of public safety.
This study aims to uncover latent information within social relations and present complex individual data networks in a user-friendly visual format. Through edge deployment, real-time processing and data privacy are ensured [5]. Leveraging the mined data for anomaly detection and information completion are crucial for law enforcement agencies to achieve efficient social management and identify potential risks. This paper applies a knowledge graph-based social network analysis method within the context of public safety, utilizing an edge architecture. The primary contributions of this paper are summarized as follows:
-
•
Through a three-step process involving ontology construction, information extraction, and knowledge fusion, data is transformed into structured knowledge. This transformation enables key information to be accurately and rapidly retrieved.
-
•
Leveraging KGE technology, this study aims to infer missing knowledge within existing data, identify erroneous information, and perform anomaly detection and completion on the current dataset.
-
•
The optimal model, determined through comparative analysis, was subjected to model pruning using the proposed pruning algorithm in this paper. This led to a 70% reduction in the model size. After fine-tuning, the HITS@10 metric only experienced a marginal decrease of 2 percentage points.
-
•
Integrating edge computing technology, the pruned model is deployed on edge devices. Processing data at the edge ensures real-time capabilities while, to a certain extent, safeguarding data privacy and security.
Remaining sections of the paper are outlined as follows. Section 2 provides a detailed exposition of related work. Section 3 introduces the 11 models employed in the study. In Section 4, data processing, ontology construction, and data fusion are conducted, presenting a novel data quality assessment method named PDQA and a model pruning approach. Section 5 conducts comparative experiments on the graph constructed in the previous section using the 11 advanced models, selecting the best-performing model for pruning, deployment on edge devices, and presenting experimental results. Section 6 offers a concluding summary of the paper.
2 Related Work
2.1 Social Network Knowledge Graph
Social network knowledge graphs are employed to describe, represent, and analyze entities and relations within social networks. They utilize graph structures to visualize and structure various entities in social networks along with their interconnections. Presently, numerous scholars both domestically and internationally have delved into the potential value of social networks.
Social network analysis technology, as a scientific method for studying society, has played a significant role in advancing intelligent law enforcement and public safety [6]. Initially, the field primarily focused on the analysis of network quantities and visual representation. Bourmpoulias et al. [7] explored the visualization of knowledge graph associations and personal information. Huang et al. [8] conducted a comprehensive analysis of public safety events and developed a visualization system to assist law enforcement agencies in understanding cases. Zhu et al. [9] utilized a label propagation algorithm to aid in training edge weights of knowledge graphs, creating a predictive method for law enforcement cases. They improved traditional convolutional neural networks into multi-channel networks to adapt to various case features. He et al. [10] proposed a method for de-anonymization and privacy inference based on knowledge graphs, demonstrating its effectiveness on real social network data. Almoqbel et al. [11] used neural network models to analyze social networks of terrorist organizations, showcasing strong capabilities in predicting terrorist events.
2.2 Public Safety System Under Edge Architecture
Current public safety systems are typically built on cloud computing models. However, as the scale expands, they face challenges in real-time data processing. Consequently, public safety systems based on edge computing are gradually becoming a mainstream approach. Edge computing is a distributed computing paradigm that utilizes network technology to shift computing tasks and data storage from the cloud to the network’s edge [12].
The public safety domain leverages various types of edge big data, including government and media datasets, physical spatial data collected by sensors, cyberspace data, and text data containing personal information. Evangelos et al. [13] explored trends, demands, and technologies for public safety in smart cities under the concept of edge computing, proposing an edge computing platform called DECIoT. Ugli et al. [14] introduced a novel cognitive video surveillance management framework with a Long Short-Term Memory (LSTM) model. The aim is to reduce standby GPU memory usage through model offloading, saving memory resources. Walczak et al. [15] gathered information about individuals with mobility issues using IoT devices to address safety concerns for residents. Zhang et al. [16] proposed an IoT access control scheme based on permissioned blockchain and edge computing, leveraging the advantages of both technologies. This approach involves conducting user identity authentication at the edge, which helps reduce latency and response times, while ensuring security and reliability. Xu et al. [17] deployed deep learning models to edge devices to meet their computational needs while ensuring low latency. Finding effective optimization methods for deploying public safety models at the edge is of great significance.
Despite the favorable outcomes achieved by existing methods, they have not fully exploited the connections and influences between relations, resulting in some semantic information gaps. Additionally, these methods incur significant computational and storage resource overheads, making deployment on edge devices impractical. Therefore, this paper adopts a knowledge graph-based social network analysis approach applied to the public safety domain. This method integrates KGE technology to infer and discover missing knowledge within existing data, identify erroneous information, and perform error detection and enhancement on existing information to improve its accuracy. Furthermore, the model undergoes pruning and compression to make it lightweight. This significantly reduces the model’s demands on computational and storage resources, enabling deployment on edge devices.
3 Preliminary Knowledge
In this paper, we employed 11 advanced models for comparison to select the most suitable model for personnel information data in the field of public safety. These models include TransE, TransR, AutoSF, DistMult, ComplEx, HolE, KG2E, RotatE, PairRE, RGCN, and TuckER.
The TransE model [18] is based on the distributed vector representation of entities and relations. It continuously adjusts vectors to make the sum of the head entity vector and the relation vector as close as possible to the tail entity vector. The TransR model [19], built upon TransE, projects entities from the entity space to the corresponding relation space. It then establishes connections between projected entities to learn embeddings. The AutoSF model [20] automatically designs SFs for different knowledge graphs. It introduces a greedy search algorithm to enhance algorithm speed through filters and predictors.
The DistMult model [21] utilizes a product-form scoring function to measure semantic correlations between entities and relations. The ComplEx model [22] extends DistMult into complex space to better model asymmetric and reversible relations. The HolE model [23] uses circular correlation operations instead of the matrix product of relation matrices. The KG2E model [24] uses a Gaussian distribution instead of vectors for KGE, limiting the covariance matrix of the distribution to a diagonal matrix to measure similarity. The RotatE model [25] defines each relation as a rotation in complex vector space and proposes a self-adversarial negative sampling technique.
The PairRE model [26] uses two vectors for relation representation, projecting head and tail entities into Euclidean space to minimize the distance of the projection vectors. The RGCN model [27] mimics Graph Convolutional Network (GCN), defining node representations. It is designed with different classifiers, encoders, and decoders to flexibly handle various types of graph data. The TuckER model [28] can decompose a three-way tensor into a matrix obtained by multiplying each dimension of the core tensor by a matrix, fully representing true triples on the entity set E and relation set R.
4 Proposed Methodology
4.1 Data Source and Ontology Construction
This paper is based on information provided by a municipal public security bureau and constructs a personnel relation dataset, including individual profiles, interpersonal relations, and employment details, among other aspects.
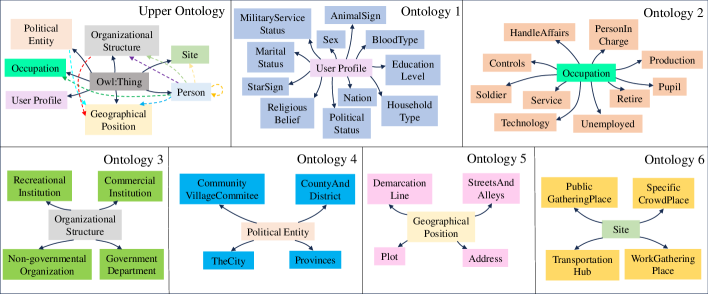
Firstly, following the classification of data information and business logic, the knowledge graph’s ontology is constructed. By considering relevant factual concepts, an abstract model consistent with the business logic is established. In this model, information such as individuals, occupations, and locations is explicitly defined as entities. Fig. 1 illustrates the ontology structure of the knowledge graph construction.
4.2 Information Extraction and Knowledge Fusion
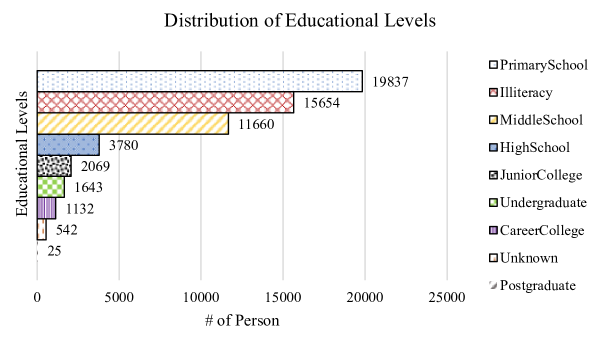
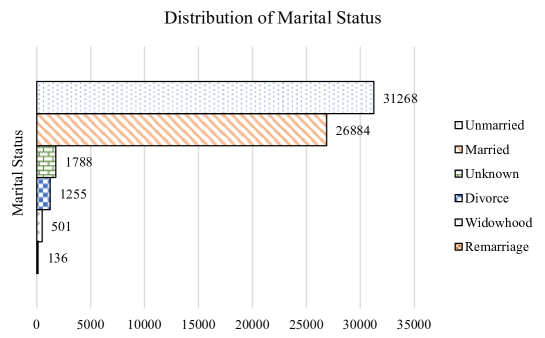
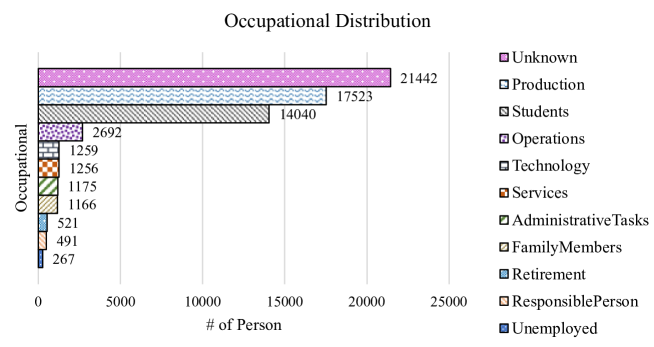
Based on the previously identified entities and relations, we conduct data cleaning on the disorganized dataset. This process includes deduplication, handling missing values, addressing anomalies, and data normalization. We utilize Pandas for dataframe operations, employ regular expressions for text matching and processing, and adopt the PDQA method proposed in this paper to identify anomalies and missing values, subsequently correcting the abnormal data through manual intervention. The data entries subjected to these processes are systematically classified and merged. Ultimately, we identify eleven distinct occupations, ten different education levels, and six marital statuses. Fig. 2 illustrates the distribution of education levels, clearly showing a significant decrease in population with higher education levels. Fig. 3 presents the distribution of marital statuses, indicating that the majority of individuals are either married for the first time or unmarried, showing a similar distribution pattern. Fig. 4 displays the distribution of occupations, with the ”Unknown” category having the highest count.
Knowledge fusion involves integrating knowledge from diverse sources and domains into a unified representation. In this study, we conducted knowledge fusion on multi-source data using information such as names, phone numbers, and family relations. This process involved matching entities from different knowledge graphs or data sources to consider them as the same entity, ensuring the uniqueness of entity names for the same concept. The result produced a dataset consisting of 997,956 triples, which will be used in subsequent experiments involving KGE.
4.3 Knowledge Graph Visualization
By using Py2Neo to input the triples into the Neo4j graph database, data visualization has been achieved, preparing for subsequent inferential computations. Neo4j is a graph database that stores data in a graph structure and offers efficient graph algorithms for data processing. Py2Neo is a library for Python that interfaces with the Neo4j graph database, providing a convenient interface to make working with Neo4j in Python easier. This knowledge graph comprises entities, relations, and attributes. Entities are represented as nodes, with a total count of 61,857, while relations are represented as edges, totaling 140,219. Additionally, there are 87,632 attributes, and their specific types are detailed in Table 1.
| Category | Quantity | Introduction |
| Entities (Nodes) | 61857 | Individuals, Occupations, Locations, etc. |
| Relations (Edges) | 140219 | Familial Relations, Occupational Connections, etc. |
| Attributes | 87632 | Age, Height, Weight, Blood Type, etc. |
| Labels | 83 | Gender, Educational Level, Political Affiliation, Marital Status. |
4.4 Evaluation Methods
4.4.1 Algorithm Performance Evaluation Method
After the completion of the construction of the personnel information knowledge graph, it is necessary to complete the information through KGE. In KGE algorithms, the performance of these algorithms is typically evaluated using the following set of evaluation metrics:
(1) HITS@N: HITS@N refers to the proportion of correct answers ranked within the top K positions in a ranking task [29]. For instance, in a ranking task with 10 samples, if the ranks of the 5 correct answers are 1, 2, 3, 4, and 5, then when N=5, the value of HITS@N is 5/5=1; when N=6, HITS@N is 5/6=0.83. The mathematical expression is as follows:
| (1) |
In this context, where represents the number of samples, and signifies the ranking of the sample, [ ] denotes an indicator function for conditional evaluation (with a value of 1 if the condition is true, and 0 otherwise). A higher HITS@N value indicates better algorithm performance.
(2) AMRI (Adjusted Arithmetic Mean Rank Index): Introduced by Berrendorf, he pointed out that MR and HITS@N increase proportionally with the reduction of the test set size [30]. Similarly, MRR and HITS@N also exhibit high homogeneity. Therefore, he proposed a new evaluation metric called AMRI. The mathematical expression is as follows:
| (2) |
In this context, where denotes the number of samples, represents the ranking of the sample, and signifies the score assigned to the sample.
The AMRI metric ranges from -1 to 1, with values closer to 1 indicating better model performance and values less than 0 suggesting that the model performs worse than random scoring.
(3) Standard Deviation: The standard deviation of rankings [31]. The mathematical expression is as follows:
| (3) |
In this context, where denotes the number of samples, represents the ranking of the sample, and represents the average ranking of the samples.
(4) Time: This includes both training time and prediction time, measured in seconds. The training and prediction times can reflect the deployment cost and practical value of the model, preparing for the model’s application and deployment.
4.4.2 Data Evaluation Method PDQA
To detect existing anomalous data and reduce the cost of manual screening, this paper introduces a data quality assessment method called PDQA. The algorithm aims to assess the quality of existing data while also verifying the compliance of future input data. The structure of PDQA is depicted in Fig. 5.
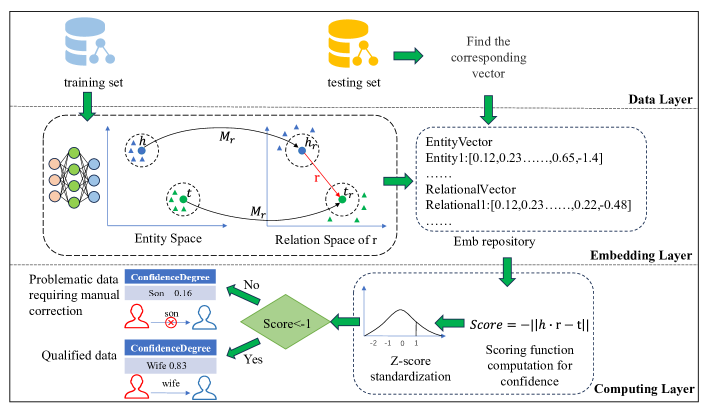
In the PDQA algorithm, the training data undergoes training with the KGE model to obtain corresponding embedding vector representations. Subsequently, for the test data and simulated error data, we query the respective vector representations. The model’s corresponding scoring function is used to evaluate the confidence of these vectors. Finally, standardization is performed using the . Compared to Min-Max normalization, normalization is more robust to outliers. It uses the mean and standard deviation, not influenced by the maximum and minimum values, making it more suitable for handling data with outliers. Compared to Decimal Scaling normalization, normalization better preserves the distribution shape of the data, as it is based on the mean and standard deviation, preserving the original distribution characteristics of the data. In contrast, Decimal Scaling simply divides by a fixed value. Therefore, we choose for standardization here. After standardization, data with values less than -1 are considered problematic and should be reported for further investigation and manual confirmation. The formula for normalization is as follows:
| (4) |
In this formula, where represents the original data value, denotes the sample mean, stands for the sample standard deviation, and signifies the standardized value. The pseudocode for the PDQA evaluation method is as follows:
The PDQA algorithm allows for a comprehensive and objective assessment of data quality, enabling effective screening. Compared to traditional manual screening methods, PDQA has several advantages. Firstly, through an automated process, PDQA significantly improves screening efficiency, saving time and human resources. Secondly, the use of standardized evaluation metrics in the PDQA algorithm provides more accurate and reliable data quality assessments, avoiding the influence of subjective factors. Additionally, the PDQA algorithm is capable of efficiently screening large-scale data, enhancing the ability and speed of data processing. Lastly, PDQA can help establish a standardized management system for data quality, strengthening data governance capabilities and thereby elevating the overall level of data management.
4.5 Model Pruning Algorithm
In the model pruning algorithm proposed in this paper, the process begins by loading the pre-trained model. Subsequently, the sensitivity of each parameter is computed using the validation set, where sensitivity is measured by the gradient of the parameters [32]. A larger absolute gradient indicates a greater impact of the parameter on the model’s performance. A sensitivity threshold is set based on the percentile of the gradient metric, and parameters with sensitivities below this threshold are set to zero. Finally, the pruned model undergoes fine-tuning to enhance its performance after pruning. The pseudocode for the model pruning algorithm is as follows:
The core idea of the model pruning algorithm proposed in this paper is to leverage sensitivity information of parameters. By removing parameters with relatively minor impact on the model, the complexity of the model is reduced while attempting to preserve its predictive performance. This approach, compared to straightforwardly truncating parameter values, gives more consideration to the contribution of parameters to the overall performance of the model. As a result, it can perform pruning in a more intelligent manner to some extent.
5 Experiment and Analysis
5.1 Experiment Overview
In this paper, experiments are conducted using the constructed personnel information knowledge graph. This graph includes a subset of social network relations, basic personal information, employment details, and other fundamental features. The goal is to predict and complement missing information. Additionally, the method proposed in this paper also detects relations that should not exist, specifically those with excessively low confidence, as part of the data anomaly detection process. The schematic diagram of the information completion and detection process is illustrated in Fig. 6.
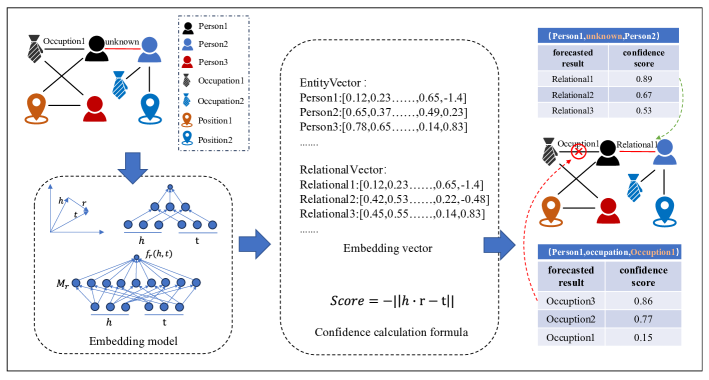
In Fig. 6, by embedding entities in the personnel information knowledge graph to obtain their vector representations, we subsequently trained the model on a large number of triple relation vectors. The resulting model can be used to infer the confidence level of relations between two entities. A high confidence level indicates a higher probability of the existence of a relation between these two entities.
5.2 Experimental Environment and Configuration
This paper implemented the model using the DGL-KE toolkit based on the PyTorch framework [33]. The toolkit supports both GPU and CPU parallel computation and facilitates training on large-scale graphs through partitioning, making it suitable for subsequent deployment and use. In the experiments, the input to the network consisted of triplets representing social networks, basic information, and job-related details. The dataset was split into training, validation, and test sets in a ratio of 8:1:1. The training set comprised 798,364 triplets, while the validation and test sets each contained 99,796 triplets. The training set was used for model training, the validation set for selecting the best model hyperparameters, and the test set for evaluating model performance.
This paper compares and analyzes eleven models mentioned in Preliminary Knowledge: TransE, TransR, AutoSF, ComplEx, DistMult, HolE, KG2E, PairRE, RGCN, RotatE and TuckER. During the training process, this paper conducts numerous parameter tuning experiments and ultimately determines the following parameters: the dimensions of the embedding vectors for entities and relations are set to 400, the number of negative samples is 50, the learning rate is set to 0.001, and the optimizer used is Adam. Additionally, an L2 regularization coefficient of 0.01 was applied. The training was conducted for 100 epochs, and early stopping was employed to prevent overfitting. Each training batch consisted of 5000 samples, and this training was performed on the aforementioned knowledge graph of interpersonal relations. For the evaluation phase, we assessed the model performance by calculating the rank of each test triplet, where a lower rank indicates better predictive performance. Four categories of metrics were utilized to evaluate the models: Time, AMRI, Standard Deviation, and HITS@N, with N values set at 1, 5, and 10.
The edge device used for deployment is the Jetson Nano. The model is deployed locally, utilizing edge computing to process and analyze data near the collection point. This approach eliminates the need to transmit sensitive data to remote servers, reducing the risk of interception or leakage during the data transfer process. The configuration of Jetson Nano is is presented in Table 2.
| Development Environment | CPU | GPU | RAM |
| Python=3.7 C++,CMake | 64-bit quad-core ARM A57 | 128-core NVIDIA Maxwell | 4GB 64-bit LPDDR4 25.6GB/s |
Before being stored, personal identity information undergoes anonymization and de-identification processes. This involves replacing key information with numerical IDs to ensure privacy protection while still enabling effective analysis. Edge devices retain local copies of the data, reducing the need for frequent data requests to central servers and thereby lowering the risk of data exposure [34].
5.3 Model Comparison Results
The post-training results are presented in the Table 3. Analyzing the experimental results yields the following observations:
| Model | Training Time | Evaluation Time | AMRI | HITS@1 | HITS@5 | HITS@10 | Standard Deviation |
| AutoSF | 7401.46 | 886.92 | 97.07 | 4.84 | 12.15 | 16.34 | 4268.85 |
| ComplEX | 3781.66 | 272.82 | 97.22 | 17.41 | 24.94 | 27.91 | 3916.36 |
| DistMult | 1326.91 | 185.95 | 98.97 | 39.35 | 64.97 | 73.92 | 3837.18 |
| HolE | 4618.70 | 454.28 | 97.57 | 9.34 | 24.98 | 37.22 | 4937.57 |
| KG2E | 2443.01 | 658.22 | 94.33 | 14.29 | 46.27 | 55.50 | 8198.36 |
| PairRE | 2431.77 | 239.80 | 99.60 | 23.32 | 54.46 | 65.96 | 1062.17 |
| RGCN | 274649.04 | 84.14 | 99.64 | 13.29 | 40.35 | 53.31 | 895.32 |
| RotatE | 6094.38 | 245.88 | 99.80 | 40.20 | 71.83 | 80.68 | 1271.88 |
| TransE | 1265.07 | 141.38 | 99.60 | 0.01 | 56.33 | 66.78 | 1272.58 |
| TransR | 3928.77 | 264.77 | 97.84 | 9.0989 | 30.60 | 41.10 | 2704.65 |
| TuckER | 16731.63 | 778.16 | 82.69 | 0.1144 | 1.170 | 2.160 | 11966.31 |
(1) Regarding training and evaluation times, TransE exhibits the best performance, followed by DistMult, while RGCN and AutoSF require the most time.
(2) Concerning the AMRI metric, RotatE and RGCN perform relatively well, with TuckER having the lowest performance at 82.69%, while other models achieve over 90%.
(3) In terms of the Hits@1 metric, TransE and DistMult show subpar performance, while HolE performs well, and RotatE stands out as the top performer.
(4) As for Hits@5 and Hits@10 metrics, DistMult and RotatE demonstrate the best performance, while other models exhibit more moderate results.
(5) PairRE doesn’t achieve the best performance among all models, but it exhibits a smaller standard deviation, indicating its stable results.
In summary, the RotatE algorithm outperforms other models on these three metrics, but its training and evaluation times are relatively long, requiring a trade-off between performance and time. DistMult and RGCN also demonstrate good results and can be considered as alternative solutions. Additionally, PairRE exhibits good stability. To balance model performance with lower training costs, we chose the RotatE model as the embedding vector generation method. Using a randomized tuning approach, optimal parameters were obtained after 100 iterations on this dataset. We selected an embedding dimension of 976, employed the Adam optimizer with a learning rate of 0.001, and set the batch size to 4096. During the negative sampling phase, we used the Basic negative sampler, generating 8 negative samples for each positive example. The detailed results of parameter tuning can be found in Table 4.
| Model | Training Time | Evaluation Time | AMRI | HITS@1 | HITS@5 | HITS@10 | Standard Deviation |
| Basic Parameters | 6094.38 | 245.88 | 99.80 | 40.20 | 71.83 | 80.68 | 1271.88 |
| After Tuning | 3594.57 | 550.18 | 99.87 | 59.35 | 83.83 | 88.87 | 1148.50 |
The experimental results indicate that our proposed approach, combining social network data and utilizing the RotatE model for data completion and detection, is practically feasible.
5.4 Model Pruning
Utilizing the model pruning algorithm to reduce the model parameters for lightweight processing. During the pruning process, a threshold is calculated based on the pruning rate, and weights with absolute values smaller than this threshold are set to zero. The pruning rate is determined through an experimental process involving parameter tuning by enumeration. Subsequently, the pruned sparse model undergoes fine-tuning. The experimental results are shown in Table 5.
| Pruning ratio | Parameters/M | Model storage volume/MB | FLOPs/G | HITS@10 |
| 0 | 72.42 | 231.64 | 10.13 | 88.87 |
| 30% | 47.63 | 136.37 | 7.24 | 70.34 |
| 50% | 20.12 | 100.23 | 4.15 | 60.19 |
| 55% | 16.73 | 83.42 | 3.86 | 50.85 |
| 60% | 11.57 | 75.98 | 3.21 | 45.34 |
| 67% | 10.23 | 70.21 | 2.98 | 43.13 |
In the initial stage of pruning, the model contains a large number of redundant parameters [35]. After pruning, many redundant parameters are removed, significantly reducing computational complexity and model storage size. As the pruning ratio increases, more redundant parameters are gradually removed, but the reduction in the number of parameters and model size weakens. When the pruning ratio reaches 67% and the storage volume decreases by 70%, the accuracy of the pruned model sharply decreases. This drop is much more significant than the previous decrease, indicating that the pruning ratio is approaching its maximum limit. Further pruning may lead to a significant reduction in model accuracy, and even with subsequent fine-tuning, it may be challenging to fully recover the model performance.
5.5 Model Fine-Tuning Results
To compensate for the loss in model performance, it is necessary to fine-tune the pruned model [36]. During the fine-tuning process, parameter settings are typically consistent with regular training, with the only exception being the epoch number set to 300 to thoroughly train the model and restore its accuracy. Given the representative nature of the HITS series metrics, especially HITS@10, which more accurately reflects relevant effects, HITS@10 is chosen as the metric for evaluating the model’s performance. Table 6 presents a comparison of the model performance before and after fine-tuning.
| Pruning ratio | Pruning-HITS@10 | Fine-tuning-HITS@10 |
| 0 | - | 88.87 |
| 30% | 70.34 | 87.94 |
| 50% | 60.19 | 87.44 |
| 55% | 50.85 | 87.12 |
| 60% | 45.34 | 87.01 |
| 67% | 43.13 | 86.97 |
From Table 6, it can be observed that when the pruning ratio is relatively low, the model usually can recover to its original accuracy after fine-tuning. However, at this stage, the model still retains a relatively large number of parameters and FLOPs. As the pruning ratio enters the higher range, accuracy begins to decline due to significant information loss in the model.
Based on the above analysis, this paper chooses to deploy the model with a pruning ratio of 67%, which reduces the storage size by 70%, to the edge device. At this point, the model’s parameters, FLOPs, and storage size are reduced to 10.23M, 2.98G, and 70.21MB, respectively. The Hits@10 reaches 86.97, close to the training accuracy of the unpruned model. This indicates the effectiveness of the model pruning algorithm. While maintaining model accuracy, it significantly reduces the computational load, the number of parameters, and the model storage size [37]. The pruned model is more streamlined, consuming fewer hardware resources during runtime, making it well-suited for deployment on resource-constrained embedded devices for information completion tasks [38].
6 Conclusion
This paper addresses the challenges in handling personnel data in the field of public safety and proposes recommendations for integrating a social network knowledge graph. Building upon existing domestic and international research on interpersonal relations, the paper creates a knowledge graph dataset of personnel relation information. Utilizing this dataset to predict residents’ occupational fields and job roles, the results indicate that the personnel relation knowledge graph can effectively assist law enforcement agencies in anomaly detection and data completion. The RotatE model performs well in this task and is further enhanced through model pruning and deployment on the edge device Jetson Nano, improving the timeliness of model processing and data privacy protection. Future research directions may involve integrating relevant datasets and more comprehensive semantic information to enhance prediction accuracy. Exploring hidden relations in social networks through knowledge graphs remains a promising area of investigation.
Declarations
Data Availability Statements Due to the confidentiality of this research project, participants of this study did not agree for their data to be shared publicly, so supporting data is not available.
References
- \bibcommenthead
- Van Puyvelde et al. [2017] Van Puyvelde, D., Coulthart, S., Hossain, M.S.: Beyond the buzzword: big data and national security decision-making. International Affairs 93(2), 1397–1416 (2017)
- Jie and Xianfeng [2022] Jie, H., Xianfeng, Z.: Risk assessment of regional violent terrorist attacks in southern xinjiang. China Safety Science Journal 32(2), 192 (2022)
- Li et al. [2022] Li, Z., Xu, X., Hang, T., Xiang, H., Cui, Y., Qi, L., Zhou, X.: A knowledge-driven anomaly detection framework for social production system. IEEE Transactions on Computational Social Systems (2022)
- Ranaweera et al. [2021] Ranaweera, P., Jurcut, A.D., Liyanage, M.: Survey on multi-access edge computing security and privacy. IEEE Communications Surveys & Tutorials 23(2), 1078–1124 (2021)
- Yang et al. [2022] Yang, C., Xu, X., Zhou, X., Qi, L.: Deep q network–driven task offloading for efficient multimedia data analysis in edge computing–assisted iov. ACM Transactions on Multimedia Computing, Communications, and Applications (TOMM) 18(2), 1–24 (2022)
- Xu et al. [2022] Xu, X., Li, H., Li, Z., Zhou, X.: Safe: Synergic data filtering for federated learning in cloud-edge computing. IEEE Transactions on Industrial Informatics 19(2), 1655–1665 (2022)
- Bourmpoulias et al. [2023] Bourmpoulias, S., Zeginis, D., Tarabanis, K.: An entity event knowledge graph for human resources management in public administration: the case of education personnel. 2023 IEEE 25th Conference on Business Informatics (CBI), 1–8 (2023)
- Y et al. [2020] Y, H., P, Y., G, Z.: Construction of public safety knowledge graphs. International Conference on Computer, Information and Telecommunication Systems (CITS) (2020)
- Zhu [2023] Zhu, H.: A graph neural network-enhanced knowledge graph framework for intelligent analysis of policing cases. Mathematical Biosciences and Engineering 20(7), 11585–11604 (2023)
- He et al. [2020] He, Q., Yang, J., Shi, B.: Constructing knowledge graph for social networks in a deep and holistic way. Companion Proceedings of the Web Conference 2020, 307–308 (2020)
- Almoqbel and Xu [2019] Almoqbel, M., Xu, S.: Computational mining of social media to curb terrorism. ACM Computing Surveys (CSUR) 52(5), 1–25 (2019)
- Xu et al. [2023] Xu, X., Tang, S., Qi, L., Zhou, X., Dai, F., Dou, W.: Cnn partitioning and offloading for vehicular edge networks in web3. IEEE Communications Magazine (2023)
- Maltezos et al. [2021] Maltezos, E., Karagiannidis, L., Dadoukis, A., Petousakis, K., Misichroni, F., Ouzounoglou, E., Gounaridis, L., Gounaridis, D., Kouloumentas, C., Amditis, A.: Public safety in smart cities under the edge computing concept. 2021 IEEE international mediterranean conference on communications and networking (MeditCom), 88–93 (2021)
- Ugli et al. [2023] Ugli, D.B.R., Kim, J., Mohammed, A.F., Lee, J.: Cognitive video surveillance management in hierarchical edge computing system with long short-term memory model. Sensors 23(5), 2869 (2023)
- Walczak et al. [2023] Walczak, R., Koszewski, K., Olszewski, R., Ejsmont, K., Kálmán, A.: Acceptance of iot edge-computing-based sensors in smart cities for universal design purposes. Energies 16(3), 1024 (2023)
- Zhang et al. [2023] Zhang, L., Li, B., Fang, H., Zhang, G., Liu, C.: An internet of things access control scheme based on permissioned blockchain and edge computing. Applied Sciences 13(7), 4167 (2023)
- Xu et al. [2022] Xu, X., Fei, Y., Zhou, X., Li, X., Cheng, Y., Qi, L., Dou, W.: Non-cooperative game for edge server placement in wireless body area network. 2022 IEEE Intl Conf on Parallel & Distributed Processing with Applications, Big Data & Cloud Computing, Sustainable Computing & Communications, Social Computing & Networking (ISPA/BDCloud/SocialCom/SustainCom), 605–612 (2022). IEEE
- Bordes et al. [2013] Bordes, A., Usunier, N., Garcia-Duran, A., Weston, J., Yakhnenko, O.: Translating embeddings for modeling multi-relational data. Advances in neural information processing systems 26 (2013)
- Lin et al. [2015] Lin, Y., Liu, Z., Sun, M., Liu, Y., Zhu, X.: Learning entity and relation embeddings for knowledge graph completion. Proceedings of the AAAI conference on artificial intelligence 29(1) (2015)
- Zhang et al. [2020] Zhang, Y., Yao, Q., Dai, W., Chen, L.: Autosf: Searching scoring functions for knowledge graph embedding. 2020 IEEE 36th International Conference on Data Engineering (ICDE), 433–444 (2020)
- Yang et al. [2015] Yang, B., Yih, S.W.-t., He, X., Gao, J., Deng, L.: Embedding entities and relations for learning and inference in knowledge bases. Proceedings of the International Conference on Learning Representations (ICLR) 2015 (2015)
- Trouillon et al. [2016] Trouillon, T., Welbl, J., Riedel, S., Gaussier, É., Bouchard, G.: Complex embeddings for simple link prediction. International conference on machine learning, 2071–2080 (2016)
- Nickel et al. [2016] Nickel, M., Rosasco, L., Poggio, T.: Holographic embeddings of knowledge graphs. Proceedings of the AAAI conference on artificial intelligence 30(1) (2016)
- He et al. [2015] He, S., Liu, K., Ji, G., Zhao, J.: Learning to represent knowledge graphs with gaussian embedding. Proceedings of the 24th ACM international on conference on information and knowledge management, 623–632 (2015)
- Sun et al. [2018] Sun, Z., Deng, Z.-H., Nie, J.-Y., Tang, J.: Rotate: Knowledge graph embedding by relational rotation in complex space. International Conference on Learning Representations (2018)
- Chao et al. [2021] Chao, L., He, J., Wang, T., Chu, W.: Pairre: Knowledge graph embeddings via paired relation vectors, vol. 1, pp. 4360–4369 (2021)
- Schlichtkrull et al. [2018] Schlichtkrull, M., Kipf, T.N., Bloem, P., Van Den Berg, R., Titov, I., Welling, M.: Modeling relational data with graph convolutional networks. The Semantic Web: 15th International Conference, ESWC 2018, Heraklion, Crete, Greece, June 3–7, 2018, Proceedings 15, 593–607 (2018)
- Balazevic et al. [2019] Balazevic, I., Allen, C., Hospedales, T.: Tucker: Tensor factorization for knowledge graph completion. 2019 Conference on Empirical Methods in Natural Language Processing and 9th International Joint Conference on Natural Language Processing, 5184–5193 (2019)
- Paulheim [2017] Paulheim, H.: Knowledge graph refinement: A survey of approaches and evaluation methods. Semantic web 8(3), 489–508 (2017)
- Huang et al. [2022] Huang, H., Li, C., Peng, X., He, L., Guo, S., Peng, H., Wang, L., Li, J.: Cross-knowledge-graph entity alignment via relation prediction. Knowledge-Based Systems 240, 107813 (2022)
- Lee et al. [2015] Lee, D.K., In, J., Lee, S.: Standard deviation and standard error of the mean. Korean journal of anesthesiology 68(3), 220–223 (2015)
- Augasta and Kathirvalavakumar [2013] Augasta, M., Kathirvalavakumar, T.: Pruning algorithms of neural networks—a comparative study. Open Computer Science 3(3), 105–115 (2013)
- Zheng et al. [2020] Zheng, D., Song, X., Ma, C., Tan, Z., Ye, Z., Dong, J., Xiong, H., Zhang, Z., Karypis, G.: Dgl-ke: Training knowledge graph embeddings at scale. Proceedings of the 43rd International ACM SIGIR Conference on Research and Development in Information Retrieval, 739–748 (2020)
- Xu et al. [2022] Xu, X., Yang, C., Bilal, M., Li, W., Wang, H.: Computation offloading for energy and delay trade-offs with traffic flow prediction in edge computing-enabled iov. IEEE Transactions on Intelligent Transportation Systems (2022)
- Peng et al. [2021] Peng, H., Huang, S., Geng, T., Li, A., Jiang, W., Liu, H., Wang, S., Ding, C.: Accelerating transformer-based deep learning models on fpgas using column balanced block pruning. 2021 22nd International Symposium on Quality Electronic Design (ISQED), 142–148 (2021)
- Hoefler et al. [2021] Hoefler, T., Alistarh, D., Ben-Nun, T., Dryden, N., Peste, A.: Sparsity in deep learning: Pruning and growth for efficient inference and training in neural networks. The Journal of Machine Learning Research 22(1), 10882–11005 (2021)
- Agarwal et al. [2022] Agarwal, M., Agarwal, S., Saba: Eight pruning deep learning models for low storage and high-speed covid-19 computed tomography lung segmentation and heatmap-based lesion localization: A multicenter study using covlias 2.0. Computers in biology and medicine 146, 105571 (2022)
- Xu et al. [2022] Xu, X., Gu, J., Yan, H., Liu, W., Qi, L., Zhou, X.: Reputation-aware supplier assessment for blockchain-enabled supply chain in industry 4.0. IEEE Transactions on Industrial Informatics 19(4), 5485–5494 (2022)