Hyper-STTN: Social Group-aware Spatial-Temporal Transformer Network for Human Trajectory Prediction with Hypergraph Reasoning
Abstract
Predicting crowded intents and trajectories is crucial in varouls real-world applications, including service robots and autonomous vehicles. Understanding environmental dynamics is challenging, not only due to the complexities of modeling pair-wise spatial and temporal interactions but also the diverse influence of group-wise interactions. To decode the comprehensive pair-wise and group-wise interactions in crowded scenarios, we introduce Hyper-STTN, a Hypergraph-based Spatial-Temporal Transformer Network for crowd trajectory prediction. In Hyper-STTN, crowded group-wise correlations are constructed using a set of multi-scale hypergraphs with varying group sizes, captured through random-walk robability-based hypergraph spectral convolution. Additionally, a spatial-temporal transformer is adapted to capture pedestrians’ pair-wise latent interactions in spatial-temporal dimensions. These heterogeneous group-wise and pair-wise are then fused and aligned though a multimodal transformer network. Hyper-STTN outperformes other state-of-the-art baselines and ablation models on 5 real-world pedestrian motion datasets.
I Introduction
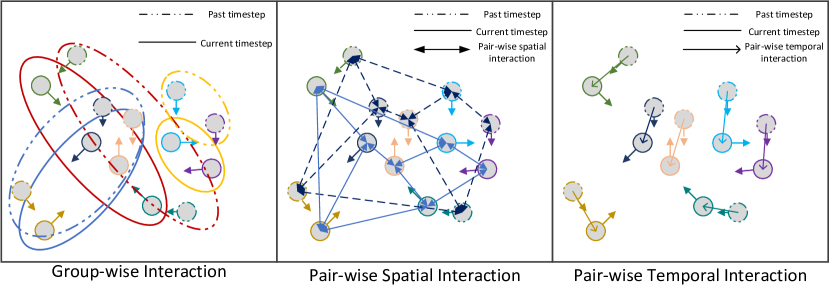
Human trajectory prediction is a pivotal area in computer vision and robotics research, focusing on predicting agents’ future movements by analyzing their past behaviors. This is vital for many real-world applications such as social robot navigation [1, 2] and smart city systems [3]. Despite its importance, forecasting human trajectories in social settings is complex due to the unpredictable nature and varied patterns of crowd movements. The challenge is intensified by the need to understand the intricate interactions and relations among different social groups, which involve complex cooperation and competitive dynamics, as shown in Fig. 1.
In general, human trajectory prediction is influenced by three factors: individual intrinsic situations, pair-wise and group-wise social interactions, and instantaneous intentions. However, these factors have often lacked high-order interaction descriptions or the ability to reason with heterogeneous features. Individual intrinsic situations exhibit correlations between an agent’s current state and temporal features, where future speed or position can often be accurately decoded from historical data as sequence reasoning processes, as demonstrated in previous work [4, 5]. Conversely, modern forecasting systems face challenges in predicting subjective intentions accurately based on limited information, using machine learning or neural network technologies [6]. Consequently, predictors need to enhance their abilities to describe and understand social latent interactions for better overall performance. This enhancement requires leveraging both group-wise embeddings and pair-wise features of crowd dynamics across spatial-temporal dimensions.
To address the aforementioned issues, current research focuses on estimating complex social influences among humans to infer the uncertainty of human movements for trajectory prediction. For instance, [5, 7, 8, 9] utilize neural networks or attention mechanisms to describe pair-wise social interactions among agents across spatial and temporal dimensions. However, the absence of a graph structure limits the further development of captured features. On the other hand, [8, 10] introduce a spatio-temporal graph to model human movements, where each spatial edge presents the interaction between two agents’ vertices, and temporal edges denotes individual temporal dependencies as intrinsic situation. More recently, [6] constructs the dynamics of pedestrian groups as a hypergraph to capture high-order group-wise interaction in crowds for trajectory forecasting. In this approach, each hyperedge can link more than two vertices for group-wise state representation.
While the state-of-the-art (SOTA) algorithms mentioned above have demonstrated outstanding performance, the insufficient inference of human-human interaction (HHI) continues to limit potential improvements, especially in complex or highly dynamic scenarios. None of the previously mentioned approaches have fully addressed HHI in both group-wise and pair-wise feature dimensions [5], nor have they effectively aligned heterogeneous multimodal dependencies [8]. For instance, the absence of group-wise interaction reasoning may overlook potential intergroup harmonization or conflict [10]. In team sports scenarios like basketball, different defensive strategies may involve distinct subgroups, such as zone defense typically including one offensive player with multiple defensive players, and man-to-man policies often involving pairs of players. Also, inadequate spatial-temporal feature inference can introduce ambiguities in HHI [6].
To address these challenges, we introduce Hyper-STTN, a hypergraph-based spatial-temporal transformer network designed to handle both pair-wise and group-wise underlying social interactions, as illustrated in Fig. 1, across spatial-temporal dimensions. The core concept behind Hyper-STTN is its utilization of an effective HHI and social interaction inference framework using multiscale hypergraphs. The main contributions of this paper can be summarized as follows:
-
•
We propose a novel human trajectory prediction framework called Hyper-STTN, which constructs crowded dynamics using a set of multiscale hypergraphs to leverage group-wise and pair-wise social interactions in both spatial and temporal dimensions.
-
•
Hyper-STTN aligns heterogeneous features and interactions using a multi-modal transformer network to avoid confusion in interpretations.
-
•
Hyper-STTN demonstrates outstanding performance compared with other existing SOTA approaches on publicly available pedestrian trajectory datasets.
II Background
II-A Related Works
Earlier efforts formulated the task of predicting human trajectories based on handcrafted models, such as the social force model [11] and Gaussian process [12], which utilized fixed physical or mathematical rules to adapt to environmental dynamics. The inflexibility of traditional approaches could lead to overlooking underlying social interaction and forecasting errors in more complex conditions. Inspired by the advancements in machine learning, many deep learning-based algorithms have been deployed to better understand social interactions among pedestrians [5, 7]. However, previous learning-based methods either could not fully utilize the captured features directly or could not effectively leverage long-term dependencies. Especially, due to the successes of attention mechanisms and transformers in sequence learning and pair-wise feature representation [13], [8, 14], there have been explicit descriptions of social interactions via both spatial and temporal dimensions using a spatiotemporal graph model of crowd movements. While the description of pair-wise interactions has been well addressed with the development of transformers and attention modules, all the aforementioned methods have neglected to collect group-wise latent influences for individuals.
While [6] has adapted a hypergraph-based network to learn group-wise and pair-wise features with the multiscale property of hypergraph generation, GroupNet still struggles with isolating spatial features along the temporal dimension. Therefore, the challenge of aligning both group-wise and pair-wise social interactions with long-term dependencies remains a key problem in human trajectory prediction. In this work, we not only incorporate spatial and temporal pair-wise interactions into hypergroup-based group-wise interaction representation, but also introduce a cross-modal attention mechanism to leverage the heterogeneous multimodality dependencies mentioned aboive, based on a multi-modal transformer [15].
II-B Social Interaction Reasoning
Conventional sequence learning models, such as convolutional networks [16] and recurrent networks [5, 13], follow a hierarchical structure that processes information with a tedious and deep order. The lack of parallelization in traditional frameworks can potentially lead to the gradual disappearance or explosion of information after many layers of computations, especially when representing long-term dependencies. In contrast, transformer networks directly capture element-to-element correlations in parallel. This structure has led to significant advancements in sequence learning and pair-wise interaction representation, as demonstrated in [13].
More recently, some existing works [8, 9] have employed transformers to model pair-wise interactions across both spatial and temporal dimensions in trajectory prediction tasks.Given that agents’ future trajectories are highly correlated with their self-spatial and temporal features, those methods have achieved improvements over the SOTA performance. However, despite the transformer’s ability to highlight the importance of each pair of elements via the attention mechanism, they tend to overlook group-wise features for crowd correlation representation.
Unlike standard graph structure where each edge connects only two vertices, hypergraph structures provide a natural means to represent group-wise interactions using hyperedges, which can involve multiple vertices in the same hyperedge. Hypergraph structures have found applications in various fields such as biology, physics, recommendation system, trajectory prediction, and more [17, 18]. For instance, in nature, the correlation between predator-competitor pairs is not simply linear; multiple predator-competitor pairs are challenging to approximate. Thus, [17] introduces high-order interactions among various biotic communities with a hypergraph to stabilize natural environments. Similarly, [6] employs a hypergraph to understand social interactions for forecasting human trajectories. However, most existing approaches either use pre-defined topology structures for generation or create hypergraphs based on direct distance without considering the influence of data distribution. In our work, Hyper-STTN not only considers the influence of data distribution and group scale to generate a multiscale hypergraph, but also leverages crowd dependencies in spatial-temporal dynamics into the hypergraph structure.
III Methodology
III-A Preliminary
We adapt a set of multiscale hypergraphs to construct crowd movement dynamics for trajectory prediction inference. Where is the set of vertexes that presents total agents in the scenario, and denotes that a set of hyperedges are constructed in the hypergraphs, particularly each hyperedge can link more than two vertexes to form a group, and presents scales of hypergrpahs, and defines a weighted matrix of hypergraphs. Lastly, the incident matrix of hypergraph is defined as follows: The diagonal vertex matrix and diagonal edge matrix are composed by the degree of vertex and the degree of edge .
Additionally, the adjacency matrix of hypergraph can be represented by , whereas . Hyper-STTN not only models group-wise interaction using pedestrians hypergraph construction, but also leverages agents’ pair-wise spatial and temporal social interaction into the hypergraph from spatial-temporal transformer. Let and denote the past and future trajectory data of crowd with time sequence or and dimension . And the position of th agent in time can be defined as . Lastly, Hyper-STTN describes the pedestrian trajectory distribution as follows:
| (1) |
where the and are total input sequence and output sequence in the scenario with all agents. And , are the th agent’s input data or output data.
III-B Hyper-STTN Architecture
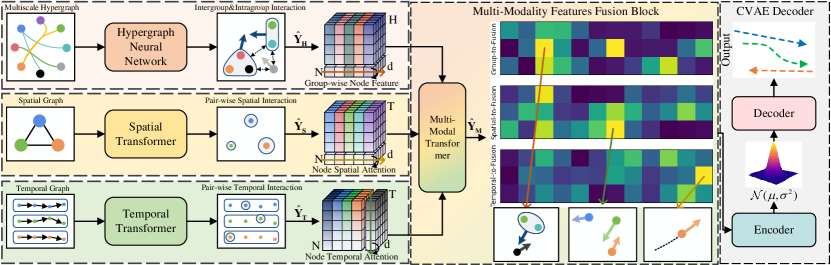
Hyper-STTN captures group-wise and pair-wise interactions to reason out HHI for human trajectory prediction tasks, as illustrated in Fig. 2. Firstly, the spatial-temporal transformer network is developed to capture spatial and temporal dimensional pair-wise features. Meanwhile, the hypergraph convolution neural network is employed in parallel to present crowd group-level dependencies, based on crowded multiscale hypergraph. Subsequently, above heterogeneous group-wise and pair-wise crowded interaction matrices are fused through a multi-modal transformer to align the spatial-temporal embeddings into the hypergraph. Finally, the crowd embedding mixture is decoded from a CVAE decoder to forecast future trajectories.
III-C Spatial-Temporal Transformer
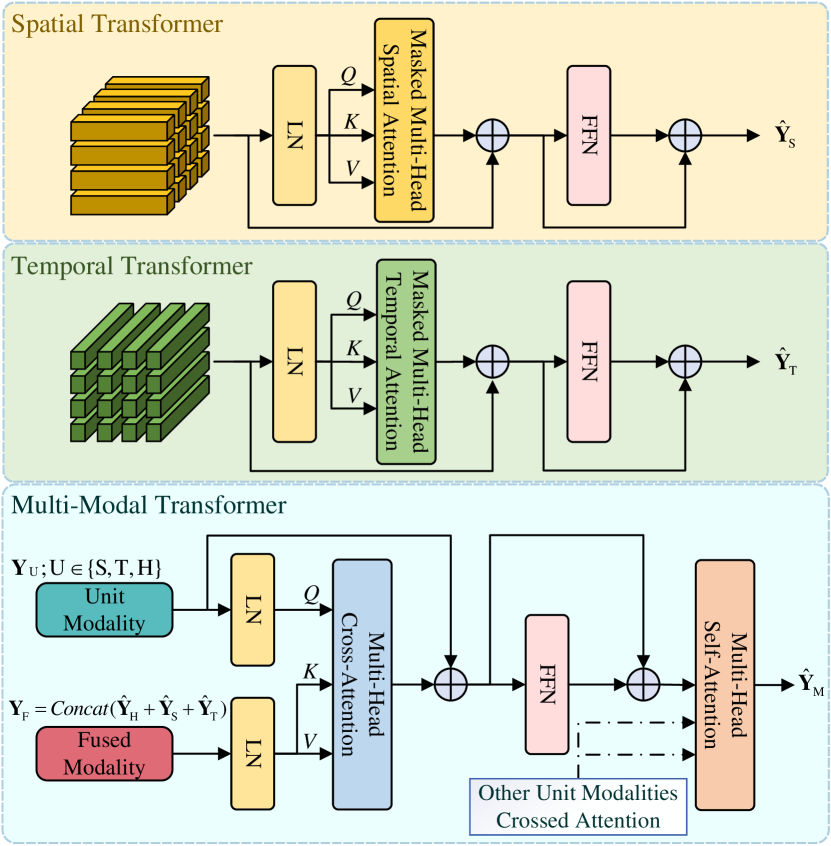
Inspired by [3, 8, 1], we have developed a spatial-temporal transformer network to capture the correlation of agents’ movement along spatial-temporal dimensions. Particularly, spatial or temporal dependencies can be represented as multiple attention maps, as shown in Fig. 6. In the spatial transformer, the input data is first fed into a positional encoding (PE) layer for sequence information encoding based on [13]. Subsequently, the input data proceeds in the proper order through a layer normalization block (LN), a multihead spatial attention layer, and a feed-forward network (FFN), as shown in Fig. 4. Additionally, residual connections are deployed to stabilize the network. The core of the spatial-temporal transformer is the attention mechanism, where the calculation of the multihead spatial or temporal attention layer is defined as follows:
| (2) | ||||
where is self-attention mechanism function, is multihead self-attention mechanism function, and denotes -th head in the multihead attention function with . is a fully connected layer, are -th query matrix, key matrix, and value matrix with the dimension .
Additionally, due to the limitations of data collection, some timestpes’ individual data maybe disappear in temporal transformer, and some pedestrians are also possible to crop up in spatial transformer. Therefore, we adapt the mask attention mechanism [19] to address the issue of series varying, so that length-varying sequence data can be processed by spatial-temporal transformer.
| (3) |
where attention mask matrix is defined to handle the issue of varying length data and to encode relative distance feature into the attention as follows:
| (4) |
The framework of temporal transformer and spatial transformer is illustrated as Fig. 4. And spatial transformer captures the pair-wise spatial interaction of all agents along each timestep. In contrary, temporal transformer rotates the input dimensions to express individual’s temporal interaction along each agent.
| (5) |
III-D Hypergraph Neural Network
To couple multiple group sizes of crowd, we generate a set of multiscale hypergraphs to present social group classifications for comprehensive intergraph or intragraph interactions representation via hypergraph convolution, which can be summarized as a spectral hypergraph k-way partitioning problem [20]. And the normalized one cut spectral hypergraph partitioning task is defined as follows:
| (6) | ||||
where is a classification function, and is the positive semi-definite hypergraph Laplacian.
Assuming a key-way hypergraph partition by a set of vertexes subsets from . And then the spectral hypergraph k-way partitioning problem as a combinatorial optimization problem can be relaxed with respect to minimizing as follows:
| (7) |
Firstly, we utilize the K-nearest neighbor (KNN) method [21, 22] with a hyperparameter to generate a set of hypergraphs which presents group-wise interactions of crowded movements. Suppose the trajectory feature of th agent and the similarity matrix of crowded movements . We utilize a fully connected layer (FC) to capture the low-level trajectory embeddings of each agent as from input . And then the Mahalanobis Distance [23] as a modified Euclidean Distance is used to calculate agent pairs’ feature distances and their similarity matrix. Considering the property of distributions, we construct the social interaction hypergraph based on feature dimensional Mahalanobis Distance, in which avoids the potential errors of Euclidean Distance. Apart from that, Mahalanobis Distance is also deployed to reduce the interferences from feature correlations and measurement dimensions. The Mahalanobis Distance of -th vertex pair in the feature dimension is defined as follows:
| (8) |
where is the covariance matrix of sample distribution.
The element of similarity matrix is defined as follows:
| (9) |
where is the median value of all vertex pairs’ feature distances.
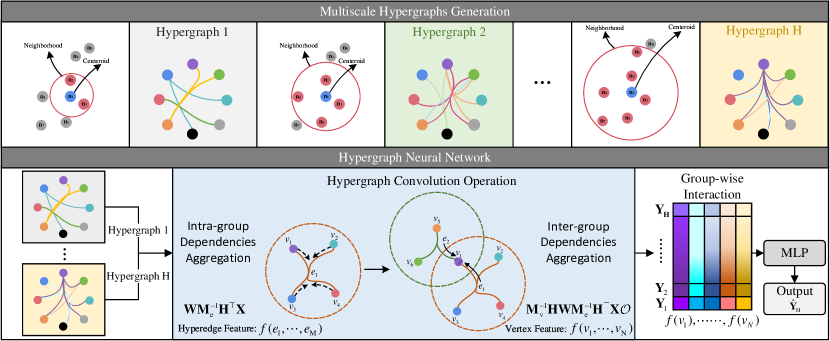
Once obtaining the similarity matrix , KNN constructs multiscale hypergraphs based on feature Mahalanobis Distance as shown in Fig. 3. Each vertex of hypergraph represents singl agent and each hyperedge could link multiple agents to capture group-wise interactions. Especially, herein each hyperedge is created by linking one vertex and its nearest neighbors with respect to similarity matrix .
After creating crowd multiscale hypergraphs, a hypergraph convolution neural network [24] is introduced to estimate the group-wise interactions. The random walk probability [20] of hypergraph aggregates the weighted dependencies of all sub-vertexes as hyperedges features, and then gathers the weighted dependencies of all hyperedges features together as vertex features as shown in Fig. 3. Assume a vertex is stochastically selected with one of its hyperedges , and the probability of hypergraph random walk from to on hyperedge can be defined as follows:
| (10) |
The matrix normalized form of hypergraph random walk can be expressed as follows:
| (11) |
Upon the definition of random walk probability, the hypergraph interaction feature, as group-wise interaction information, is calculated from hypergraph convolution operation based on hypergraph random walk theory, which can aggregate overall dependencies of vertexes and hyperedges on hypergraphs. According to [25, 24], the spectral hypergraph convolution operation that a filter spectral convoluted input data can be defined as follows:
| (12) |
where is the regularized hypergraph Laplacian matrix. And is the Chebyshev polynomial of order with scaled Laplacian , where is the largest eigenvalue of . The parameter is a weighted parameter, and is the kernel size of the graph convolution.
Decomposing the hypergraph Laplacian matrix and approximating it by the first-order Chebyshev polynomial as a hypergraph convolution operation with single scale group-wise interaction dependence as output .
| (13) |
Finally, we aggregate all the multiscale hypergraphs together to present crowded miscellaneous group-wise interactions as follows:
| (14) |
where is a MLP neural network, and is the group-wise interaction feature.
III-E Multi-Modal Transformer and CVAE Decoder
A multi-modal transformer is developed to fuse heterogeneous group-wise and pair-wise agent interaction features based on [15], using a cross-model attention layer. Wherein the multihead cross-modal attention mechanism aligns each unit modality with the concatenation of all modalities as follows:
| (15) |
where , and present the -th head crossmodal attention of arbitrary unit modal with , and are unit modality query and fused modality key or value.
In the multi-modal transformer block as Fig. 4, group-wise feature and pair-wise feature are fed into a positional embedding layer separately, in which all unit modality are concatenated as fused modality . And then the multi-head cross-modal attention block is utilized to gather above group-wise and pair-wise features. Lastly, three fused high-level embeddings () are processed by a multi-head self-attention layer as final state representation of crowd environmental dynamics.
| (16) |
To estimate the stochasticity of human movements, a conditional variational auto encoder (CVAE)-based decoder [26] is employed to approximate maximum likelihood in potential distributions of motion uncertainty. The environmental dynamics feature and observed data are encoded to present Gaussian distribution . And the latent variable is sampled by above Gaussian distribution in the testing process. Lastly, the maximum likelihood forecasting result is calculated by the decoder based on the concatenation of latent variable and observation embedding in the CVAE block as follows:
| (17) | ||||
where are the mean and variation of the approximate distribution, and is Hyper-STTN backbone framework, and is a spectral temporal graph network from [27].
IV Experiments And Results
IV-A Experiments
IV-A1 Dataset
We have conducted experiments on 5 commonly used public pedestrian trajectory datasets collected from real-world scenarios. As shown in Table I, the training and validation datasets consist of the ETH, HOTEL, ZARA1, ZARA2, and UNIV subsections. These datasets record the temporal location information of pedestrians in world coordinates, each identified by an individual index. Our experiments used a leave-one-out cross-validation evaluation strategy, where the last one scenario is reserved for testing in each experiment. The datasets are also augmented through various operations such as shifting and rotating to enhance the training process.
IV-A2 Evaluation Metrics
In our experiments, we employed the evaluation metrics Average Displacement Error (ADE) and Final Displacement Error (FDE) [5] to assess prediction accuracy. The ADE/FDE and ADE20/FDE20 metrics measure prediction performance by calculating the Euclidean distance between the prediction and ground truth, either on average or at a single endpoint.
IV-B Comparison Configuration
IV-B1 Baselines
We compared our model with several existing SOTA algorithms. The algorithms included in the comparison are Social-LSTM [5], Social-Attention [14], Social-GAN [7], Trajectron++ [10], STAR [8], AgentFormer [9], Social-Implicit [28], GroupNet [6], and EqMotion [29]. We trained and tested all baseline networks using the same training datasets and validation datasets obtained from public sources, and we followed the parameters and configurations outlined in their respective original papers.
IV-B2 Ablation Models
We designed three ablation models to investigate the influence of different subsection blocks on performance. First, STTN is designed to infer underlying pedestrian interactions based soley on the spatial-temporal transformer, without the hypergraph network block from Hyper-STTN. Meanwhile, HGNN is configured to model crowded motion dependencies using a set of multiscale hypergraph constructions and hypergraph convolution operations. The final ablation model (Hyper-STTN+MLP) removes the multimodal transformer block and employs a MLP (multilayer perceptron) for group-wise and pair-wise feature fusion. Additionally, the CVAE structure serves as a decoder for each ablation model. And training configurations, such as the training dataset and initialized parameters, are shared among the ablations models and Hyper-STTN.
| Stochastic ADE20 / FDE20 | Social- Attention [14] ICRA18 | Social- GAN [7] CVPR18 | Trajectron ++ [10] ECCV20 | STAR [8] ECCV20 | Agent- Former [9] ICCV21 | Social- Implicit [28] ECCV22 | GroupNet [6] CVPR22 | EqMotion [29] CVPR23 | STTN (ablation) | HGNN (ablation) | Hyper-STTN +MLP (ablation) | Hyper-STTN (ours) |
|---|---|---|---|---|---|---|---|---|---|---|---|---|
| ETH | 1.39/2.39 | 0.87/1.62 | 0.61/1.02 | 0.36/0.65 | 0.45/0.75 | 0.61/1.08 | 0.46/0.73 | 0.40/0.61 | 0.35/0.60 | 0.52/0.75 | 0.42/0.73 | 0.35/0.59 |
| HOTEL | 2.51/2.91 | 0.67/1.37 | 0.19/0.28 | 0.17/0.36 | 0.14/0.22 | 0.33/0.63 | 0.15/0.25 | 0.12/0.18 | 0.26/0.50 | 0.21/0.25 | 0.21/0.32 | 0.14/0.19 |
| UNIV | 1.25/2.54 | 0.76/1.52 | 0.30/0.54 | 0.31/0.62 | 0.25/0.45 | 0.52/1.11 | 0.26/0.49 | 0.23/0.43 | 0.25/0.55 | 0.25/0.43 | 0.30/0.53 | 0.23/0.42 |
| ZARA1 | 1.01/2.17 | 0.35/0.68 | 0.24/0.42 | 0.26/0.55 | 0.18/0.30 | 0.32/0.66 | 0.21/0.39 | 0.18/0.32 | 0.21/0.50 | 0.31/0.39 | 0.28/0.53 | 0.18/0.29 |
| ZARA2 | 0.88/1.75 | 0.42/0.84 | 0.18/0.32 | 0.22/0.46 | 0.14/0.24 | 0.43/0.85 | 0.17/0.33 | 0.13/0.23 | 0.19/0.40 | 0.25/0.33 | 0.23/0.28 | 0.15/0.23 |
| AVG | 1.41/2.35 | 0.61/1.21 | 0.30/0.51 | 0.26/0.53 | 0.23/0.39 | 0.33/0.67 | 0.25/0.44 | 0.21/0.35 | 0.25/0.51 | 0.31/0.43 | 0.29/0.48 | 0.21/0.34 |
IV-B3 Training Details
To train the model, we use the Adam optimizer [30] with a learning rate and a decay rate (50% per 100 epochs). Additionally, Gaussian noise is added to enforce the robustness of the network. For more parameters and details, please refer to our project website.
In our training procedure, we utilize the distance loss function , angle loss function , and encoder loss function to update the network as follows:
| (18) | ||||
where is the weight of each loss term, and the Kullback-Leibler (KL) divergence term is used to update the encoder and decoder in the CVAE block, and denotes the groundturth of dataset. The function computes the angle between two vectors representing points.
Finally, the overall loss function for Hyper-STTN is constructed as the sum of the above equations to minimize the total loss as follows:
| Deterministic ADE / FDE | S-LSTM[5] CVPR16 | Trajectron++[10] ECCV20 | STAR[8] ECCV20 | EqMotion[29] CVPR23 | Hyper-STTN (ours) |
|---|---|---|---|---|---|
| ETH | 1.09/2.35 | 1.02/2.00 | 0.56/1.11 | 0.96/1.92 | 0.52/1.02 |
| HOTEL | 0.79/1.76 | 0.33/0.62 | 0.26/0.50 | 0.35/0.67 | 0.22/0.41 |
| UNIV | 0.67/1.40 | 0.53/1.19 | 0.52/1.15 | 0.50/1.10 | 0.50/1.16 |
| ZARA1 | 0.47/1.00 | 0.44/0.99 | 0.41/0.90 | 0.39/0.86 | 0.41/0.88 |
| ZARA2 | 0.56/1.17 | 0.32/0.73 | 0.31/0.71 | 0.30/0.68 | 0.32/0.72 |
| AVG | 0.72/1.54 | 0.53/1.11 | 0.41/0.87 | 0.49/1.03 | 0.39/0.84 |
IV-C Qualitative Results
We conducted two trajectory prediction tasks respectively, wherein predictors only generate single path in deterministic conditions, and output 20 potential paths to evaluate with the best one of such 20 samples in stochastic conditions. To adapt to deterministic situations, we modified the CVAE decoder of our model to use a MLP, allowing us to omit the second term in loss and the entire loss.
As shown in Tables I and II, Hyper-STTN is compared with nine baselines and three ablation models on the ETH-UCY dataset. Hyper-STTN demonstrates the best performance among current SOTA frameworks, both in deterministic and stochastic configurations. For instance, in the stochastic condition, Hyper-STTN not only enhances the ADE20 and FDE20 from EqMotion’s [29] 0.40/0.61 to 0.35/0.59 on ETH dataset, but also improves the average ADE and FDE performance from STAR’s [8] 0.41/0.87 to 0.39/0.84 in deterministic condition. These results highlight the effectiveness of Hyper-STTN in crowd latent interaction inference and trajectory forecasting.
The insights of deep learning-inspired trajectory prediction framework have motivated the research paradigm that implicitly capture latent social interaction among spatial and temporal dimensions to estimate pedestrian potential movements. Whereas, the deployments of LSTM [5], Attention [14], to transformer [8] or diffusion have increased the average performance of pedestrians’ trajectory predictors form -level to current -level with respect to the improvement of high-level feature inference on advanced framework. Thus, the transformer-based backbones are leveraged by Hyper-STTN to address fundamental social interactions and temporal dependencies among crowded movements. More specifically, the ablation model STTN, which is solely driven by a transformer like STAR, achieves superior trajectory quality () compared to STAR () in terms of ADE20/FDE20 metrics. From our experiments, we observed that the aforementioned enrichment is a result of the introduction of masked attention and cross-modal attention mechanisms. These mechanisms not only mitigate the influence of agents flicker when compared to vanilla self-attention in the fixed pre-defined transformer data scale formulation but also enhance the adaptability for spatial-temporal fusion.
However, despite transformer demonstrates the amazing effectiveness on pair-wise interaction abstraction, the overlook of group-wise interaction limits the further performance improvement, particularly in dense scenarios individual motion is more affected by crowded groups. Such as GroupNet [6] () is better than STAR [8] () on UNIV dataset that owns more dense crowded scenarios. Therefore, herein we leverage the ability of hypergraph construction and convolution on group-wise interaction inference and transformer on pair-wise feature understanding to address crowded movement strategies. Apart from that, the ablation model HGNN exhibits a similar performance with GroupNet on several datasets.
IV-D Discussion
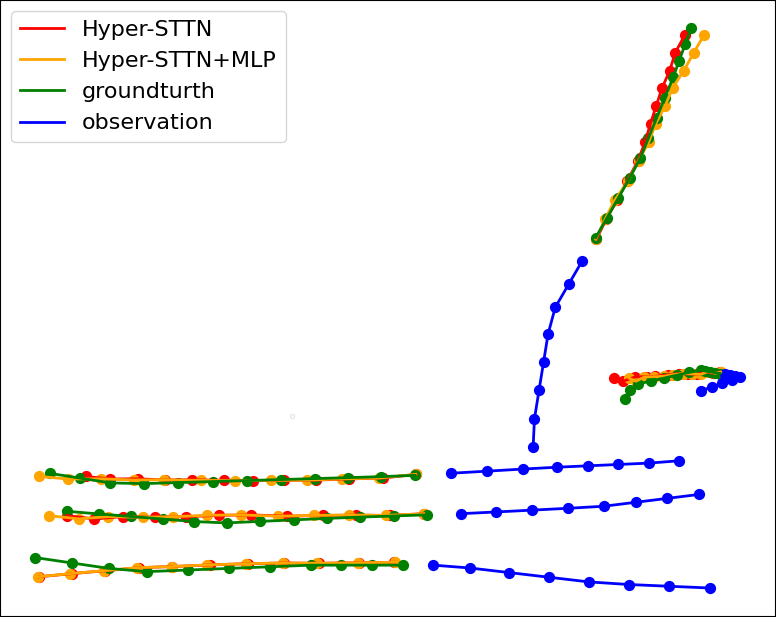
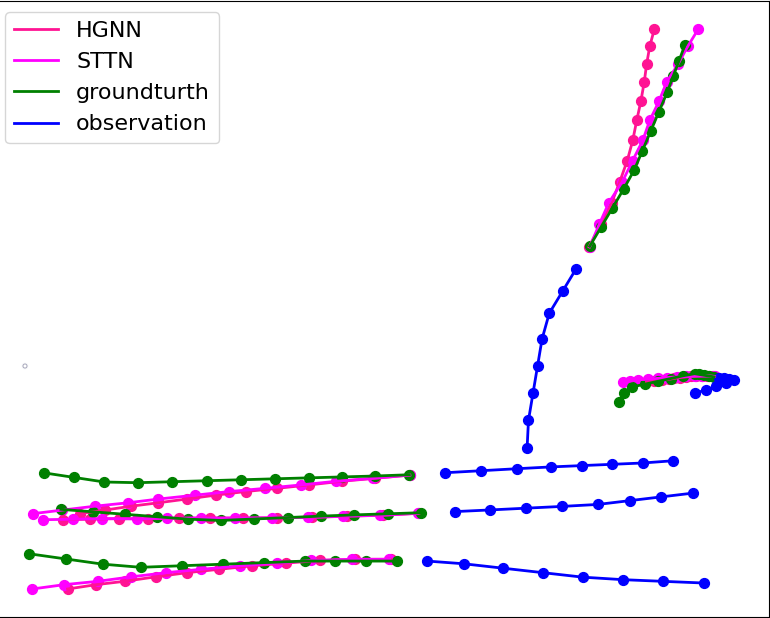
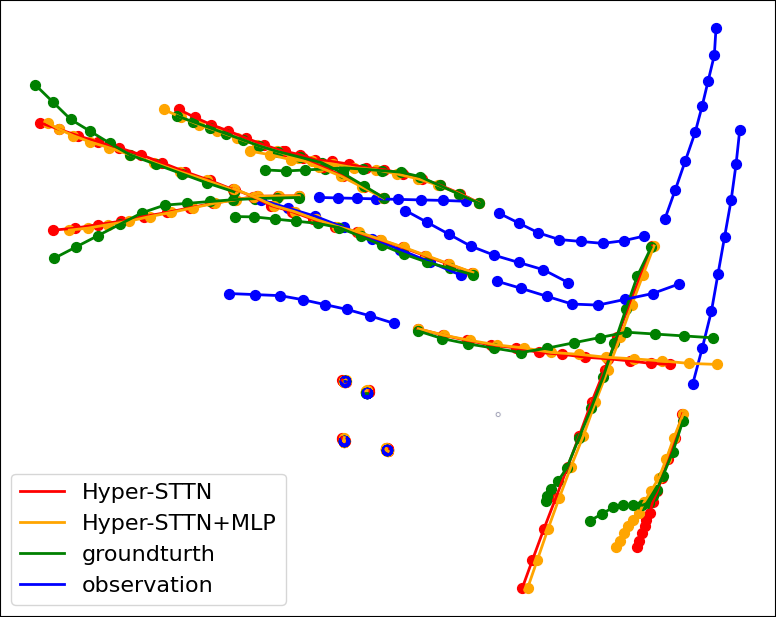
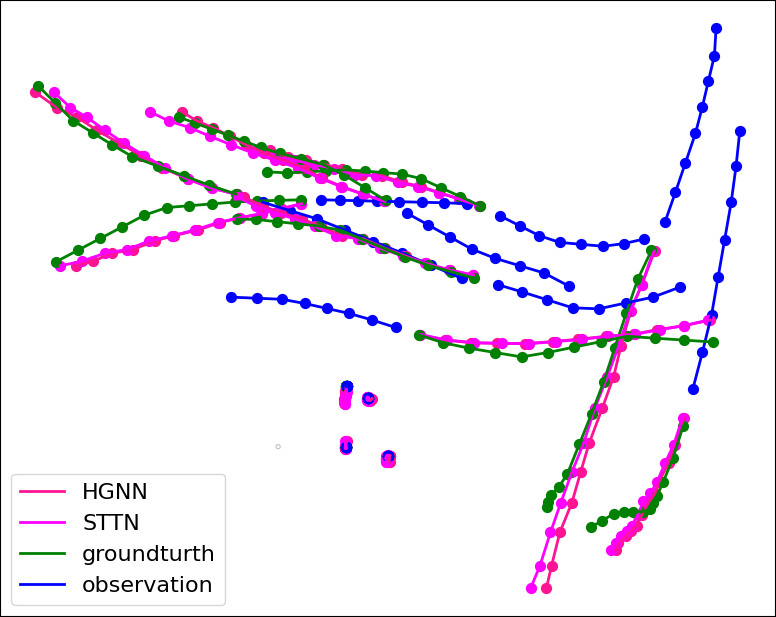
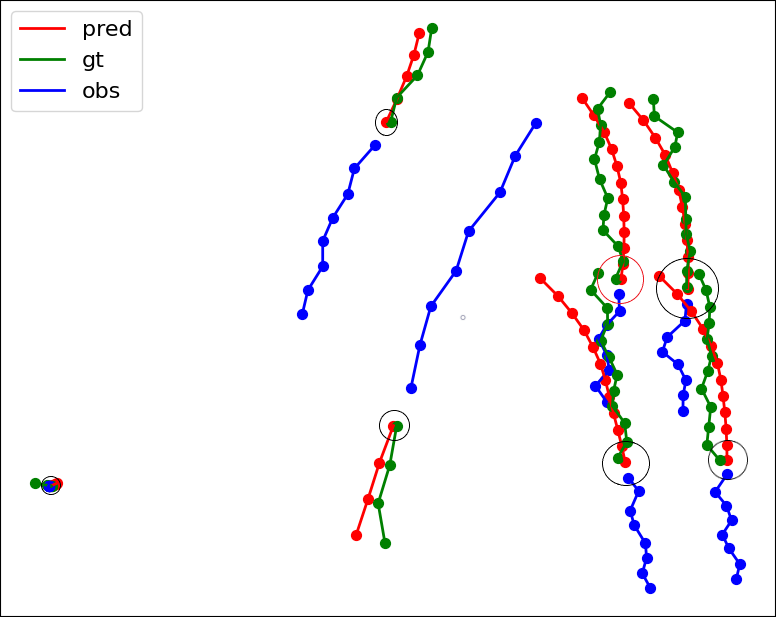
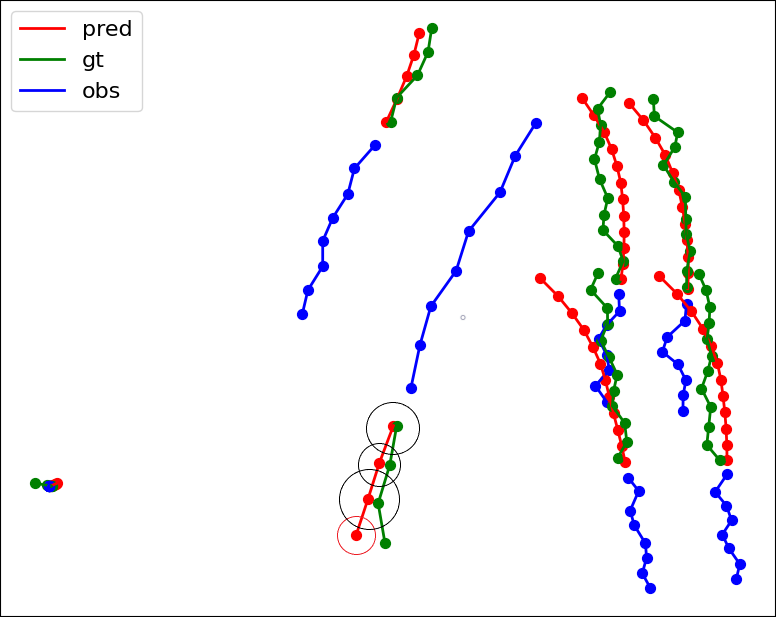
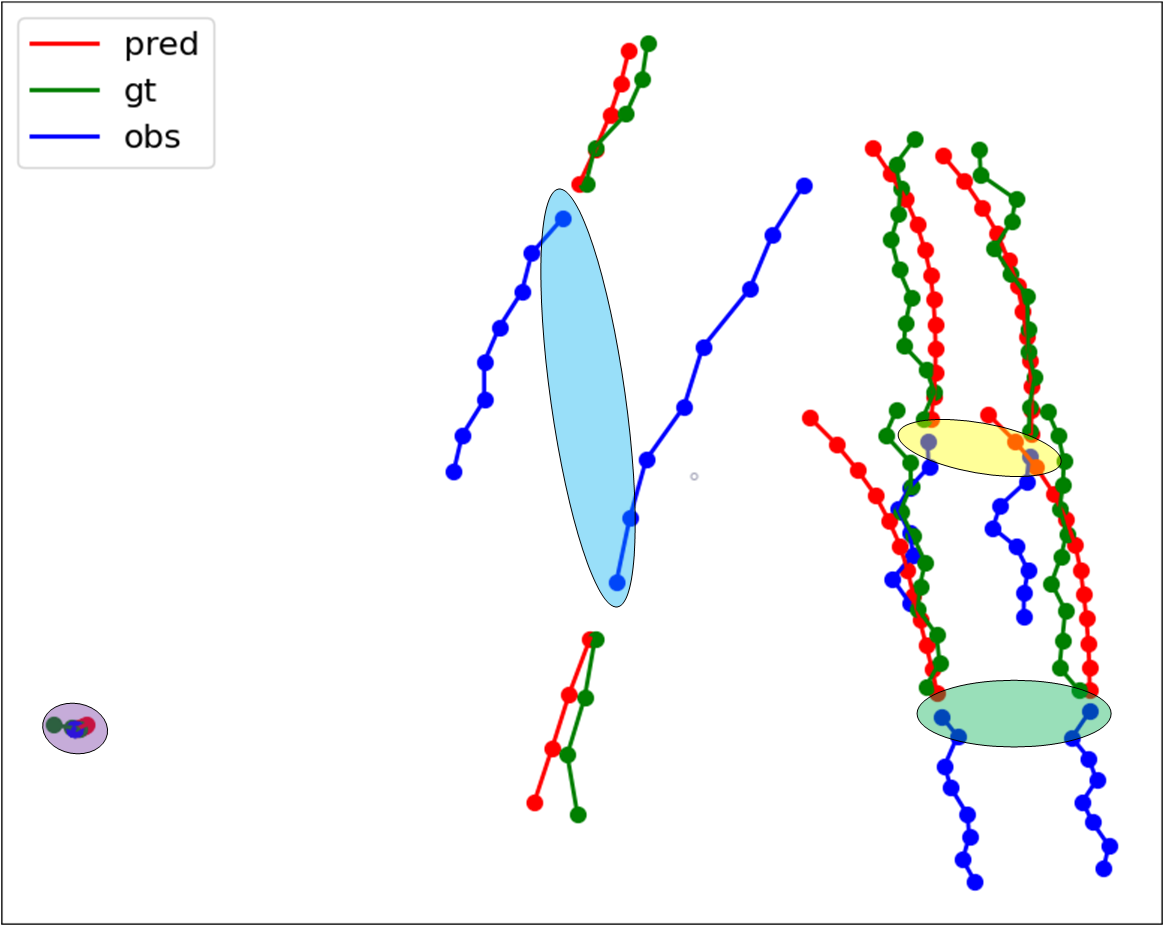
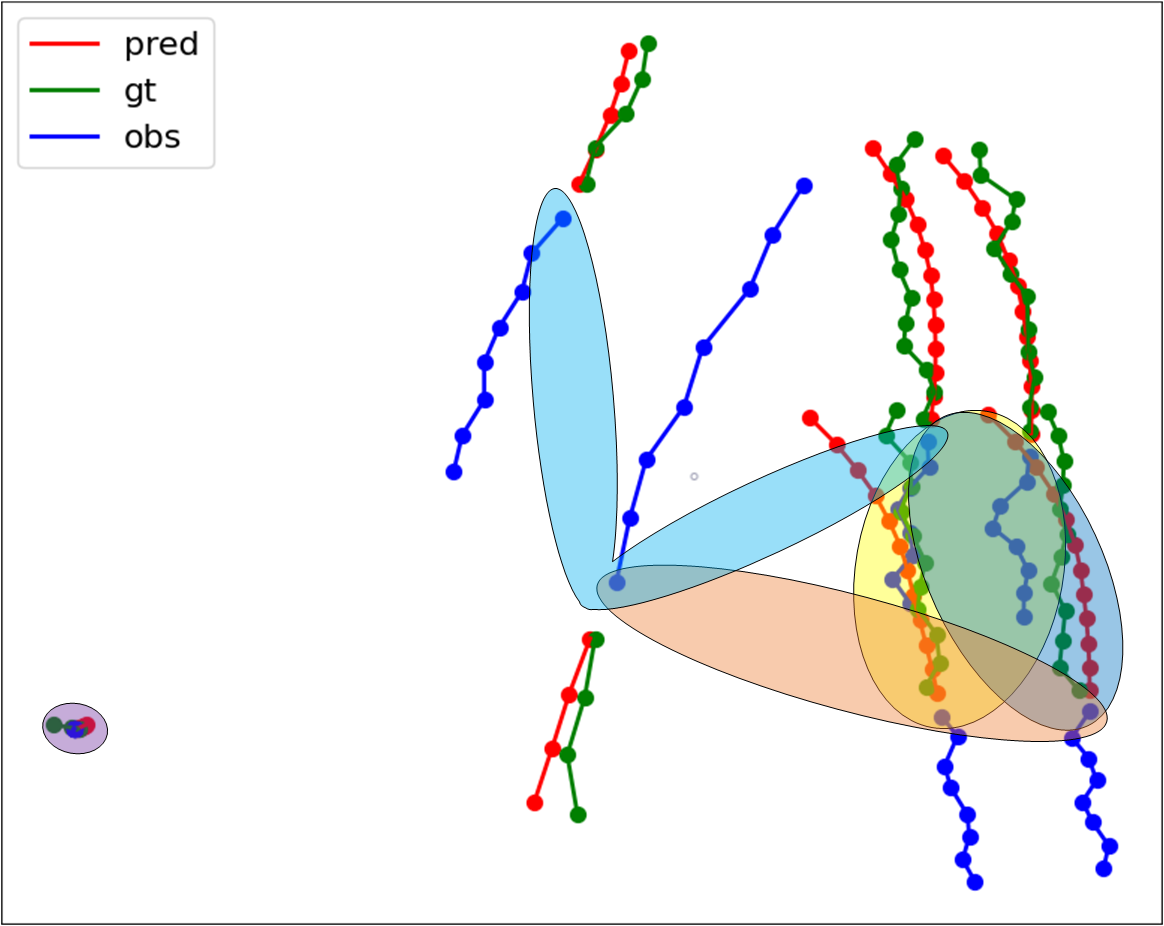
Trajectory results for two specific sparse and dense cases of Hyper-STTN are visualized alongside three ablation models in the same configuration, as shown in Fig. 5. The observation input of each network is represented by blue points, while the groundturth for pedestrians is colored in green, distinguishing it from the forecasting outputs of the above predictors. It is evident that Hyper-STTN consistently generates highly accurate locations for several sequential timesteps and infers more reasonable motion orientations. As shown in Fig. 6, the developments in the spatial transformer allows Hyper-STTN to understand relative spatial interactions among each agent pair. On the other hand, the encoded embeddings from the temporal transformer lead to an understanding of individual motion attributes. Additionally, in dense scenarios with an increasing number of pedestrian groups, the diverse intergroup and intragroup crowd correlations have a more significant impact than in sparse situations. Hence, the inference of group-wise interactions results in more accurate long-term forecasting, as observed in the trajectories of Hyper-STTN and HGNN, along with their corresponding ADE/FDE results.
IV-D1 Effect of Hypergraph Neural Network
We address three components of Hyper-STTN, which include the hypergraph neural network, spatial-temporal transformer, and multi-modal transformer. As shown in Table I, HGNN performs approximately as well as GroupNet on many datasets. In general, hypergraph construction can effectively enhance network performance as the number of pedestrians increases. For example, in Fig. 5d, the ablation model STTN exhibits serious forecasting errors of many agents, both in terms of location and orientation, when compared to HGNN. This is attributed to STTN’s lack of consideration for group-wise features.
IV-D2 Effect of Spatial-Temporal Transformer
Compared to previous transformer-based approaches such as STAR, STTN improves the average results from 0.26/0.53 to 0.25/0.51. This improvement can be attributed to the deployment of a more effective transformer-based multi-modal fusion network and mask attention mechanism. Additionally, STTN also achieves more efficient trajectories than HGNN in scenarios with fewer pedestrians, as demonstrated in Fig. 5b.
IV-D3 Effect of Multi-Modal Transformer
Due to the heterogeneity of group-wise and pair-wise embeddings, Hyper-STTN leverages a multi-modal transformer to merge them, capturing cross-modal attention to highlight meaningful correlations among modalities. In contrast, the limited fusion mechanism in the ablation model Hyper-STTN+MLP underperforms Hyper-STTN in every dataset, as shown in Table I. This is because the direct concatenation operation in the MLP overlooks potential relationships among cross-modal features.
V Conclusion
In this work, we introduced Hyper-STTN, a hypergraph-based hybrid spatial-temporal transformer for improved pedestrian trajectory prediction. Hyper-STTN captures both group-wise and pair-wise interactions in crowd dynamics using hypergraphs and transformer blocks. It has outperformed the state-of-the-art prediction algorithm on the ETH-UCY dataset. Future work could explore further enhancements to Hyper-STTN, including refining its ability to handle complex scenarios and scaling it for real-time applications.
References
- [1] W. Wang, R. Wang, L. Mao, and B.-C. Min, “Navistar: Socially aware robot navigation with hybrid spatio-temporal graph transformer and preference learning,” in 2023 IEEE/RSJ International Conference on Intelligent Robots and Systems (IROS), 2023, pp. 11 348–11 355.
- [2] W. Wang, L. Mao, R. Wang, and B.-C. Min, “Multi-robot cooperative socially-aware navigation using multi-agent reinforcement learning,” arXiv preprint arXiv:2309.15234, 2023.
- [3] C. Chen, Y. Liu, L. Chen, and C. Zhang, “Bidirectional spatial-temporal adaptive transformer for urban traffic flow forecasting,” IEEE Transactions on Neural Networks and Learning Systems, 2022.
- [4] I. Sutskever, O. Vinyals, and Q. V. Le, “Sequence to sequence learning with neural networks,” Advances in neural information processing systems, vol. 27, 2014.
- [5] A. Alahi, K. Goel, V. Ramanathan, A. Robicquet, L. Fei-Fei, and S. Savarese, “Social lstm: Human trajectory prediction in crowded spaces,” in Proceedings of the IEEE conference on computer vision and pattern recognition, 2016, pp. 961–971.
- [6] C. Xu, M. Li, Z. Ni, Y. Zhang, and S. Chen, “Groupnet: Multiscale hypergraph neural networks for trajectory prediction with relational reasoning,” in Proceedings of the IEEE/CVF Conference on Computer Vision and Pattern Recognition, 2022, pp. 6498–6507.
- [7] A. Gupta, J. Johnson, L. Fei-Fei, S. Savarese, and A. Alahi, “Social gan: Socially acceptable trajectories with generative adversarial networks,” in Proceedings of the IEEE conference on computer vision and pattern recognition, 2018, pp. 2255–2264.
- [8] C. Yu, X. Ma, J. Ren, H. Zhao, and S. Yi, “Spatio-temporal graph transformer networks for pedestrian trajectory prediction,” in Computer Vision–ECCV 2020: 16th European Conference, Glasgow, UK, August 23–28, 2020, Proceedings, Part XII 16. Springer, 2020.
- [9] Y. Yuan, X. Weng, Y. Ou, and K. M. Kitani, “Agentformer: Agent-aware transformers for socio-temporal multi-agent forecasting,” in Proceedings of the IEEE/CVF International Conference on Computer Vision, 2021, pp. 9813–9823.
- [10] T. Salzmann, B. Ivanovic, P. Chakravarty, and M. Pavone, “Trajectron++: Dynamically-feasible trajectory forecasting with heterogeneous data,” in Computer Vision–ECCV 2020: 16th European Conference, Glasgow, UK, August 23–28, 2020, Proceedings, Part XVIII 16. Springer, 2020, pp. 683–700.
- [11] K. Yamaguchi, A. C. Berg, L. E. Ortiz, and T. L. Berg, “Who are you with and where are you going?” in CVPR 2011. IEEE, 2011.
- [12] J. M. Wang, D. J. Fleet, and A. Hertzmann, “Gaussian process dynamical models for human motion,” IEEE transactions on pattern analysis and machine intelligence, vol. 30, no. 2, pp. 283–298, 2007.
- [13] A. Vaswani, N. Shazeer, N. Parmar, J. Uszkoreit, L. Jones, A. N. Gomez, Ł. Kaiser, and I. Polosukhin, “Attention is all you need,” Advances in neural information processing systems, vol. 30, 2017.
- [14] A. Vemula, K. Muelling, and J. Oh, “Social attention: Modeling attention in human crowds,” in 2018 IEEE international Conference on Robotics and Automation (ICRA). IEEE, 2018, pp. 4601–4607.
- [15] Y.-H. H. Tsai, S. Bai, P. P. Liang, J. Z. Kolter, L.-P. Morency, and R. Salakhutdinov, “Multimodal transformer for unaligned multimodal language sequences,” in Association for Computational Linguistics, vol. 2019. NIH Public Access, 2019, p. 6558.
- [16] A. Mohamed, K. Qian, M. Elhoseiny, and C. Claudel, “Social-stgcnn: A social spatio-temporal graph convolutional neural network for human trajectory prediction,” in Proceedings of the IEEE/CVF conference on computer vision and pattern recognition, 2020.
- [17] J. Grilli, G. Barabás, M. J. Michalska-Smith, and S. Allesina, “Higher-order interactions stabilize dynamics in competitive network models,” Nature, vol. 548, no. 7666, pp. 210–213, 2017.
- [18] C. Ke and J. Honorio, “Exact inference in high-order structured prediction,” in Proceedings of the 40th International Conference on Machine Learning, ser. ICML’23. JMLR.org, 2023.
- [19] B. Cheng, I. Misra, A. G. Schwing, A. Kirillov, and R. Girdhar, “Masked-attention mask transformer for universal image segmentation,” in Proceedings of the IEEE/CVF conference on computer vision and pattern recognition, 2022, pp. 1290–1299.
- [20] D. Zhou, J. Huang, and B. Schölkopf, “Learning with hypergraphs: Clustering, classification, and embedding,” Advances in neural information processing systems, vol. 19, 2006.
- [21] P. Cunningham and S. J. Delany, “k-nearest neighbour classifiers-a tutorial,” ACM computing surveys, vol. 54, no. 6, pp. 1–25, 2021.
- [22] D. Bo, X. Wang, C. Shi, M. Zhu, E. Lu, and P. Cui, “Structural deep clustering network,” in Proceedings of the web conference 2020, 2020.
- [23] F. Wang and J. Sun, “Survey on distance metric learning and dimensionality reduction in data mining,” Data mining and knowledge discovery, vol. 29, no. 2, pp. 534–564, 2015.
- [24] Y. Gao, Y. Feng, S. Ji, and R. Ji, “HGNN+: General hypergraph neural networks,” IEEE Transactions on Pattern Analysis and Machine Intelligence, vol. 45, no. 3, pp. 3181–3199, 2023.
- [25] T. N. Kipf and M. Welling, “Semi-supervised classification with graph convolutional networks,” in International Conference on Learning Representations, 2017.
- [26] K. Sohn, H. Lee, and X. Yan, “Learning structured output representation using deep conditional generative models,” Advances in neural information processing systems, vol. 28, 2015.
- [27] D. Cao, Y. Wang, J. Duan, C. Zhang, X. Zhu, C. Huang, Y. Tong, B. Xu, J. Bai, J. Tong et al., “Spectral temporal graph neural network for multivariate time-series forecasting,” Advances in neural information processing systems, vol. 33, pp. 17 766–17 778, 2020.
- [28] A. Mohamed, D. Zhu, W. Vu, M. Elhoseiny, and C. Claudel, “Social-implicit: Rethinking trajectory prediction evaluation and the effectiveness of implicit maximum likelihood estimation,” in European Conference on Computer Vision. Springer, 2022, pp. 463–479.
- [29] C. Xu, R. T. Tan, Y. Tan, S. Chen, Y. G. Wang, X. Wang, and Y. Wang, “Eqmotion: Equivariant multi-agent motion prediction with invariant interaction reasoning,” in Proceedings of the IEEE/CVF Conference on Computer Vision and Pattern Recognition, 2023, pp. 1410–1420.
- [30] D. P. Kingma and J. Ba, “Adam: A method for stochastic optimization,” International Conference on Learning Representations, 2015.