The Pulse of Mood Online: Unveiling Emotional Reactions in a Dynamic Social Media Landscape
Abstract.
The rich and dynamic information environment of social media provides researchers, policy makers, and entrepreneurs with opportunities to learn about social phenomena in a timely manner. However, using these data to understand social behavior is difficult due to heterogeneity of topics and events discussed in the highly dynamic online information environment. To address these challenges, we present a method for systematically detecting and measuring emotional reactions to offline events using change point detection on the time series of collective affect, and further explaining these reactions using a transformer-based topic model. We demonstrate the utility of the method by successfully detecting major and smaller events on three different datasets, including (1) a Los Angeles Tweet dataset between Jan. and Aug. 2020, in which we revealed the complex psychological impact of the BlackLivesMatter movement and the COVID-19 pandemic, (2) a dataset related to abortion rights discussions in USA, in which we uncovered the strong emotional reactions to the overturn of Roe v. Wade and state abortion bans, and (3) a dataset about the 2022 French presidential election, in which we discovered the emotional and moral shift from positive before voting to fear and criticism after voting. The capability of our method allows for better sensing and monitoring of population’s reactions during crises using online data.
1. Introduction
Social media platforms connect billions of people worldwide, enabling them to exchange information and opinions, express emotions, and to respond to others. Researchers, policy makers, and entrepreneurs have grown interested in learning what the unfettered exchange of information reveals about current social conditions, including using social media data to track public opinion on important issues (Klašnja et al., 2018; He et al., 2022) and monitor the well-being of populations at an unprecedented spatial scale and temporal resolution (Pellert et al., 2022).
Using social media data to learn about human behavior, however, poses significant challenges. Social media represents a heterogeneous, highly dynamic information environment where some topics are widely discussed while others are barely mentioned (Dodds et al., 2022). It includes people’s self-reports of their own lives, as well as reactions to external events. Researchers have developed methods to detect events from online discussions (Malik et al., 2022; Weng et al., 2011; Morabia et al., 2019; Rezaei et al., 2022). However, social media data provides evidence for learning about human behavior beyond shifts in topics. For example, it can also shed light on emotions and morality, which are important drivers of individual attitudes, beliefs, and psychological and social well-being (vanKleef et al., 2016; Haidt et al., 2007).
To study the collective affect, researchers investigated how social media content influences emotional user engagement (Babac, 2022; Aldous et al., 2022). These works, however, leave a gap in our understanding of collective emotional and moral reactions to socio-political events, which delineate opinion dynamics and emergence of polarization, and help identify online influence campaigns.
To bridge these gaps, we present a methodology for detecting, measuring and explaining the collective emotional reactions to offline events. Using state-of-the-art transformer-based models, we construct the time series of aggregate affect from social media posts. We detect emotional reactions as discontinuities in these time series, and then explain the reactions using topic modeling. We demonstrate the utility of the methodology on three different datasets:
-
(1)
2020 Los Angeles Tweets: a dataset collected between Jan. and Aug. 2020, of which time span represents a complex period in American history with important social, political and cultural changes. We successfully detect the simultaneous crises of the COVID-19 pandemic and racial justice reckoning, and other important events like political primaries. We show how these developments had profound impact on the psychological state of the population.
-
(2)
2022 Abortion Tweets: a tweet collection related to abortion rights and the overturning of Roe v. Wade, spanning the entire year of 2022. We uncovered various abortion related events and discussions, such as the leak of SCOTUS ruling, the overturn of Roe v. Wade, state abortion bans, and the complex emotional reactions to the 2022 US Midterm election.
-
(3)
2022 French Election Tweets: a dataset about the 2022 French presidential election, of which time coincided with other major events, the Russia-Ukraine war and the G7 summit. We detect the correct dates of the first and second rounds of the presidential and legislative elections, as well as the shift in population’s emotional responses from positive before each voting round to negative afterwards.
The success of our method on three different datasets indicates its effectiveness and generalizability. We show several benefits of our emotional reaction detection method. First, the method is able to not only detect major events but also their complex and multifaceted emotional and moral impact. Second, this unsupervised method is also able to discover smaller events that are easily missed on news media. Third, the method can identify events that happened closely in time or even on the same day based on different emotional reactions. In addition, we also demonstrate the importance of disaggregating by topics when studying specific issues, using the analysis on emotional reactions in sub-topics during COVID-19 pandemic as an example. Although we apply our method to Twitter datasets in this study, it is also generalizable to other social media platforms and news. Our results suggest that studying the collective emotional reactions on social media can provide valuable insights into understanding people’s opinions and responses to timely socio-political events, and aid policy makers in crafting messages that align with the values and concerns of the population 111Short version of this paper is published as (Guo et al., 2023b).
2. Related Works
Event Detection:
With the rich and dynamic information on social media that is tightly related to offline events, researchers have developed methods for event detection on online platforms, including topic detection techniques such as Latent Dirichlet Allocation (LDA) (Blei et al., 2003) and Topic2Vec (Niu et al., 2015), clustering documents based on their textual similarity (Malik et al., 2022), studying term co-occurrence and performing term frequency analysis (Weng et al., 2011) and detecting bursty terms (Malik et al., 2022; Morabia et al., 2019). Recent methods also incorporate deep learning techniques (Rezaei et al., 2022; Cao et al., 2021). Although these methods help detect events from social media data, we also want to understand the dynamics of emotions and moral sentiments in the aggregate online population, as opinions and emotions expressed online have a complex interplay that can impact and manifest in offline behaviors.
Sentiments and Emotions:
Early research on quantifying online emotions relied on dictionary-based approaches to measure sentiment of messages by counting the occurrences of positive or negative words (Golder et al., 2011; Sandoval-Almazan et al., 2020). Researchers found that the sentiment of tweets in aggregate revealed hourly, diurnal and weekly patterns of mood variations (Golder et al., 2011; Dodds et al., 2011). Some studies demonstrated the feasibility of monitoring subjective wellbeing of populations (Jaidka et al., 2020) at unprecedented temporal scale and resolution (Mitchell et al., 2013). Other works used social media sentiment analysis to study user reactions to political campaigns (Sandoval-Almazan et al., 2020), or as an alternative to costly public opinion polls (Cody et al., 2015), predict stock market prices (Bollen et al., 2011) and results of elections (Tumasjan et al., 2010).
In terms of studying emotional reactions to offline events, Hauthal et al. (Hauthal et al., 2019) used emojis to analyze the online reaction to Brexit. A recent work conducted emotion analysis of user reactions to online news (Babac, 2022), focusing on the relationship among news content, emotions and user engagement reactions. Another study investigates the user reactions to news articles by predicting emotional reactions before and after publishing the posts (Aldous et al., 2022). These works utilize user reactions such as comments, likes and shares to specific news articles, and focus more on how social media content and news articles influence emotional engagement online.
Different from aforementioned studies, we are interested in understanding the online dynamics of emotions and moral sentiments in response to the continuous stream of real-life events, because affect is tightly related to opinions and induces offline actions (Mirlohi Falavarjani et al., 2021), providing us valuable information to study human behavior. We incorporate both event detection and emotion analysis techniques to detect, measure and explain emotional and moral reactions on social media.
3. Methods and Materials
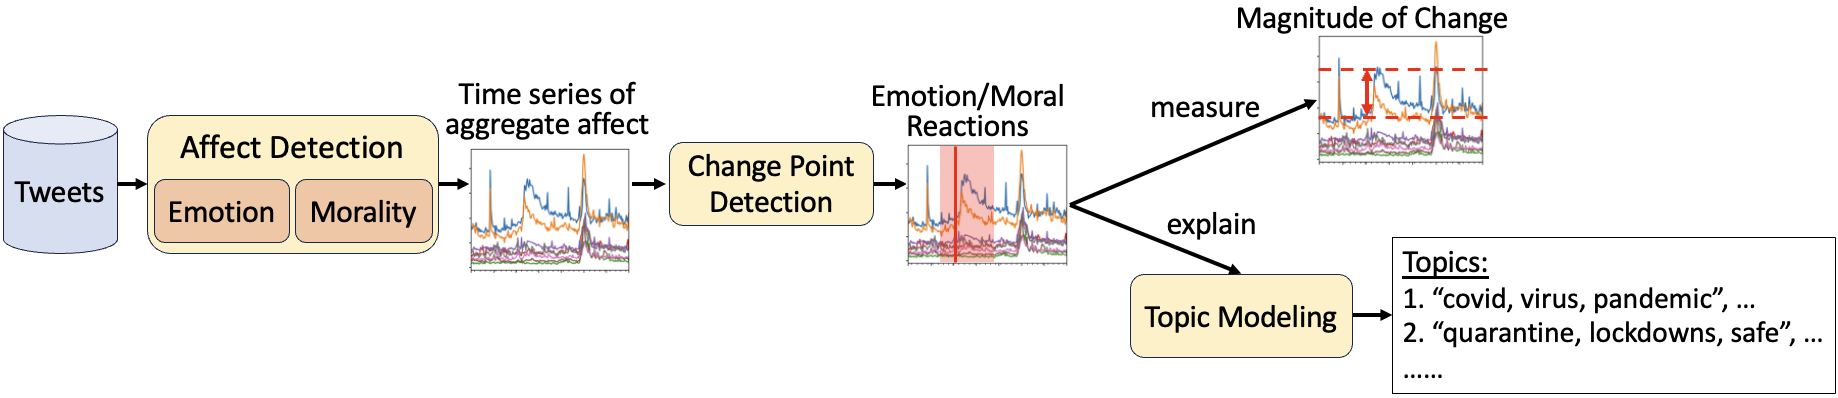
To understand the dynamics of affect, we propose a pipeline (Fig. 1) that detects, measures and explains online emotional and moral reactions to offline events. With a set of timestamped texts, e.g. tweets, we first perform emotion and morality detection from text. We then construct the time series of the aggregate affect on a daily basis. Next, to detect reactions, we perform change point detection on each emotion and morality time series. We measure the magnitude of the change at each detected change point and perform topic modeling to explain the offline event that triggered the specific online reaction.
3.1. Data
3.1.1. 2020 Los Angeles Tweets
The data was collected using Twitter’s Filter API by specifying a geographic bounding box over the region of Los Angeles. This method collects every tweet that is either geotagged within the bounding box (using the device’s coordinates with the user’s permission), or by using the Twitter “place” feature, where the user tags their location. We collected 17M tweets from 350K unique users. The dataset includes a wider range of topics and authors than data collected using keywords typically do.
3.1.2. 2022 Abortion Tweets
The data comprises tweets about abortion rights in the U.S. and the overturning of Roe vs Wade (Chang et al., 2023). We filter English tweets posted within the U.S. over the period of an entire year of 2022. Each tweet contains at least one term from a list of keywords that reflect both sides of the abortion debate, such as “roevswade”, “prochoice”, “MyBodyMyChoice”, “prolife”, and “ValueLife”. The data include 12M tweets generated by 1M users.
3.1.3. 2022 French Election Tweets
This is a corpus of 6M tweets about the 2022 French presidential election. The tweets were collected by querying Twitter with a set of keywords related to the election: e.g., “election”, “élection”, “l’élection”, “Elysee 2022”, “Elysee2022”, etc. 90% of the tweets were in French, and the rest were in English and other languages.
3.2. Emotion and Morality Detection
We first measure emotions and moral sentiments expressed in an individual tweet. For emotions, we use a transformer-based language model SpanEmo (Alhuzali et al., 2021), fine-tuned on the SemEval 2018 1e-c data (Mohammad et al., 2018). This model outperforms prior methods by learning the correlations among the emotions. It measures anticipation, joy, love, trust, optimism, anger, disgust, fear, sadness, pessimism and surprise.
We quantify the moral sentiments of tweets along five dimensions (Haidt et al., 2007): dislike of suffering (care/harm), dislike of cheating (fairness/cheating), group loyalty (loyalty/betrayal), respect of authority and tradition (authority/subversion), and concerns with purity and contamination (purity/degradation). We fine-tune a transformer-based model on diverse training data (see (Guo et al., 2023a) for details). The large amount and the variety of topics in our training data helps mitigate the data distribution shift during inference. For both emotion and morality detection, we use the multilingual XLM-T (Barbieri et al., 2022) as our base transformer model on the 2022 French Election data. For other English datasets, we use “bert-base-uncased” as the base model. After labeling tweets, we calculate the daily fractions of tweets with different emotion and moral categories to construct the time series.
Evaluation
We compare our emotion and morality detection methods with widely used dictionary-based methods, namely keyword matching using Emolex (does not include “love” category) for emotions, and Distributed Dictionary Representations (DDR) (Garten et al., 2018) for morality. On the Los Angeles dataset, our methods outperforms baselines on ten out of 11 emotion categories (the F1-scores of our method are in , and those of Emolex are in ) and we outperform on nine out of ten moral categories (the F1-scores of our method are in , and those of DDR are in ). See A in Appendices for details about human annotation and F1-scores. On 2022 French Election Tweets, similar evaluation was performed based on human annotation. The emotions had an average F1-score of 0.66, and the moral categories had an average F1-score of 0.58. On the 2022 Abortion data, validation was given by Rao et al.. We notice that the model performance inevitably varies with support for different categories, as also observed in previous studies (Hoover et al., 2020; Trager et al., 2022). Despite some variation in model performance, prior research (Pellert et al., 2022) has validated that when aggregating on the collective level, the time series of sentiments constructed with supervised deep learning detection have strong correlations with those from self-reports.
3.3. Detecting and Measuring Changes
3.3.1. Change point detection
The time series of emotions and morality reveal the complex dynamics of aggregate affect on social media. We define an emotional reaction as a change in the corresponding time series. To detect such change points, we combine two popular methods. The first, cumulative sum (CUSUM) method (Hinkley, 1971), detects a shift of means, and is good at detecting changes like the COVID-19 outbreak, which shifted the baseline emotion and moral sentiment. To detect multiple change points, we use a sliding window to scan the whole time series. We set the window size to be four weeks and slide it every three days for the best precision. Another type of event, such as Valentine’s Day, creates a short surge of emotions, can be better detected with Bayesian Online Change Point Detection (BOCPD) (Adams et al., 2007). It uses Bayesian inference to determine if the next data point is improbable, which is good at detecting sudden changes. We identify a change point to be significant when either CUSUM or BOCPD gives a significant confidence score, using as threshold. We perform change point detection separately for each time series of emotion and morality, because different types of events may elicit different reactions.
3.3.2. Interrupted time series analysis
For each detected change point, we quantify the magnitude of the collective reaction in two aspects, the short-term and the long-term changes. To calculate the short-term change, we use interrupted time series analysis (Penfold and Zhang, 2013; Schaffer et al., 2021). On the time series of daily fraction of each emotional and moral category, we select the time window from seven days before the event to three days after, as discussions on Twitter usually die down within a short time (Leskovec et al., 2009). We perform linear regression for each change point on each time series:
where is the daily fraction of an emotion/morality category, is the time variable, and is a binary indicator which equals 0 before a change point and 1 after the change point. To represent the change associated with an event, we use , the coefficient for the interaction term normalized by the mean of this segment of time series, and convert it to percentage. We also report the p-value from the regression along with the change.
To measure the long-term change, we compute the baseline level as the mean of the time series over seven days before the change point. Then we compare the baseline to the time series value two weeks after the event (we take a five-day average around the two-week mark). The size of the window is empirically chosen to be two weeks so that enough observations are made, but it would not be affected by another event earlier or later. We report the accompanying p-value from Student’s T-test.
3.4. Explaining Changes with Topic Modeling
We try to explain changes in emotions detected by our method using topic modeling. We choose BERTopic (Grootendorst, 2022), a transformer-based language model that extracts highly coherent topics compared to traditional LDA. We evaluate both methods on a set of 10% randomly selected tweets from our data, using a different numbers of topics ranging from 10 to 50 in steps of 10. Over different runs, BERTopic gives higher NPMI coherence scores () compared to LDA (), and similar diversity (Dieng et al., 2020) scores () compared to LDA ().
For each emotional reaction, we extract the topics of tweets that are tagged with that emotion or morality category. We apply BERTopic to tweets within the three-day time window before and after the change, as discussions quickly die on social media (Leskovec et al., 2009). For example, for the Black Lives Matter (BLM) protests starting on 2020-05-26, we extract the topics from tweets posted between 05-23 to 05-25 to develop a baseline and then separately extract the topics between 05-26 to 05-28. By comparing the top 10 baseline topics before the change point with those after the change point, we determine the new topics that emerged after the change points that are possibly relevant to the event. See Table 3 in Appendices for examples.
For preprocessing, we remove URLs and name mentions, transform emojis to their textual descriptions, and split hashtags into individual words. We use the Sentence-BERT “all-MiniLM-L6-v2” model (Reimers et al., 2019) to directly embed the processed English tweets, and “sentence-camembert-large” (Martin et al., 2020) for French tweets. After topic modeling, we remove stopwords in the learned topic keywords. With each emerging topic, we manually verify if there is an associated offline event by examining the tweets belonging to this topic and by searching related news articles. Such manual verification is a necessary and common practice event detection literature (Morabia et al., 2019).
3.5. Evaluation of the Proposed Method
Similar to prior work (Li et al., 2012; Morabia et al., 2019), we use precision and duplicated event rate (DERate) to evaluate our method. Recall is not used because we cannot annotate every tweet to obtain an exhaustive list of events. Precision is the fraction of detected events that are related to realistic events (Allan et al., 1998). We manually verify each event by searching news with topic keywords associated with each change point, which is common practice in event detection research. A false positive is a change point cannot be explained by any topic and/or be related to any real event. Another metric is the Duplicate Event Rate (DERate), the percentage of duplicate detected events among all realistic events detected (Li et al., 2012). We define it as the fraction of emotion and morality categories (out of 21) that detected the same event. The higher DERate shows better confidence. Our precision and DERate for the three datasets are shown in Table 1, and are comparable to prior works (Morabia et al., 2019).
| Dataset | Precision | DERate | # Change Points |
|
||
| 2020 LA Data | 0.84 | 0.18 | 54 | 0.94 0.12 | ||
| 2022 French Election Data | 0.83 | 0.16 | 40 | 0.85 0.19 | ||
| 2022 Abortion Data | 0.82 | 0.16 | 99 | 0.96 0.12 | ||
4. Disentangling Socio-political Events in 2020 Los Angeles
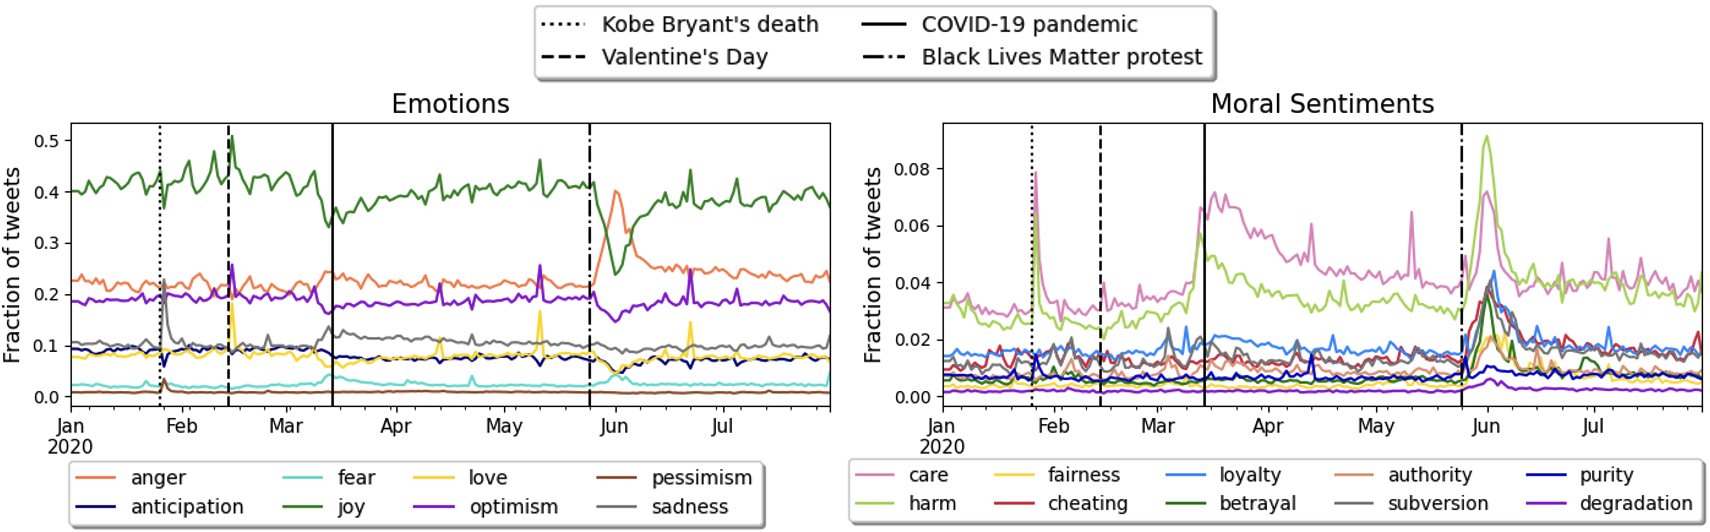
The year of 2020 was a particularly challenging period in the city of Los Angeles. In addition to the world-wide pandemic, which led to a national lockdown mid-March, political primaries were also taking place during this time period, which also saw one of the largest social justice protests triggered by the murder of George Floyd in police custody, as well as the death of a beloved sports icon. These developments had a profound impact, as demonstrated by the many rises and dips in emotions and moral sentiments. Time series of the aggregate affect from January to August 2020 (Fig. 2) shows complex dynamics with seasonal variation (weekly cycles in joy), short-term bursts (spike in love on Valentine’s Day), and long-term changes in emotions and moral sentiments.
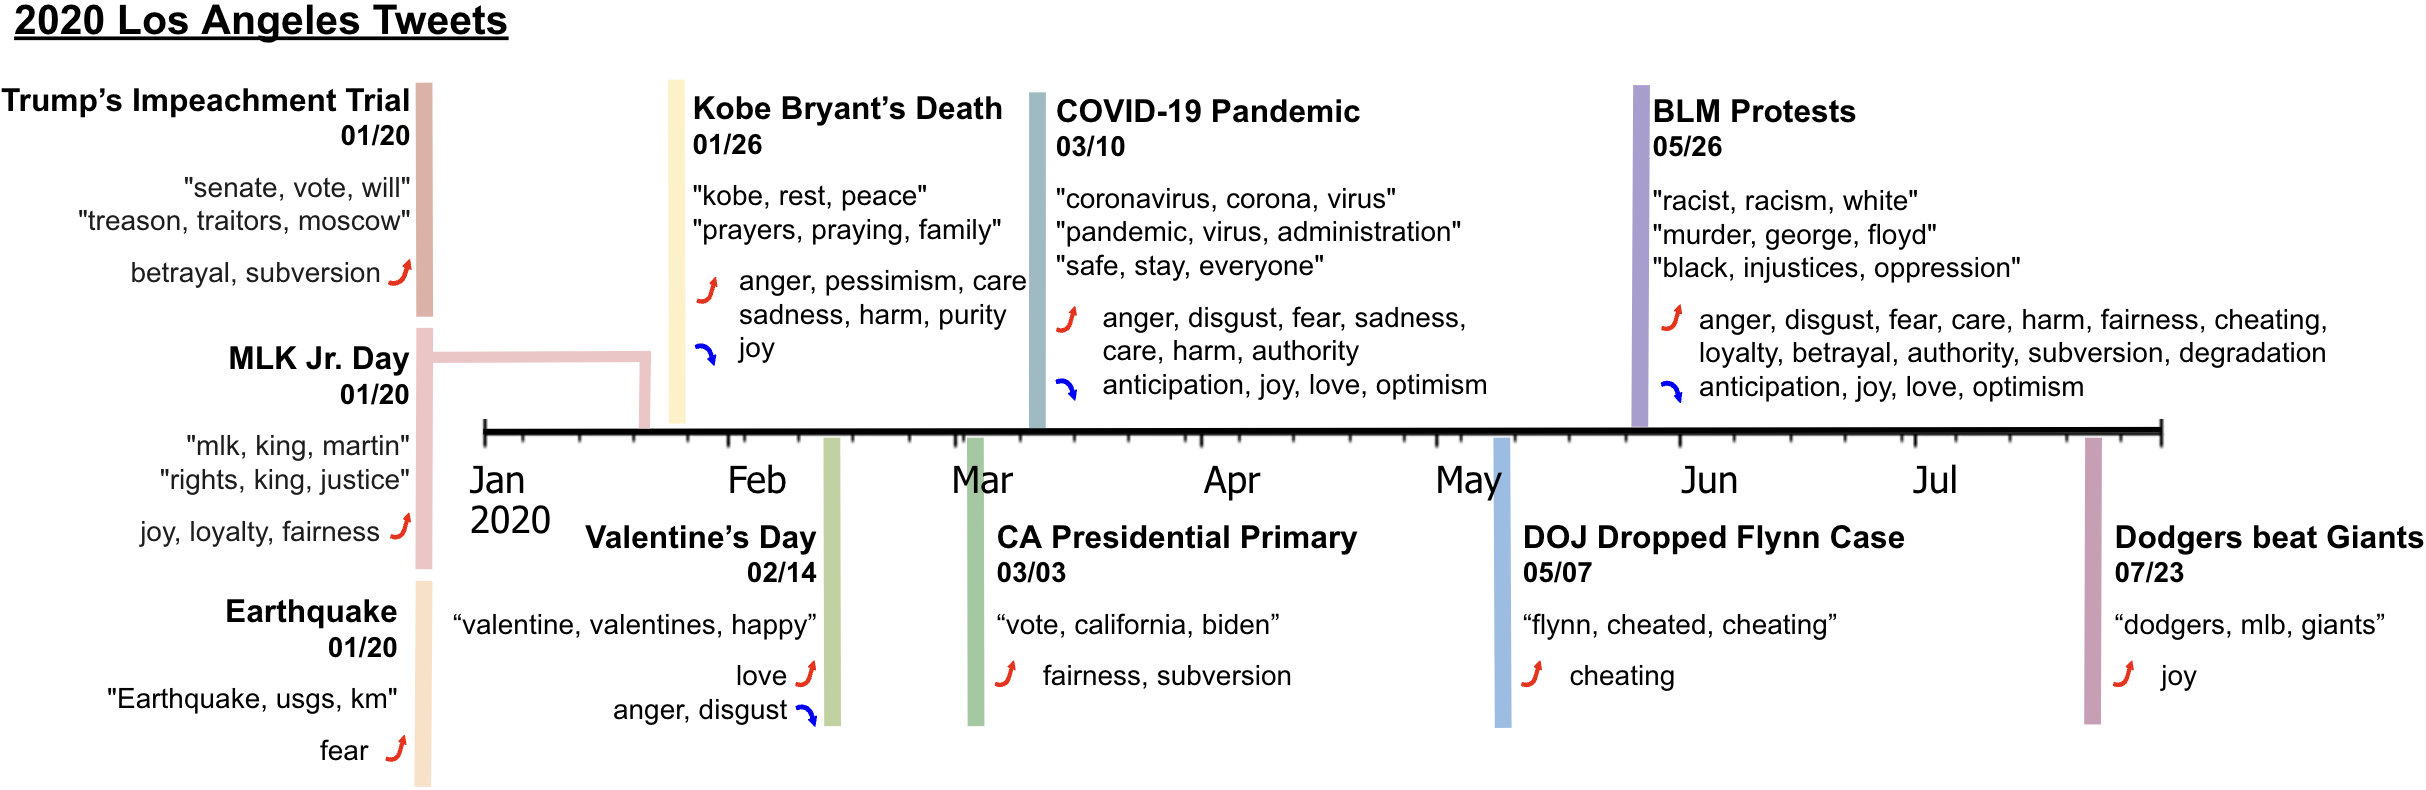
We ran the proposed pipeline to detect and explain the online emotional reactions to events (see Table 4 in Appendices for a full list of detected events). Figure 3 shows that our method is able to identify key events such as the COVID-19 pandemic and the BLM protests. We see the complex reactions to the pandemic along the multiple dimensions of emotions and morality. The unsupervised method also enables us to discover reactions to smaller events that might be easily missed, such as earthquakes and baseball playoffs. We also show that running BERTopic on tweets posted near the event reveals the relevant discussion topics. Further, because we detect changes separately in each emotion, we can disentangle events based on different emotional reactions, even when they take place on the same day: Trump’s impeachment trial was associated with an increase in betrayal and subversion, MLK Day with joy, loyalty and fairness, and an earthquake with fear.
Our proposed method enables us to study collective reactions to events along multiple dimensions of affect. For example, the BLM protests were associated with 16 different emotional and moral changes. We quantify the short-term and long-term percent change in the corresponding collective affect before and after the event for four of the most impactful events (Fig. 4). Consistent with our intuition, Kobe Bryant’s Death was associated with a short-term increase in pessimism and sadness and a decrease in joy, as well as a short-term rise in moral language related to care and harm. In contrast, Valentine’s Day brought a short-term increase in love and a decrease in anger and disgust. No long-term changes were seen with these events. On the other hand, the BLM protests was associated with complex short- and long-term changes in affect. We observe increases in negative emotions and decreases in positive emotions. In addition, compared to other three events, we see greater increases in moral sentiments. The moral concerns about fairness and betrayal had especially increased, expressing a deep sense of the injustice and betrayal in George Floyd’s death.
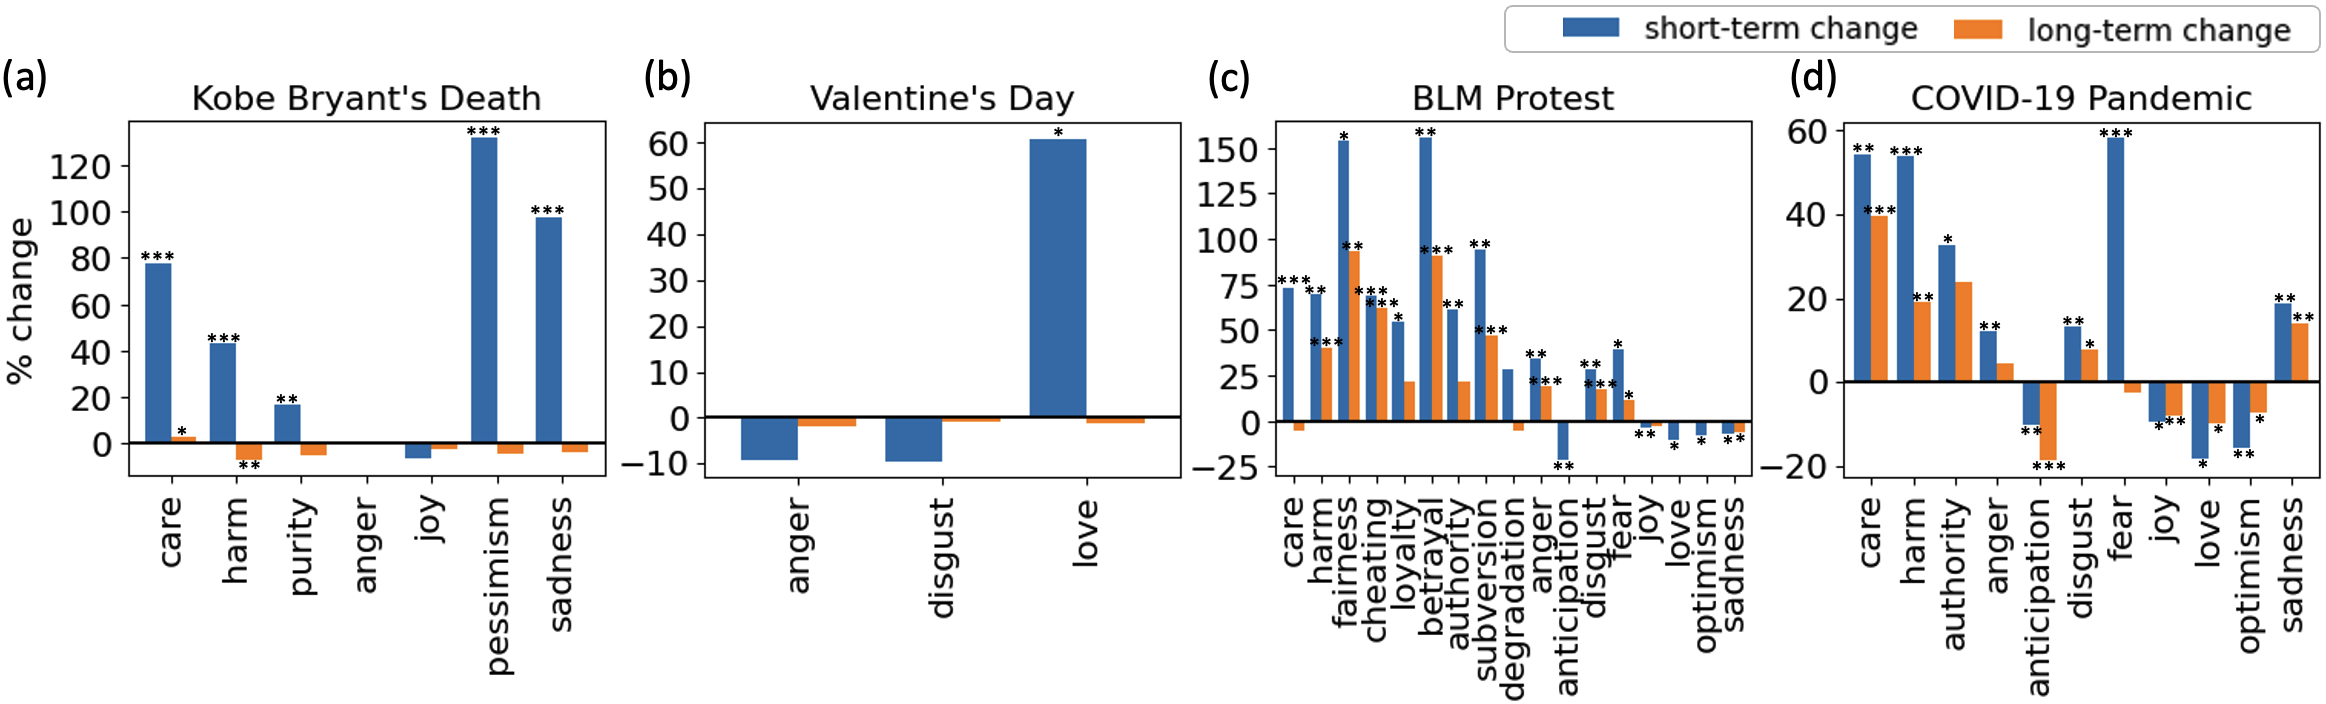
The COVID-19 outbreak triggered a cascade of events aimed at mitigating the pandemic that were associated with complex short-term and long-term changes in affect (Fig. 4d). People expressed more anger, disgust, sadness, and more significantly, fear. Positive emotions like joy and love simultaneously decreased, both in the short-term and the long-term. People also expressed more moral sentiments like care such as in “Stay safe. We thank you”, as well as more harm blaming the virus. Interestingly, the moral language around authority also increased, possibly due to new policies such as lockdowns to mitigate the pandemic (e.g. “I think governor Newsom is doing a great job…”), and some were critical of government’s response, e.g., “we need leadership not a politician”. Because Twitter users are predominantly liberal, and this dataset is collected in Los Angeles (91% users to be liberal and 9% conservative), we found the emotional and moral reactions to these events reflecting liberal perspectives.
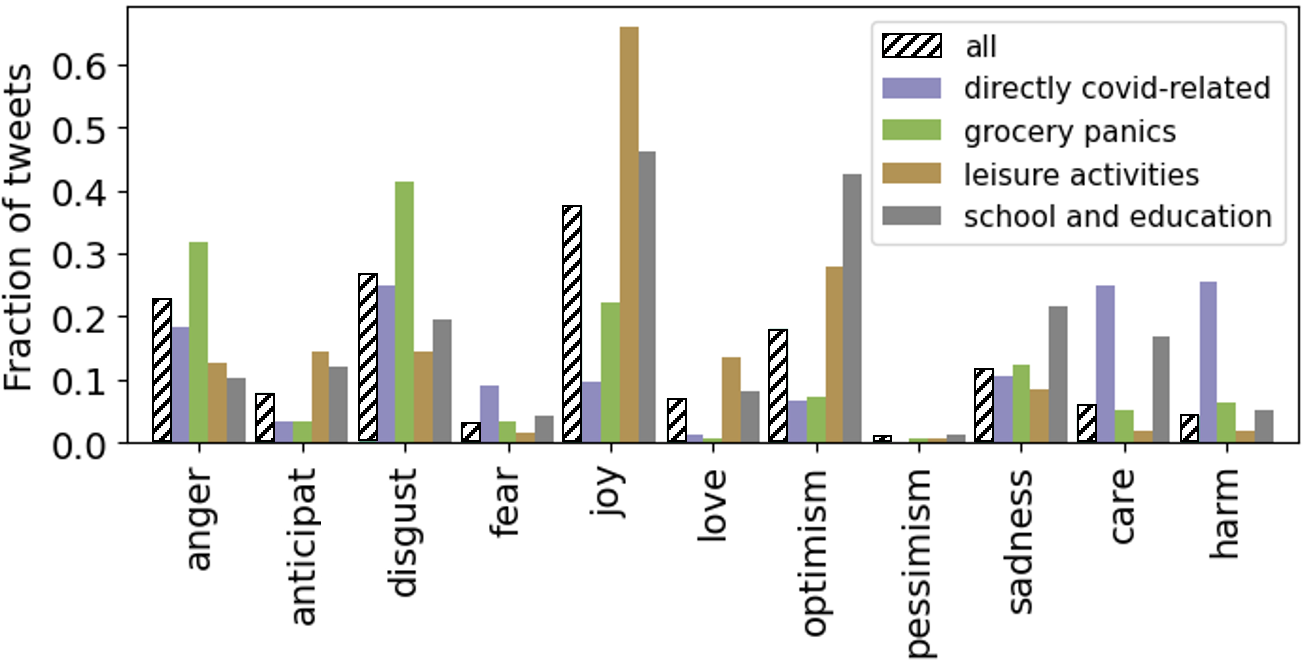
Next, we take a deep dive in the COVID-19 emotion analysis, and show the benefit of disentangling emotional reactions by disaggregating topics. We select four top categories discussed and group related topics into these categories: directly covid-related topics, grocery panics, leisure activities and school and education. We study emotions and moral expressions aggregated in all the tweets, as well as in these topic categories (Fig. 5). We find that aggregating emotions from all tweets can give misleading impressions. Positive emotions like joy were mostly expressed in all tweets (aggregated), but in fact they were mostly dominated by people talking about leisure activities. In COVID-related tweets, few positive emotions were expressed. Anger and disgust were higher in topics about grocery panics than in topics directly related to COVID. Another example is the expression of care and harm moral sentiments. Their expression was diluted by other topics in aggregate tweets. After disaggregating, they were largely expressed in directly COVID-related tweets. These results suggest that during times of maximal crisis and uncertainty, people find outlets for positive emotions. They also demonstrate the importance of disaggregating by topics when studying specific issues like COVID-19 that cover a multitude of fine-grained sub-topics.
5. Unfolding the Evolution of Abortion Rights Discussion
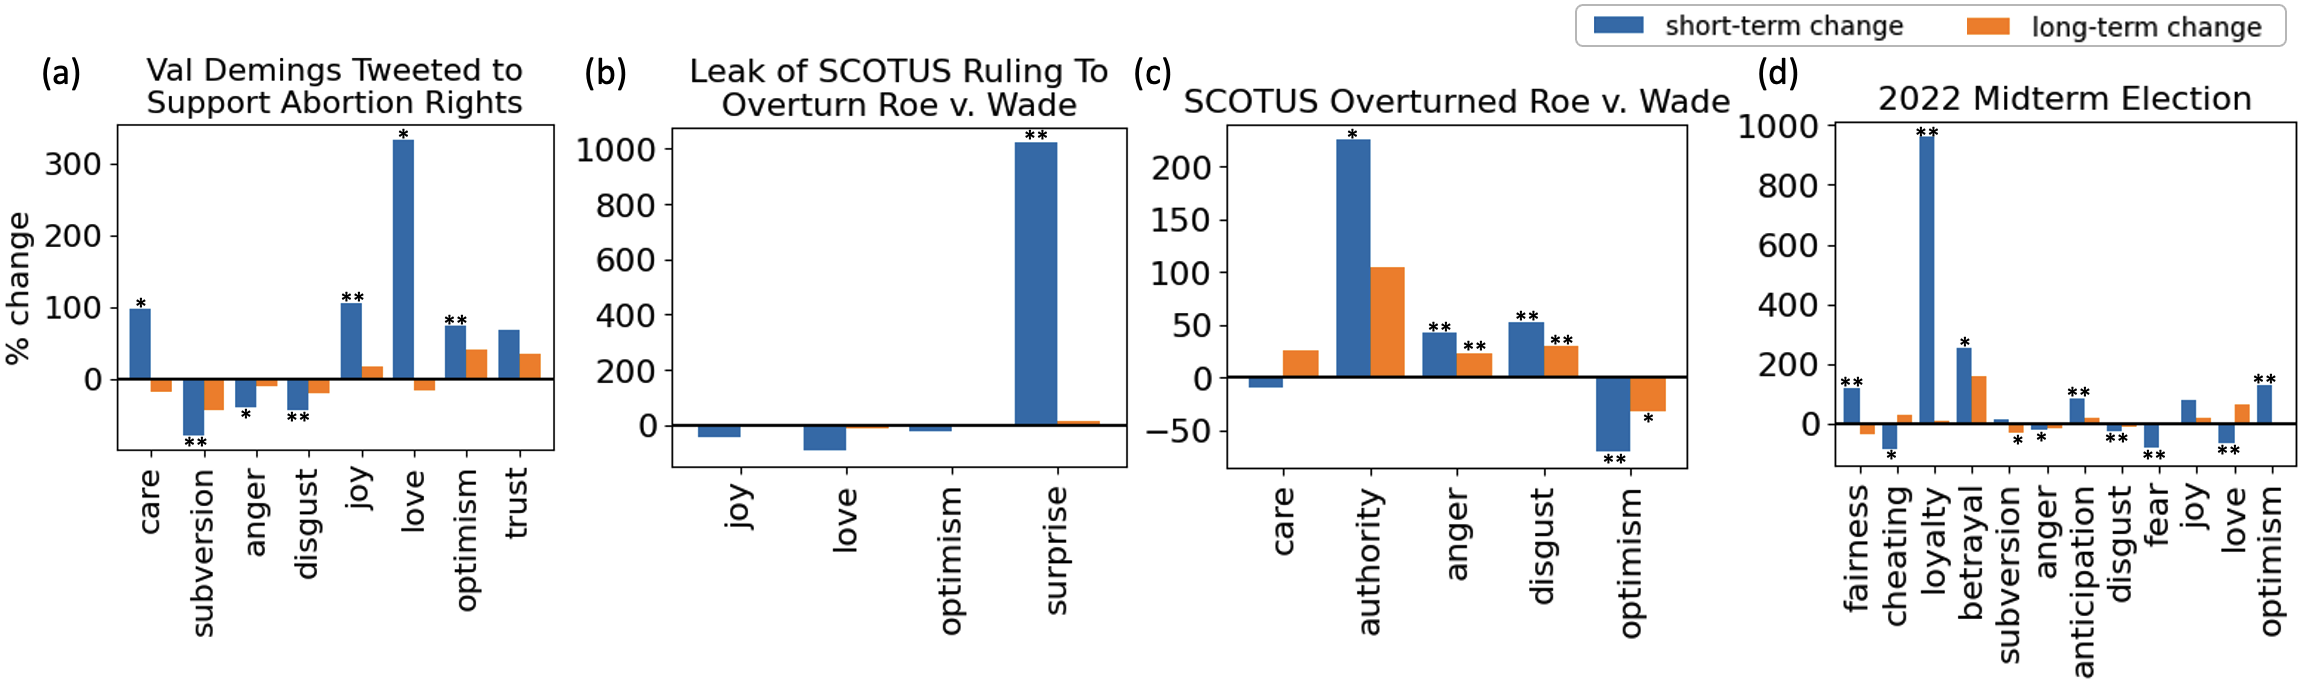
Abortion is one of the most politically charged issues in the U.S. The debate was especially intense in 2022, when the Supreme Court of the United States (SCOTUS) struck down federal protections for abortion rights in its Dobbs v. Jackson Women’s Health Organization ruling on June 24, 2022. This decision overturned the nearly 50 year old precedent set by the Roe vs Wade decision, which guaranteed women in U.S. access to abortion. In the 2022 Abortion Tweets data, we have identified a total of 24 different events, unfolding the evolution of abortion discussions on Twitter (Figure 6). See a full list of events detected in Table 5. We detected major events, such as the leak of SCOTUS ruling on May 3rd, to which people expressed over 1000% more surprise (Fig. 7b), and the overturning of Roe v. Wade on June 24th, followed by a surge of strong emotional reactions, including increasing anger and disgust, and a dip in care and optimism (Fig. 7c). This finding is consistent with the previous work by Rao et al.. Along with the SCOTUS ruling, multiple states had issued abortion bans, which further provoked online debates. We detected the issuing of abortion bans in Florida and Oklahoma on March 4th and April 5th, respectively, and observed surging negative moral sentiments, such as harm, cheating and subversion. In the contrast, when Kansas voted to keep abortion legal on August 3rd, anticipation and trust was expressed.
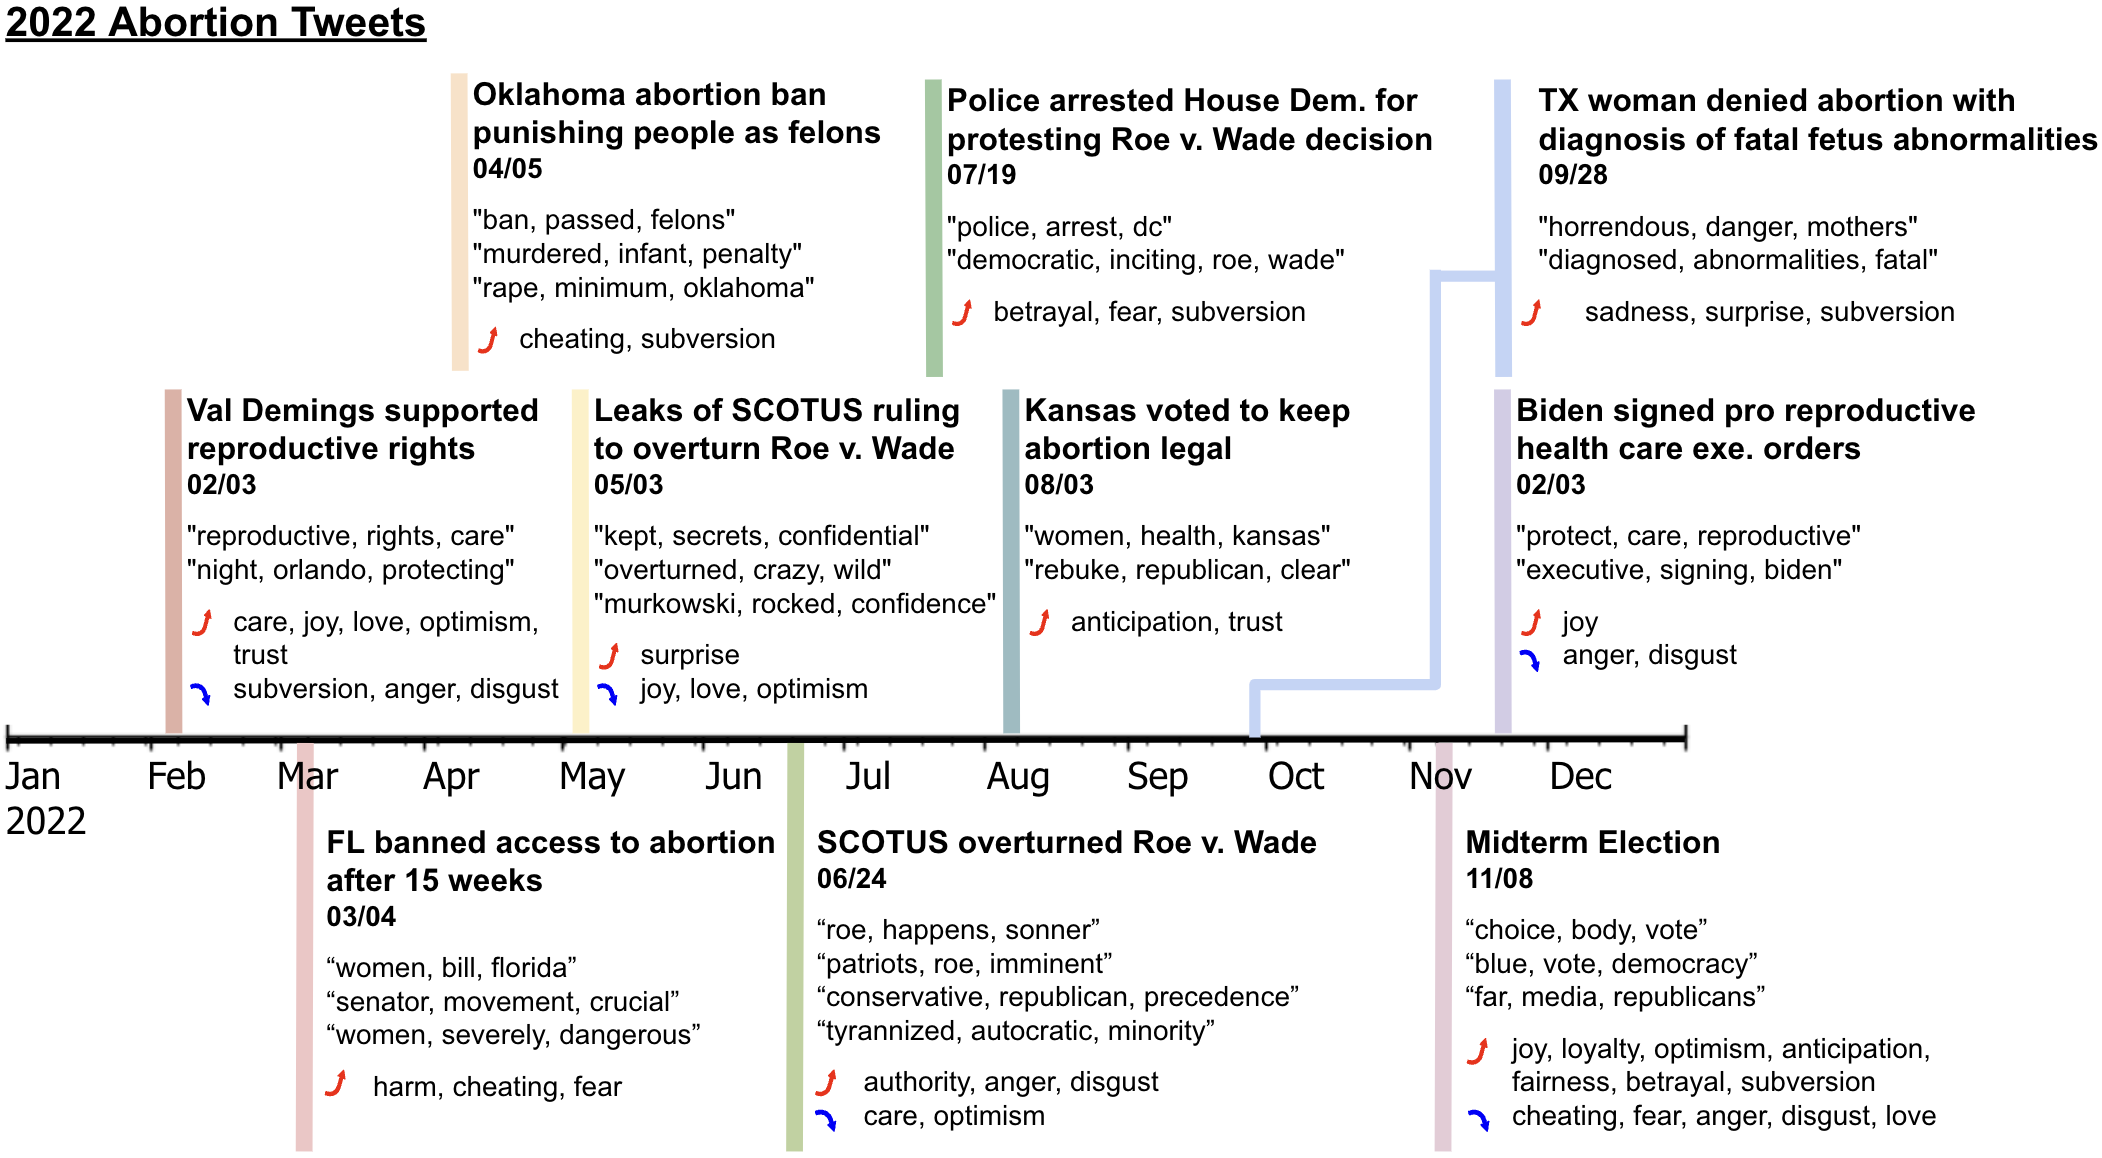
This historical SCOTUS ruling did not only elicit temporary emotional reactions, but its impact is long term. We detected multiple protests as well as police arrests of protesters, accompanied by online discussions expressing betrayal, subversion, fear and sadness. There were also viral stories of individuals experiencing health and legal crises because of the ruling. One example is a woman in Texas who was denied an abortion even with diagnosis of fatal fetal abnormalities. Increasing surprise, sadness and subversion were detected in these discussions (Figure 6 and Table 5).
Another important and long-term impact of this ruling was in the 2022 US Midterm Election. Many congressmen pushed out agendas related to abortion rights. Some Democrats such as Biden and Val Demings stated their support for abortion rights (Figure 6). In response, we detected increasing care, love, and trust in the dataset. On the other hand, some Republicans implied a pro-life stance (e.g. event 3 and 11 in Table 5). When the Midterm Election happened on November 8th, we observed a complex emotional and moral reaction (Fig. 7d). In general, positive emotions and moral sentiments such as loyalty, anticipation and optimism increased, whereas negative emotions decreased, indicating people were hoping for their favored election results.
The 24 events we detected in this dataset include major and momentous events, small events such as people re-sharing a viral tweet, as well as events that took place closely in time and even on the same day (Table 5). This demonstrates again the effectiveness of our proposed method to automatically detect emotional reactions. Last but not least, the emotional and moral reactions to most of these events are left-leaning, similar to that in the Los Angeles dataset. This can be explained by that Twitter users are predominantly liberal. In this dataset, we found 72% users to be liberal and 28% conservative (Rao et al., 2023).
6. Understanding Emotion Dynamics in the 2022 French Election
Our third case study is the 2022 French Election, mainly among Emmanuel Macron, Marine Le Pen and Jean-Luc Mélenchon. This election took place close in time to the Russia-Ukraine War, which started in February 2022, and the G7 Summit in June, adding complications to the study of emotional reactions in the online population. Previous reports have shown that the Russia-Ukraine war had significant implications for the election campaigns, especially a positive effect on Macron’s polling (Schofield, 2022). On the Twitter dataset, we are able to detect both the first and second rounds of presidential elections on April 10th and April 24th, as well as the two rounds of legislative elections on June 12th and June 19th. In addition, we have also detected the G7 summit and various events related to the Russia-Ukraine war, including the initial invasion, the sinking of a Russian warship, and Russia cutting off natural gas to East Europe (Figure 8 and Table 6). The online discussions about the election also involved topics about the Russia-Ukraine war, such as “ukraine, conflict, economics”.
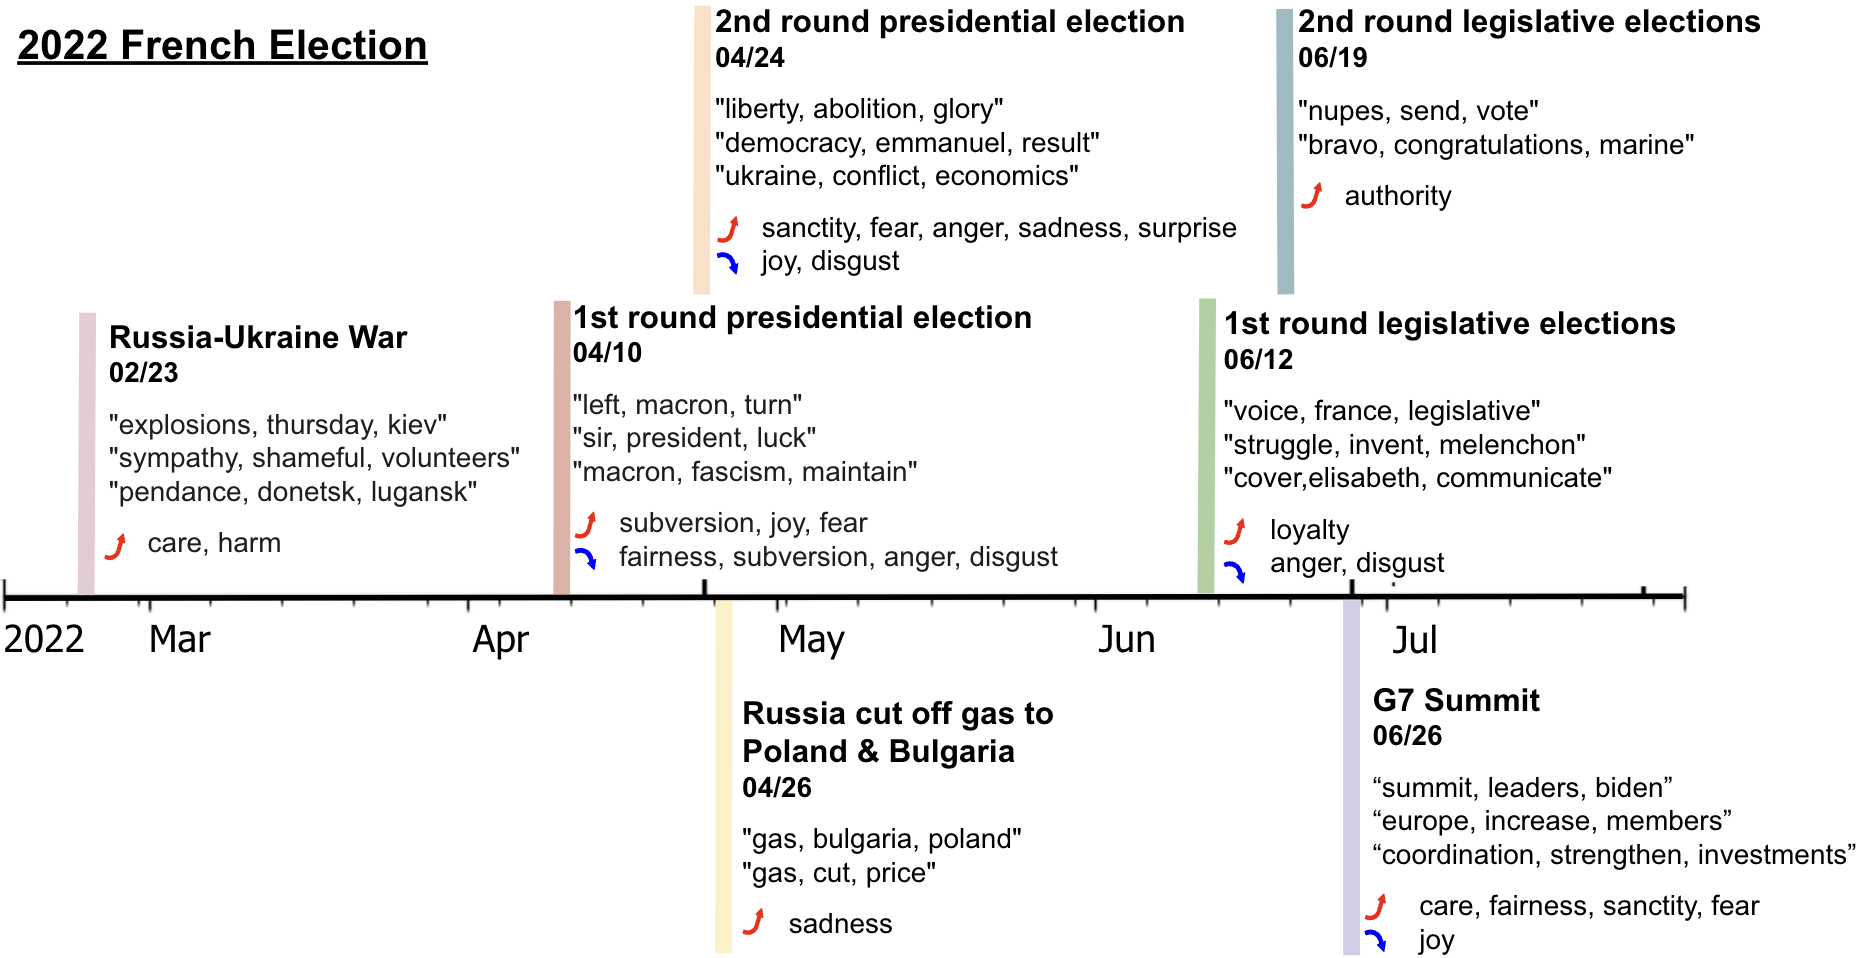
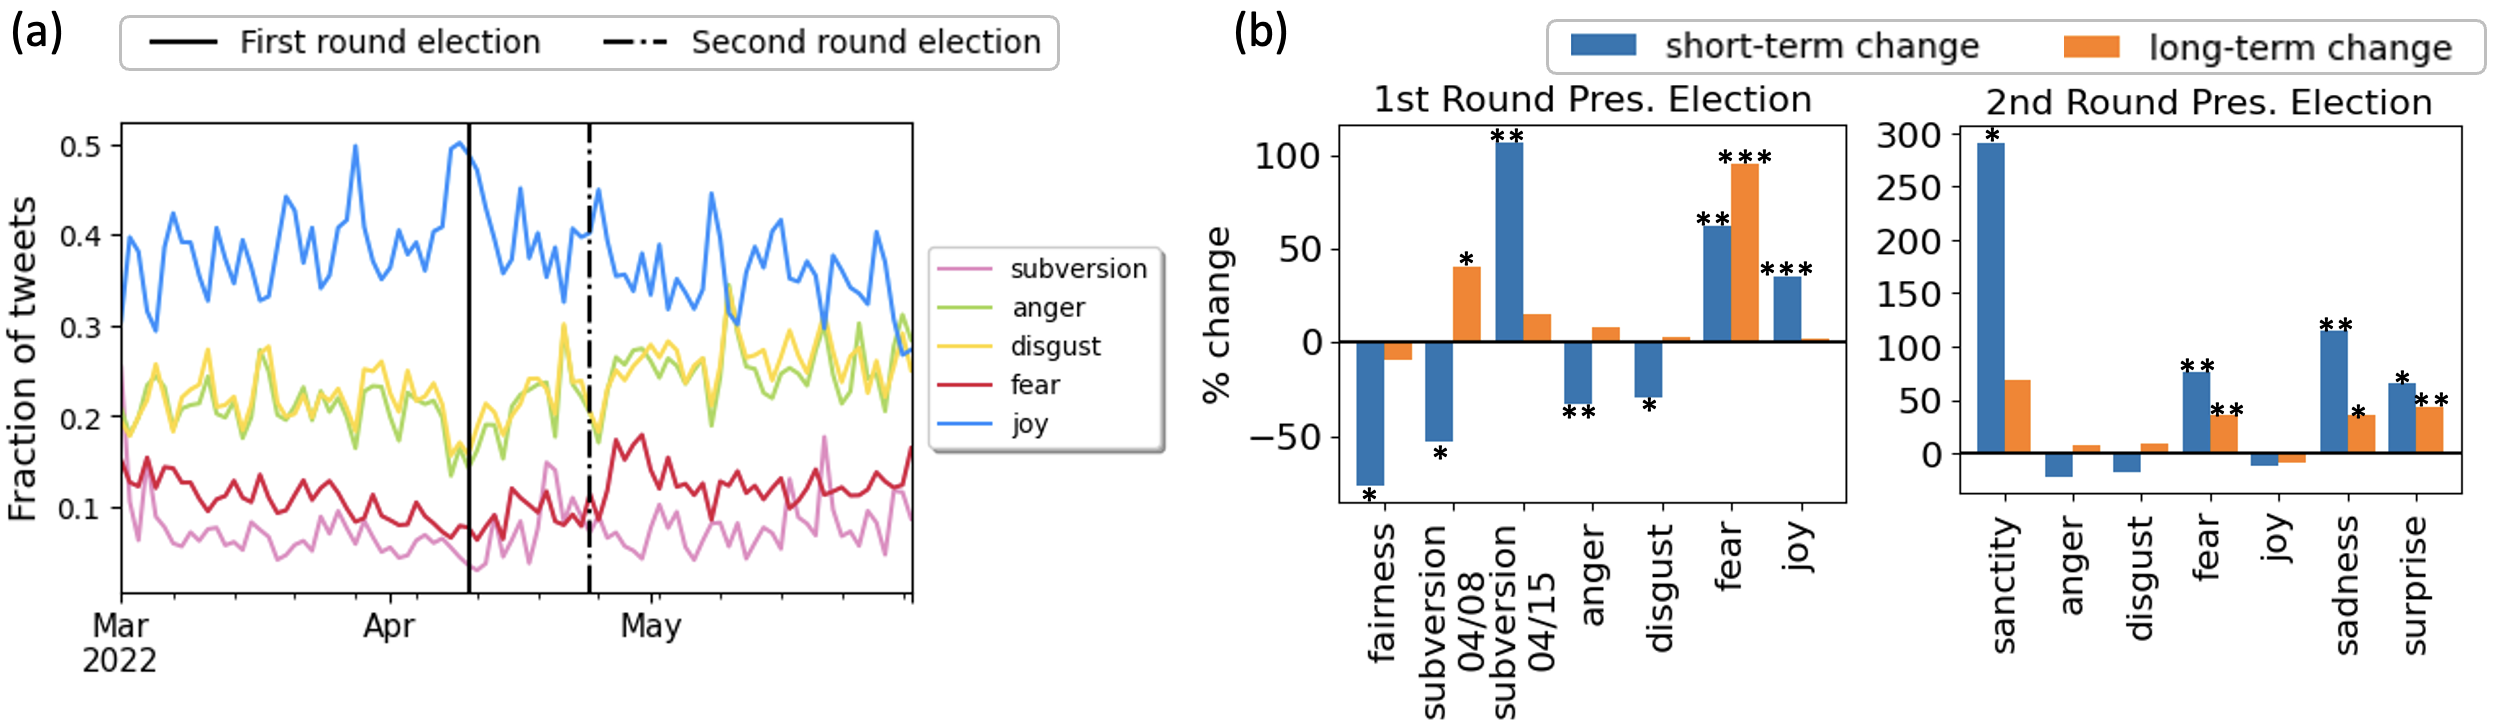
Next, we analyze the dynamics of emotions and moral sentiments during the presidential election cycle. The change points in different emotion and moral categories are detected in a relatively wide range of dates, from 04/07 to 04/15 for the first round, which actually happened on 04/10, and from 04/21 to 04/26 for the second round, which took place on 04/24. This indicates the convoluted influence of the voting rounds. We found an interesting pattern, that positive emotions and moral sentiments increased before each voting round, but negative sentiments surged up right after the voting round. This is reflected in the time series with the zigzag shapes in Figure 9a. For example, anger and subversion first surged then dipped between two rounds, whereas joy moved in the opposite way, dipping first and then surging between the two rounds. This indicates that people were showing hope and support before each voting round, but started to reflect and criticize after the voting finished and results came out. Fig. 9b also reveals similar patterns. The most interesting example is the changes in subversion. There were two change points detected in subversion. It decreased by 52.77% on 04/08 before the first voting round, but significantly increased by 107.12% on 04/15 after, and then dropped again right before the second round election started. These change points are consistent with the time series pattern shown in Fig. 9a. In addition, we also observe the significant increase in fear after each voting round. These again show people’s hope before voting, and negativity and fear after voting results revealed.
In the French Election dataset, we have successfully detected all events related to the election and those related to the war. Furthermore, we are able to disentangle the complicated dynamics of emotion and moral changes, benefiting from the proposed change point detection method.
7. Conclusion
In this work, we have demonstrated the effectiveness of an unsupervised method to detect and measure public reactions to newsworthy events. We applied our method to three large Twitter datasets. We have disentangled the dynamics of online emotions during a time period punctuated by complex social, health, and political events in the 2020 Los Angeles data, studied the evolution of abortion rights discussion along with the overturning of Roe v. Wade in 2022, and revealed the interesting dynamics of emotions during the 2022 French election. We showed that our method can discover major and subtle events and even events that happened closely in time, and measure emotional and moral reactions to these events. In addition, we demonstrated, using the example of COVID-19 outbreak, the importance of disaggregating by topics when further understand the complex impact of some major events. Together, these results suggests the potential of using social media data for sensing and tracking of public reactions to events, as well as discovering significant events that may have been missed by traditional news sources.
Limitations and Future Works
First, Twitter users are predominantly liberal. Hence the emotional reaction analysis we present inevitably include more left-leaning perspectives, especially in the U.S. tweet datasets. In the future we plan to split data by demographic groups and analyze the heterogeneity in different user groups. Second, with our emotional reaction detection method, when there is a change point that is a dip, we cannot use topic modeling to explain it, as a dip in the emotion or moral sentiment indicates a decrease of discussion related to an event. However, usually the decrease of some emotions is accompanied by the increase of some other emotions, and we can study the tweets tagged with the surged emotions to understand the topics.
In future works we plan to move forward to causal analysis. In principle, the offline events cause the online emotional and moral reactions. However, there are many confounding factors in this causal process. For example, the same event might pose very different effects on heterogeneous online populations. We plan to expand this work by performing causal analysis to further disentangle the causal relationships between offline events and online emotions, and to measure the heterogeneous effects on different online populations.
Acknowledgements.
This work is supported in part by AFOSR under grants FA9550-22-1-0380 & FA9550-20-1-0224, and DARPA under contract HR001121C0168. The authors thank Eugene Jang and Yuanfeixue Nan from University of Southern California for helping with emotion and moral foundation annotations.References
- (1)
- Adams et al. (2007) Ryan Prescott Adams et al. 2007. Bayesian online changepoint detection. arXiv preprint arXiv:0710.3742 (2007).
- Aldous et al. (2022) Kholoud Khalil Aldous et al. 2022. Measuring 9 emotions of news posts from 8 news organizations across 4 social media platforms for 8 months. ACM Transactions on Social Computing (TSC) 4, 4 (2022), 1–31.
- Alhuzali et al. (2021) Hassan Alhuzali et al. 2021. SpanEmo: Casting Multi-label Emotion Classification as Span-prediction. In ECACL. ACL, 1573–1584.
- Allan et al. (1998) James Allan et al. 1998. Topic Detection and Tracking Pilot Study Final Report. (1998). https://doi.org/10.1184/R1/6626252.v1
- Babac (2022) Marina Bagić Babac. 2022. Emotion analysis of user reactions to online news. Information Discovery and Delivery ahead-of-print (2022).
- Barbieri et al. (2022) Francesco Barbieri, Luis Espinosa Anke, and Jose Camacho-Collados. 2022. XLM-T: Multilingual language models in twitter for sentiment analysis and beyond. In LREC. 258–266.
- Blei et al. (2003) David M Blei et al. 2003. Latent dirichlet allocation. JMLR 3, Jan (2003), 993–1022.
- Bollen et al. (2011) Johan Bollen et al. 2011. Twitter mood predicts the stock market. Journal of computational science 2, 1 (2011), 1–8.
- Cao et al. (2021) Yuwei Cao et al. 2021. Knowledge-preserving incremental social event detection via heterogeneous gnns. In In WWW. 3383–3395.
- Chang et al. (2023) Rong-Ching Chang, Ashwin Rao, Qiankun Zhong, Magdalena Wojcieszak, and Kristina Lerman. 2023. # RoeOverturned: Twitter Dataset on the Abortion Rights Controversy. In Proceedings of the International AAAI Conference on Web and Social Media, Vol. 17. 997–1005.
- Cody et al. (2015) Emily M Cody et al. 2015. Climate change sentiment on Twitter: An unsolicited public opinion poll. PloS one 10, 8 (2015), e0136092.
- Dieng et al. (2020) Adji B. Dieng et al. 2020. Topic Modeling in Embedding Spaces. TACL 8 (2020), 439–453. https://doi.org/10.1162/tacl_a_00325
- Dodds et al. (2022) Dodds et al. 2022. Fame and Ultrafame: Measuring and comparing daily levels of ‘being talked about’ for United States’ presidents, their rivals, God, countries, and K-pop. JQD:DM 2 (Feb. 2022). https://doi.org/10.51685/jqd.2022.004
- Dodds et al. (2011) Peter Dodds et al. 2011. Temporal patterns of happiness and information in a global social network: Hedonometrics and Twitter. PloS one 6, 12 (2011), e26752.
- Garten et al. (2018) Justin Garten et al. 2018. Dictionaries and distributions: Combining expert knowledge and large scale textual data content analysis: Distributed dictionary representation. Behavior Research Methods, Instruments, and Computers 50, 1 (1 Feb. 2018), 344–361. https://doi.org/10.3758/s13428-017-0875-9
- Golder et al. (2011) Scott A Golder et al. 2011. Diurnal and seasonal mood vary with work, sleep, and daylength across diverse cultures. Science 333, 6051 (2011), 1878–1881.
- Grootendorst (2022) Maarten Grootendorst. 2022. BERTopic: Neural topic modeling with a class-based TF-IDF procedure. arXiv preprint arXiv:2203.05794 (2022).
- Guo et al. (2023a) Siyi Guo et al. 2023a. A Data Fusion Framework for Multi-Domain Morality Learning. In In ICWSM-2023, Vol. 17. 281–291.
- Guo et al. (2023b) Siyi Guo et al. 2023b. Measure Online Emotional Reactions to Events. In Proceedings of ASONAM ’23. Association for Computing Machinery, New York, NY, USA.
- Haidt et al. (2007) Jonathan Haidt et al. 2007. The moral mind: How five sets of innate intuitions guide the development of many culture-specific virtues, and perhaps even modules. The innate mind 3 (2007), 367–391.
- Hauthal et al. (2019) Eva Hauthal et al. 2019. Analyzing and visualizing emotional reactions expressed by emojis in location-based social media. ISPRS International Journal of Geo-Information 8, 3 (2019), 113.
- He et al. (2022) Zihao He, Negar Mokhberian, and Kristina Lerman. 2022. Infusing Knowledge from Wikipedia to Enhance Stance Detection. In Proceedings of the 12th Workshop on Computational Approaches to Subjectivity, Sentiment & Social Media Analysis. 71–77.
- Hinkley (1971) David V Hinkley. 1971. Inference about the change-point from cumulative sum tests. Biometrika 58, 3 (1971), 509–523.
- Hoover et al. (2020) Joe Hoover et al. 2020. Moral Foundations Twitter Corpus: A Collection of 35k Tweets Annotated for Moral Sentiment. Social Psychological and Personality Science 11, 8 (2020), 1057–1071. https://doi.org/10.1177/1948550619876629
- Jaidka et al. (2020) Kokil Jaidka et al. 2020. Estimating geographic subjective well-being from Twitter: A comparison of dictionary and data-driven language methods. PNAS 117, 19 (2020), 10165–10171.
- Klašnja et al. (2018) Marko Klašnja et al. 2018. Measuring Public Opinion with Social Media Data. Oxford University Press.
- Leskovec et al. (2009) Jure Leskovec et al. 2009. Meme-tracking and the dynamics of the news cycle. In Proceedings of the 15th ACM SIGKDD. 497–506.
- Li et al. (2012) Chenliang Li et al. 2012. Twevent: Segment-Based Event Detection from Tweets (CIKM ’12). ACM, New York, NY, USA, 155–164. https://doi.org/10.1145/2396761.2396785
- Malik et al. (2022) Muzamil Malik et al. 2022. A Performance Comparison of Unsupervised Techniques for Event Detection from Oscar Tweets. Computational Intelligence and Neuroscience 2022 (2022).
- Martin et al. (2020) Louis Martin, Benjamin Muller, Pedro Javier Ortiz Suárez, Yoann Dupont, Laurent Romary, Éric Villemonte de la Clergerie, Djamé Seddah, and Benoît Sagot. 2020. CamemBERT: a Tasty French Language Mode. Proceedings of the 58th Annual Meeting of the Association for Computational Linguistics (2020).
- Mirlohi Falavarjani et al. (2021) Seyed Amin Mirlohi Falavarjani, Jelena Jovanovic, Hossein Fani, Ali A Ghorbani, Zeinab Noorian, and Ebrahim Bagheri. 2021. On the causal relation between real world activities and emotional expressions of social media users. Journal of the Association for Information Science and Technology 72, 6 (2021), 723–743.
- Mitchell et al. (2013) Lewis Mitchell et al. 2013. The geography of happiness: Connecting twitter sentiment and expression, demographics, and objective characteristics of place. PloS one 8, 5 (2013), e64417.
- Mohammad et al. (2018) Saif Mohammad et al. 2018. SemEval-2018 Task 1: Affect in Tweets. In Proc. 12th Int. Workshop on Semantic Evaluation. 1–17.
- Morabia et al. (2019) Keval Morabia et al. 2019. SEDTWik: Segmentation-based Event Detection from Tweets Using Wikipedia. In NACCL workshop. 77–85.
- Niu et al. (2015) Liqiang Niu et al. 2015. Topic2Vec: Learning distributed representations of topics. In 2015 IALP. IEEE, 193–196.
- Pellert et al. (2022) Max Pellert et al. 2022. Validating daily social media macroscopes of emotions. Scientific Reports 12, 1 (2022), 11236.
- Penfold and Zhang (2013) Robert B Penfold and Fang Zhang. 2013. Use of interrupted time series analysis in evaluating health care quality improvements. Academic pediatrics 13, 6 (2013), S38–S44.
- Rao et al. (2023) Ashwin Rao, Rong-Ching Chang, Qiankun Zhong, Kristina Lerman, and Magdalena Wojcieszak. 2023. Tracking a Year of Polarized Twitter Discourse on Abortion. arXiv preprint arXiv:2311.16831 (2023).
- Reimers et al. (2019) Nils Reimers et al. 2019. Sentence-BERT: Sentence Embeddings using Siamese BERT-Networks. In In EMNLP-2019. ACM.
- Rezaei et al. (2022) Zahra Rezaei et al. 2022. Event detection in twitter by deep learning classification and multi label clustering virtual backbone formation. Evolutionary Intelligence (2022), 1–15.
- Sandoval-Almazan et al. (2020) Rodrigo Sandoval-Almazan et al. 2020. Sentiment analysis of facebook users reacting to political campaign posts. Digital Government: Research and Practice 1, 2 (2020), 1–13.
- Schaffer et al. (2021) Andrea L Schaffer, Timothy A Dobbins, and Sallie-Anne Pearson. 2021. Interrupted time series analysis using autoregressive integrated moving average (ARIMA) models: a guide for evaluating large-scale health interventions. BMC medical research methodology 21, 1 (2021), 1–12.
- Schofield (2022) Hugh Schofield. 2022. French elections: Putin’s war gives Macron boost in presidential race. https://www.bbc.com/news/world-europe-60793320
- Trager et al. (2022) Jackson Trager et al. 2022. The Moral Foundations Reddit Corpus. arXiv preprint arXiv:2208.05545 (2022).
- Tumasjan et al. (2010) Andranik Tumasjan et al. 2010. Predicting elections with twitter: What 140 characters reveal about political sentiment. In In ICWSM-2010, Vol. 4. 178–185.
- vanKleef et al. (2016) Gerben A. vanKleef et al. 2016. Editorial: The Social Nature of Emotions. Frontiers in Psychology 7 (2016), 896.
- Weng et al. (2011) Jianshu Weng et al. 2011. Event detection in twitter. In In ICWSM-2011, Vol. 5. 401–408.
Appendix A Evaluation of Emotion and Morality Detection
We evaluate the effectiveness of emotion and morality detection on a random subset of 850 tweets from the Los Angeles dataset, considering the annotation process is labor and time intensive. We required five educated annotators to go through two training sessions, wherein they annotated 50 random tweets and discussed to improve the agreement on the definitions of emotions and morality. Then each annotator individually annotated all 850 tweets. Given the subjectivity of moral and emotional judegments, the Fleiss’s for emotion categories ranges in . For morality categories, it ranges in . Similar to prior works (Mohammad et al., 2018; Hoover et al., 2020), we have found the scores of some categories to be low. However, our agreement is still comparable, and on some categories, even better than these prior works. When comparing model performance with the baselines, our methods outperform baselines on most categories (Table 2).
| Emotion | Fleiss’s | F1-Score | Support | Morality | Fleiss’s | F1-Score | Support | ||
| Emolex | Ours | DDR | Ours | ||||||
| anger | 0.49 | 0.28 | 0.45 | 93 | care | 0.29 | 0.54 | 0.47 | 63 |
| anticipation | 0.32 | 0.12 | 0.40 | 43 | harm | 0.28 | 0.18 | 0.36 | 60 |
| disgust | 0.46 | 0.33 | 0.53 | 116 | fairness | 0.17 | 0.17 | 0.25 | 10 |
| fear | 0.22 | 0.00 | 0.37 | 113 | cheating | 0.28 | 0.20 | 0.43 | 31 |
| joy | 0.48 | 0.25 | 0.37 | 113 | loyalty | 0.18 | 0.00 | 0.05 | 8 |
| love | 0.66 | N/A | 0.71 | 122 | betrayal | 0.01 | 0.00 | 0.00 | 1 |
| optimism | 0.37 | 0.15 | 0.34 | 58 | authority | 0.45 | 0.00 | 0.32 | 24 |
| pessimism | 0.26 | 0.20 | 0.08 | 82 | subversion | 0.60 | 0.15 | 0.37 | 78 |
| sadness | 0.53 | 0.15 | 0.45 | 66 | purity | 0.49 | 0.27 | 0.56 | 35 |
| surprise | 0.51 | 0.06 | 0.44 | 33 | degradation | 0.22 | 0.21 | 0.33 | 23 |
| trust | 0.30 | 0.00 | 0.43 | 22 | |||||
Appendix B Detecting emerging topics after change point
To determine the new topics relevant to each change point, we compare the top 10 topics before the change point with those after the change point. Table 3 shows some examples. The newly emerged topics are highlighted in bold. For most reactions, regardless of how small or impactful, the identified topics clearly relate to an offline event (e.g. row 1). For the second example (row 2), the newly emerged topics point us to several different events. However, by examining the tweets belonging to these topics, we found the Black Lives Matter protests was the most predominant event, and other emerging topics such as “america, vote, trump” and “covid, coronavirus, tested” were related to the protests. Finally, there are also some change points for which we cannot identify meaningful emerging topics (e.g. row 3). We decide whether it is a false positive through manual verification.
|
Emotion | Event | Topics Before Change Point | Topics After Change Point | ||||||||||||||
| 1 | 2020-05-26 | Betrayal |
|
“president”, “wearing, masks, mask” |
|
|||||||||||||
| 2 | 2020-05-29 | Care |
|
|
|
|||||||||||||
| 3 | 2020-06-01 | Pessimism | Unknown |
|
|
|||||||||||||
Appendix C All Events Detected in Different Datasets
The following tables show all the events detected for each dataset.
| Event | Date | Time Window | Peaking Emotion/MF | Declining Emotion/MF | Relevant Topics | |||||||||||
| 1 |
|
01-20 | 01-17 to 01-20 | joy, loyalty, fairness |
|
|||||||||||
| 2 |
|
01-20 | 01-20 to 01-21 | betrayal, subversion |
|
|||||||||||
| 3 | Earthquake | 01-20 | 01-20 | fear | “earthquake, usgs, km” | |||||||||||
| 4 | Kobe Bryant’s death | 01-26 | 01-26 |
|
joy |
|
||||||||||
| 5 |
|
02-03 | 02-03 | anger, disgust, authority |
|
|||||||||||
| 6 | Valentine’s Day | 02-14 | 02-14 | love | anger, disgust | “valentine, valentines, happy” | ||||||||||
| 7 |
|
03-03 | 03-02 to 03-03 | fairness, subversion |
|
|||||||||||
| 8 | COVID-19 pandemic | 03-10 | 03-09 to 03-11 |
|
|
|
||||||||||
| 9 |
|
04-03 | 04-03 | cheating | “usgs, reports, quake” | |||||||||||
| 10 |
|
05-07 | 05-07 | cheating | “flynn, cheated, cheating” | |||||||||||
| 11 |
|
05-11 | 05-11 | subversion | “obama, trump, president” | |||||||||||
| 12 |
|
05-26 | 05-25 to 05-30 |
|
|
|
||||||||||
| 13 |
|
06-27 | 06-27 | betrayal |
|
|||||||||||
| 14 |
|
07-23 | 07-23 | joy | “dodgers, mlb, giants” | |||||||||||
| Event | Date | Time Window | Peaking Emotion/MF | Declining Emotion/MF | Relevant Topics | ||||||||||
| 1 |
|
01-18 | 01-18 |
|
|
||||||||||
| 2 |
|
01-18 | 01-18 |
|
|
|
|||||||||
| 3 |
|
01-20 | 01-20 |
|
|
|
|||||||||
| 4 |
|
01-24 | 01-24 to 01-25 |
|
|
||||||||||
| 5 |
|
02-03 | 02-03 to 02-04 |
|
|
|
|||||||||
| 6 |
|
03-04 | 03-04 |
|
|
||||||||||
| 7 |
|
03-08 | 03-08 to 03-10 |
|
|
||||||||||
| 8 |
|
03-21 | 03-21 |
|
|
||||||||||
| 9 |
|
03-23 | 03-23 |
|
|
||||||||||
| 10 |
|
04-05 | 04-05 |
|
|
||||||||||
| 11 |
|
04-27 | 02-26 to 02-28 |
|
|
||||||||||
| 12 |
|
05-03 | 05-02 to 05-03 |
|
|
|
|||||||||
| 13 |
|
05-24 | 05-23 to 05-25 |
|
|
|
|||||||||
| 14 |
|
06-14 | 06-14 |
|
|
||||||||||
| 15 |
|
06-17 | 06-17 |
|
|
||||||||||
| 16 |
|
06-24 | 06-21 to 06-24 |
|
|
|
|||||||||
| 17 |
|
07-19 | 07-19 to 07-21 |
|
|
||||||||||
| 18 |
|
08-03 | 08-02 to 08-03 |
|
|
||||||||||
| 19 |
|
08-08 | 08-08 to 08-09 |
|
|
||||||||||
| 20 |
|
09-28 | 09-28 |
|
|
||||||||||
| 21 |
|
11-08 | 11-03 to 11-10 |
|
|
|
|||||||||
| 22 |
|
11-19 | 11-20 |
|
|
|
|||||||||
| 23 |
|
12-07 | 12-07 |
|
|
|
|||||||||
| 24 |
|
12-16 | 12-16 |
|
|
||||||||||
| Event | Date | Time Window | Peaking Emotion/MF | Declining Emotion/MF | Relevant Topics | ||||||||||
| 1 |
|
02-23 | 02-22 |
|
|
||||||||||
| 2 |
|
04-10 | 04-07 to 04-15 |
|
|
|
|||||||||
| 3 |
|
04-14 | 04-14 |
|
|
||||||||||
| 4 |
|
04-24 | 04-21 to 04-26 |
|
|
|
|||||||||
| 5 |
|
04-26 | 04-26 |
|
|
||||||||||
| 6 |
|
04-26 | 04-26 |
|
|
||||||||||
| 7 |
|
06-12 | 06-12 |
|
|
|
|||||||||
| 8 |
|
06-19 | 06-18 |
|
|
||||||||||
| 9 |
|
06-24 | 06-24 to 06-25 |
|
|
||||||||||
| 10 |
|
06-26 | 06-24 to 06-25 |
|
|
|
|||||||||