Discovery and Follow-up of ASASSN-23bd (AT 2023clx):
The Lowest Redshift and Least Luminous Tidal Disruption Event To Date
Abstract
We report the All-Sky Automated Survey for SuperNovae discovery of the tidal disruption event (TDE) ASASSN-23bd (AT 2023clx) in NGC 3799, a LINER galaxy with no evidence of strong AGN activity over the past decade. With a redshift of and a peak UV/optical luminosity of erg s-1, ASASSN-23bd is the lowest-redshift and least-luminous TDE discovered to date. Spectroscopically, ASASSN-23bd shows H and He i emission throughout its spectral time series, and the UV spectrum shows nitrogen lines without the strong carbon and magnesium lines typically seen for AGN. Fits to the rising ASAS-SN light curve show that ASASSN-23bd started to brighten on MJD 59988, 9 days before discovery, with a nearly linear rise in flux, peaking in the band on MJD . Scaling relations and TDE light curve modelling find a black hole mass of 106 , which is on the lower end of supermassive black hole masses. ASASSN-23bd is a dim X-ray source, with an upper limit of erg s-1 from stacking all Swift observations prior to MJD 60061, but with soft ( keV) thermal emission with a luminosity of erg s-1 in XMM-Newton observations on MJD 60095. The rapid days) light curve rise, low UV/optical luminosity, and a luminosity decline over 40 days of make ASASSN-23bd one of the dimmest TDEs to date and a member of the growing “Low Luminosity and Fast” class of TDEs.
keywords:
transients: tidal disruption events – black hole physics – accretion, accretion discs1 Introduction
Tidal disruption events (TDEs) are the result of the partial or total disruption of a star passing near or within the tidal radius of a supermassive black hole (SMBH), leading to a luminous flare from accretion onto the SMBH (e.g., Rees 1988; Evans & Kochanek 1989; Phinney 1989; Ulmer 1999; Komossa 2015; Stone et al. 2019). Emission from TDEs occurs over a broad range of wavelengths, including the hard X-ray (e.g., Bloom et al. 2011; Burrows et al. 2011; Cenko et al. 2012b; Pasham et al. 2015), soft X-ray (e.g., Bade et al. 1996; Grupe et al. 1999; Komossa & Greiner 1999; Auchettl et al. 2017), ultraviolet (UV, e.g., Stern et al. 2004; Gezari et al. 2006, 2008, 2009), and optical bands (e.g., van Velzen et al. 2011; Cenko et al. 2012a; Gezari et al. 2012; Arcavi et al. 2014; Chornock et al. 2014; Holoien et al. 2014a; Vinkó et al. 2015; Holoien et al. 2016b, a; Brown et al. 2018; Holoien et al. 2019a, b). While active galactic nuclei (AGNs) probe actively accreting SMBHs, TDEs offer a rare opportunity to examine the activation of otherwise dormant SMBHs (e.g., Lodato & Rossi 2011; Guillochon & Ramirez-Ruiz 2015; Shiokawa et al. 2015; Metzger & Stone 2016). TDEs also provide a laboratory for studying shock physics (e.g., Lodato et al. 2009), jet formation (e.g., Farrar & Piran 2014; Wang & Liu 2016; Biehl et al. 2018), and the local environment and growth of SMBHs (e.g., Auchettl et al. 2018; Jiang et al. 2021; Mockler et al. 2022).
However, the physics that underlies TDEs is complex. Possible parameters include the age, mass, composition, and rotation of the disrupted star (Kochanek, 2016; Gallegos-Garcia et al., 2018; Law-Smith et al., 2019; Mockler et al., 2019; Golightly et al., 2019), the spin and mass of the SMBH (Ulmer, 1999; Graham et al., 2001; Mockler et al., 2019; Gafton & Rosswog, 2019), the stellar impact parameter (Guillochon & Ramirez-Ruiz, 2013, 2015; Gafton & Rosswog, 2019), the accretion fraction and viewing angle (Kochanek, 1994; Lodato & Rossi, 2011; Dai et al., 2015; Guillochon & Ramirez-Ruiz, 2015; Shiokawa et al., 2015; Metzger & Stone, 2016; Dai et al., 2018; Coughlin & Nixon, 2019).
Despite all these parameters, optical and UV spectral energy distributions (SEDs) of TDEs are well modeled by blackbodies (e.g., Gezari et al. 2012; Holoien et al. 2014b, 2016b, 2016a; Brown et al. 2016; Hung et al. 2017; Holoien et al. 2018; Holoien et al. 2019b; Leloudas et al. 2019; Holoien et al. 2020; van Velzen et al. 2021; Hinkle et al. 2021c). Additionally, estimates of SMBH mass and spin from TDE light curves (e.g., Ulmer 1999; Graham et al. 2001; Gafton & Rosswog 2019; Mockler et al. 2019) are consistent with results from other, independent methods (see, e.g., Mockler et al. 2019 for comparison with SMBH masses from other studies). Finally, TDEs also show a Phillips (1993)-esque relationship between peak bolometric luminosity and decline rate (Hinkle et al., 2020; Hinkle et al., 2021c; Hammerstein et al., 2023).
From an optical spectroscopic perspective, the presence, strength and width of the observed lines vary (e.g., Arcavi et al. 2014; Hung et al. 2017; Leloudas et al. 2019; Wevers et al. 2019; Holoien et al. 2020; van Velzen et al. 2020; Charalampopoulos et al. 2022; Nicholl et al. 2022). Generally, optical emission lines are observed from hydrogen and/or helium, occasionally complemented by oxygen lines from Bowen fluorescence (e.g., Leloudas et al. 2019; van Velzen et al. 2020). Several potential theoretical explanations have been proposed to explain the variations in the spectra of TDEs, including photoionization physics (e.g., Gaskell & Rojas Lobos 2014; Guillochon et al. 2014; Roth et al. 2016; Kara et al. 2018; Leloudas et al. 2019), stellar composition differences (e.g., Kochanek 2016; Law-Smith et al. 2020; Mockler et al. 2022), and He star progenitors (e.g., Gezari et al. 2012; Strubbe & Murray 2015). While TDEs mostly have broad, Gaussian line profiles, some TDEs show line profiles with either strong, narrow line profiles (e.g., Holoien et al. 2020; van Velzen et al. 2020) or double peaks (e.g., Holoien et al. 2019a; Hung et al. 2020a), which may be explained by the viewing geometry (e.g., Holoien et al. 2019a; Hung et al. 2020b; Short et al. 2020). Finally, TDEs separate into diversely behaving spectral classes (Leloudas et al., 2019; van Velzen et al., 2021; Hammerstein et al., 2023), which has potential physical explanations that include partial vs. complete disruption (Nicholl et al., 2022) and ionization from a shrinking photospheric radius (Charalampopoulos et al., 2022). A larger sample of well-observed TDEs should advance our understanding of the underlying nature of TDEs and the SMBHs that cause them.
Fortunately, with the many transient surveys currently operating such as the All-Sky Automated Survey for Supernovae (ASAS-SN; Shappee et al. 2014; Kochanek et al. 2017), the Asteroid Terrestrial Impact Last Alert System (ATLAS; Tonry et al. 2018a), the Panoramic Survey Telescope and Rapid Response System (Pan-STARRS; Chambers et al. 2016; Jones et al. 2021), and the Zwicky Transient Facility (ZTF; Bellm et al. 2019), more nuclear transients, including TDEs, are discovered each year, and a growing number are now found prior to peak brightness (e.g., Holoien et al. 2019a, b; Leloudas et al. 2019; van Velzen et al. 2019b; Wevers et al. 2019; Holoien et al. 2020; van Velzen et al. 2020). The rising light curve and pre-maximum spectra provide important information about TDEs, such as the progression from a disrupted star to an accretion flow or an initial X-ray pulse (Carter & Luminet, 1983; Brassart & Luminet, 2008). The early detection of TDEs is especially important for a growing subclass of Low Luminosity and Fast (LLaF) TDEs111We do not use the common “Faint and Fast” moniker since “faintness” is distance dependent, not an intrinsic property of the TDE. As their name suggests, the peak luminosity of a LLaF TDE tends to be an order of magnitude less luminous combined with a rise and decline about twice as fast as a “normal” TDE. Examples of LLaF TDEs include iPTF16fnl (Blagorodnova et al., 2017; Brown et al., 2018), ATLAS18mlw (Hinkle et al., 2023), AT 2019qiz (Nicholl et al., 2020), AT 2020neh (Angus et al., 2022), and AT 2020wey (Charalampopoulos et al., 2023). While the observed sample is presently small, LLaF TDEs may have a higher intrinsic rate than “normal” TDEs (Charalampopoulos et al., 2023) but a lower discovery rate due to their lower luminosity.
In addition to TDEs, transient sky surveys have uncovered additional classes of nuclear transients, including a number of ambiguous transients. For example, the differences between low-luminosity TDEs and single bright AGN flares are poorly understood (see Zabludoff et al. 2021 for a review), or, alternatively, changing-look AGN may originate from accretion rate changes caused by a TDE (e.g., Chan et al., 2019; van Velzen et al., 2020; Zhang, 2021; Li et al., 2022; Ricci & Trakhtenbrot, 2023). The potential for mistaken identification is particularly a problem for galaxies that already host AGN activity. In particular, another growing class of nuclear transients is ambiguous nuclear transients (ANTs), which exhibit observational characteristics seen in both AGNs and TDEs (e.g., Trakhtenbrot et al., 2019 Neustadt et al., 2020, Hinkle et al., 2022, Li et al., 2022, Holoien et al., 2022). While one may posit ANTs are merely TDEs in AGN hosts, some ANTs occur in host galaxies that lack active accretion (e.g., Malyali et al. 2021, Hinkle et al. 2022, and Holoien et al. 2022).
2 Data
2.1 Initial Discovery and Classification
ASAS-SN discovered ASASSN-23bd (a.k.a. AT 2023clx222https://www.wis-tns.org/object/2023clx) on MJD 59997.2 at () (11:40:09.397 15:19:38.54) in NGC 3799 using the Cassius unit in Chile (Stanek, 2023). The ASAS-SN discovery -band magnitude was 16.3, with a last non-detection on MJD 59988.3 at a limiting magnitude of . Taguchi et al. (2023) spectroscopically classified ASASSN-23bd as a TDE on MJD 60001.7.
The redshift of NGC 3799 is (Albareti et al., 2017), making ASASSN-23bd the lowest redshift TDE to date. Theureau et al. (2007) derive distance moduli of mag (51 Mpc; 21-cm line) and mag (134 Mpc; H-band Tully & Fisher 1977 relationship). Assuming km sec-1 Mpc-1 (Burns et al., 2018; Riess et al., 2022; Galbany et al., 2023), , and , the distance modulus to NGC 3799 is mag ( Mpc) in the cosmic microwave background frame. We adopt this distance.
2.2 Survey Data
| JD | Filter | Magnitude | Uncertainty | Flux [mJy] | Uncertainty |
|---|---|---|---|---|---|
| 2459967.03 | 20.297 | 99.999 | 0.076 | 0.006 | |
| 2459970.14 | 19.862 | 99.999 | 0.068 | 0.008 | |
| 2459979.86 | 19.325 | 99.999 | 0.046 | 0.014 |
2.2.1 ASAS-SN Light Curve
ASAS-SN is a fully robotic survey with 20 14-cm telescopes distributed on five mounts at four sites, providing comprehensive all-sky monitoring with a cadence of 20 hours (in good conditions) designed to detect nearby supernovae. The five ASAS-SN units are located at the Haleakala Observatory, the South African Astrophysical Observatory, the McDonald Observatory, and two at the Cerro Tololo Inter-American Observatory. The typical ASAS-SN observing strategy is to obtain 3 dithered images at each pointing. The ASAS-SN survey began observations in late 2011 with the band. In 2017, ASAS-SN added 12 telescopes using the band, and the original eight telescopes were switched from the band to the band in 2018.
ASAS-SN observed the location of ASASSN-23bd 3441 times before discovery, and all images were reduced using the standard ASAS-SN pipeline based on the ISIS image subtraction package (Alard & Lupton, 1998; Alard, 2000a). We used images taken before MJD 59800 to construct the reference image, removing any images with a large FWHM ( pixels), a 3-sigma depth that was too shallow ( mag), or that showed signs of cirrus or clouds.
Similar to the standard ASAS-SN Sky Patrol photometry (Kochanek et al., 2017; Hart et al., 2023), we use the IRAF apphot package with a 2-pixel ( arcsecond) radius to perform aperture photometry on each subtracted image, generating a differential light curve. The photometry is calibrated using the AAVSO Photometric All-Sky Survey (Henden et al., 2015). We then stack the individual ASAS-SN images on different time scales for different parts of the light curve. First, when looking for pre-discovery variability we stack the dithered images together. Next, from 40 days before to 25 days after discovery, we stack in 25-hour bins to cover the rapid rise and decline. Lastly, for the declining light curve, we stack in 100-hour bins to better follow the relatively slow fading. The ASAS-SN photometric observations are compiled in Table 1.
2.2.2 ATLAS Light Curve
The ATLAS survey primarily focuses on detecting small asteroids that have a chance of terrestrial collision using two filters: a cyan (; 420-650 nm) filter and an orange (; 560-820nm) filter (Tonry et al., 2018a). ATLAS uses 0.5 m Wright-Schmidt telescopes in Hawaii, Chile, and South Africa to obtain four 30-second exposures in an hour-long window for 200–250 fields per night, covering approximately a quarter of the sky (Smith et al., 2020). Data were retrieved from the ATLAS Transient Science Server (Smith et al., 2020). The ATLAS light curve contains 2,527 images, with the earliest on MJD 57400.6. We combined the four nightly ATLAS images to derive a light curve with 630 epochs. The initial rise was observed in the ATLAS band, whereas the peak was observed in the ATLAS band. Data taken on the same night were stacked using a weighted average, excluding data affected by clouds. The ATLAS photometric observations are also compiled in Table 1.
2.2.3 TESS Data
NGC 3799 was observed by the Transiting Exoplanet Survey Satellite (TESS; Ricker et al. 2015) in sectors 22, 45, 46, and 49. Unfortunately, these sectors all occurred before the discovery of ASASSN-23bd. We reduced the TESS data in a similar manner to the ASAS-SN data following the processes detailed in Vallely et al. (2019), Vallely et al. (2021), and Fausnaugh et al. (2021). We used the ISIS package (Alard & Lupton, 1998; Alard, 2000b) to image subtract the full-frame TESS images. Median filters were used to remove artifacts like CCD straps. We produced light curves from these subtracted images with reference images constructed on a per-sector basis using the first 100 good-quality full-frame images without compromised pointing, significant scattered light, or data quality flags. For the extended mission with its shorter integration times, we use the first 300 images that meet the above criteria.
2.2.4 ZTF Light Curve
ZTF uses the Samuel Oschin 48-in Schmidt telescope at the Palomar Observatory and a camera with a 47 deg2 field of view to obtain images as deep as 20.5 -band mag in 30-second exposures. ZTF observed the field containing ASASSN-23bd starting on MJD 58202.3. We use the ZTF - and -band light curves between MJD 58202.3 and MJD 60090 obtained through the ZTF forced photometry service333https://irsa.ipac.caltech.edu/Missions/ztf.html.. These light curves have 673 - and -band epochs constructed from 1,726 images. Following the ASAS-SN discovery announcement, ZTF reported a detection at mag on MJD 59980 to TNS; however, our forced photometry does not show a detection at this epoch. All the ZTF detections are after the peak of ASASSN-23bd. Since higher-cadence data are available from the Swope Telescope discussed below, we only include the ZTF data in our analysis of previous AGN variability.
2.3 Follow-up Observations
| JD | Filter | Magnitude | Uncertainty |
|---|---|---|---|
| 2460003.25 | 16.42 | 0.06 | |
| 2460003.25 | 16.79 | 0.07 | |
| 2460003.26 | 16.88 | 0.05 |
2.3.1 Swope Observations
As part of the Precision Observations of Infant Supernova Explosions (POISE; Burns et al., 2021) collaboration, we obtained follow-up images from the 1.0-m Henrietta Swope Telescope. These data were taken in the Carnegie Supernova Project (CSP) natural system for which the photometry is calibrated using standards from Landolt (2007) and the photometry is calibrated using standards from Smith et al. (2002). These standards are converted to the CSP system using colour terms from Krisciunas et al. (2017) and Phillips et al. (2019). For more information on the CSP filter system, see Stritzinger et al. (2011) and references therein.
The Swope photometry is template-subtracted using Pan-STARRS (Chambers et al., 2016) imaging data. Calibration is done using RefCat2 (Tonry et al., 2018b) magnitudes transformed to the CSP natural system using colour terms found in Krisciunas et al. (2017) and Phillips et al. (2019). Finally, we use the corrections listed on the CSP website444https://csp.obs.carnegiescience.edu/data/filters to convert to the AB system.
2.3.2 Swift Observations
The Neil Gehrels Swift Observatory (Swift; Gehrels et al. 2004) acquired 19 epochs of data between MJD 60000 and MJD 60061 (PIs: Leloudas, Gomez, Huang, and Wevers). Swift simultaneously observed ASASSN-23bd with the UltraViolet and Optical Telescope (UVOT; Roming et al. 2005) and X-Ray Telescope (XRT; Burrows et al. 2005). The Swift data through MJD 60061 are included here; later Swift observations exist, but SNR of the data is too low to be useful.
All exposures for each UVOT epoch were combined using the HEASOFT Version 6.31.1 UVOTIMSUM package, and aperture photometry was obtained using the UVOTSOURCE package. An aperture of 5” is used for both the source and the background. Counts from stacked archival host-galaxy images were subtracted in all bands except the band, which lacks archival imaging of the host. We compute Vega-system magnitudes using the Breeveld et al. (2011) zero points, which update the Poole
et al. (2008) zero points. A comparison to photometry from the Swift Optical/Ultraviolet Supernova Archive (SOUSA; Brown et al., 2014) pipeline yields similar photometry to ours. Finally, the magnitudes are converted to AB magnitudes555The conversions are found at
https://swift.gsfc.nasa.gov/analysis/uvot_digest/zeropts.html .
Due to a lack of archival host-galaxy -band observations, the large -band uncertainties at late times, and the existence of high quality and data from POISE, we elect not to show the Swift - or -band photometry nor use the Swift -band photometry in our analysis. The Swift -band photometry is included in the blackbody/SED fits. The Swope and Swift photometry is compiled in Table 2.
The Swift XRT data was collected in photon-counting mode. Using the most up-to-date calibrations and the standard filters and screenings, the observations were processed using the XRTPIPELINE version 0.13.7. Using a source region with a radius of 47” centered on the location of ASASSN-23bd and a source-free background region with a radius of 150” centered at (,)=(11:39:56.13,15:22:23.90), no significant X-ray emission associated with the source was found in the individual epochs.
To constrain the X-ray emission, we merged all 19 observations (up to ObsID sw00015897021 on MJD = 60061) using the HEASOFT tool xselect version 2.5b to derive a 3 upper limit of counts/sec for the 0.3-10.0 keV energy range. Assuming an absorbed power law with a Galactic column density of 2.5 cm-2 (HI4PI Collaboration et al., 2016) and a photon index of 2 at the redshift of the host galaxy, we obtain an absorbed flux limit of erg cm-2 s-1, which corresponds to an X-ray luminosity limit of erg s-1. If we assume an absorbed blackbody model with a temperature of 0.1 keV and a column density of 1 cm-2, as derived in Section 2.3.3, we obtain an absorbed flux limit of erg cm-2 s-1, which corresponds to an X-ray luminosity of erg s-1
2.3.3 XMM-Newton
ASASSN-23bd was targeted by XMM-Newton through joint time awarded as part of the Hubble GO program 16775 (PI: Maksym). XMM-Newton observed NGC 3799 on 2023 May 31 (MJD 60095; obsid 0892201601) for 15 ks, of which 11.8 ks were useful. ASASSN-23bd was detected at 10 with 170 counts (maximum likelihood 185 from the EPIC detection pipeline). As a first test, we extracted the PN counts from a region centred on the source and from a sourceless background region near the NW corner of the same PN CCD, avoiding the chip edges. The PN 2.0-10.0 keV excess had significance, with of the photons observed in the 0.1-2 keV band. Of these, only 1 net count was found between 1.0-2.0 keV. For a first estimate of spectral properties, we used PIMMS666https://cxc.harvard.edu/toolkit/pimms.jsp to estimate a blackbody temperature assuming a column density of 1 1020 cm-2, scaling from our derived host extinction limit (; see Section 3.1) and Galactic extinction (; Schlafly & Finkbeiner, 2011) from colden 777https://cxc.harvard.edu/toolkit/colden.jsp. The model blackbody temperature was iteratively increased in steps of 0.01 keV to match the observed hardness ratio such that HR=(H-S)/(H+S)= where S=0.2-0.5 keV and H=0.5-1.0 keV. This leads to a blackbody temperature estimate of . This leads to an observed flux of erg s-1 cm-2 in the Swift 0.3-10 keV band, or an intrinsic erg s-1 for an unabsorbed blackbody in the 0.1-2 keV band. It is undetected in the hard band ( erg s-1 cm-2 at in the 2-10 keV band assuming a power law). To check our assumptions, we also extracted a spectrum with XMM SAS888https://www.cosmos.esa.int/web/xmm-newton/sas and fit it with XSPec999https://heasarc.gsfc.nasa.gov/xanadu/xspec/ using 10-count bins and lstat as the minimization statistic. The blackbody fit produces , , and (absorbed) and (unabsorbed; 90% confidence), with . A complete analysis of the XMM-Newton data will be presented in Maksym et al. (2024; in prep.).
2.3.4 Spectroscopic Observations
| UT Date | MJD | Epoch | Telescope | Spectrograph |
|---|---|---|---|---|
| [days] | [days] | |||
| 2023-02-26 | 60001.6 | 4.4 | Seimi | KOOLS-IFU |
| 2023-03-04 | 60007.5 | 10.3 | SS2.3 | WiFeS |
| 2023-03-05 | 60008.3 | 11.1 | Baade | IMACS |
| 2023-03-14 | 60017.5 | 20.3 | SS2.3 | WiFeS |
| 2023-03-15 | 60018.3 | 21.1 | Baade | IMACS |
| 2023-03-17 | 60020.5 | 23.3 | SS2.3 | WiFeS |
| 2023-03-19 | 60022.5 | 25.3 | SS2.3 | WiFeS |
| 2023-03-20 | 60023.3 | 26.1 | Baade | IMACS |
| 2023-03-20 | 60023.5 | 26.3 | Keck1 | LRIS |
| 2023-03-21 | 60024.6 | 27.4 | SS2.3 | WiFeS |
| 2023-03-27 | 60030.4 | 33.2 | UH2.2 | SNIFS |
| 2023-03-28 | 60031.4 | 34.2 | UH2.2 | SNIFS |
| 2023-03-29 | 60032.4 | 35.2 | UH2.2 | SNIFS |
| 2023-03-29 | 60032.5 | 35.3 | SS2.3 | WiFeS |
| 2023-04-05 | 60039.5 | 42.3 | SS2.3 | WiFeS |
| 2023-04-10 | 60044.4 | 47.2 | UH2.2 | SNIFS |
| 2023-04-11 | 60045.4 | 48.2 | UH2.2 | SNIFS |
| 2023-04-13 | 60047.2 | 50.0 | Baade | IMACS |
| 2023-04-14 | 60048.4 | 51.2 | SS2.3 | WiFeS |
| 2023-04-16 | 60050.4 | 53.2 | UH2.2 | SNIFS |
| 2023-04-21 | 60055.4 | 58.2 | UH2.2 | SNIFS |
| 2023-04-21 | 60055.5 | 58.3 | SS2.3 | WiFeS |
| 2023-04-24 | 60058.4 | 61.2 | UH2.2 | SNIFS |
| 2023-04-28 | 60062.3 | 65.1 | UH2.2 | SNIFS |
| 2023-05-10 | 60074.4 | 77.2 | UH2.2 | SNIFS |
| 2023-03-26 | 60029.4 | 32.2 | IRTF | SpeX |
| 2023-04-04 | 60038.9 | 41.7 | HST | STIS |
Epoch phase relative to discovery, which is at MJD 59997.2
We acquired 24 spectra of ASASSN-23bd between MJD 60007 and MJD 60075 and also include two public spectra of ASASSN-23bd accessed through the Transient Name Server (TNS) and a public HST spectrum. The first TNS spectrum101010Accessed via https://www.wis-tns.org/object/2023clx was taken on the Seimi telescope using the Kyoto Okayama Optical Low-dispersion Spectrograph Integral Field Unit (KOOLS-IFU; Matsubayashi et al. 2019). The second TNS spectrum111111Accessed via https://www.wis-tns.org/object/2018meh was taken on the Keck-I telescope using the Low-Resolution Imaging Spectrometer (LRIS; Oke et al. 1995; Rockosi et al. 2010) and reported by Johansson et al. (2023).
Our optical spectroscopic observations of ASASSN-23bd are from the POISE (Burns et al., 2021) and SCAT (Tucker et al., 2022) collaborations. POISE observations were taken using the Inamori-Magellan Areal Camera and Spectrograph (IMACS; Dressler et al. 2006) on the 6.5-m Magellan Baade telescope. SCAT observations were taken using the University of Hawaii 2.2m telescope (UH2.2) on Mauna Kea using the Supernova Integral Field Spectrograph (SNIFS; Lantz et al. 2004) and on the Australian National University 2.3m telescope (SS2.3) using the Wide-Field Spectrograph (WiFeS; Dopita et al. 2007; Dopita et al. 2010).
Data reduction for IMACS was performed using the standard iraf121212The Image Reduction and Analysis Facility (IRAF) is distributed by the National Optical Astronomy Observatory, which is operated by the Association of Universities for Research in Astronomy, Inc., under cooperative agreement with the National Science Foundation. packages using the method described in Hamuy et al. (2006) and Folatelli et al. (2013). SNIFS spectra were reduced using the SCAT pipeline described in Tucker et al. (2022), and WiFeS spectra were reduced using standard procedures implemented in PyWiFeS (Childress et al., 2014).
Further spectral data were taken using NASA’s InfraRed Telescope Facility (IRTF) with SpeX (Rayner et al., 2003) as part of IRTF program 2023A060 (PI: Hinkle) and HST data taken with the Space Telescope Imaging Spectrograph (STIS; Woodgate et al. 1998) as part of GO program 16775 (PI: Maksym). The SpeX data were reduced with telluric corrections from an A0V star using the standard SpeXtool procedures described in Cushing et al. (2004), and the reduced STIS spectrum was obtained through the Mikulski Archive for Space Telescopes. Table 3 presents a log of the spectroscopic observations of ASASSN-23bd.
3 Analysis
In this section, we analyze the archival host properties of NGC 3799. We search for previous AGN-like variability and compute the general host-galaxy properties. Additionally, we fit the rising light curve of ASASSN-23bd with single- and double-component models and perform blackbody fits to the photometry. Finally, we analyze the optical spectral time series, especially the evolution of the Full-Width at Half-Maximum (FWHM) and luminosity of the feature.
3.1 Archival Observations of Host Galaxy NGC 3799
NGC 3799 is a well-observed galaxy morphologically classified as a SB(s)b:pec (de Vaucouleurs et al., 1991) galaxy. It is designated as a peculiar galaxy because it is interacting with NGC 3800. There is evidence that galaxies that have undergone recent mergers may be more likely to host a TDE (Prieto et al., 2016; Hammerstein et al., 2021). NGC 3799 is a Low Ionization Nuclear Emission Line Region (LINER) AGN (Toba et al., 2014). The archival SDSS spectrum (York et al., 2000) shows H, Mg 5175, Na i D 5890, 5896, and Ca ii KHG 3934, 3968, 4308, Ca ii 8542, 8662, and Mg i 8807 absorption and [O iii] 4959,5007, [N ii] 6584, [S ii] 6717, 6731, and moderate H emission.
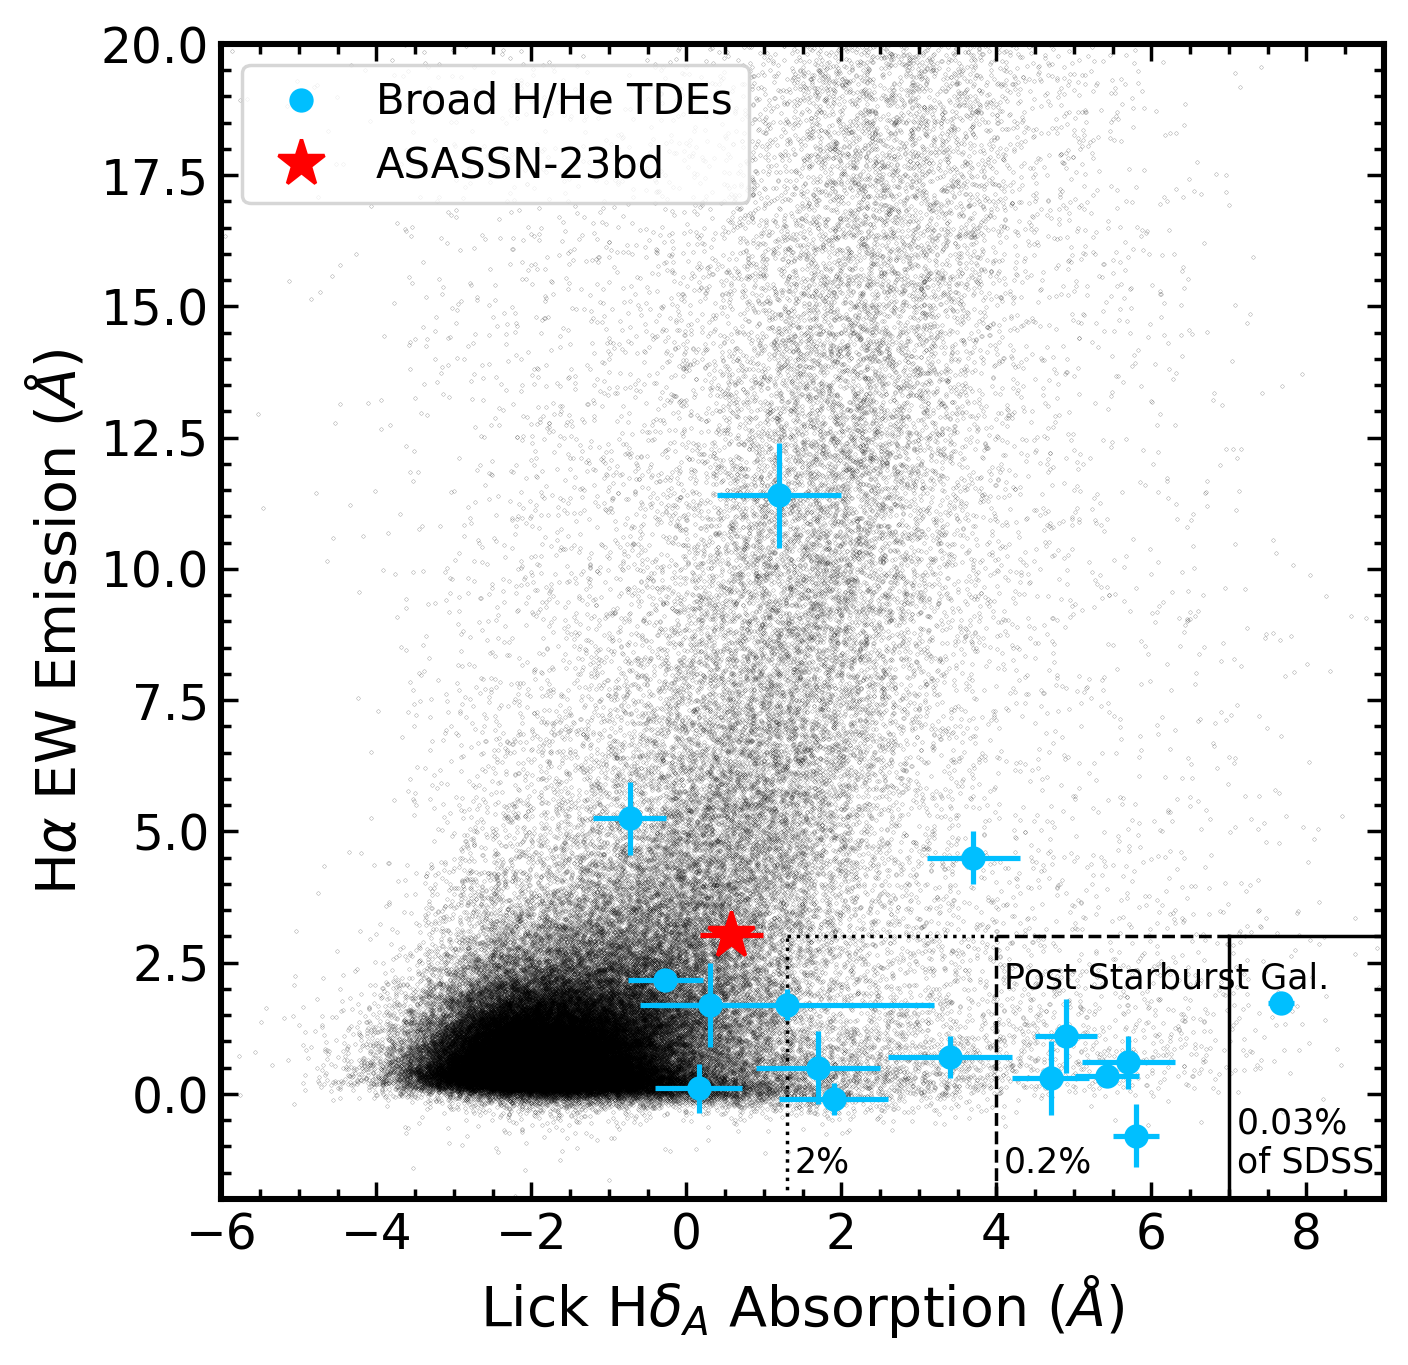
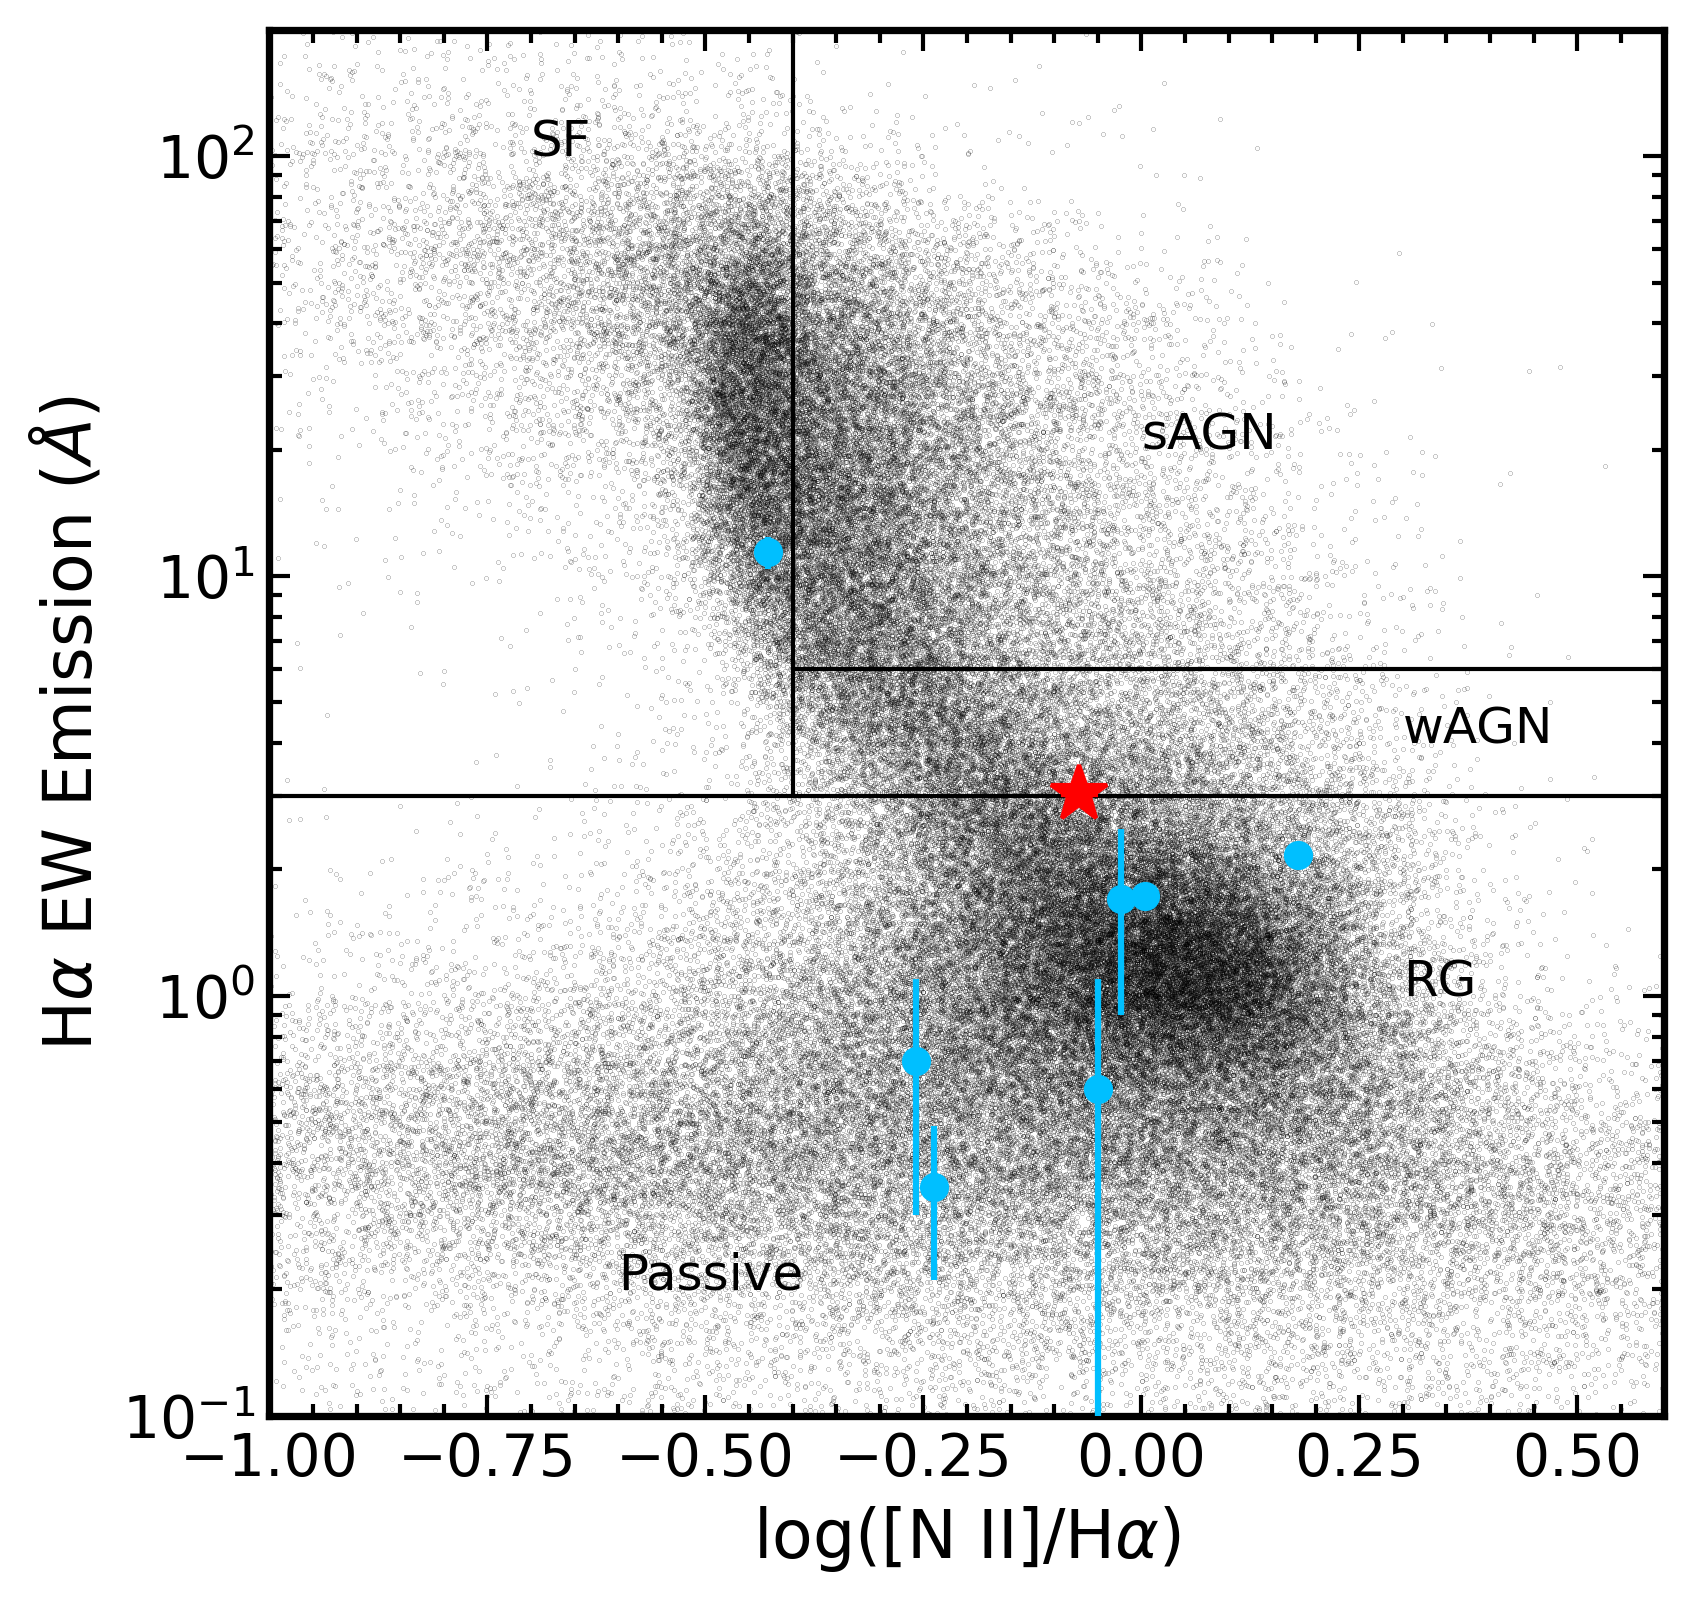
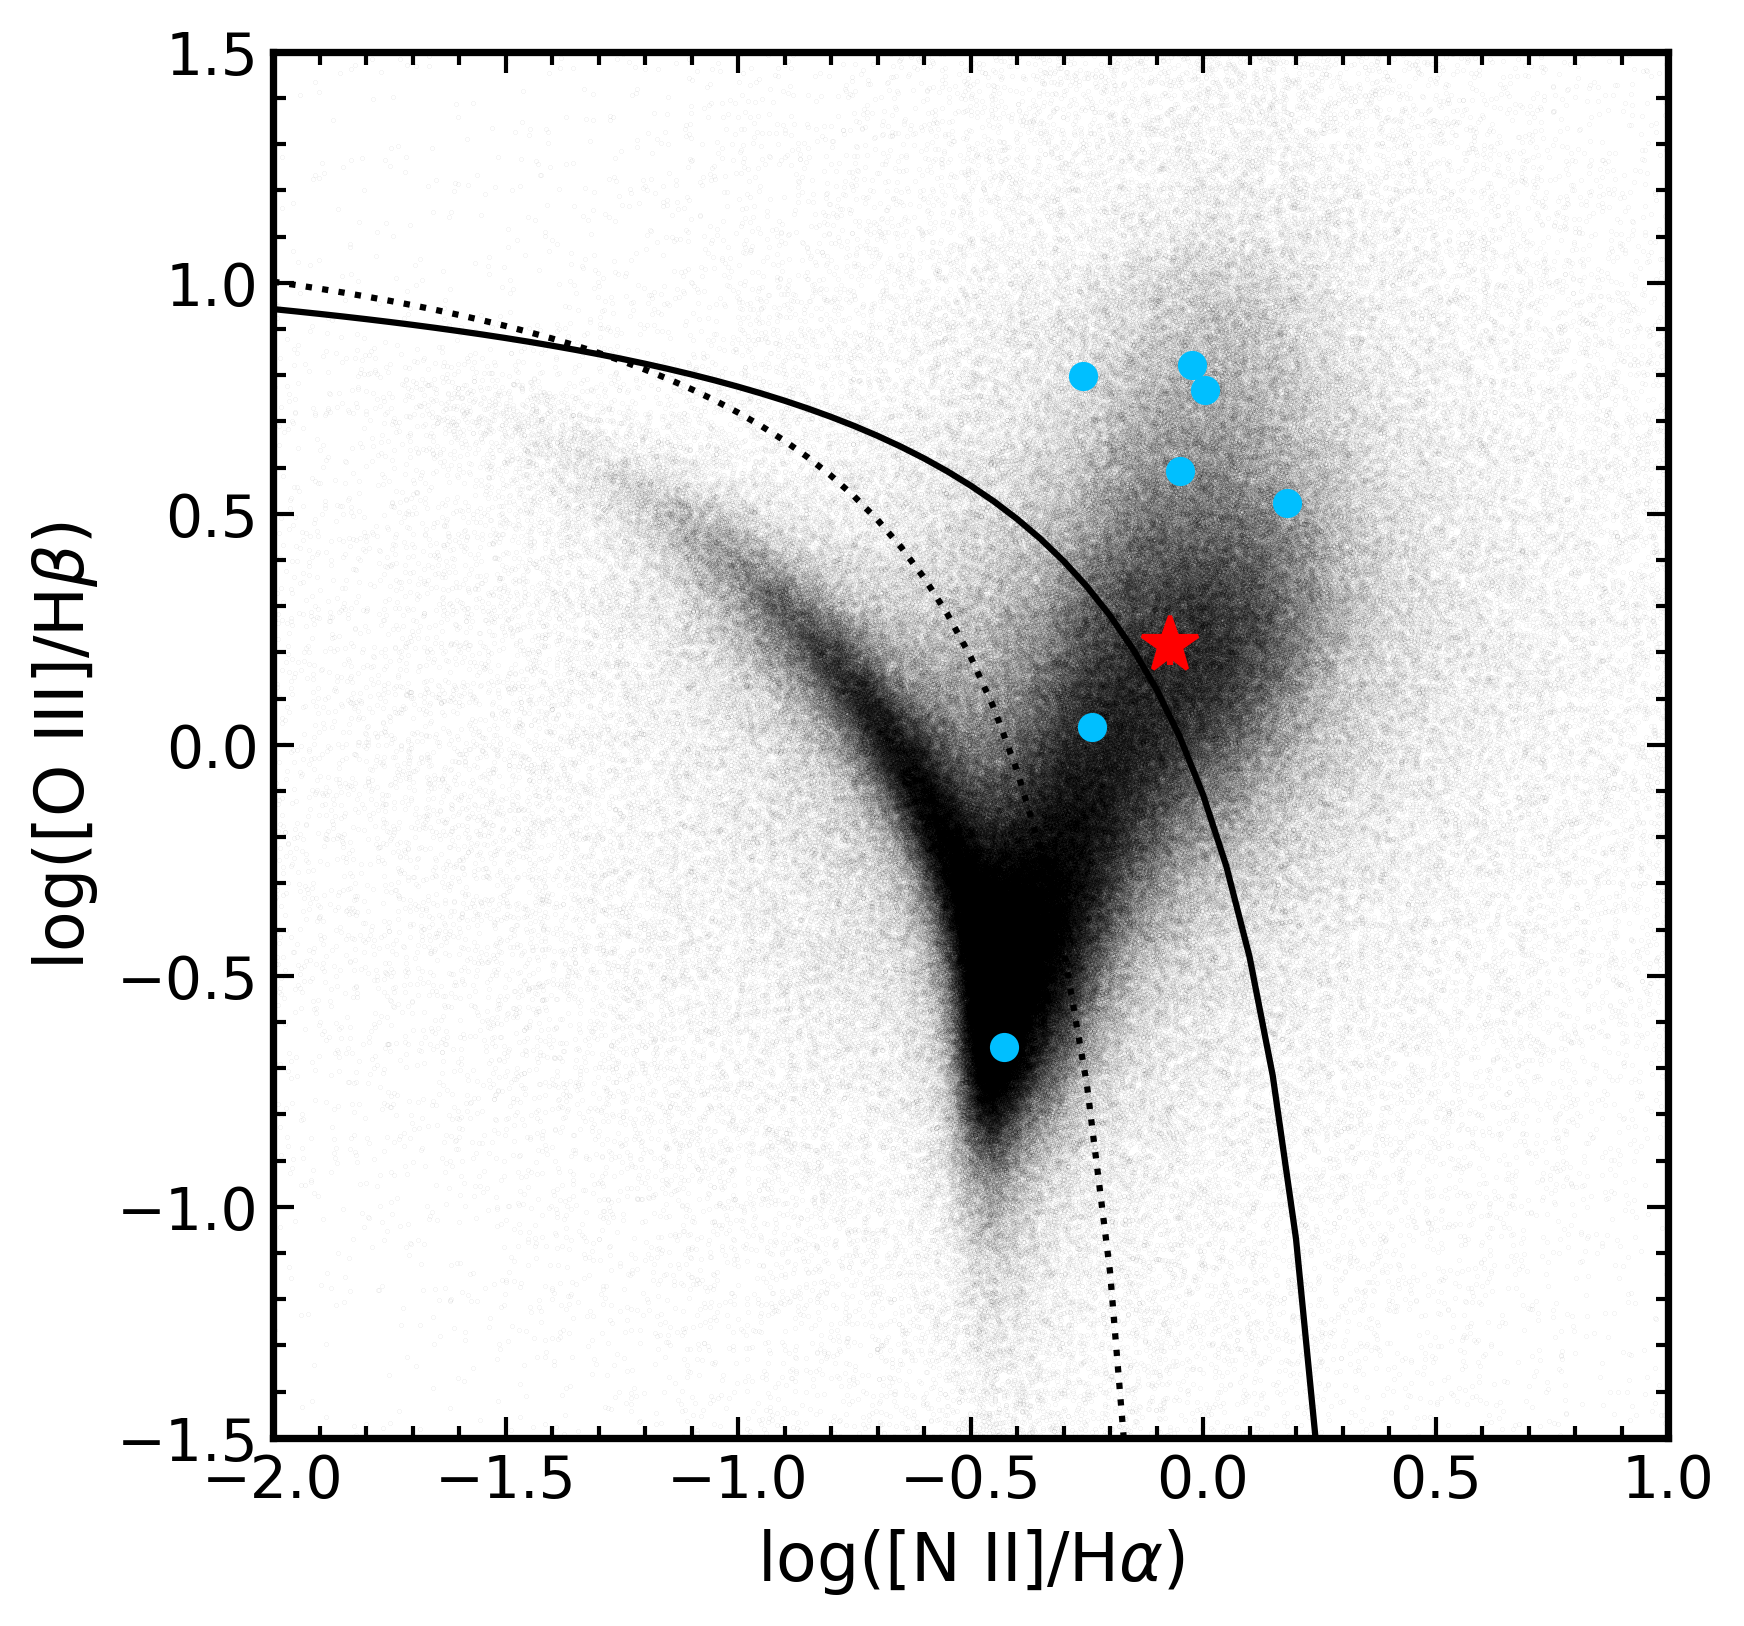
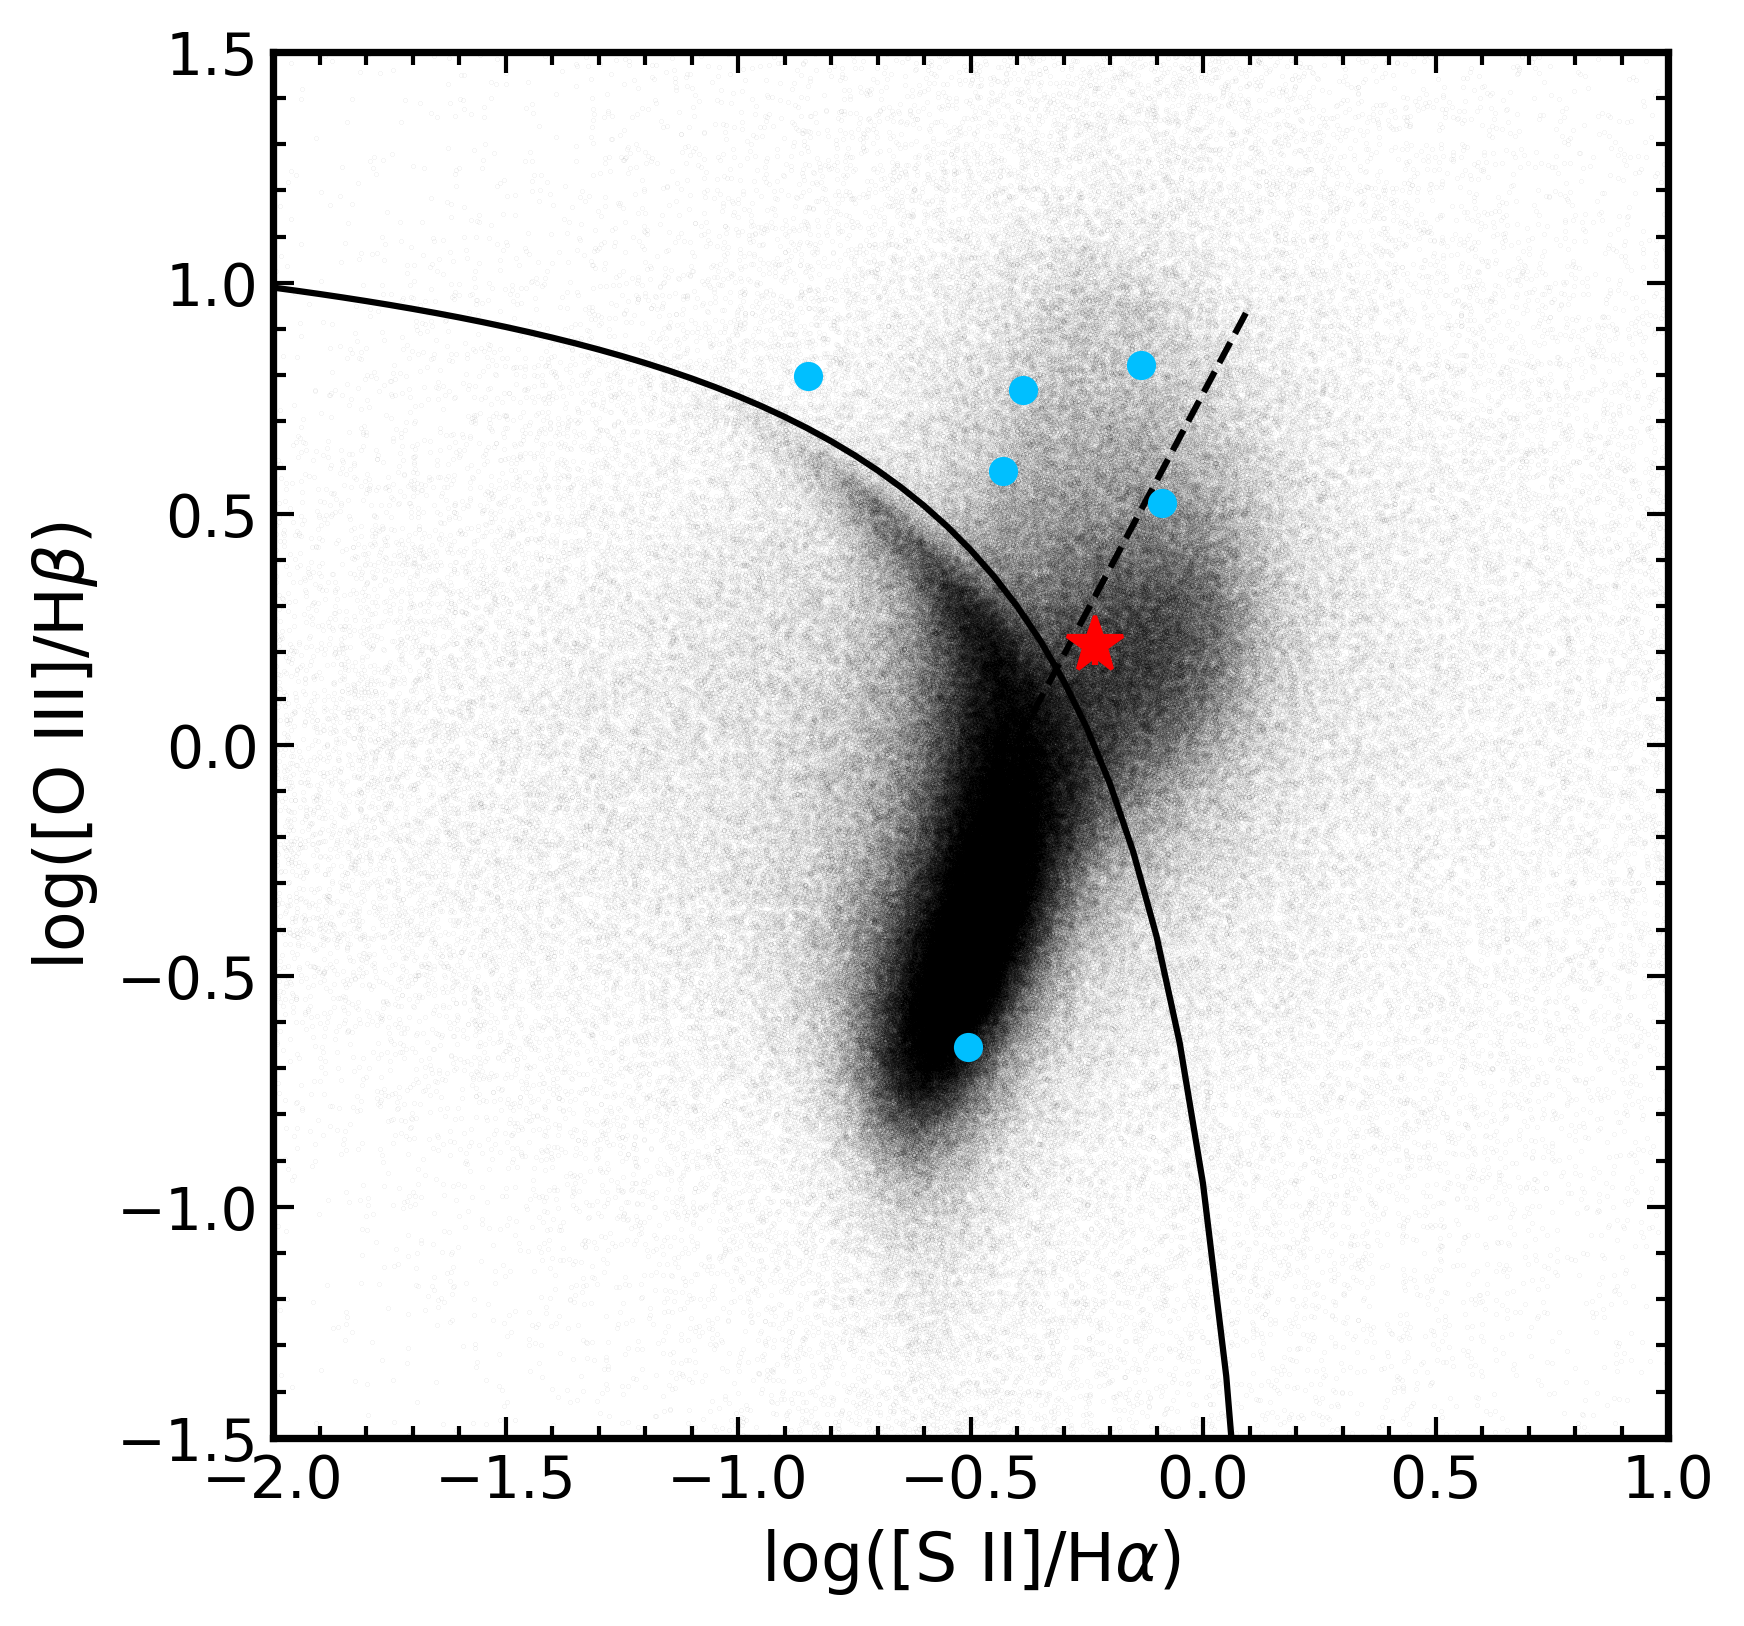
Figure 1 compares NGC 3799 with the host galaxies of Broad H/He TDEs and the general properties of SDSS DR8 (Eisenstein et al., 2011) galaxies from Brinchmann et al. (2004). The top left panel shows the equivalent width of H and the Lick H absorption index. H is a current star-formation indicator, while the Lick H absorption index provides information about the past Gyr of star formation to identify post-starburst galaxies. The top right panel shows the H equivalent width and N ii, which helps to discriminate between ionization mechanisms, especially those of LINER galaxies (Cid Fernandes et al., 2011). The bottom left panel of Figure 1 shows a galaxy diagnostic based on O iii and N ii, and the bottom right shows another one using O iii and S ii (Baldwin et al., 1981; Veilleux & Osterbrock, 1987). The numerical values for each parameter are Å, Å, N ii, S ii, and O iii. Finally, we note that NGC 3799 has a color of 0.03 mag, which indicates no strong AGN activity (Stern et al., 2012). In summary, Figure 1 shows NGC 3799 is still undergoing star formation and hosts weak AGN activity.
We use the photometry in Table 4 to estimate several host-galaxy parameters using the Fitting and Assessment of Synthetic Templates package (FAST; Kriek et al. 2009). We assume a Salpeter (1955) initial mass function, an exponentially declining star-formation rate, and the stellar population models of Bruzual &
Charlot (2003). This population model uses light from the entire host galaxy; however, from the SDSS and Pan-STARRS host-galaxy images, there is evidence for an older, quiescent nucleus. The star formation is likely associated with the spiral arms and driven by NGC 3799’s tidal interactions with its larger nearby neighbor, NGC 3800. The model results give an age of 2.0 Gyr, a stellar mass of , a star formation rate of yr-1, and a specific star formation rate of yr-1. For the Reines &
Volonteri (2015) scaling relation, the host stellar mass implies a black hole mass of M⊙, which is similar to other LLaF TDEs (e.g., Charalampopoulos
et al. 2022 and Blagorodnova
et al. 2017).
Since NGC 3799 is classified as a LINER, we searched for prior X-ray emission that could indicate possible AGN activity using archival Swift XRT observations obtained before ASASSN-23bd. We find no evidence of prior X-ray emission from the host. Merging all available archival observations, we obtain a 3 upper limit to the 0.3-10.0 keV count rate of 0.002 counts s-1. Assuming an absorbed power law with a photon index (e.g., Ricci et al., 2017) and a Galactic column density of cm-2 (HI4PI Collaboration et al., 2016), we derive an absorbed luminosity of erg s-1. This limit rules out strong, but not weak, AGN activity, consistent with Figure 1.
It appears that ASASSN-23bd is not significantly affected by extinction. The Milky-Way extinction towards NGC 3799 is mag (Schlafly &
Finkbeiner, 2011). We use four different methods to estimate the host-galaxy extinction.
First, the pseudo-equivalent width of the Na i D line in the SDSS spectrum can be used to estimate an extinction using the relationship of Poznanski et al. (2012). We perform a 1500 iteration bootstrap on the Na i D line and take the median of the 1500 resulting extinction values to derive mag.
Second, the FAST fit provides an extinction estimate of mag.
Third, using the SDSS line fluxes, the Balmer decrement is . Using the Balmer decrement - extinction relationship from Domínguez
et al. (2013), we derive mag and mag, although with , this drops to mag.
However, these estimates may be inaccurate for several reasons. First, they are derived using emission from the larger narrow-line region and thus may overestimate the line-of-sight extinction toward the nucleus. Second, the FAST population model integrates emission from the whole galaxy, but there is evidence for an older, quiescent nucleus with star formation associated with the spiral arms and possible tidal interactions with its larger nearby neighbor, NGC 3800. Third, the Balmer decrement assumes Case B recombination as the only source of H-line production. But NGC 3799 is a LINER, implying that shocks may modify the line ratios, flattening the Balmer decrement and reducing the extinction estimate. This is difficult to disentangle from the effects of dust. There is no significant Na i D line in our follow-up spectra where the emission is dominated by the nuclear transient. Therefore, we do not expect much host-galaxy extinction to the nucleus. The upper limit on Na i D absorption from the LRIS spectrum corresponds to mag. This is a line-of-site estimate directly from the TDE observations, so we assume that the host-galaxy extinction of ASASSN-23bd is negligible.
| Filter | Magnitude | Magnitude Uncertainty |
|---|---|---|
| 16.57 | 0.02 | |
| 16.89 | 0.03 | |
| 16.31 | 0.02 | |
| 15.60 | 0.01 | |
| 14.23 | 0.01 | |
| 13.71 | 0.01 | |
| 13.41 | 0.01 | |
| 13.25 | 0.01 | |
| 12.90 | 0.03 | |
| 12.80 | 0.04 | |
| 12.95 | 0.04 | |
| 14.27 | 0.02 | |
| 14.94 | 0.02 |
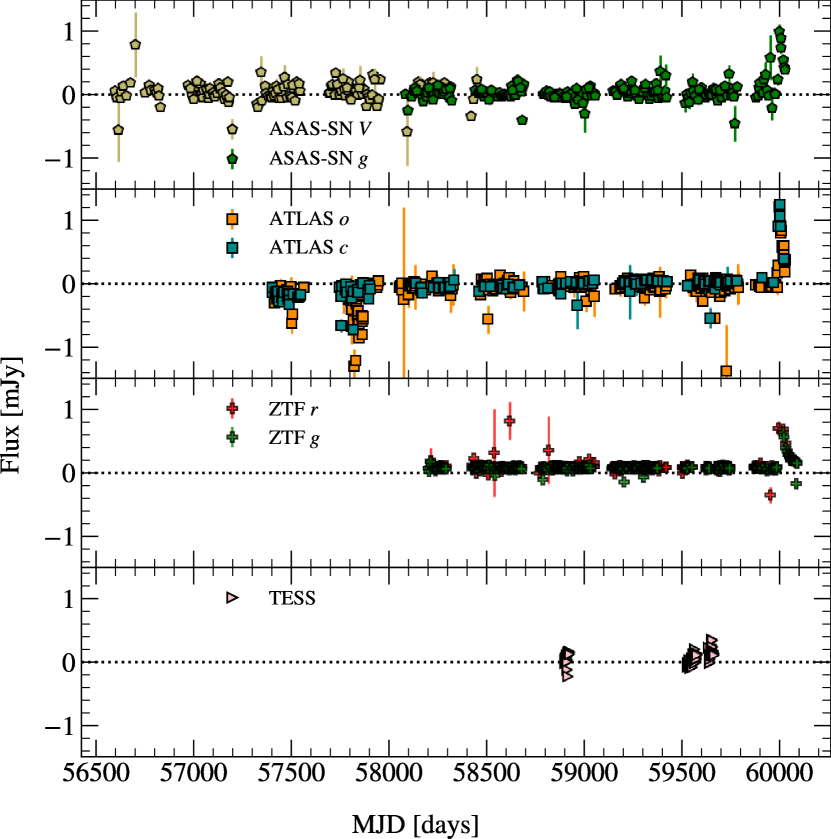
Since NGC 3799 hosts weak AGN activity, we searched the archival ASAS-SN, ATLAS, ZTF, and TESS observations for AGN variability or outbursts prior to ASASSN-23bd. The forced-photometry light curves are shown in Figure 2 and show no evidence of variability. We find that the RMS is Jy in each TESS sector, with sectors 22 and 49 having the largest RMS at Jy. The ATLAS band has the largest RMS variance out of all the survey data with a value of Jy, corresponding to a luminosity of erg s-1. If this were real and corresponded to a 1% variability amplitude, then the AGN has erg s-1. With such low variance, we rule out strong AGN activity with erg s-1 over the past decade.
3.2 Photometric Analysis
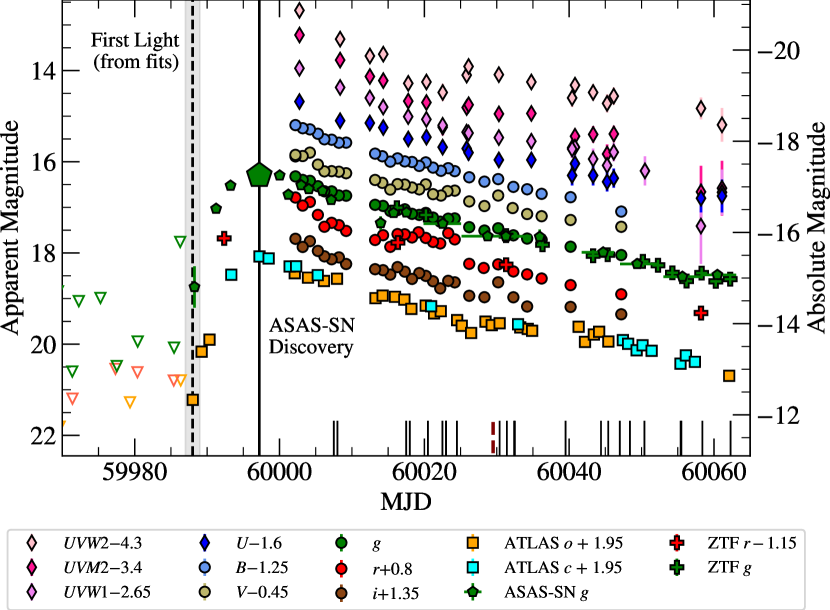
Figure 3 presents our photometric data for ASASSN-23bd. To constrain the time of peak, we perform MCMC fits with a simple parabolic model to the ASAS-SN data near peak to find .
We fit the rising ASAS-SN -band photometry with two different models of the form
| (1) |
where
| (2) |
and is either a constant, single-power model as in Vallely et al. (2021) and Hinkle et al. (2021b) or
| (3) |
as also used in Vallely et al. (2021). While the value of in the one-component model is sensitive to how much of the rising light curve is fit (e.g., Vallely
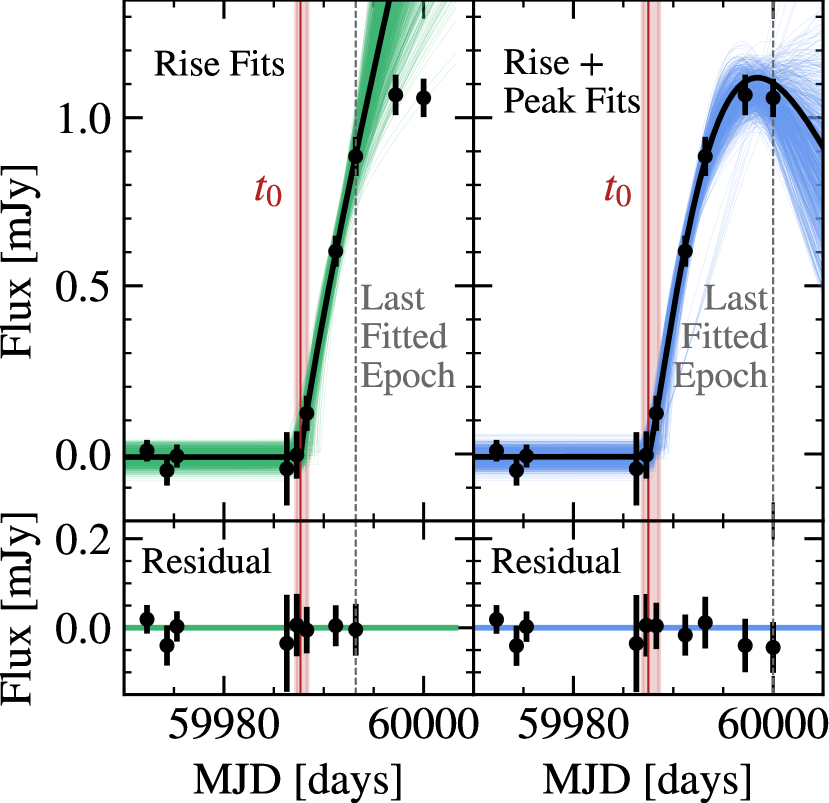
et al., 2019; Vallely et al., 2021), the parameter from the two-component model is not. We use the emcee fitting package (Foreman-Mackey et al., 2013) with the results given in Table 5 and shown in Figure 4. The two models produce consistent results for , , , and /. The two-component model can also be used to determine the peak -band magnitude. The median peak value is mJy, which corresponds to an AB magnitude of .
| Parameter | One-Component Value | Two-component Value |
|---|---|---|
| [Jy] | ||
| [MJD] | ||
| [Jy] | ||
| / | ||
To estimate the theoretical properties of ASASSN-23bd, we fit our host-subtracted light curves using the Modular Open Source Fitter for Transients package (MOSFiT; Guillochon et al. 2017; Mockler et al. 2019). MOSFiT provides estimates of the physical properties of the star, the SMBH, and the encounter between the star and SMBH by generating bolometric light curves from predefined TDE models, subsequently deriving light curves for each photometric band, and finally fitting the derived light curves to the observed ones. The MOSFiT results are tabulated in Table 6. The SMBH mass from these fits agrees well with the mass estimate from the host-galaxy scaling relationships presented in Section 3.1.
| Quantity | Value | Units |
|---|---|---|
| – | ||
| d | ||
| – | ||
| M⊙ | ||
| – | ||
| – | ||
| cm-2 | ||
| M⊙ | ||
| d | ||
| – |
: photosphere power-law constant; : viscous delay time scale; : scaled impact parameter ; : SMBH mass; : efficiency; : photosphere power-law exponent; : local hydrogen column density; : stellar mass; : time of disruption; : model variance.
We fit a blackbody model to the optical and UV data, and Figure 5 shows the results for the temperature, luminosity, and radius. We only correct for the effects of the Milky Way extinction and do not include the host-galaxy extinction since it appears to be negligible. The results show a nearly constant blackbody temperature and radius and a decreasing blackbody luminosity with time. Our blackbody fits are consistent with the fits performed by Zhu et al. (2023) using SUPERBOL (Nicholl, 2018).
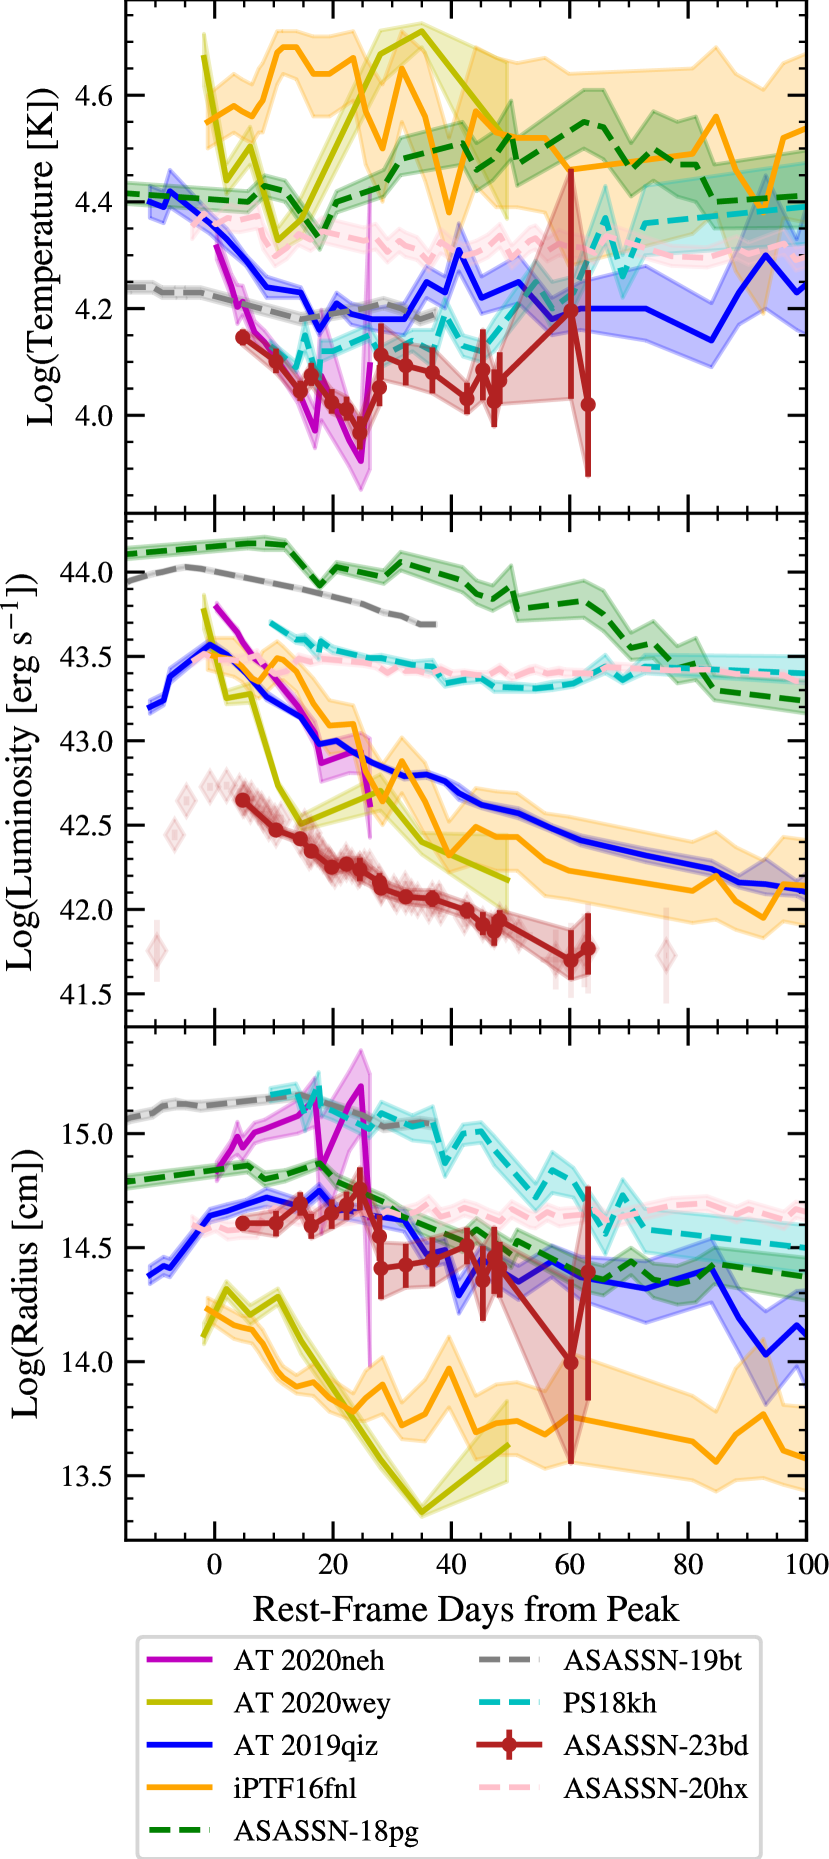
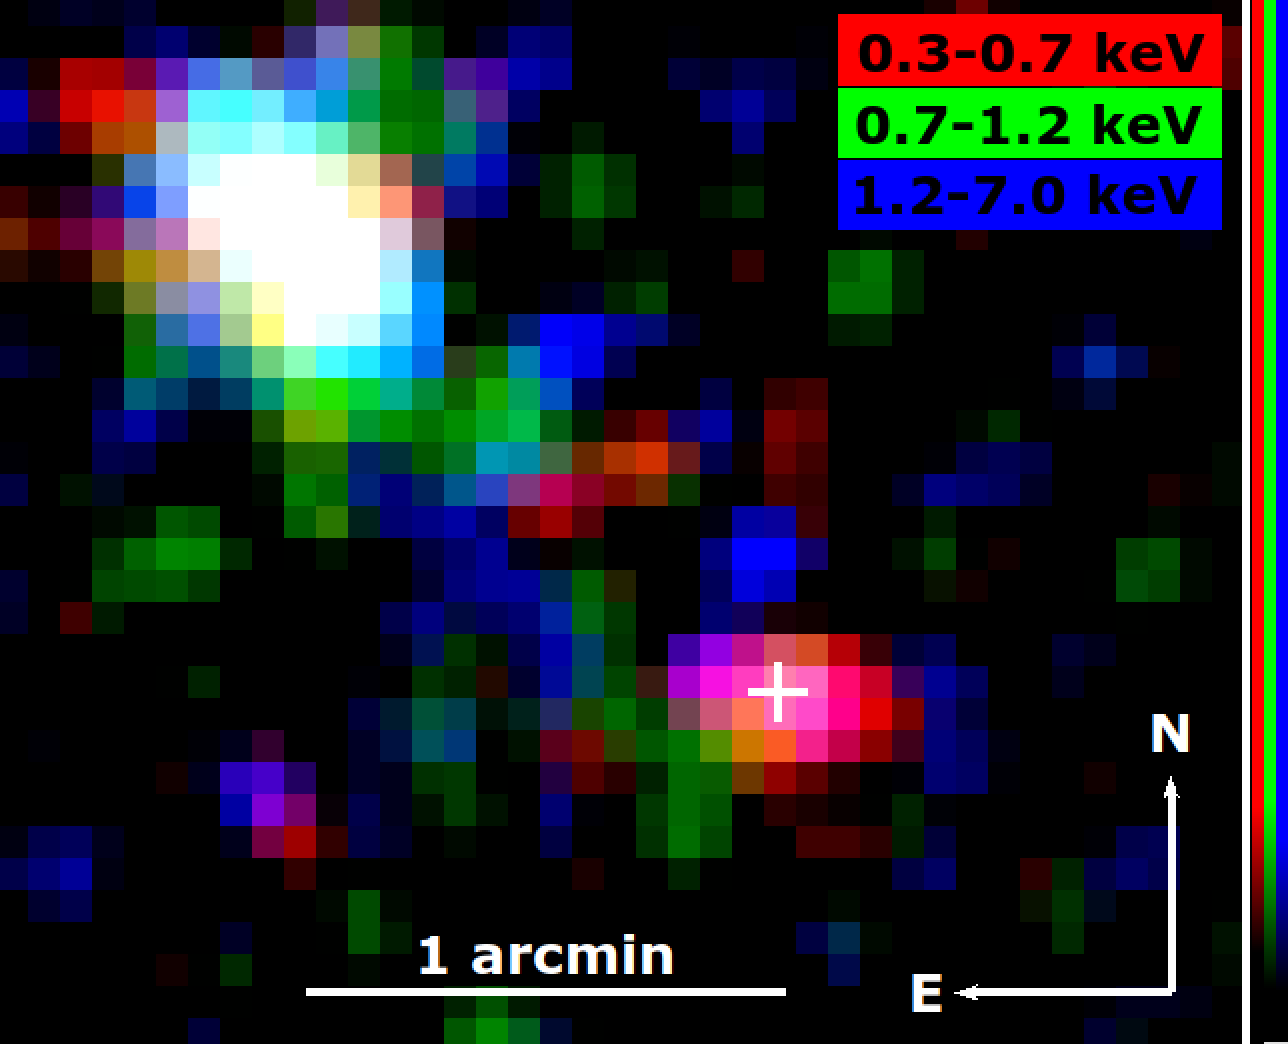
Figure 6 shows a smoothed, 3-color image of the XMM-Newton detection created using the standard pipeline bands for etruecolor131313https://heasarc.gsfc.nasa.gov/docs/xmm/sas/USG/etruecolor.html. The XMM-Newton data implies a blackbody with erg s-1 and keV, and thus, a (spherical) photospheric radius of 1. cm (see Section 2.3.3), which is much smaller than the Schwarzschild radius for a 106 SMBH of 3. cm. An unphysically small blackbody radius for the X-ray emission is a common occurrence in TDEs (e.g., Brown et al. 2017; Hinkle et al. 2021a). Mummery (2021) showed that assuming a single-temperature, spherical blackbody can underestimate the TDE accretion disc size by up to an order of magnitude.
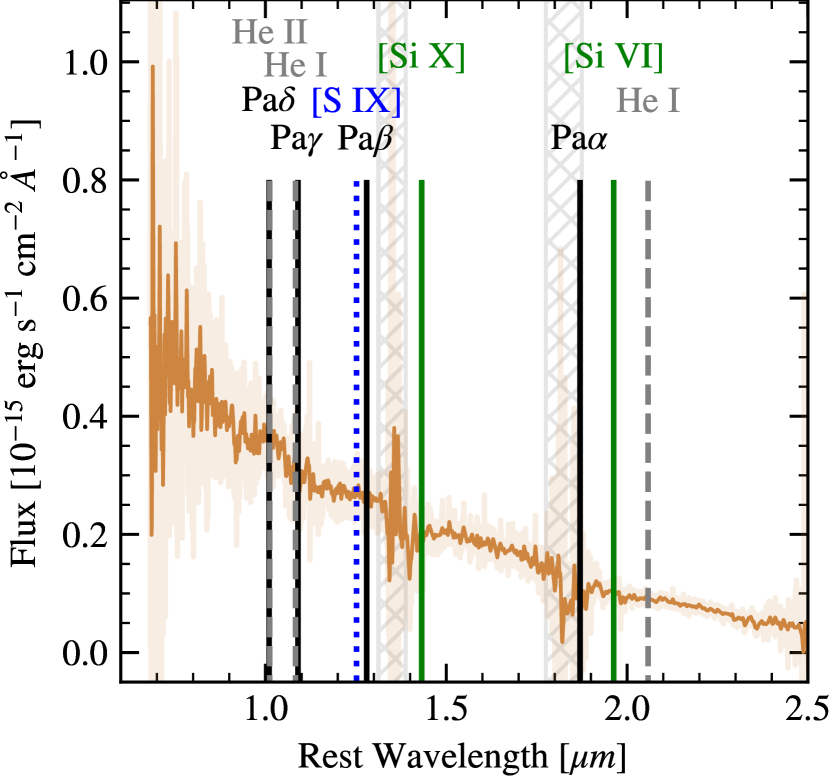
3.3 Spectroscopic Analysis
The optical spectra of ASASSN-23bd are presented in Figure 7. We photometrically calibrated (also known as color matching or “mangling”; Hsiao et al. 2007) the spectra using the optical photometry from POISE. Synthetic fluxes were calculated from each spectrum and compared to the POISE fluxes. The flux ratios are fit by a spline, which is then used to correct the spectrum. This process is repeated until the synthetic fluxes agree with the POISE fluxes. Our NIR spectrum is presented in Figure 8; no mangling was applied, and we note that ASASSN-23bd lacks the NIR spectral features commonly observed in AGNs such as H, He, or coronal emission lines. The lack of coronal lines seems to require having little nuclear gas.
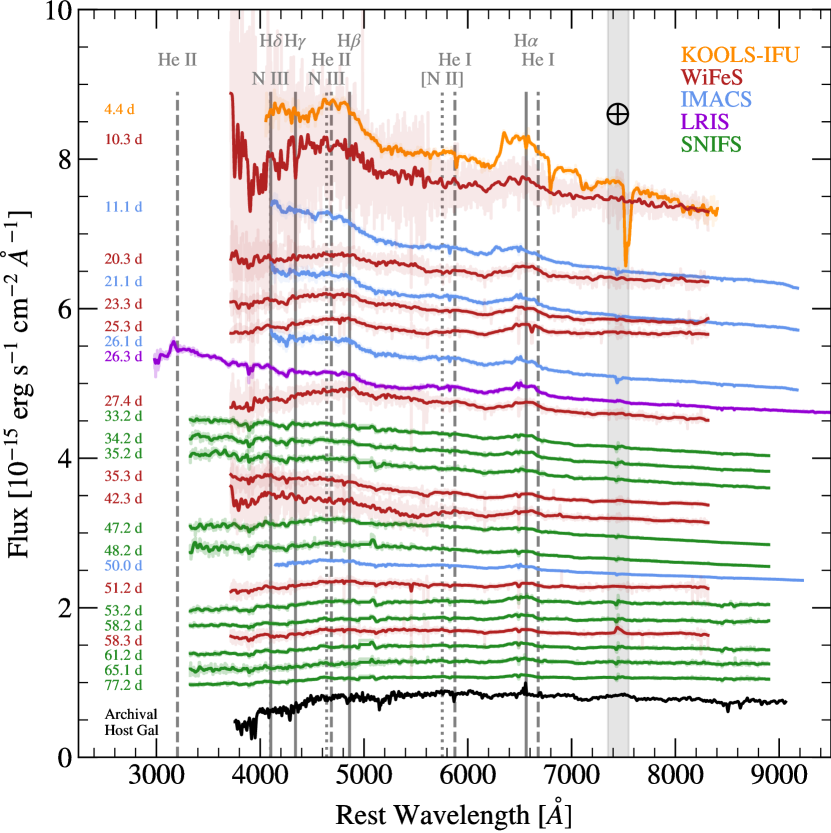
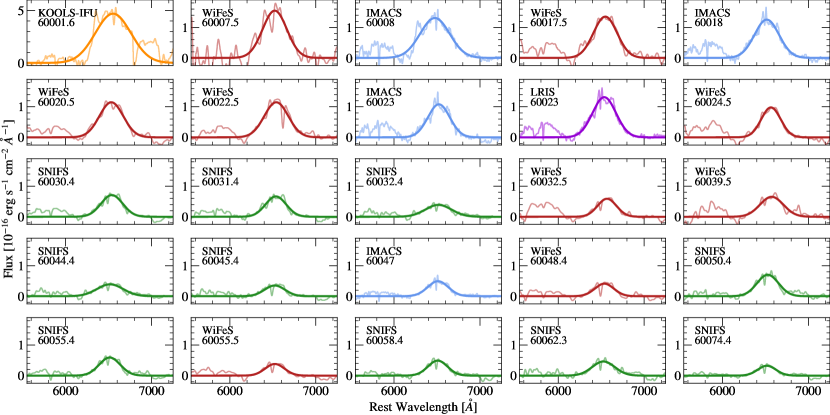
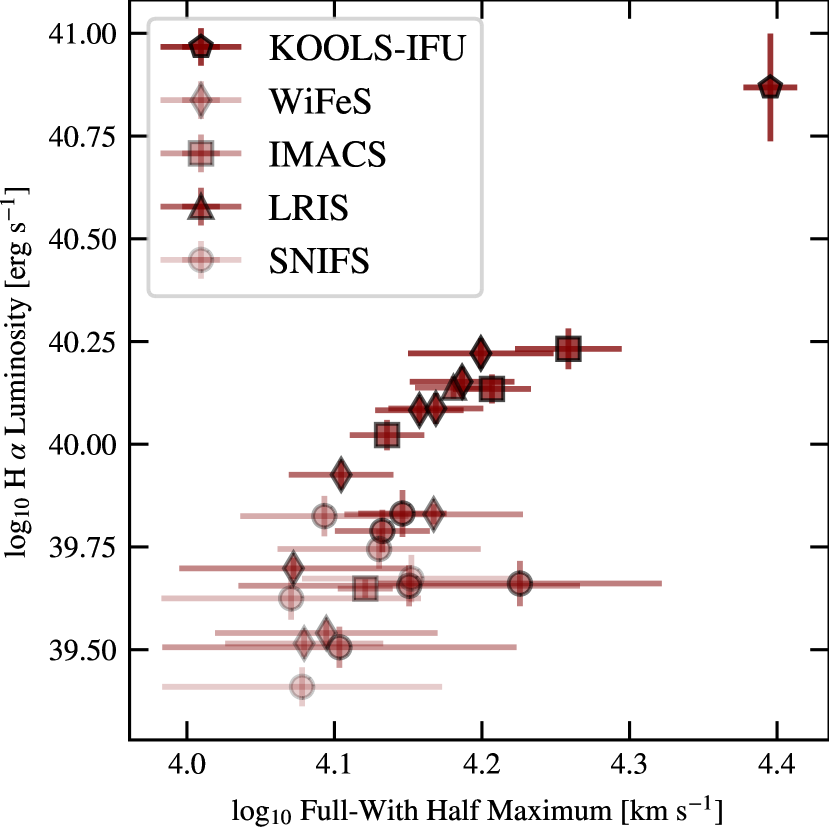
We see prominent H and weak H and He i emission in all our optical spectra, along with He ii 4868 in the earliest spectra. While there is also He ii 3100 emission in the Keck-I LRIS spectrum. The rest of our spectral data do not extend this far into the blue. From these features, ASASSN-23bd is a member of the H+He TDE class (Leloudas et al., 2019; van Velzen et al., 2021). We fit the H line with a Gaussian using a linear continuum model normalized to the line bracketing regions Å Å and Å Å. Figure 9 shows the evolution of the H feature over time, as well as our Gaussian fits. Figure 10 displays the integrated luminosity of each Gaussian and its FWHM. As the phase increases, the H luminosity monotonically declines. We find evidence for a correlation between H integrated luminosity and FWHM with a Kendall value of 0.473 corresponding to a value of 0.001, suggesting a weak, linear trend. This is the typical evolution of a TDE, where spectral lines narrow as they become less luminous.
4 Discussion
4.1 TDE or AGN Flare?
While ASASSN-23bd was initially classified as a TDE and Zhu et al. (2023) rule out a Type II supernova due to the lack of low-ionization metals in the spectra near peak, the indicators of weak AGN activity in NGC 3799 might imply that ASASSN-23bd could instead be an AGN flare. For example, “starved”, low-luminosity AGNs such as NGC 3799 may have occasional flares that resemble TDEs (Saxton et al., 2018). In this section, we evaluate the observations of ASASSN-23bd to determine if it is indeed a TDE or, instead, an AGN flare from an otherwise quiescent AGN.
We observe a rapid rise to peak and a smooth decline thereafter, a hot, constant blackbody temperature, no Mg ii or Fe ii emission features, and a central SMBH mass less than . These characteristics are generally attributed to TDEs rather than AGN flares (Zabludoff et al., 2021; Frederick et al., 2021). Our NIR spectrum does not show spectral features, unlike the spectra of AGN and CL-AGN (Landt et al., 2008; Neustadt et al., 2023). Furthermore, a LINER designation does not necessarily signify the presence of an AGN. The line ratios seen for LINERs may also originate from post-AGB stars (Yan & Blanton, 2012) or merger-induced shocks (Rich et al., 2015).
The supersoft X-ray spectrum detected by XMM-Newton 95 days post-peak also favors the TDE hypothesis. A supersoft spectrum would be unusual for a low-luminosity AGN experiencing stochastic variability (Auchettl et al., 2018). Soft X-ray variability due to a change in obscuration is typically accompanied by strong hard X-ray emission (e.g., Sazonov et al., 2007), which we do not see here. Conversely, an observed soft X-ray spectrum is expected and commonly observed in TDEs (e.g., Auchettl et al., 2017, 2018; van Velzen et al., 2021; Guolo et al., 2023). For a TDE, the earliest Swift non-detection implies that any earlier X-ray peak must be very weak or that there is only a late-time rise, as has been observed in other TDEs (e.g., ASASSN-15oi Gezari et al., 2017; Holoien et al., 2018, OGLE16aaa Kajava et al., 2020, and ASASSN-19dj Hinkle et al., 2021b). While the X-ray data do not conclusively point to a TDE interpretation, a growing number of AGN also show soft X-ray emission (e.g., Boller et al., 2021; Jiang et al., 2022; Sacchi et al., 2023), the combined X-ray, UV, optical, and NIR evidence argues for a TDE interpretation.
4.2 The Early-Time Rises of TDEs and Other Nuclear Transients
There are early-time light curve fits for the TDEs ASASSN-19bt (Holoien et al., 2019b), ASASSN-19dj (Hinkle et al., 2021b), ZTF19abzrhgq/AT 2019qiz (Nicholl et al., 2020), ZTF20acitpfz/AT 2020wey (Charalampopoulos et al., 2023), and ASASSN-22ci/AT 2022dbl (Hinkle et al. 2024, in prep), all of which are consistent with a rise of . ASASSN-23bd, however, has a nearly linear rise. ASASSN-23bd is not alone in this regard: other nuclear transients such as the repeating partial TDE ASASSN-14ko (Payne et al., 2021; Tucker et al., 2021; Payne et al., 2022; Cufari et al., 2022; Liu et al., 2023) and the ANT ASASSN-20hx (Hinkle et al., 2022) also display linear rises.
Interestingly, the majority of TDEs with rises have hosts that do not display AGN activity, whereas the hosts of the linearly-rising ASASSN-14ko, ASASSN-20hx, and ASASSN-23bd show signs of AGN activity. Thus, AGN activity and early-time light curve rise shape may be connected since TDEs in host galaxies with AGN activity predominantly have rises while those in non-AGN hosts exclusively have rises. There are currently no theoretical explanations for the trends seen in the early-time rises of TDEs, including the now-apparent bimodality between linear and quadratic rises. There are no models for the origin of a rise as opposed to a rise, which can be caused by a constant expansion velocity at a fixed temperature. Further early-time observations of TDEs are needed to determine if there is a correlation.
4.3 Comparison to Other TDEs
In this subsection, we compare ASASSN-23bd to other TDEs and nuclear transients. Our comparison sample consists of iPTF16fnl (Blagorodnova et al., 2017), PS18kh (Holoien et al., 2019b; van Velzen et al., 2019a), ASASSN-18pg (Holoien et al., 2018), ASASSN-19bt (Holoien et al., 2019c), AT 2019qiz (Nicholl et al., 2020), AT 2020neh (Angus et al., 2022), ASASSN-20hx (Hinkle et al., 2022), and AT 2020wey (Charalampopoulos et al., 2022). We compiled this sample by selecting LLaF TDEs and several “normal” TDEs observed at peak. We also include the ANT ASASSN-20hx since it also has a linearly rising early-time light curve. The data are taken from the literature except for AT 2020neh and AT 2020wey, which we re-fit using the Swift photometry from Angus et al. (2022) and Charalampopoulos et al. (2022), respectively.
In Figure 5, ASASSN-23bd has the lowest temperature and luminosity in our sample. While the temperature of ASASSN-23bd is similar to AT 2020neh and PS18kh, it is cooler than the other LLaF TDEs. In addition to being the least luminous object in our sample, ASASSN-23bd also rapidly declines in luminosity with a decline rate similar to iPTF16fnl, AT 2019qiz, and AT 2020wey but not quite as steep as AT 2020neh. The Eddington luminosity derived for the estimate from Section 3.1 is erg s-1. The peak bolometric luminosity of ASASSN-23bd is erg s-1, corresponding to an Eddington ratio of / = . This is smaller than every TDE analyzed by Mockler et al. (2019), where the smallest Eddington ratio was 0.11, and two orders of magnitude smaller than the typical value of 1 found by Wevers et al. (2019). Finally, the blackbody radius of ASASSN-23bd is similar to ASASSN-18pg, AT 2019qiz, and AT 2020neh and larger than AT 2020wey and iPTF16fnl. This may be an empirical indicator for TDEs occurring in AGN hosts since ASASSN-23bd and AT 2019qiz are also in weak AGN galaxies, but the sample size is still small.
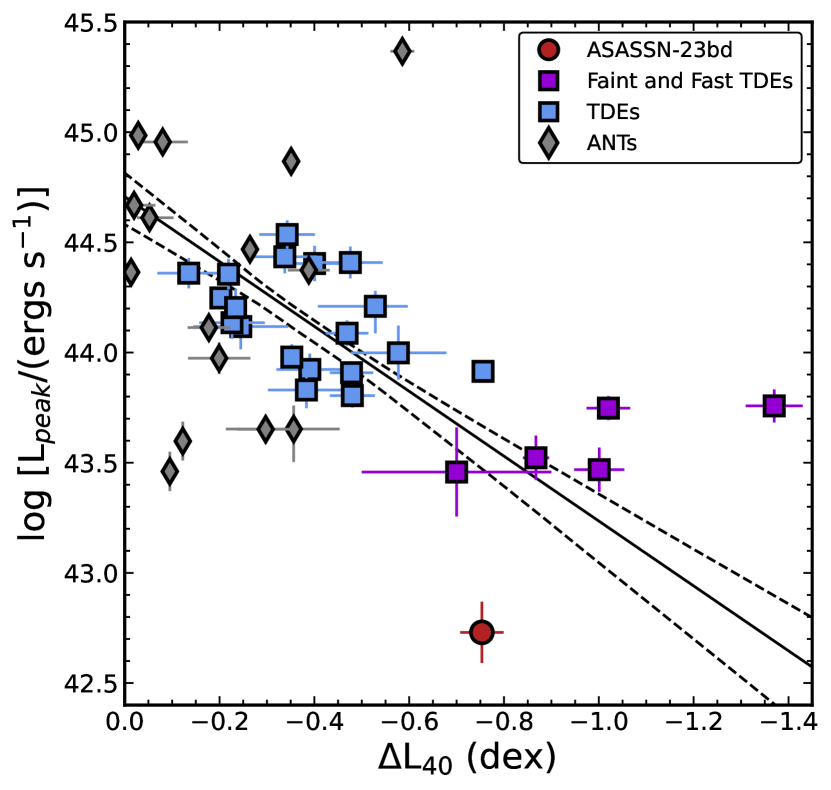
Figure 11 shows the peak-decline relationship for TDEs (Hinkle et al., 2020) along with the ANTs for comparison. ASASSN-23bd is less luminous than the rest of our sample, with a peak luminosity of 1042.7 erg s-1, whereas the “normal” TDE sample clusters between 1044.0 to 1044.5 erg s-1. The decline parameter is defined as
| (4) |
ASASSN-23bd has a decline parameter of , which is faster than the normal TDEs with to , and the ANTs which have to . However, this is a slower decline than most of the other LLaF TDEs.
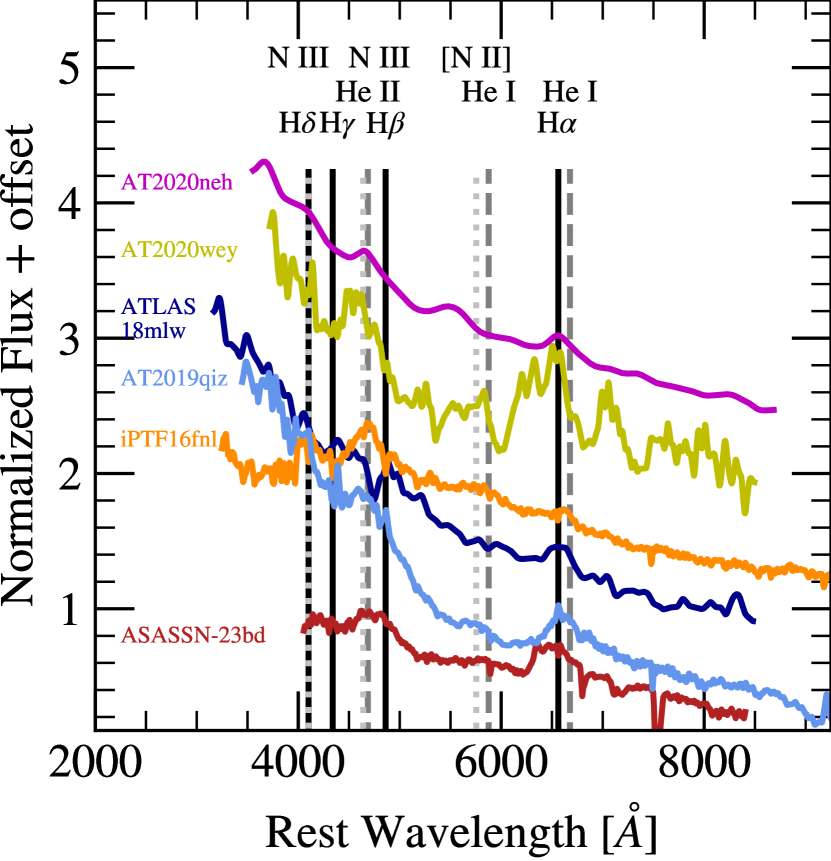
ASASSN-23bd shows several spectral similarities to the LLaF TDEs iPTF16fnl (Blagorodnova et al., 2017), ATLAS18mlw (Hinkle et al., 2023), AT 2019qiz (Nicholl et al., 2020), AT 2020neh (Angus et al., 2022), and AT 2020wey (Charalampopoulos et al., 2022). We show the spectra closest to maximum light for each of these TDEs in Figure 12. Both iPTF16fnl and AT 2020wey show H and He i emission, whereas AT 2020neh shows only H. ASASSN-23bd also shows prominent H emission while its He i emission is weaker than iPTF16fnl and AT 2020wey. Prior to peak, all three of these other TDEs show strong He ii emission, which quickly fades post-peak. The He ii line is present in our WiFes and IMACS spectra at d and d, respectively, and in the LRIS spectrum at d.
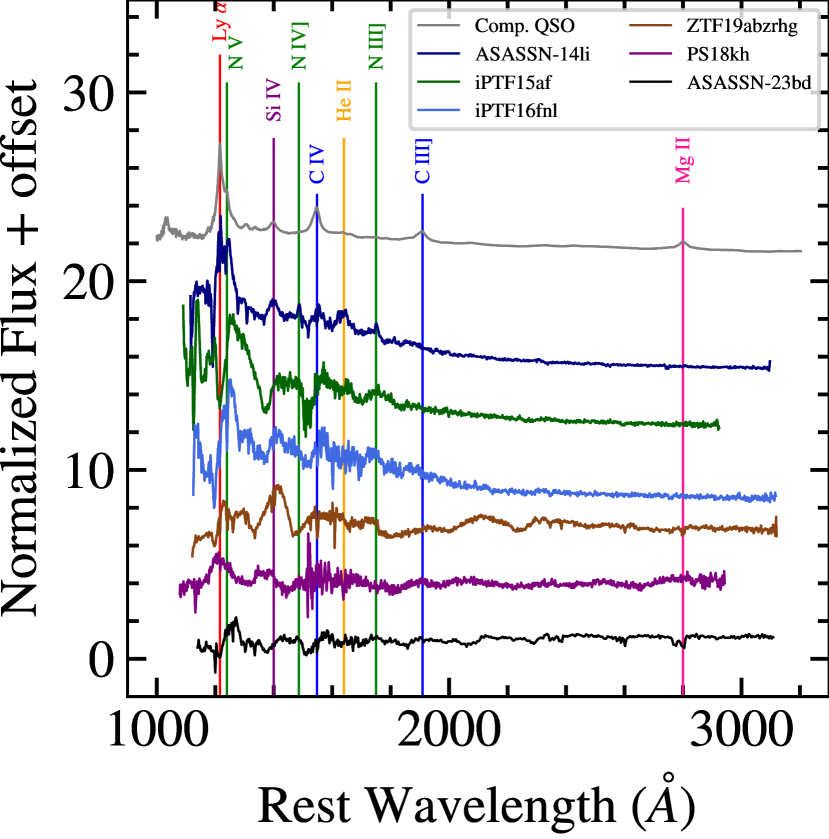
Since there are limited UV spectra of TDEs, we assemble a separate comparison sample of objects with HST spectroscopy. The comparison objects are ASASSN-14li (Cenko et al., 2016), iPTF15af (Blagorodnova et al., 2019), iPTF16fnl (Brown et al., 2018), PS18kh (Hung et al., 2019), ZTF19abzrhg/AT 2019qiz (Hung et al., 2020c), and the composite SDSS QSO spectrum from Vanden Berk et al. (2001). These TDEs and ASASSN-23bd are shown in Figure 13. Compared to the other TDEs with UV spectra, ASASSN-23bd is most similar to iPTF15af (Blagorodnova et al., 2019) and iPTF16fnl (Brown et al., 2018). While those two objects have various emission features blueward of 1800 Å and noticeable blackbody continua, the spectrum of ASASSN-23bd is much cooler and does not exhibit carbon or Lyman emission lines. Conversely, all three TDEs exhibit nitrogen emission features such as N iii] and N iv]. This is consistent with the claim that TDEs are expected to be enriched in nitrogen, whereas AGNs should have carbon and Mg ii emission instead (Kochanek, 2016; Mockler et al., 2022). Mg ii appears to be a good diagnostic to differentiate between TDEs and AGNs. No TDE to date has exhibited Mg ii emission.
5 Summary
In this manuscript, we present the discovery and multiband photometric and spectroscopic data of the LLaF nuclear transient ASASSN-23bd in NGC 3799. NGC 3799 is a star-forming galaxy with signs of potential weak AGN activity. ASASSN-23bd peaked on MJD , had a peak UV/optical luminosity of erg s-1, and has a near peak X-ray upper limit of erg s-1 and late-time X-ray detection of erg . Spectroscopically, ASASSN-23bd shows emission throughout its decline, as well as He ii emission near peak and He i emission shortly after the peak. The early rise of ASASSN-23bd is well fit by a near linear power law ( with an exponent ). We speculate that TDEs in galaxies with no AGN activity seem to rise with power laws, whereas TDEs in galaxies with existing AGN activity seem to prefer rises.
The UV/optical SED of ASASSN-23bd is well fit by a blackbody, and the blackbody temperature is among the coolest of all LLaF TDEs with values and evolution most similar to AT 2020neh. The luminosity is less than any other LLaF TDE such as iPTF16fnl, AT 2020wey, and AT 2020neh.
ASASSN-23bd is the lowest redshift TDE to date and due to its low luminosity, ASASSN-23bd may not have been detected if it were not so close to us. In this sense, ASASSN-23bd is a fine but fortunate addition to the collection of LLaF TDEs. More LLaF TDEs should be discovered by deeper sky surveys such as LSST, providing further advances in the understanding of the variety of nuclear transients.
Acknowledgements
We thank Las Cumbres Observatory and its staff for their continued support of ASAS-SN. ASAS-SN is funded in part by the Gordon and Betty Moore Foundation through grants GBMF5490 and GBMF10501 to the Ohio State University, and also funded in part by the Alfred P. Sloan Foundation grant G-2021-14192.
This material is based upon work supported by the National Science Foundation Graduate Research Fellowship Program under Grant No. 2236415. Any opinions, findings, and conclusions or recommendations expressed in this material are those of the author(s) and do not necessarily reflect the views of the National Science Foundation.
K.A. would also like to acknowledge Ian Price and Chris Lidman with the ANU 2.3-metre telescope. The automation of the ANU 2.3-metre telescope was made possible through funding provided by the Centre of Gravitational Astrophysics at the Australian National University.
C.S.K. and K.Z.S are supported by NSF grants AST-1907570 and 2307385.
M.D.S. is funded by the Independent Research Fund Denmark (IRFD, grant number 10.46540/2032-00022B )
L.G. acknowledges financial support from the Spanish Ministerio de Ciencia e Innovación (MCIN) and the Agencia Estatal de Investigación (AEI) 10.13039/501100011033 under the PID2020-115253GA-I00 HOSTFLOWS project, from Centro Superior de Investigaciones Científicas (CSIC) under the PIE project 20215AT016 and the program Unidad de Excelencia María de Maeztu CEX2020-001058-M, and from the Departament de Recerca i Universitats de la Generalitat de Catalunya through the 2021-SGR-01270 grant.
J.L. acknowledges support from NSF grant AAG-2206523.
This research is based on observations made with the NASA/ESA Hubble Space Telescope obtained from the Space Telescope Science Institute, which is operated by the Association of Universities for Research in Astronomy, Inc., under NASA contract NAS 5–26555. These observations are associated with program(s) GO 17001. Based on observations obtained with XMM-Newton, an ESA science mission with instruments and contributions directly funded by ESA Member States and NASA
Data Availability
Data is available upon reasonable request to the corresponding author.
References
- Aguado et al. (2019) Aguado D. S., et al., 2019, ApJS, 240, 23
- Alard (2000a) Alard C., 2000a, AAPS, 144, 363
- Alard (2000b) Alard C., 2000b, A&AS, 144, 363
- Alard & Lupton (1998) Alard C., Lupton R. H., 1998, ApJ, 503, 325
- Albareti et al. (2017) Albareti F. D., et al., 2017, ApJS, 233, 25
- Angus et al. (2022) Angus C. R., et al., 2022, Nature Astronomy, 6, 1452
- Arcavi et al. (2014) Arcavi I., et al., 2014, ApJ, 793, 38
- Auchettl et al. (2017) Auchettl K., Guillochon J., Ramirez-Ruiz E., 2017, ApJ, 838, 149
- Auchettl et al. (2018) Auchettl K., Ramirez-Ruiz E., Guillochon J., 2018, ApJ, 852, 37
- Bade et al. (1996) Bade N., Komossa S., Dahlem M., 1996, A&A, 309, L35
- Baldwin et al. (1981) Baldwin J. A., Phillips M. M., Terlevich R., 1981, PASP, 93, 5
- Bellm et al. (2019) Bellm E. C., et al., 2019, PASP, 131, 018002
- Biehl et al. (2018) Biehl D., Boncioli D., Lunardini C., Winter W., 2018, Scientific Reports, 8, 10828
- Blagorodnova et al. (2017) Blagorodnova N., et al., 2017, ApJ, 844, 46
- Blagorodnova et al. (2019) Blagorodnova N., et al., 2019, ApJ, 873, 92
- Bloom et al. (2011) Bloom J. S., et al., 2011, Science, 333, 203
- Boller et al. (2021) Boller T., et al., 2021, A&A, 647, A6
- Brassart & Luminet (2008) Brassart M., Luminet J. P., 2008, A&A, 481, 259
- Breeveld et al. (2011) Breeveld A. A., Landsman W., Holland S. T., Roming P., Kuin N. P. M., Page M. J., 2011, in McEnery J. E., Racusin J. L., Gehrels N., eds, American Institute of Physics Conference Series Vol. 1358, Gamma Ray Bursts 2010. pp 373–376 (arXiv:1102.4717), doi:10.1063/1.3621807
- Brinchmann et al. (2004) Brinchmann J., Charlot S., White S. D. M., Tremonti C., Kauffmann G., Heckman T., Brinkmann J., 2004, MNRAS, 351, 1151
- Brown et al. (2014) Brown P. J., Breeveld A. A., Holland S., Kuin P., Pritchard T., 2014, Ap&SS, 354, 89
- Brown et al. (2016) Brown J. S., Shappee B. J., Holoien T. W.-S., Stanek K. Z., Kochanek C. S., Prieto J. L., 2016, MNRAS, 462, 3993
- Brown et al. (2017) Brown J. S., Holoien T. W.-S., Auchettl K., Stanek K. Z., Kochanek C. S., Shappee B. J., Prieto J. L., Grupe D., 2017, MNRAS, 466, 4904
- Brown et al. (2018) Brown J. S., et al., 2018, MNRAS, 473, 1130
- Bruzual & Charlot (2003) Bruzual G., Charlot S., 2003, MNRAS, 344, 1000
- Burns et al. (2018) Burns C. R., et al., 2018, ApJ, 869, 56
- Burns et al. (2021) Burns C., et al., 2021, The Astronomer’s Telegram, 14441, 1
- Burrows et al. (2005) Burrows D. N., et al., 2005, SSR, 120, 165
- Burrows et al. (2011) Burrows D. N., et al., 2011, Nature, 476, 421
- Carter & Luminet (1983) Carter B., Luminet J. P., 1983, A&A, 121, 97
- Cenko et al. (2012a) Cenko S. B., et al., 2012a, MNRAS, 420, 2684
- Cenko et al. (2012b) Cenko S. B., et al., 2012b, ApJ, 753, 77
- Cenko et al. (2016) Cenko S. B., et al., 2016, ApJ, 818, L32
- Chambers et al. (2016) Chambers K. C., et al., 2016, preprint, (arXiv:1612.05560)
- Chan et al. (2019) Chan C.-H., Piran T., Krolik J. H., Saban D., 2019, ApJ, 881, 113
- Charalampopoulos et al. (2022) Charalampopoulos P., Pursiainen M., Leloudas G., Arcavi I., Newsome M., Schulze S., Burke J., Nicholl M., 2022, arXiv e-prints, p. arXiv:2209.12913
- Charalampopoulos et al. (2023) Charalampopoulos P., Pursiainen M., Leloudas G., Arcavi I., Newsome M., Schulze S., Burke J., Nicholl M., 2023, A&A, 673, A95
- Childress et al. (2014) Childress M. J., Vogt F. P. A., Nielsen J., Sharp R. G., 2014, Ap&SS, 349, 617
- Chornock et al. (2014) Chornock R., et al., 2014, ApJ, 780, 44
- Cid Fernandes et al. (2011) Cid Fernandes R., Stasińska G., Mateus A., Vale Asari N., 2011, MNRAS, 413, 1687
- Coughlin & Nixon (2019) Coughlin E. R., Nixon C. J., 2019, ApJ, 883, L17
- Cufari et al. (2022) Cufari M., Coughlin E. R., Nixon C. J., 2022, ApJ, 929, L20
- Cushing et al. (2004) Cushing M. C., Vacca W. D., Rayner J. T., 2004, PASP, 116, 362
- Dai et al. (2015) Dai L., McKinney J. C., Miller M. C., 2015, ApJ, 812, L39
- Dai et al. (2018) Dai L., McKinney J. C., Roth N., Ramirez-Ruiz E., Miller M. C., 2018, ApJ, 859, L20
- Domínguez et al. (2013) Domínguez A., et al., 2013, ApJ, 763, 145
- Dopita et al. (2007) Dopita M., Hart J., McGregor P., Oates P., Bloxham G., Jones D., 2007, Ap&SS, 310, 255
- Dopita et al. (2010) Dopita M., et al., 2010, Ap&SS, 327, 245
- Dressler et al. (2006) Dressler A., Hare T., Bigelow B. C., Osip D. J., 2006, in McLean I. S., Iye M., eds, Society of Photo-Optical Instrumentation Engineers (SPIE) Conference Series Vol. 6269, Ground-based and Airborne Instrumentation for Astronomy. p. 62690F, doi:10.1117/12.670573
- Eisenstein et al. (2011) Eisenstein D. J., et al., 2011, AJ, 142, 72
- Evans & Kochanek (1989) Evans C. R., Kochanek C. S., 1989, ApJ, 346, L13
- Farrar & Piran (2014) Farrar G. R., Piran T., 2014, arXiv e-prints, p. arXiv:1411.0704
- Fausnaugh et al. (2021) Fausnaugh M. M., et al., 2021, ApJ, 908, 51
- Folatelli et al. (2013) Folatelli G., et al., 2013, ApJ, 773, 53
- Foreman-Mackey et al. (2013) Foreman-Mackey D., Hogg D. W., Lang D., Goodman J., 2013, PASP, 125, 306
- Frederick et al. (2021) Frederick S., et al., 2021, ApJ, 920, 56
- Gafton & Rosswog (2019) Gafton E., Rosswog S., 2019, MNRAS, 487, 4790
- Galbany et al. (2023) Galbany L., et al., 2023, A&A, 679, A95
- Gallegos-Garcia et al. (2018) Gallegos-Garcia M., Law-Smith J., Ramirez-Ruiz E., 2018, ApJ, 857, 109
- Gaskell & Rojas Lobos (2014) Gaskell C. M., Rojas Lobos P. A., 2014, MNRAS, 438, L36
- Gehrels et al. (2004) Gehrels N., et al., 2004, ApJ, 611, 1005
- Gezari et al. (2006) Gezari S., et al., 2006, ApJ, 653, L25
- Gezari et al. (2008) Gezari S., et al., 2008, ApJ, 676, 944
- Gezari et al. (2009) Gezari S., et al., 2009, ApJ, 698, 1367
- Gezari et al. (2012) Gezari S., et al., 2012, Nature, 485, 217
- Gezari et al. (2017) Gezari S., Cenko S. B., Arcavi I., 2017, ApJ, 851, L47
- Golightly et al. (2019) Golightly E. C. A., Coughlin E. R., Nixon C. J., 2019, ApJ, 872, 163
- Graham et al. (2001) Graham A. W., Erwin P., Caon N., Trujillo I., 2001, ApJ, 563, L11
- Grupe et al. (1999) Grupe D., Thomas H.-C., Leighly K. M., 1999, A&A, 350, L31
- Guillochon & Ramirez-Ruiz (2013) Guillochon J., Ramirez-Ruiz E., 2013, ApJ, 767, 25
- Guillochon & Ramirez-Ruiz (2015) Guillochon J., Ramirez-Ruiz E., 2015, ApJ, 809, 166
- Guillochon et al. (2014) Guillochon J., Manukian H., Ramirez-Ruiz E., 2014, ApJ, 783, 23
- Guillochon et al. (2017) Guillochon J., Parrent J., Kelley L. Z., Margutti R., 2017, ApJ, 835, 64
- Guolo et al. (2023) Guolo M., Gezari S., Yao Y., van Velzen S., Hammerstein E., Cenko S. B., Tokayer Y. M., 2023, arXiv e-prints, p. arXiv:2308.13019
- HI4PI Collaboration et al. (2016) HI4PI Collaboration et al., 2016, A&A, 594, A116
- Hammerstein et al. (2021) Hammerstein E., et al., 2021, ApJ, 908, L20
- Hammerstein et al. (2023) Hammerstein E., et al., 2023, ApJ, 942, 9
- Hamuy et al. (2006) Hamuy M., et al., 2006, PASP, 118, 2
- Hart et al. (2023) Hart K., et al., 2023, arXiv e-prints, p. arXiv:2304.03791
- Henden et al. (2015) Henden A. A., Levine S., Terrell D., Welch D. L., 2015, in American Astronomical Society Meeting Abstracts #225. p. 336.16
- Hinkle et al. (2020) Hinkle J. T., Holoien T. W. S., Shappee B. J., Auchettl K., Kochanek C. S., Stanek K. Z., Payne A. V., Thompson T. A., 2020, ApJ, 894, L10
- Hinkle et al. (2021a) Hinkle J. T., et al., 2021a, arXiv e-prints, p. arXiv:2108.03245
- Hinkle et al. (2021b) Hinkle J. T., et al., 2021b, MNRAS, 500, 1673
- Hinkle et al. (2021c) Hinkle J. T., Holoien T. W. S., Shappee B. J., Auchettl K., 2021c, ApJ, 910, 83
- Hinkle et al. (2022) Hinkle J. T., et al., 2022, ApJ, 930, 12
- Hinkle et al. (2023) Hinkle J. T., et al., 2023, MNRAS, 519, 2035
- Holoien et al. (2014a) Holoien T. W.-S., et al., 2014a, MNRAS, 445, 3263
- Holoien et al. (2014b) Holoien T. W.-S., et al., 2014b, ApJ, 785, L35
- Holoien et al. (2016a) Holoien T. W.-S., et al., 2016a, Acta Astron., 66, 219
- Holoien et al. (2016b) Holoien T. W.-S., et al., 2016b, MNRAS, 463, 3813
- Holoien et al. (2018) Holoien T. W.-S., Brown J. S., Auchettl K., Kochanek C. S., Prieto J. L., Shappee B. J., Van Saders J., 2018, MNRAS, 480, 5689
- Holoien et al. (2019a) Holoien T. W.-S., et al., 2019a, MNRAS, 484, 1899
- Holoien et al. (2019b) Holoien T. W. S., et al., 2019b, ApJ, 880, 120
- Holoien et al. (2019c) Holoien T. W. S., et al., 2019c, ApJ, 883, 111
- Holoien et al. (2020) Holoien T. W. S., et al., 2020, ApJ, 898, 161
- Holoien et al. (2022) Holoien T. W. S., et al., 2022, ApJ, 933, 196
- Hsiao et al. (2007) Hsiao E. Y., Conley A., Howell D. A., Sullivan M., Pritchet C. J., Carlberg R. G., Nugent P. E., Phillips M. M., 2007, ApJ, 663, 1187
- Hung et al. (2017) Hung T., et al., 2017, ApJ, 842, 29
- Hung et al. (2019) Hung T., et al., 2019, arXiv e-prints,
- Hung et al. (2020a) Hung T., et al., 2020a, arXiv e-prints, p. arXiv:2003.09427
- Hung et al. (2020b) Hung T., et al., 2020b, arXiv e-prints, p. arXiv:2011.01593
- Hung et al. (2020c) Hung T., et al., 2020c, arXiv e-prints, p. arXiv:2011.01593
- Jiang et al. (2021) Jiang N., Wang T., Hu X., Sun L., Dou L., Xiao L., 2021, ApJ, 911, 31
- Jiang et al. (2022) Jiang J., Gallo L. C., Fabian A. C., Parker M. L., Reynolds C. S., 2022, arXiv e-prints, p. arXiv:2205.08236
- Johansson et al. (2023) Johansson J., Meynardie W., Chu M., Fremling C., 2023, Transient Name Server Classification Report, 2023-1075, 1
- Jones et al. (2021) Jones D. O., et al., 2021, ApJ, 908, 143
- Kajava et al. (2020) Kajava J. J. E., Giustini M., Saxton R. D., Miniutti G., 2020, A&A, 639, A100
- Kara et al. (2018) Kara E., Dai L., Reynolds C. S., Kallman T., 2018, MNRAS, 474, 3593
- Kewley et al. (2001) Kewley L. J., Dopita M. A., Sutherland R. S., Heisler C. A., Trevena J., 2001, ApJ, 556, 121
- Kewley et al. (2006) Kewley L. J., Groves B., Kauffmann G., Heckman T., 2006, MNRAS, 372, 961
- Kochanek (1994) Kochanek C. S., 1994, ApJ, 422, 508
- Kochanek (2016) Kochanek C. S., 2016, MNRAS, 458, 127
- Kochanek et al. (2017) Kochanek C. S., et al., 2017, PASP, 129, 104502
- Komossa (2015) Komossa S., 2015, Journal of High Energy Astrophysics, 7, 148
- Komossa & Greiner (1999) Komossa S., Greiner J., 1999, A&A, 349, L45
- Kriek et al. (2009) Kriek M., van Dokkum P. G., Labbé I., Franx M., Illingworth G. D., Marchesini D., Quadri R. F., 2009, ApJ, 700, 221
- Krisciunas et al. (2017) Krisciunas K., et al., 2017, AJ, 154, 211
- Landolt (2007) Landolt A. U., 2007, AJ, 133, 2502
- Landt et al. (2008) Landt H., Bentz M. C., Ward M. J., Elvis M., Peterson B. M., Korista K. T., Karovska M., 2008, ApJS, 174, 282
- Lantz et al. (2004) Lantz B., et al., 2004, in Mazuray L., Rogers P. J., Wartmann R., eds, Proc. SPIEVol. 5249, Optical Design and Engineering. pp 146–155, doi:10.1117/12.512493
- Law-Smith et al. (2019) Law-Smith J., Guillochon J., Ramirez-Ruiz E., 2019, ApJ, 882, L25
- Law-Smith et al. (2020) Law-Smith J. A. P., Coulter D. A., Guillochon J., Mockler B., Ramirez-Ruiz E., 2020, ApJ, 905, 141
- Leloudas et al. (2019) Leloudas G., et al., 2019, arXiv e-prints,
- Li et al. (2022) Li R., Ho L. C., Ricci C., Trakhtenbrot B., Arcavi I., Kara E., Hiramatsu D., 2022, ApJ, 933, 70
- Liu et al. (2023) Liu C., Mockler B., Ramirez-Ruiz E., Yarza R., Law-Smith J. A. P., Naoz S., Melchor D., Rose S., 2023, ApJ, 944, 184
- Lodato & Rossi (2011) Lodato G., Rossi E. M., 2011, MNRAS, 410, 359
- Lodato et al. (2009) Lodato G., King A. R., Pringle J. E., 2009, MNRAS, 392, 332
- Malyali et al. (2021) Malyali A., et al., 2021, A&A, 647, A9
- Matsubayashi et al. (2019) Matsubayashi K., et al., 2019, PASJ, 71, 102
- Metzger & Stone (2016) Metzger B. D., Stone N. C., 2016, MNRAS, 461, 948
- Mockler et al. (2019) Mockler B., Guillochon J., Ramirez-Ruiz E., 2019, ApJ, 872, 151
- Mockler et al. (2022) Mockler B., Twum A. A., Auchettl K., Dodd S., French K. D., Law-Smith J. A. P., Ramirez-Ruiz E., 2022, ApJ, 924, 70
- Mummery (2021) Mummery A., 2021, MNRAS, 507, L24
- Neustadt et al. (2020) Neustadt J. M. M., et al., 2020, MNRAS, 494, 2538
- Neustadt et al. (2023) Neustadt J. M. M., et al., 2023, MNRAS, 521, 3810
- Nicholl (2018) Nicholl M., 2018, Research Notes of the American Astronomical Society, 2, 230
- Nicholl et al. (2020) Nicholl M., et al., 2020, arXiv e-prints, p. arXiv:2006.02454
- Nicholl et al. (2022) Nicholl M., Lanning D., Ramsden P., Mockler B., Lawrence A., Short P., Ridley E. J., 2022, MNRAS, 515, 5604
- Oke et al. (1995) Oke J. B., et al., 1995, PASP, 107, 375
- Pasham et al. (2015) Pasham D. R., et al., 2015, ApJ, 805, 68
- Payne et al. (2021) Payne A. V., et al., 2021, ApJ, 910, 125
- Payne et al. (2022) Payne A. V., et al., 2022, ApJ, 926, 142
- Phillips (1993) Phillips M. M., 1993, ApJ, 413, L105
- Phillips et al. (2019) Phillips M. M., et al., 2019, PASP, 131, 014001
- Phinney (1989) Phinney E. S., 1989, Nature, 340, 595
- Poole et al. (2008) Poole T. S., et al., 2008, MNRAS, 383, 627
- Poznanski et al. (2012) Poznanski D., Prochaska J. X., Bloom J. S., 2012, MNRAS, 426, 1465
- Prieto et al. (2016) Prieto J. L., et al., 2016, ApJ, 830, L32
- Rayner et al. (2003) Rayner J. T., Toomey D. W., Onaka P. M., Denault A. J., Stahlberger W. E., Vacca W. D., Cushing M. C., Wang S., 2003, PASP, 115, 362
- Rees (1988) Rees M. J., 1988, Nature, 333, 523
- Reines & Volonteri (2015) Reines A. E., Volonteri M., 2015, ApJ, 813, 82
- Ricci & Trakhtenbrot (2023) Ricci C., Trakhtenbrot B., 2023, Nature Astronomy,
- Ricci et al. (2017) Ricci C., et al., 2017, ApJS, 233, 17
- Rich et al. (2015) Rich J. A., Kewley L. J., Dopita M. A., 2015, ApJS, 221, 28
- Ricker et al. (2015) Ricker G. R., et al., 2015, Journal of Astronomical Telescopes, Instruments, and Systems, 1, 014003
- Riess et al. (2022) Riess A. G., et al., 2022, ApJ, 934, L7
- Rockosi et al. (2010) Rockosi C., et al., 2010, in McLean I. S., Ramsay S. K., Takami H., eds, Society of Photo-Optical Instrumentation Engineers (SPIE) Conference Series Vol. 7735, Ground-based and Airborne Instrumentation for Astronomy III. p. 77350R, doi:10.1117/12.856818
- Roming et al. (2005) Roming P. W. A., et al., 2005, SSR, 120, 95
- Roth et al. (2016) Roth N., Kasen D., Guillochon J., Ramirez-Ruiz E., 2016, ApJ, 827, 3
- Sacchi et al. (2023) Sacchi A., Risaliti G., Miniutti G., 2023, A&A, 671, A33
- Salpeter (1955) Salpeter E. E., 1955, ApJ, 121, 161
- Saxton et al. (2018) Saxton C. J., Perets H. B., Baskin A., 2018, MNRAS, 474, 3307
- Sazonov et al. (2007) Sazonov S., Revnivtsev M., Krivonos R., Churazov E., Sunyaev R., 2007, A&A, 462, 57
- Schlafly & Finkbeiner (2011) Schlafly E. F., Finkbeiner D. P., 2011, ApJ, 737, 103
- Shappee et al. (2014) Shappee B. J., et al., 2014, ApJ, 788, 48
- Shiokawa et al. (2015) Shiokawa H., Krolik J. H., Cheng R. M., Piran T., Noble S. C., 2015, ApJ, 804, 85
- Short et al. (2020) Short P., et al., 2020, arXiv e-prints, p. arXiv:2003.05470
- Skrutskie et al. (2006) Skrutskie M. F., et al., 2006, AJ, 131, 1163
- Smith et al. (2002) Smith J. A., et al., 2002, AJ, 123, 2121
- Smith et al. (2020) Smith K. W., et al., 2020, PASP, 132, 085002
- Stanek (2023) Stanek K. Z., 2023, Transient Name Server Discovery Report, 2023-421, 1
- Stern et al. (2004) Stern D., et al., 2004, ApJ, 612, 690
- Stern et al. (2012) Stern D., et al., 2012, ApJ, 753, 30
- Stone et al. (2019) Stone N. C., Kesden M., Cheng R. M., van Velzen S., 2019, General Relativity and Gravitation, 51, 30
- Stritzinger et al. (2011) Stritzinger M. D., et al., 2011, AJ, 142, 156
- Strubbe & Murray (2015) Strubbe L. E., Murray N., 2015, MNRAS, 454, 2321
- Taguchi et al. (2023) Taguchi K., Uno K., Nagao T., Maeda K., 2023, Transient Name Server Classification Report, 2023-438, 1
- Theureau et al. (2007) Theureau G., Hanski M. O., Coudreau N., Hallet N., Martin J. M., 2007, A&A, 465, 71
- Toba et al. (2014) Toba Y., et al., 2014, ApJ, 788, 45
- Tonry et al. (2018a) Tonry J. L., et al., 2018a, PASP, 130, 064505
- Tonry et al. (2018b) Tonry J. L., et al., 2018b, ApJ, 867, 105
- Trakhtenbrot et al. (2019) Trakhtenbrot B., et al., 2019, ApJ, 883, 94
- Tucker et al. (2021) Tucker M. A., et al., 2021, MNRAS, 506, 6014
- Tucker et al. (2022) Tucker M. A., et al., 2022, PASP, 134, 124502
- Tully & Fisher (1977) Tully R. B., Fisher J. R., 1977, A&A, 54, 661
- Ulmer (1999) Ulmer A., 1999, ApJ, 514, 180
- Vallely et al. (2019) Vallely P. J., et al., 2019, MNRAS, 487, 2372
- Vallely et al. (2021) Vallely P. J., Kochanek C. S., Stanek K. Z., Fausnaugh M., Shappee B. J., 2021, MNRAS, 500, 5639
- Vanden Berk et al. (2001) Vanden Berk D. E., et al., 2001, AJ, 122, 549
- Veilleux & Osterbrock (1987) Veilleux S., Osterbrock D. E., 1987, ApJS, 63, 295
- Vinkó et al. (2015) Vinkó J., et al., 2015, ApJ, 798, 12
- Wang & Liu (2016) Wang X.-Y., Liu R.-Y., 2016, Phys. Rev. D, 93, 083005
- Wevers et al. (2019) Wevers T., et al., 2019, MNRAS, 488, 4816
- Woodgate et al. (1998) Woodgate B. E., et al., 1998, PASP, 110, 1183
- Wright et al. (2010) Wright E. L., et al., 2010, AJ, 140, 1868
- Yan & Blanton (2012) Yan R., Blanton M. R., 2012, ApJ, 747, 61
- York et al. (2000) York D. G., et al., 2000, AJ, 120, 1579
- Zabludoff et al. (2021) Zabludoff A., et al., 2021, Space Sci. Rev., 217, 54
- Zhang (2021) Zhang X.-G., 2021, MNRAS, 500, L57
- Zhu et al. (2023) Zhu J., Jiang N., Wang T., Huang S., Lin Z., Wang Y., Wang J.-G., 2023, ApJ, 952, L35
- de Vaucouleurs et al. (1991) de Vaucouleurs G., de Vaucouleurs A., Corwin Herold G. J., Buta R. J., Paturel G., Fouque P., 1991, Third Reference Catalogue of Bright Galaxies. Springer
- van Velzen et al. (2011) van Velzen S., et al., 2011, ApJ, 741, 73
- van Velzen et al. (2019a) van Velzen S., et al., 2019a, ApJ, 872, 198
- van Velzen et al. (2019b) van Velzen S., Gezari S., Hung T., Gatkine P., Cenko S. B., Ho A., Kulkarni S. R., Mahabal A., 2019b, The Astronomer’s Telegram, 12568, 1
- van Velzen et al. (2020) van Velzen S., Holoien T. W. S., Onori F., Hung T., Arcavi I., 2020, Space Sci. Rev., 216, 124
- van Velzen et al. (2021) van Velzen S., et al., 2021, ApJ, 908, 4