Generating Diverse and High-Quality Texts by
Minimum Bayes Risk Decoding
Abstract
One of the most important challenges in text generation systems is to produce outputs that are not only correct but also diverse. Recently, Minimum Bayes-Risk (MBR) decoding has gained prominence for generating sentences of the highest quality among the decoding algorithms. However, existing algorithms proposed for generating diverse outputs are predominantly based on beam search or random sampling, thus their output quality is capped by these underlying methods. In this paper, we investigate an alternative approach – we develop diversity-promoting decoding algorithms by enforcing diversity objectives to MBR decoding. We propose two variants of MBR, Diverse MBR (DMBR) and -medoids MBR (KMBR), methods to generate a set of sentences with high quality and diversity. We evaluate DMBR and KMBR on a variety of directed text generation tasks using encoder-decoder models and a large language model with prompting. The experimental results show that the proposed method achieves a better trade-off than the diverse beam search and sampling algorithms overall.
1 Introduction
There are many reasons why natural language generation systems want to produce outputs that are not only correct but also diverse. For example, in systems involving reranking candidate outputs, the reranking algorithms are more effective when the candidates are diverse Gimpel et al. (2013); Li and Jurafsky (2016); Li et al. (2016); Choudhary et al. (2017). In image captioning, an image may contain many concepts with multiple levels of detail. To achieve human-level image captioning, it is important for models to be able to output a variety of captions covering such diverse information Wang and Chan (2019). As an application, Krause et al. (2017) shows that a diverse set of image captions can be transformed into an entire descriptive paragraph explaining the image. For question generation tasks, a diversity-promoting question generation system can improve question answering systems Sultan et al. (2020) and enhance the engagement in chatbots Laban et al. (2020).
This importance of diversity in text generation has brought many studies aimed at producing diverse outputs instead of the most probable ones. The majority of the approaches are based on either random sampling Fan et al. (2018); Ippolito et al. (2019); Holtzman et al. (2020); Hewitt et al. (2022) or beam search Cho (2016); Li and Jurafsky (2016); Vijayakumar et al. (2016, 2018); Kulikov et al. (2019); Tam (2020), thus the output quality is bounded by the quality of either random sampling or beam search.
In this paper, we develop a diverse decoding method by extending Minimum Bayes Risk (MBR) decoding Goel and Byrne (2000); Kumar and Byrne (2002, 2004); Eikema and Aziz (2022). MBR decoding is shown to generate higher quality sentences than random sampling and beam search in directed text generation tasks including machine translation, text summarization, and data-to-text Freitag et al. (2022); Suzgun et al. (2023). The procedure of the MBR decoding consists of the following steps. First, it samples a set of candidate outputs from the probability model. Then, it computes the similarity of each sequence to the others according to a utility function. Finally, it selects the sequence that maximizes the expected utility over the sequences. A naive approach to generate outputs using MBR is to select the top- outputs with the highest expected utility. However, it tends to select a set of similar sentences with a large overlap (see Appendix B for examples).
We propose two approaches to promote diversity in MBR: Diverse MBR (DMBR) and -Medoids MBR (KMBR). DMBR extends MBR by introducing a diversity penalty to the objective so that it maximizes the weighted sum of the expected utility and diversity. DMBR can tune the quality-diversity trade-off by the weight hyperparameter. KMBR selects a set of sentences by solving the -medoids problem Rdusseeun and Kaufman (1987); Kaufman and Rousseeuw (2009). -medoids is a variant of -means where the center points are restricted to be one of the data points instead of anywhere in the space. We pick a center point from each cluster to generate diverse and high quality outputs.
We evaluate DMBR and KMBR on machine translation, image captioning, question generation, generative common sense reasoning, and text summarization. The experimental results show that DMBR and KMBR achieve better trade-offs than diverse beam search and sampling algorithms. We also observe that DMBR and KMBR achieve higher Oracle quality scores in all the tasks.
2 Background
Sequence-to-sequence generation is the task of generating an output sequence given an input sequence . Probabilistic text generators define a probability distribution over an output space of hypotheses conditioned on an input . The set of complete hypotheses is:
| (1) |
where is a string concatenation and is the Kleene closure of a set of vocabulary . Typically, the goal of decoding is to find the hypothesis that best matches the human preference :
| (2) |
In this paper, we consider a variant of the set decoding problem Meister et al. (2021b) where the task is to generate a set of sentences that maximizes the sum of and the diversity according to the preference of human :
| (3) |
In this paper, we use automated evaluation metrics to approximate . In particular, we consider pairwise-BLEU, distinct-n, and pairwise-sentence BERT as measures of diversity Shen et al. (2019); Li et al. (2016); Reimers and Gurevych (2019).
2.1 Decoding Algorithms for Diversity
Random Sampling
Random sampling is commonly used to generate diverse outputs in both directed and open-ended text generation tasks. A simple solution is to use an ancestral sampling with a temperature parameter to control the stochasticity of the sampling. There are a lot of studies on biasing the ancestral sampling to generate higher quality outputs while maintaining the diversity of the randomized algorithm. Prior work shows that top- sampling that restricts the sampling to the most likely tokens at each step is a better alternative to controlling the temperature in a story generation task Fan et al. (2018); Ippolito et al. (2019). Nucleus sampling Holtzman et al. (2020) is similar to top- sampling and has shown to be more effective than top- sampling in WebText dataset Radford et al. (2019). Nucleus sampling truncates all tokens except those in the nucleus, the smallest possible set of tokens that covers a fraction of the model probability. Epsilon sampling Hewitt et al. (2022) is also a variant of ancestral sampling that truncates tokens whose probability is less than a threshold. They are shown to be more effective than nucleus sampling in the WebText dataset.
Variants of Beam Search
Another line of work is to generate a diverse set of outputs by promoting diversity objectives to the beam search. Beam search considers a fixed number of candidate sequences at each step Graves (2012); Sutskever et al. (2014). It is known to produce higher quality sequences than random sampling in a wide range of tasks. Diversity is induced in the beam search procedure in various forms. Li and Jurafsky (2016) propose to add a diversity constraint to standard beam search so that the number of descendants from the same parent hypothesis is capped at some upper bound. Noisy Parallel Approximate Decoding induces noise to the hidden state of the decoder to generate randomized outputs Cho (2016). Diverse beam search (DBS) adds a diversity term to the reranking objective, penalizing sequences with a small Hamming distance to other groups of the sequences Vijayakumar et al. (2016, 2018). Iterative beam search runs beam search multiple times with a constraint that any partial hypothesis that has been generated in previous iterations is prohibited Kulikov et al. (2019). Clustered beam search prunes similar sequences by clustering the candidates using a word embedding at each decoding step Tam (2020). Post-Decoding Clustering (PDC) proposes to encourage diversity by running the clustering after generating a large number of outputs, selecting good candidates from each cluster Kriz et al. (2019); Ippolito et al. (2019). Best- search points out that the greedy nature of the beam search is the source of the low diversity and shows that the best-first policy can maintain a diverse set of hypotheses as candidates, resulting in higher quality and diversity outputs Xu et al. (2023).
2.2 Minimum Bayes Risk (MBR) Decoding
One of the most common decision rules to solve the decoding problem is maximum-a-posteriori (MAP) decoding. MAP decoding finds the most probable translation under the model.
| (4) |
In this paper, we denote as for simplicity. Although it seems intuitive to compute this MAP objective, previous work has pointed out two critical problems with this strategy. First, because the size of the hypothesis set is extremely large, it is intractable to solve optimally. Second, the MAP objective often leads to low quality output Stahlberg and Byrne (2019); Holtzman et al. (2020); Meister et al. (2020). Indeed, Stahlberg and Byrne (2019) show that is often found to be the empty sequence in their experimental setting.
Unlike MAP decoding, which searches for the most probable output, MBR decoding searches for the output that maximizes expected utility, which is equivalent to minimizing risk Goel and Byrne (2000); Kumar and Byrne (2002, 2004). The procedure consists of two components: a text generation model and a utility metric. The model estimates the probability of an output given an input sentence . The utility metric estimates the quality of a candidate output given a reference output . Given a set of candidate hypotheses , MBR decoding selects the best hypothesis according to its expected utility:
| (5) |
Since is unknown, MBR instead uses the model probability to approximate .
| (6) |
For the rest of the paper, we will denote as for simplicity, unless otherwise noted. Since integration over is computationally intractable, Eq. (6) is approximated by a Monte Carlo estimate Eikema and Aziz (2022); Farinhas et al. (2023) using a set of reference hypotheses sampled from the model :
| (7) |
where is the objective function of the MBR decoding and . Standard practice is to use the same set of hypotheses for the candidate pool () and the reference pool (), therefore .
3 Minimum Bayes Risk Decoding with Diversity
We now introduce MBR decoding to the set decoding problem with diversity objective (Eq. 3). A naive way to generate sentences by MBR decoding is to select the top- hypotheses by Eq. (6):
| (8) |
However, it results in a set of similar sentences with a large overlap. In fact, it often finds almost duplicated sentences in machine translation tasks (Table 1 and 2 in Appendix B).
3.1 Diverse MBR (DMBR)
We propose Diversity MBR (DMBR) decoding, a variant of MBR decoding with a diversity penalty added to the decoding objective. The objective of the DMBR is the following:
| (9) | |||
The objective for consists of two terms: quality objective and diversity objective. The quality objective is the expected utility, the same as the original MBR .
is the diversity objective that penalizes according to a user-defined diversity objective. In this paper, we aim to minimize the utility between each pair of outputs so that the pairwise similarity is minimized:
| (10) |
Assuming , Eq. (9) with the pairwise similarity results in a non-monotonic submodular function maximization problem Buchbinder and Feldman (2018) (proof in Appendix A). Because solving a non-monotonic submodular function maximization problem is NP-hard Feige (1998), we deploy a greedy heuristic algorithm. We greedily select a hypothesis that maximizes the objective until we have hypotheses. This procedure is guaranteed to find a solution with an approximation factor of , provided that is small enough to ensure the function is non-decreasing; otherwise, the approximation factor is slightly worse than Nemhauser et al. (1978). Note that DMBR still needs to compute for every pair of candidates and references. Thus, even with the approximation, DMBR is at best as slow as MBR.111In our experiments, DMBR with 128 samples was roughly 2-4 times slower than diverse beam search with on g4dn.xlarge instances on AWS EC2 (4 vCPU cores, 16 GB memory, and an NVIDIA T4 GPU).
3.2 -Medoids MBR (KMBR)
As an alternative approach to promote diversity, we propose -Medoids MBR (KMBR) decoding. -Medoids is a clustering problem similar to -means in that it chooses centers to minimize the total distance of data points to the closest center points. The difference is that -Medoids needs to choose actual data points as centers Rdusseeun and Kaufman (1987); Kaufman and Rousseeuw (2009). Intuitively, -Medoids center points are supposed to be representative of different clusters of hypotheses. Thus, picking the center points for clusters is likely to result in a set of diverse and high-quality hypotheses. KMBR can be understood as a generalization of the vanilla MBR decoding which is solving the -Medoid problem to find the single most centered hypothesis out of the sampled hypotheses Jinnai and Ariu (2024). We use the negative utility as a distance and consider the problem of picking a set of hypotheses as center points. The total distance from the reference set (= data points) to the picked center points is minimized:
| (11) |
Note that KMBR with recovers the vanilla MBR decoding with a single output (Eq. 6). -medoids can be used with arbitrary dissimilarity measures. Therefore, there is no restriction on the choice of the utility function . Because the -medoids problem is NP-hard to solve exactly, we deploy Partition Around Medoids (PAM) to compute approximately Park and Jun (2009). Similarly to DMBR, KMBR needs to compute the utility function for every pair of hypotheses so it is still slower than MBR even with the approximation algorithm.

4 Experiments
We evaluate DMBR and KMBR in machine translation, text summarization, and image captioning. All experiments use BERTScore Zhang* et al. (2020) as the utility function of the MBR. We compare the performance of the sampling algorithms, beam search, diverse beam search (DBS), MBR, diverse MBR (DMBR), and -Medoids MBR (KMBR).
We evaluate the quality and the diversity of the generated texts. As a quality metric, we report the mean, max, and minimum quality over each set of sentences measured by BLEU, ROUGE-L, or METEOR Papineni et al. (2002); Lin and Och (2004); Banerjee and Lavie (2005). We use a distinct-n Li et al. (2016) and a pairwise-BLEU Shen et al. (2019) as a diversity metric.
Due to limitations in computational resources, we evaluate the first 1000 entries of each dataset. We use Huggingface’s Transformers library for running all the experiments Wolf et al. (2020). We implement PAM for KMBR using the scikit-learn-extra library.222https://github.com/scikit-learn-contrib/scikit-learn-extra/tree/v0.3.0 We initialize the clusters using k-medoids++ with maximum iterations set to . For reproducibility, all the experiments are conducted using publicly available pretrained models and datasets. We use sacreBLEU system Post (2018) to compute BLEU scores.
4.1 Machine Translation
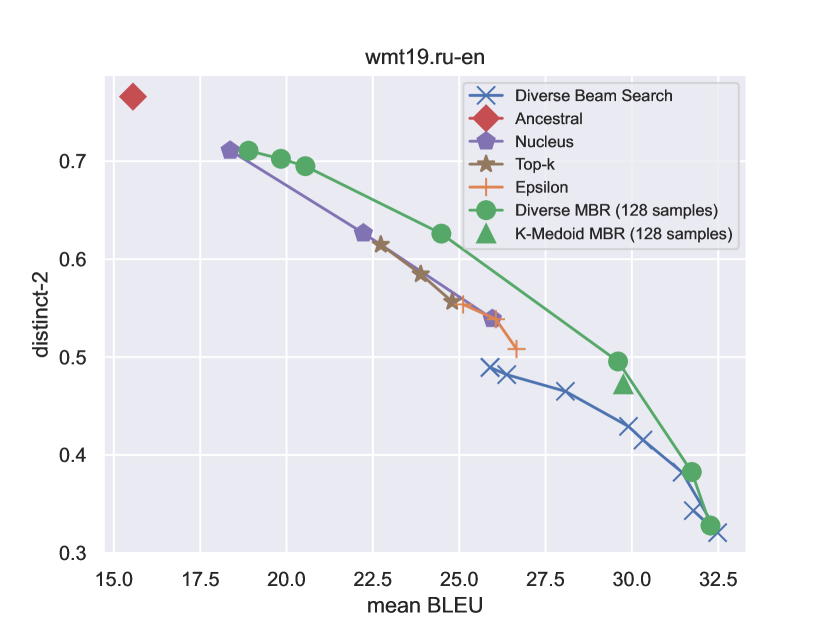
We use the WMT’19 dataset Barrault et al. (2019) to evaluate the performance on machine translation tasks. WMT’19 dataset examines translation between English and other languages in the news domain. We run experiments on two language pairs: German English (DeEn) and Russian English (RuEn) using the pretrained models of each language pair provided by fairseq Ng et al. (2019).333https://github.com/facebookresearch/fairseq/blob/main/examples/wmt19
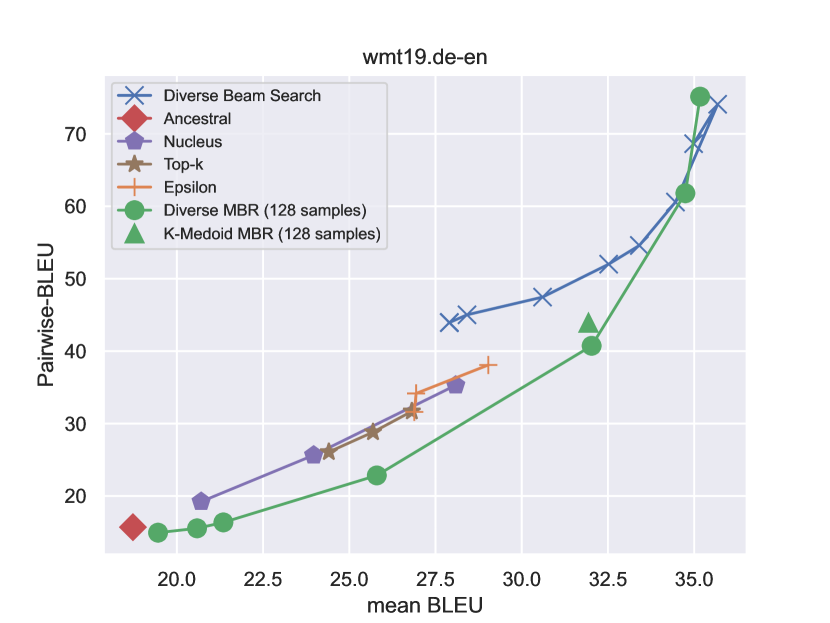
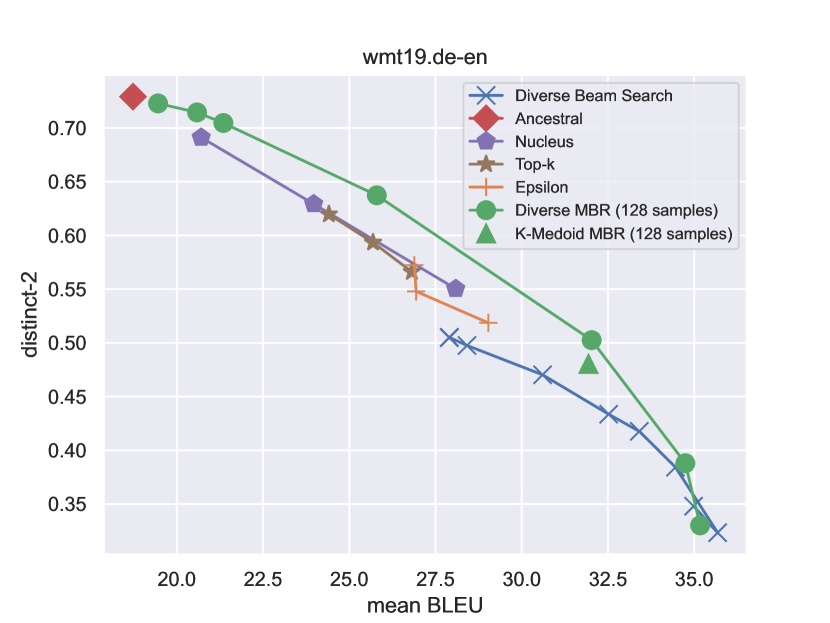
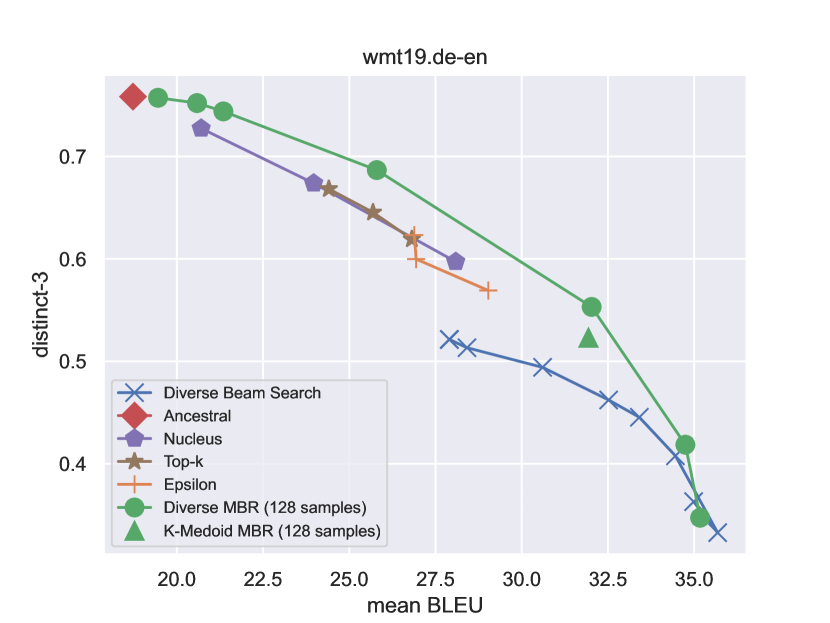
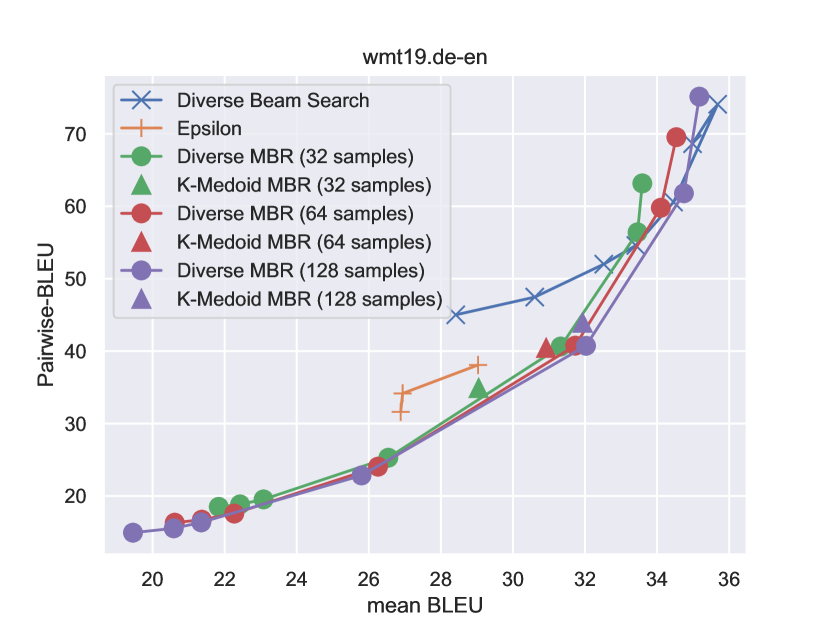
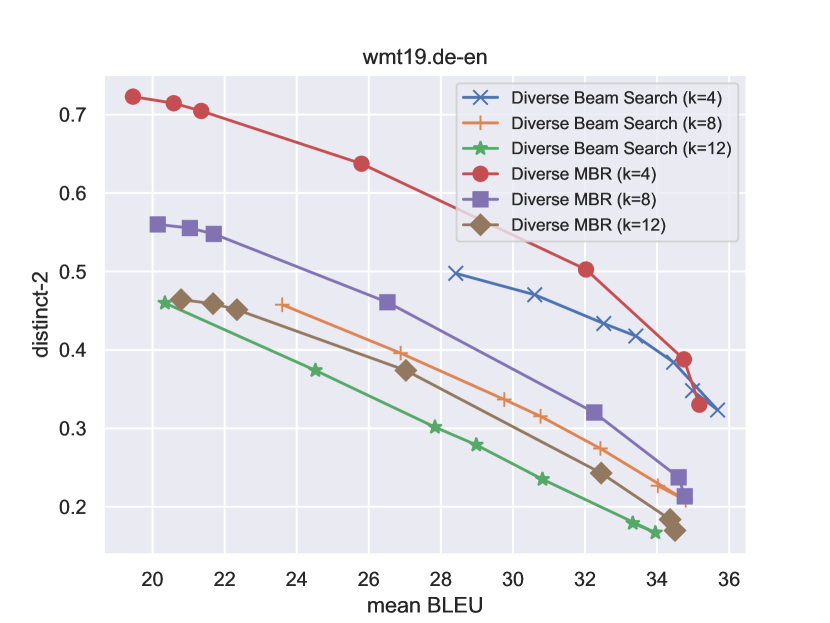
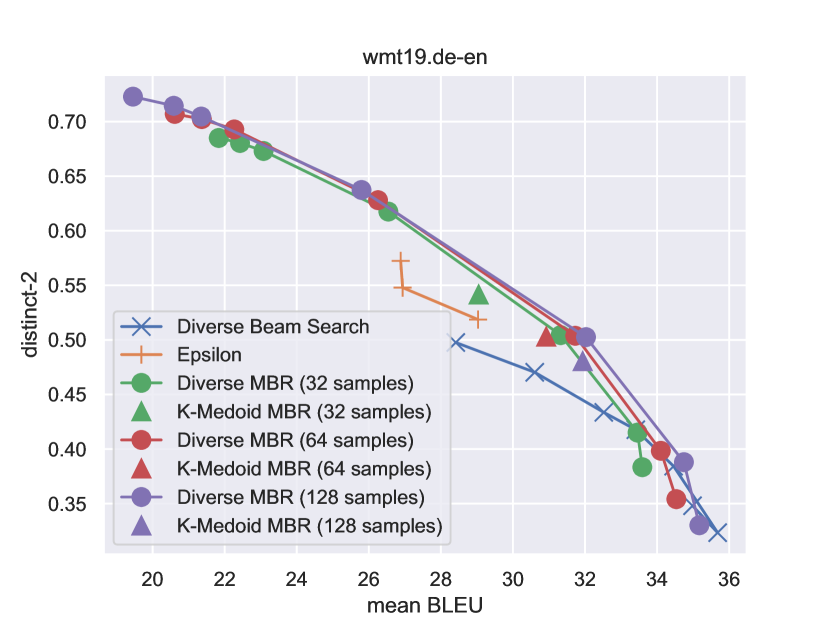
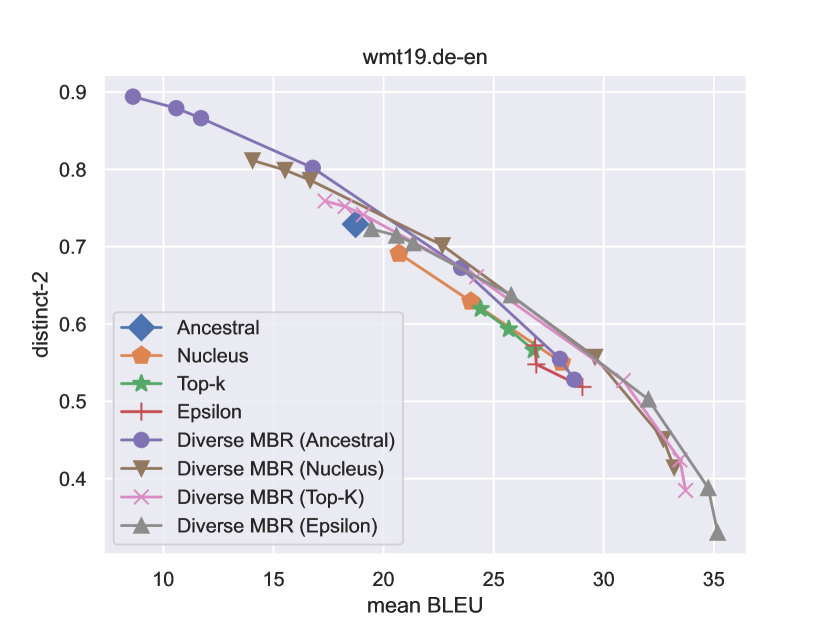
We set the number of outputs to be , and . We compare the performance of sampling algorithms, diverse beam search, and the proposed methods. For sampling algorithms, we evaluate ancestral sampling, nucleus sampling (), top- sampling (), and epsilon sampling () Holtzman et al. (2020); Fan et al. (2018); Hewitt et al. (2022). For DBS, we set the number of groups and the beam width to be . The diverse penalty for DBS is set to (beam search), , and . For DMBR and KMBR, we sample 128 sentences per source sentence with epsilon sampling () Hewitt et al. (2022); Freitag et al. (2023). The diversity penalty is set (vanilla MBR), , and .
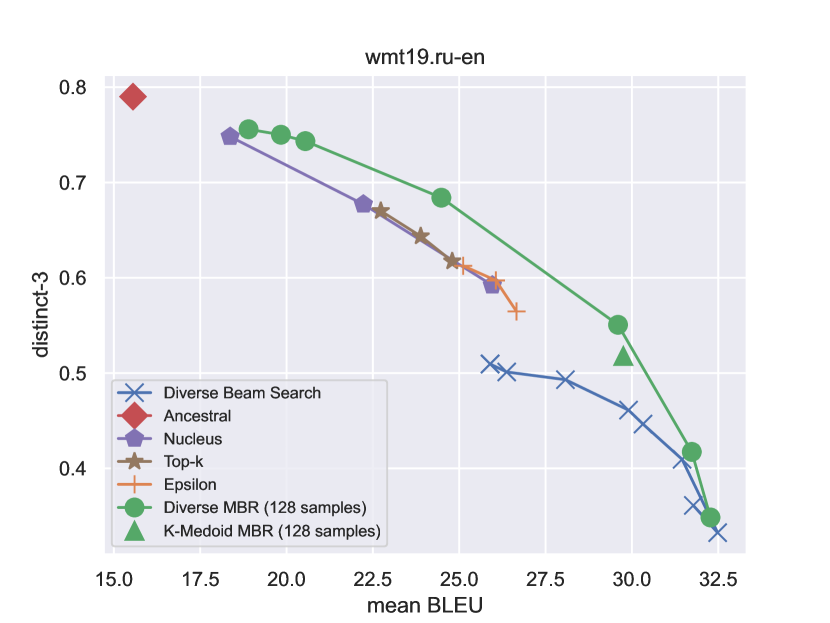
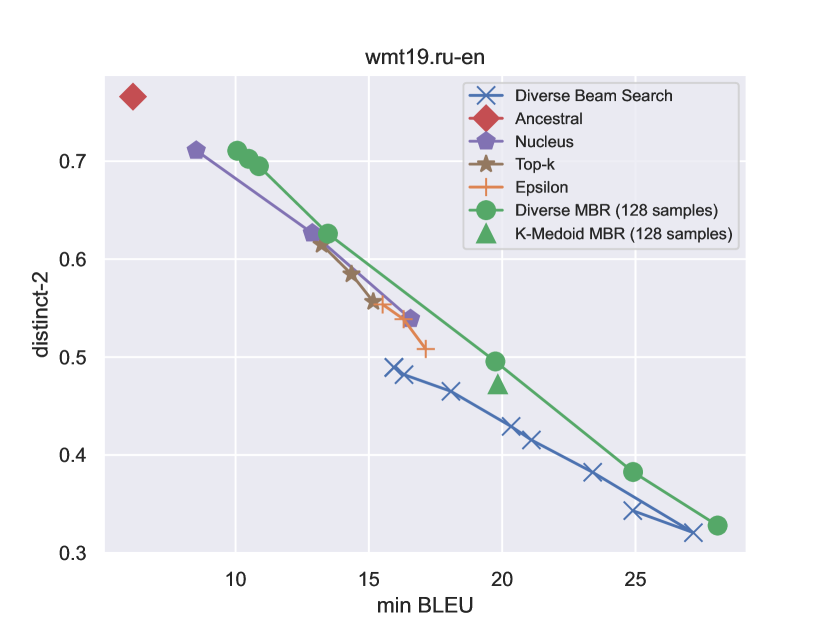
DMBR achieves higher diversity
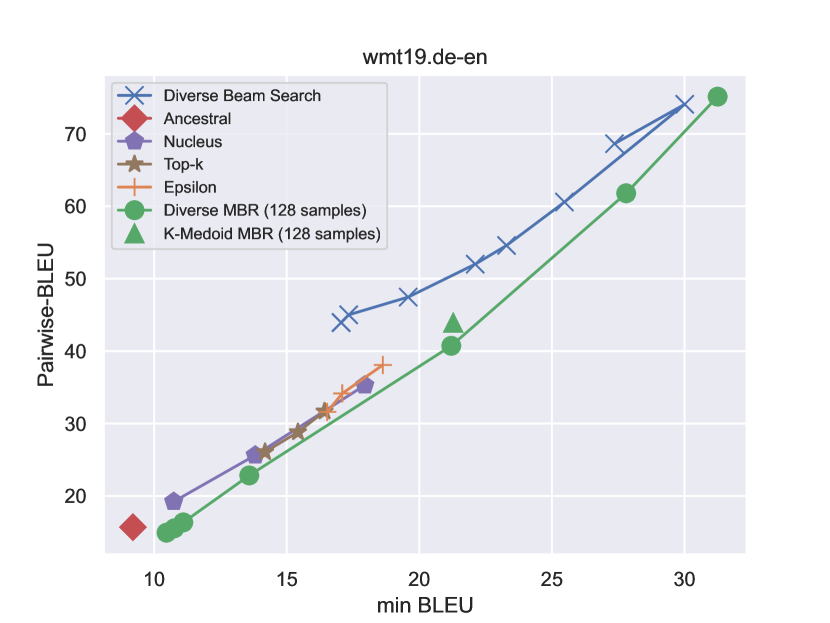
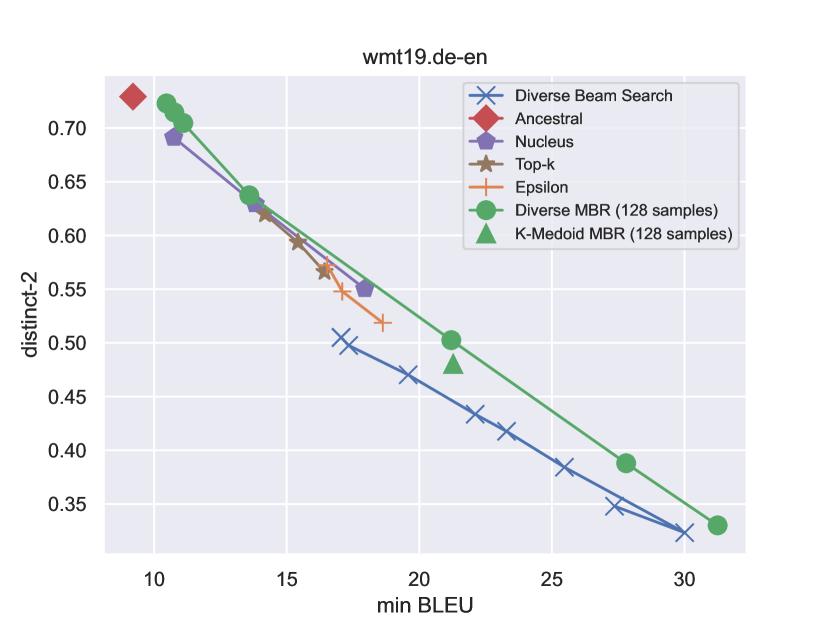
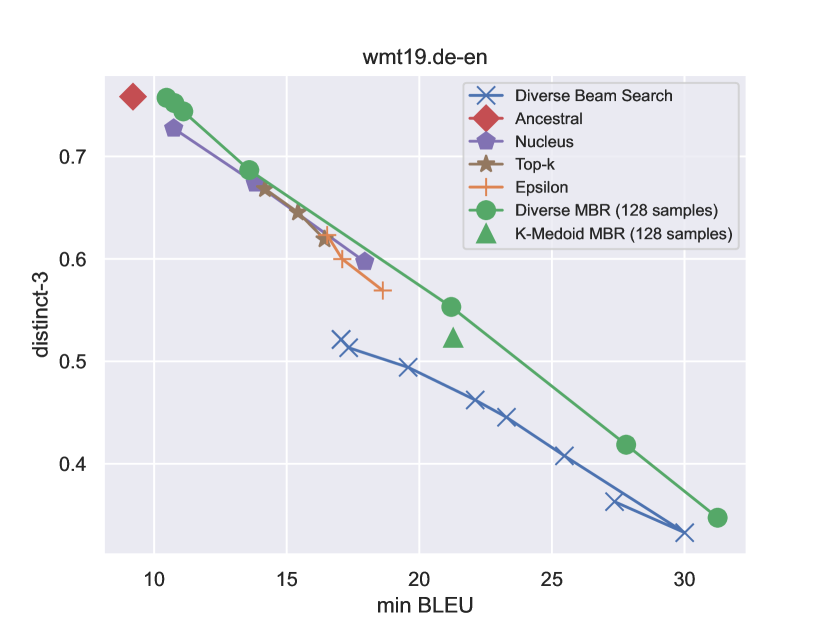
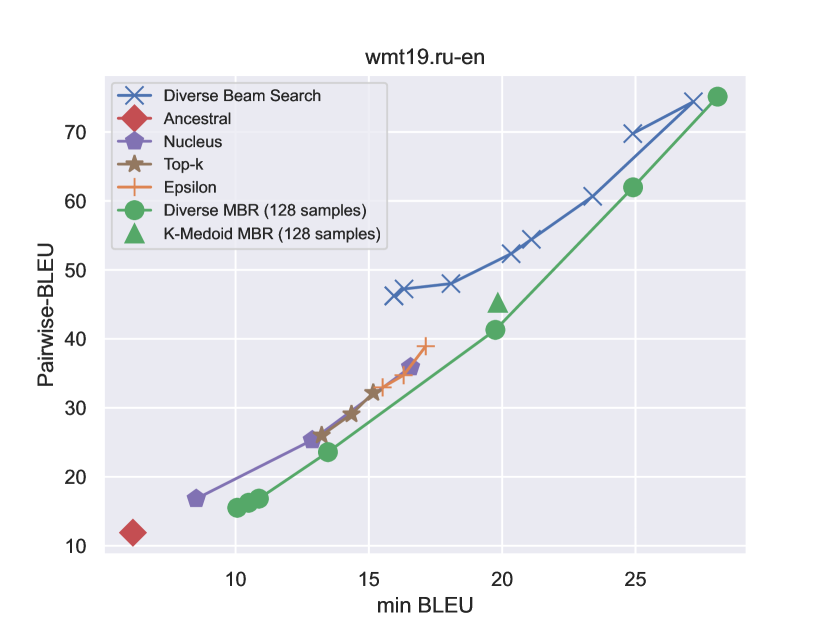
All the evaluation metrics are summarized in Table 7, 8, and 9 in the Appendix. Figure 1 shows the P-BLEU and distinct-2, 3 as a function of mean BLEU score. The results show that DMBR achieves higher diversity (lower P-BLEU and higher distinct-2, 3) than DBS and sampling algorithms with the same mean BLEU score.
DMBR achieves more flexibility than DBS on the quality-diversity trade-off
We observe that DBS does not increase the diversity by increasing the diversity penalty larger than 10.0. On the other hand, the diversity of DMBR continue to increase with larger , achieving higher maximum diversity than DBS. DMBR also achieves higher diversity than the sampling algorithms.
DMBR achieves higher diversity than the underlying sampling algorithm
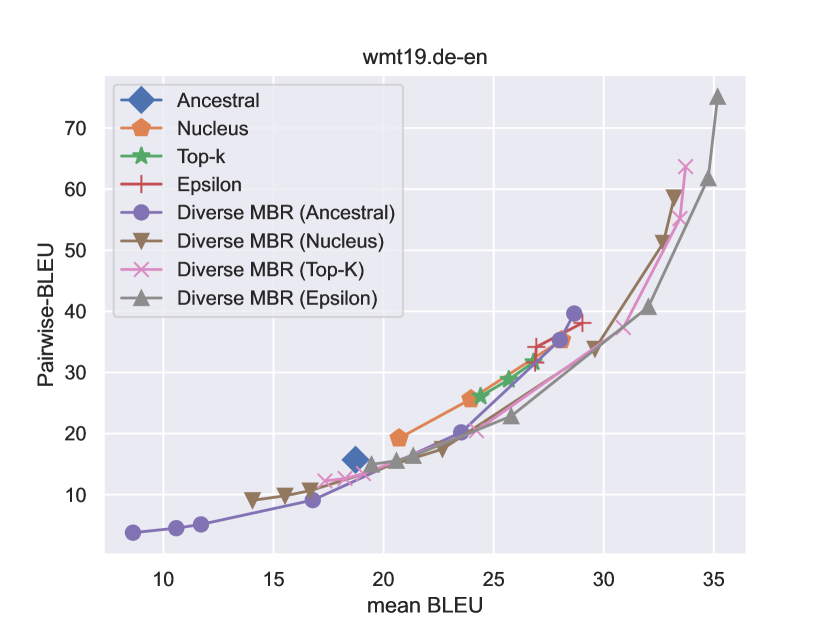
By explicitly choosing samples to maximize the diversity, DMBR achieves higher diversity than the underlying sampling algorithm for all four sampling algorithms we evaluate (Figure 1, 3(c), and 3(f)). This is contrary to many of the beam search-based diversity decoding algorithms as they often fail to improve the diversity upon random sampling. The results show the flexibility of the DMBR to control the trade-off between quality and diversity.
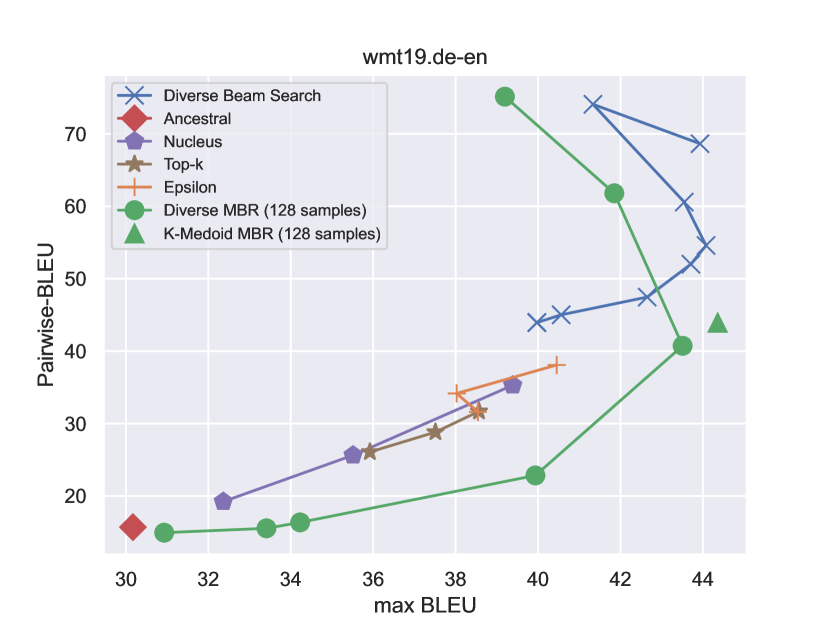
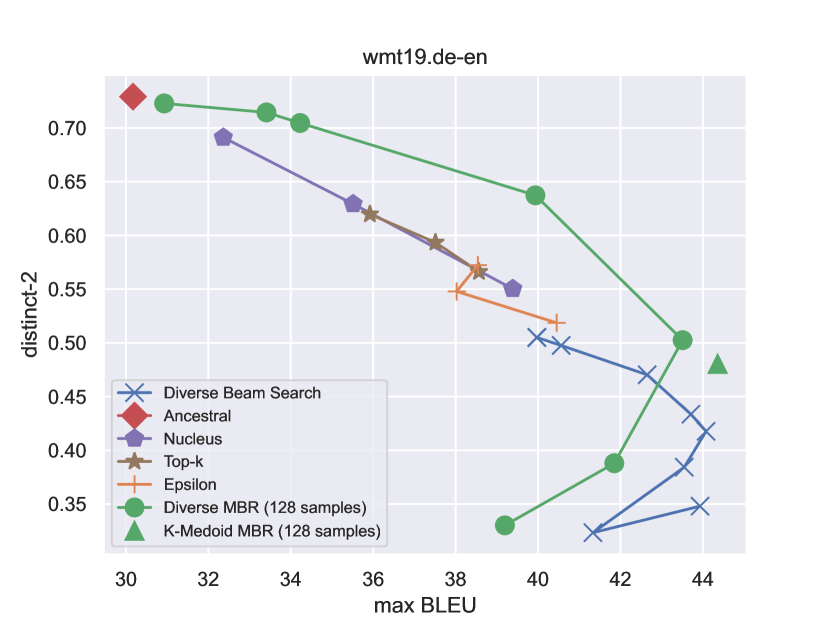
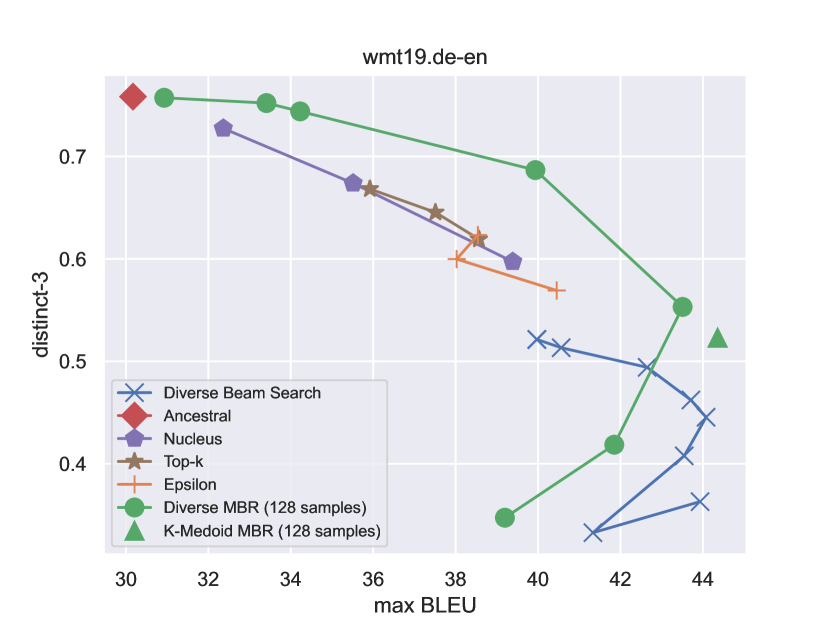
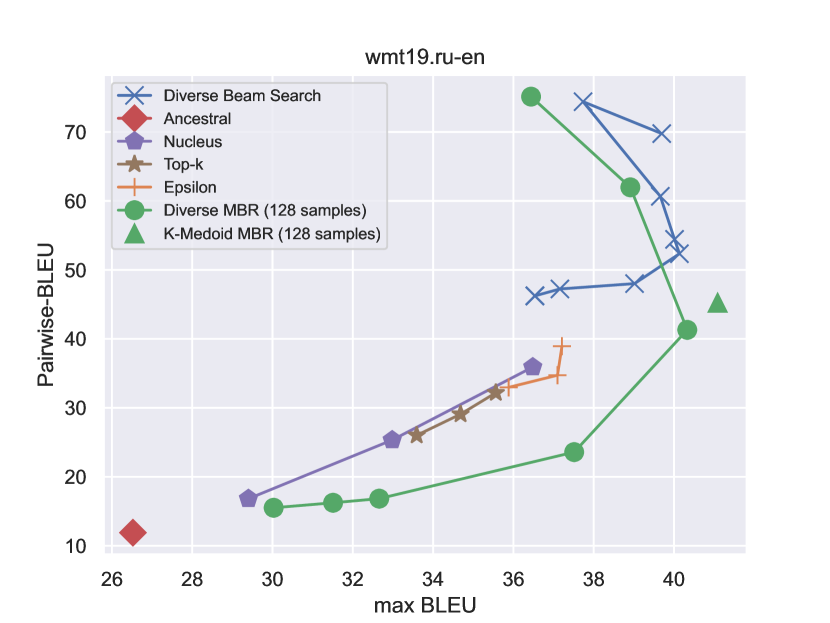
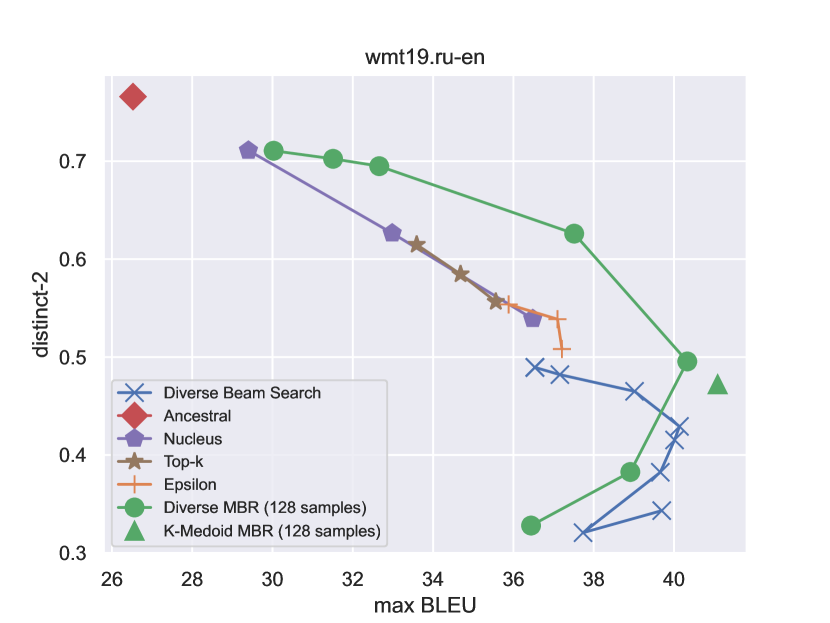
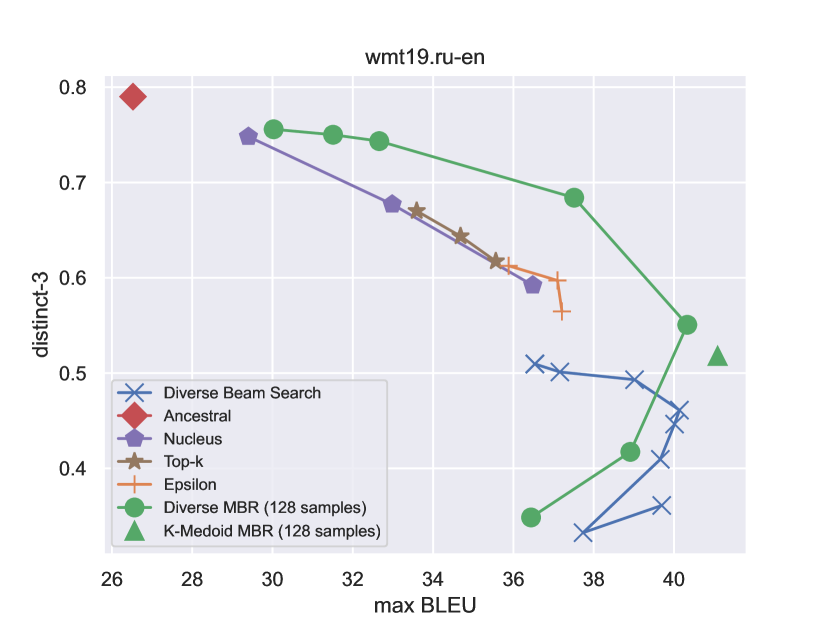
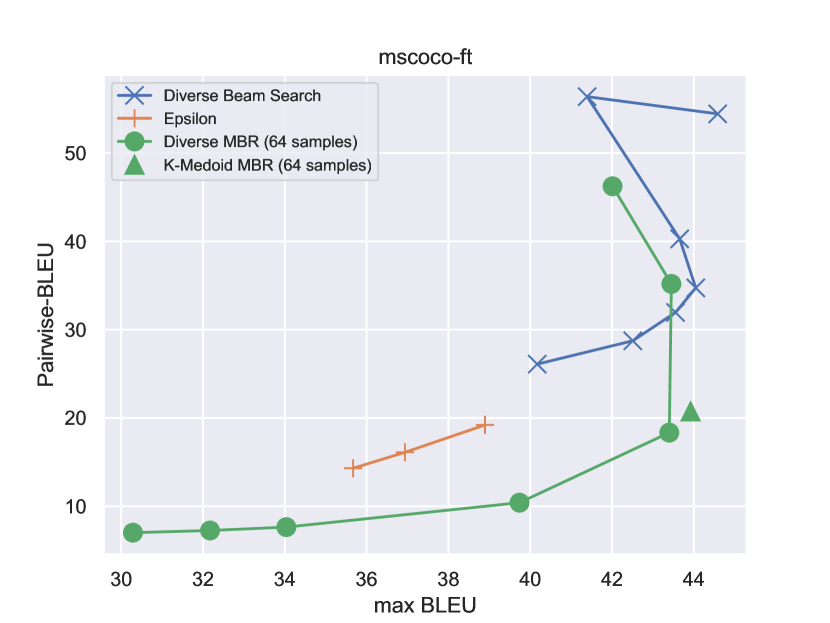
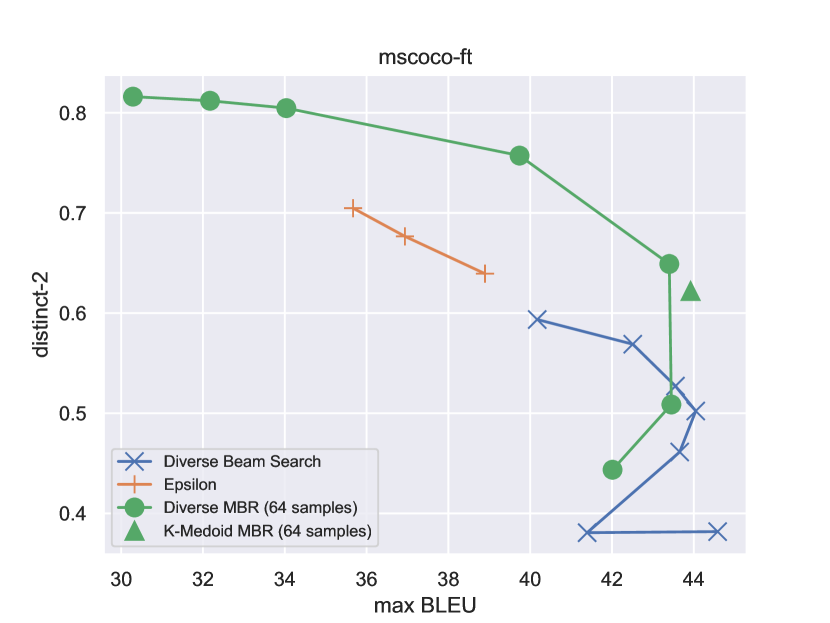
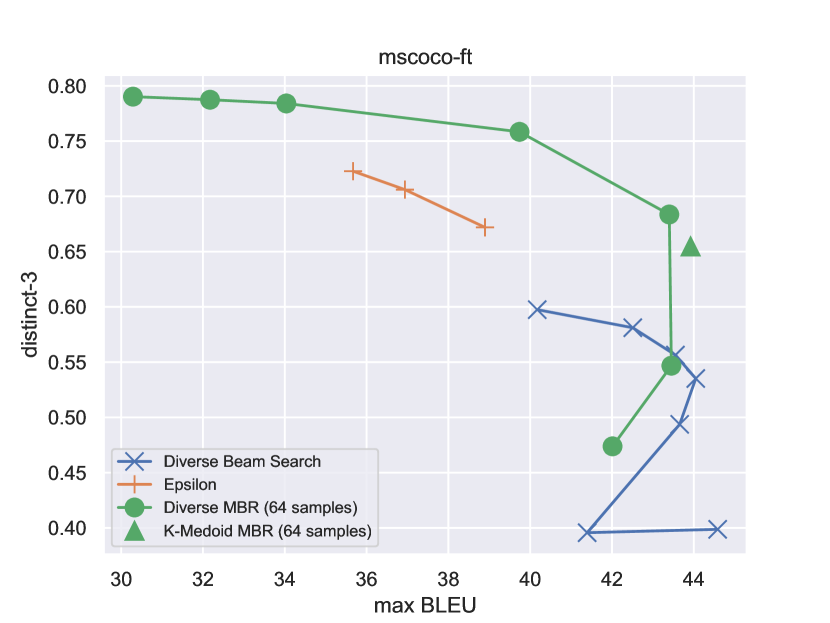
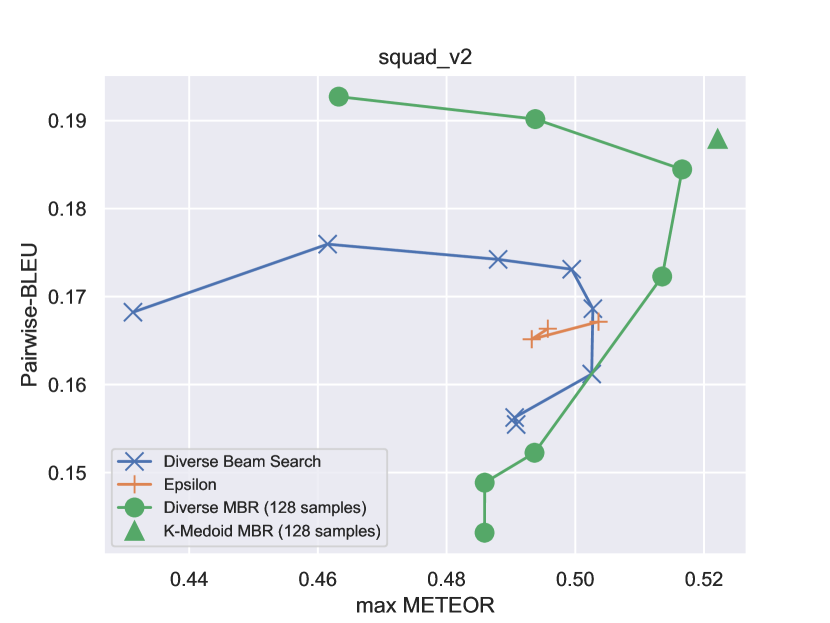
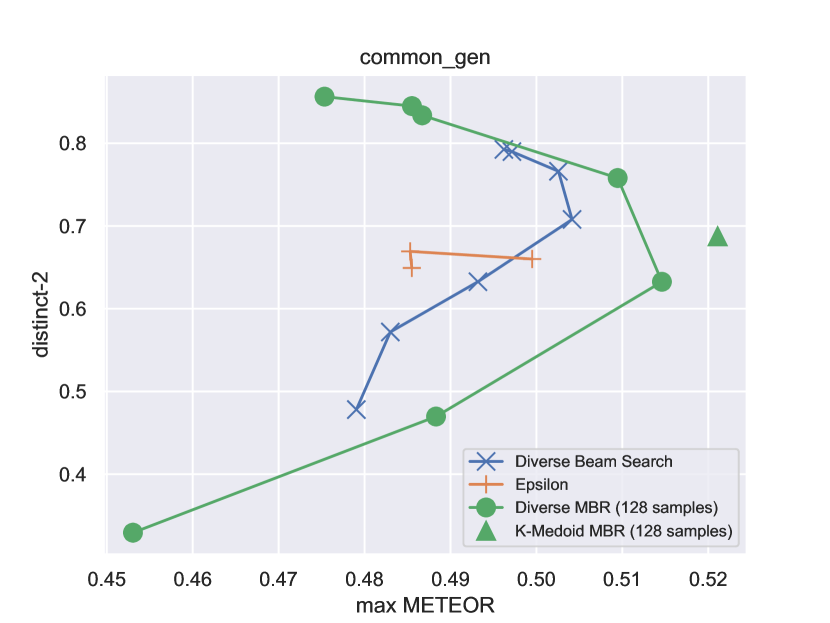
DMBR achieves higher Oracle score than vanilla MBR
Figure 2 shows the P-BLEU and distinct-2, 3 as a function of max BLEU score (i.e. Oracle score). We observe that DMBR achieves a slightly lower maximum BLEU score, yet with higher diversity. Interestingly, we observe that DMBR and KMBR achieve higher Oracle scores than vanilla MBR. This shows the potential of DMBR to further improve the quality of the output of MBR. This is analogous to DBS achieving a higher Oracle score than beam search Vijayakumar et al. (2016). KMBR achieves the highest maximum BLEU score over all algorithms. Although KMBR achieves a lower mean BLEU score than DMBR, it achieves a maximum BLEU score higher than DBS while keeping higher diversity.
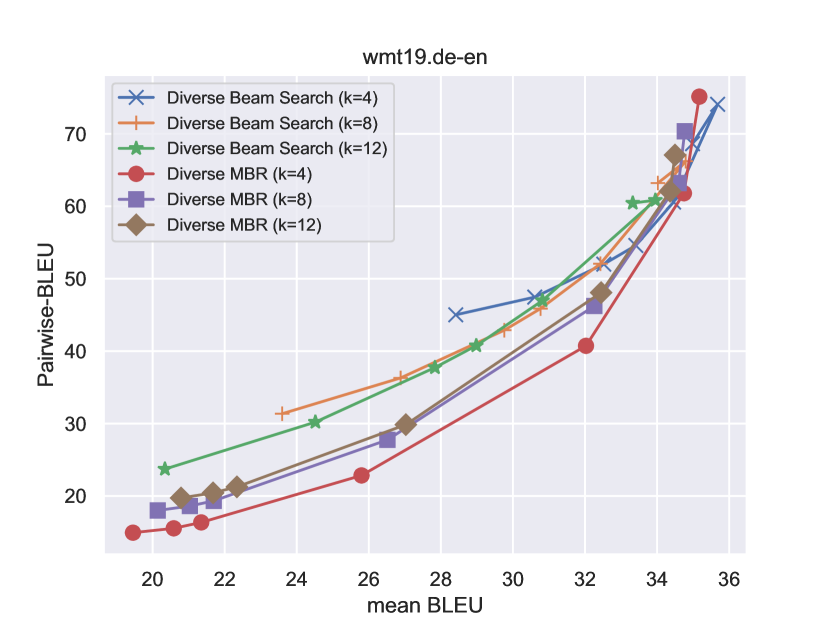
DMBR does not scale to the number of outputs with a fixed amount of samples
DMBR improves with the number of samples
Figure 3(b) and 3(e) shows the performance of DMBR and KMBR with varying number of samples (). We observe that the quality-diversity trade-off is improved with a larger sample size, yet it does not significantly improve by doubling the sample size. The results indicate that one can improve both quality and diversity by increasing the sample size, but it comes at the cost of inference time. Note that the computational complexity of DMBR is quadratic to the number of samples.
Choice of the underlying sampling algorithm for DMBR matters
Figure 3(c) and 3(f) shows the comparison of DMBR with varying sampling algorithms. We evaluate ancestral sampling, nucleus sampling (), top- sampling (), and epsilon sampling () Holtzman et al. (2020); Fan et al. (2018); Hewitt et al. (2022). The temperature is set to 1 for all the runs. We observe that the choice of the sampling algorithm changes the Pareto front of the DMBR. Using less biased sampling algorithms such as ancestral sampling, DMBR improves the diversity, and using more focused sampling algorithms such as epsilon sampling, DMBR improves the mean quality of the outputs.


4.2 Image Captioning using BLIP-2
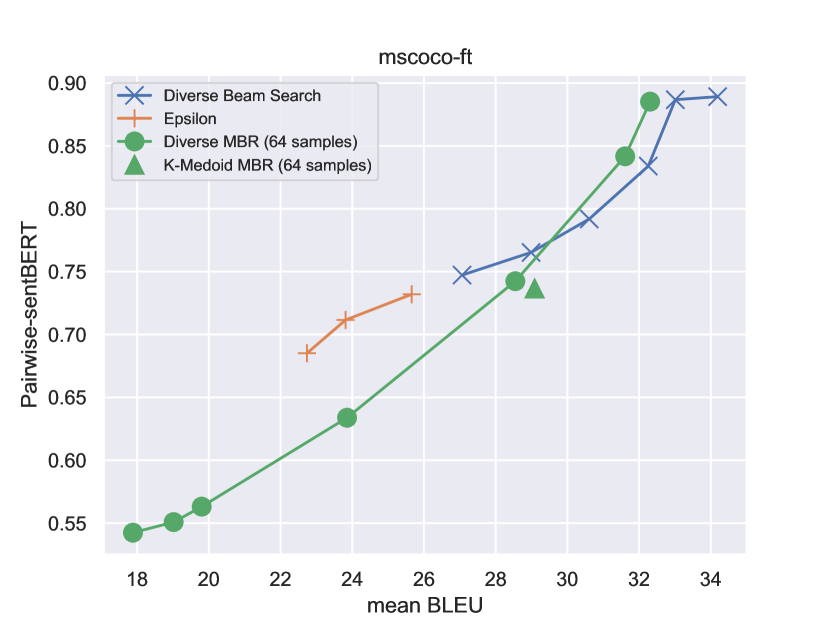
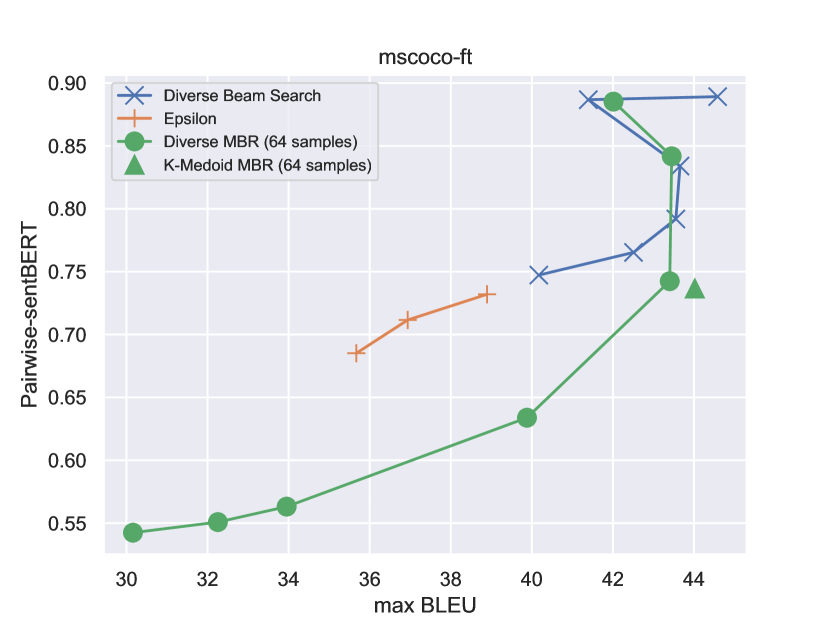

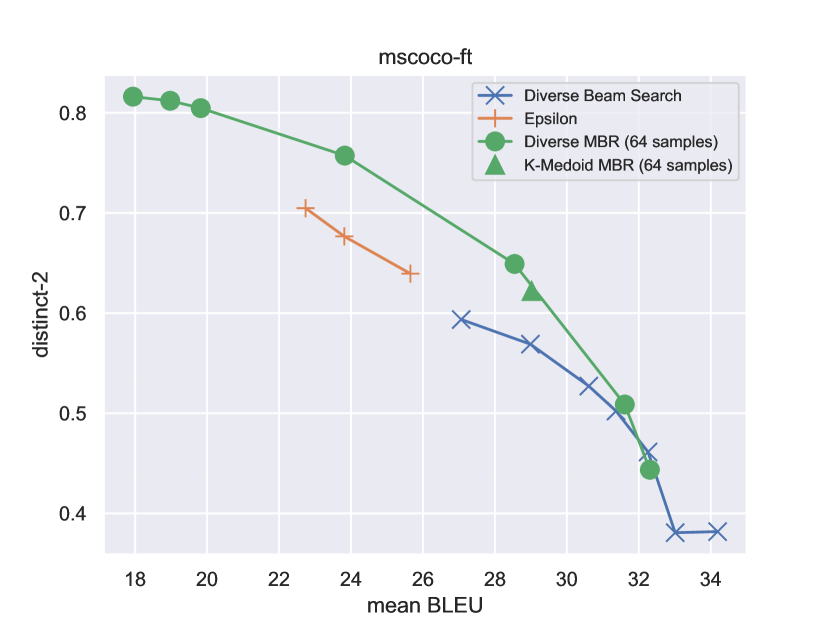
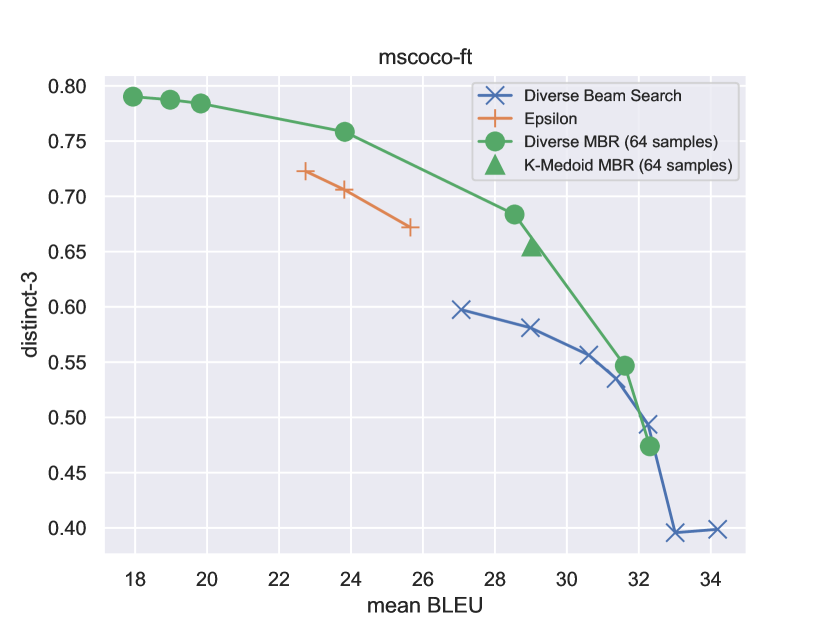
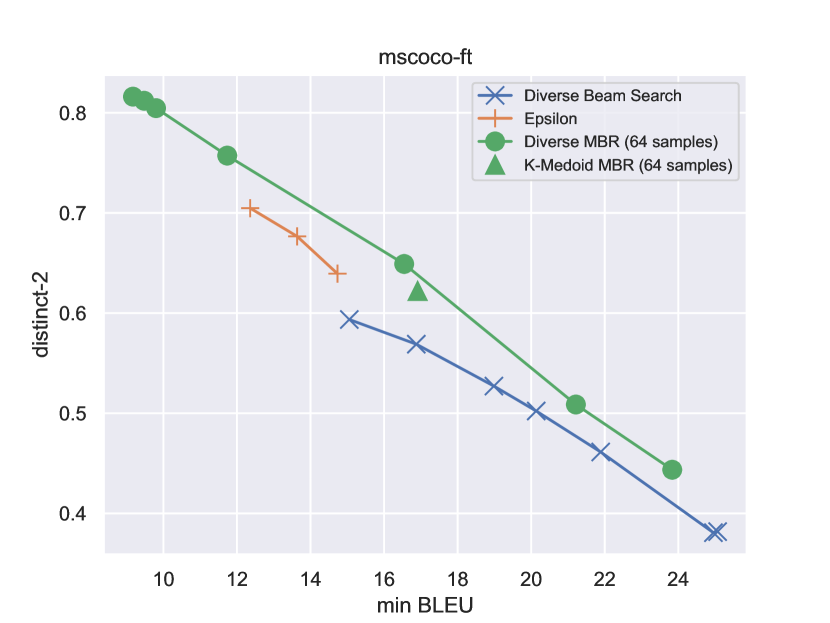
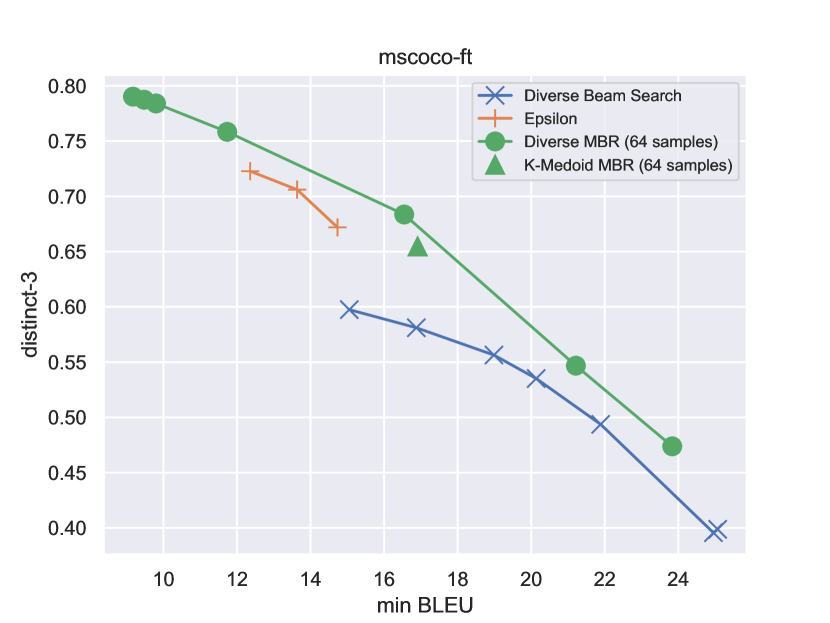
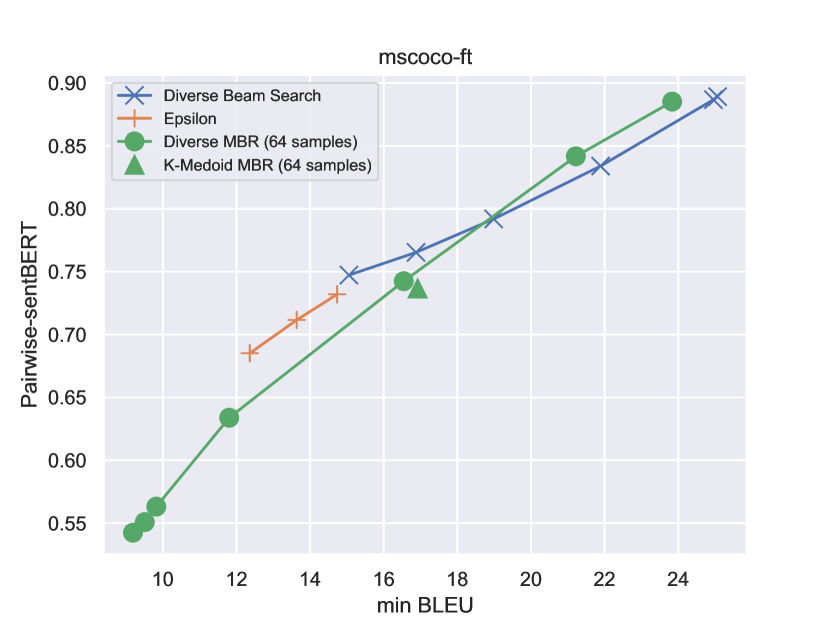
We evaluate the performance of the proposed methods on image captioning using MS COCO dataset Lin et al. (2014). We use BLIP-2 Li et al. (2023) with Flan T5-xl Chung et al. (2022) fine-tuned for MS COCO loaded in 8-bit.444https://huggingface.co/Salesforce/blip2-flan-t5-xl-coco The number of outputs is set to , and . We evaluate the performance of epsilon sampling with . The diversity penalty for DBS is set to , and . For DMBR, we generate samples using epsilon sampling with . The results on are shown in Figure 4. DMBR achieves lower pairwise-BLEU and higher distinct-n than DBS and epsilon sampling. See Appendix C for the other experimental results.
Semantic Textual Similarity
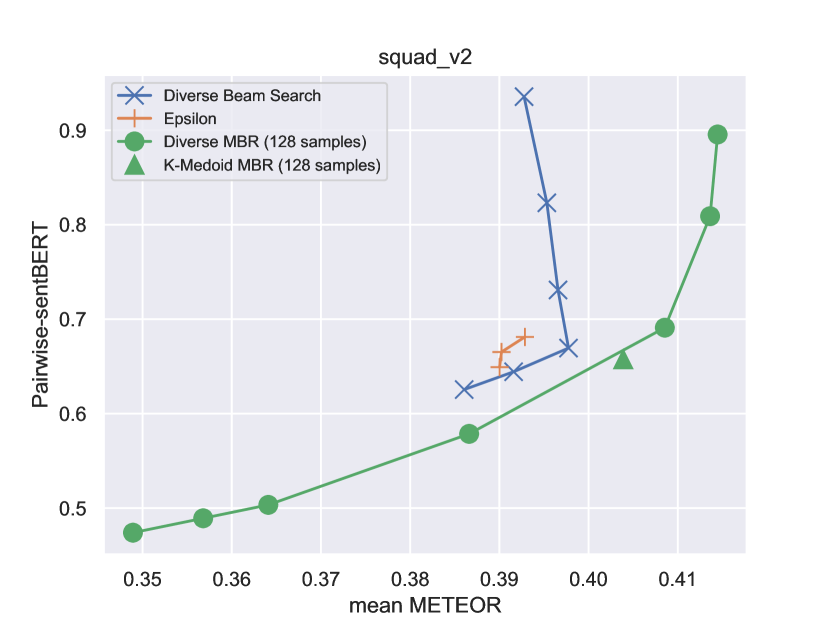
While the machine translation task requires generating semantically the same sentence, the image captioning task allows more diversity in the semantics of the output. In addition to the lexical diversity metrics, we evaluate the semantic diversity of the generated outputs using sentence BERT Reimers and Gurevych (2019). We compute the embedding of each output using the sentence BERT and compute the cosine similarity of each pair of outputs. The cosine similarity over a pair of sentences is shown to have a high correlation to human preference Tevet and Berant (2021). We evaluate pairwise-sentBERT, the average cosine similarity over a set of pairs of outputs. We use all-mpnet-base-v2 model.555https://huggingface.co/sentence-transformers/all-mpnet-base-v2 The model is based on MPNet Song et al. (2020) and has shown to be effective for a variety of sentence embedding tasks.666https://www.sbert.net/docs/pretrained_models.html The result in Figure 5(a) shows that DMBR achieves better (lower) pairwise-sentBERT than DBS and epsilon sampling.
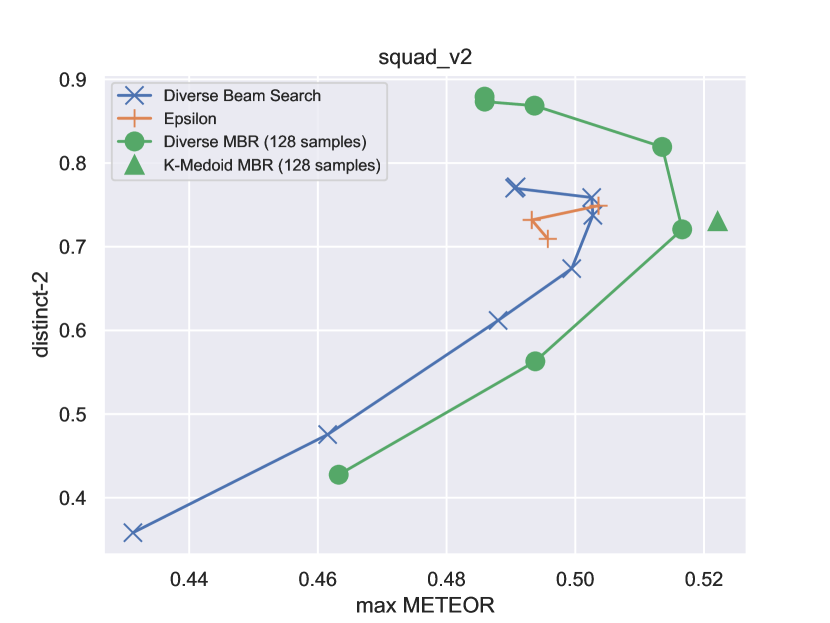
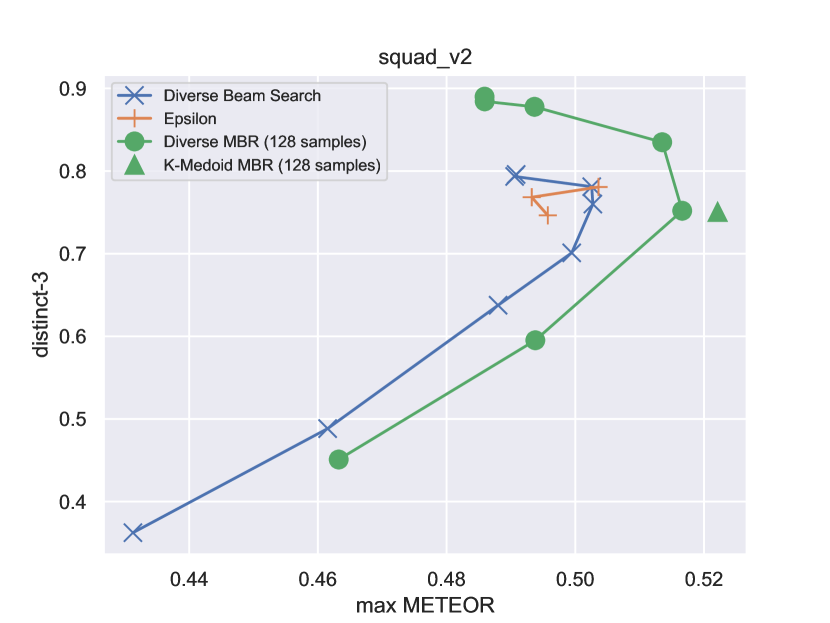
4.3 Question Generation using Large Language Model
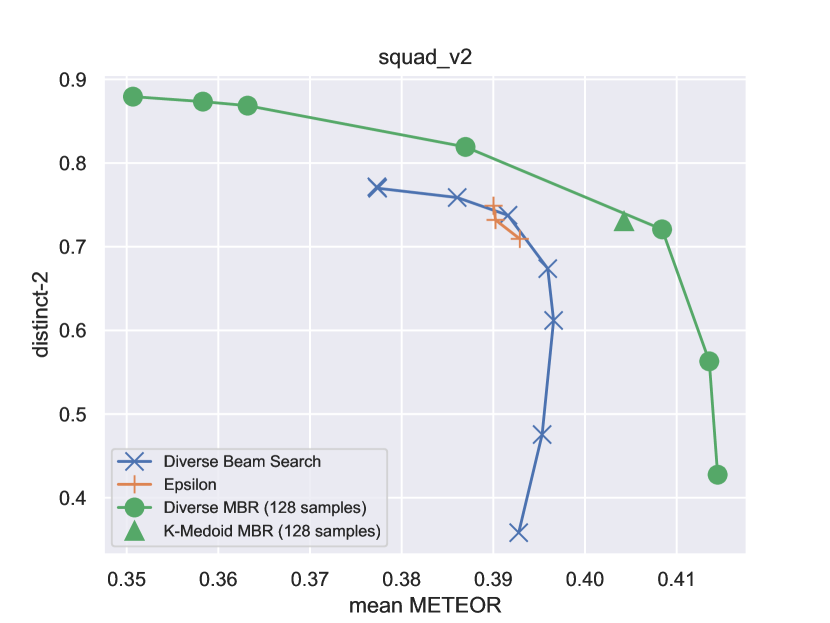
The goal of question generation is to generate a question on a topic in natural language from a paragraph of text Mulla and Gharpure (2023).
We use a Stanford Question Answering Dataset (SQuAD2.0) to evaluate the decoding algorithms for question generation Rajpurkar et al. (2016, 2018). SQuAD2.0 is a reading comprehension dataset consisting of questions and answers on Wikipedia articles.
We use Zephyr-7B with prompting as a text generation model.777https://huggingface.co/HuggingFaceH4/zephyr-7b-beta
We use the following prompt:
Given a paragraph provided by the user, generate a very short question one can answer by a word to test the understanding of the paragraph. Make sure that the question is very short. Do NOT include the answer.
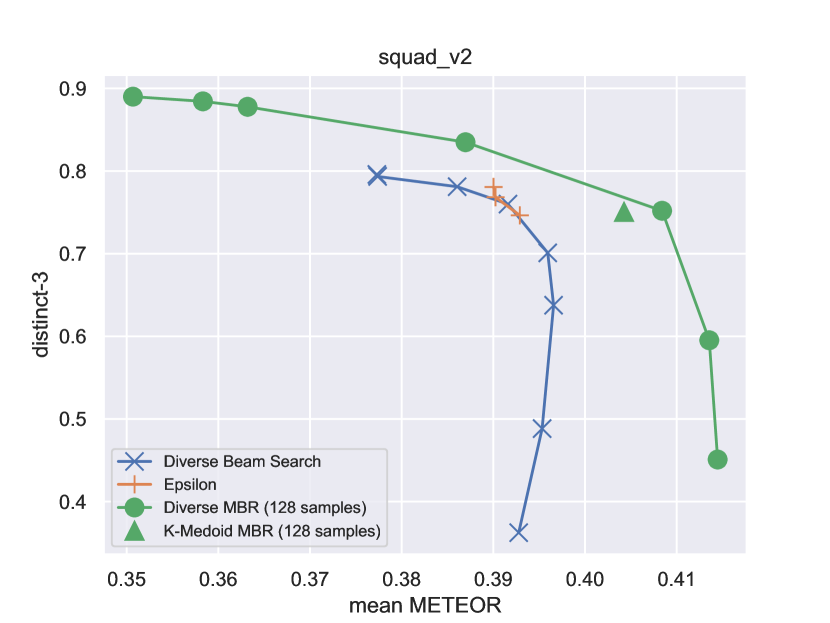
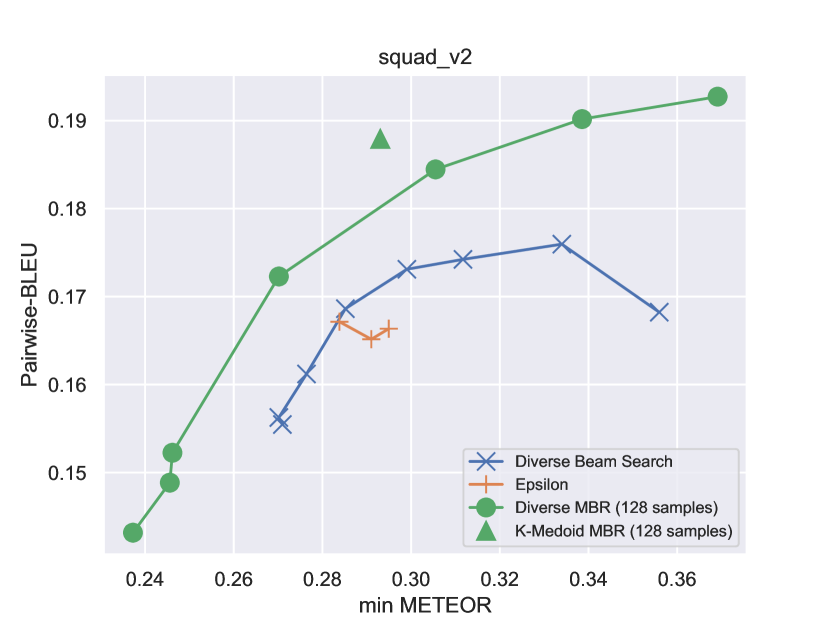
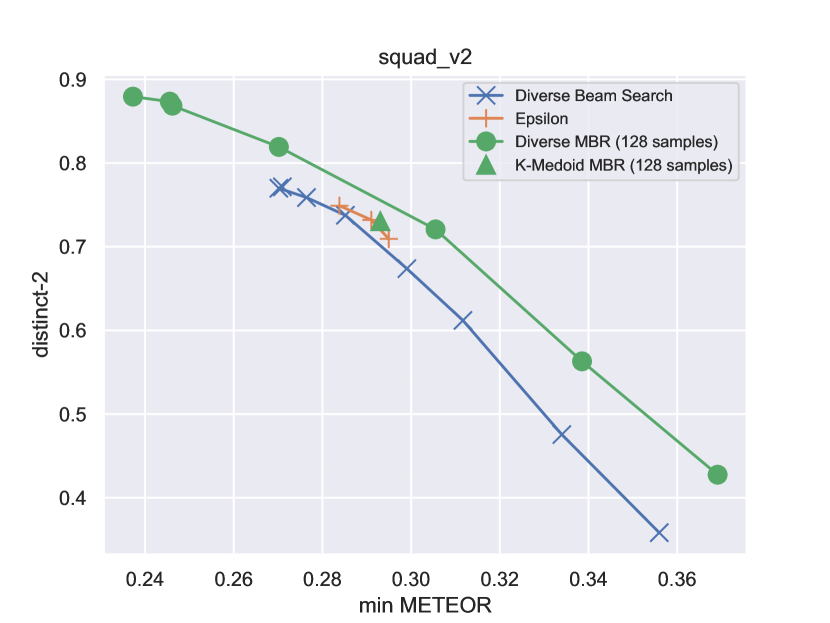
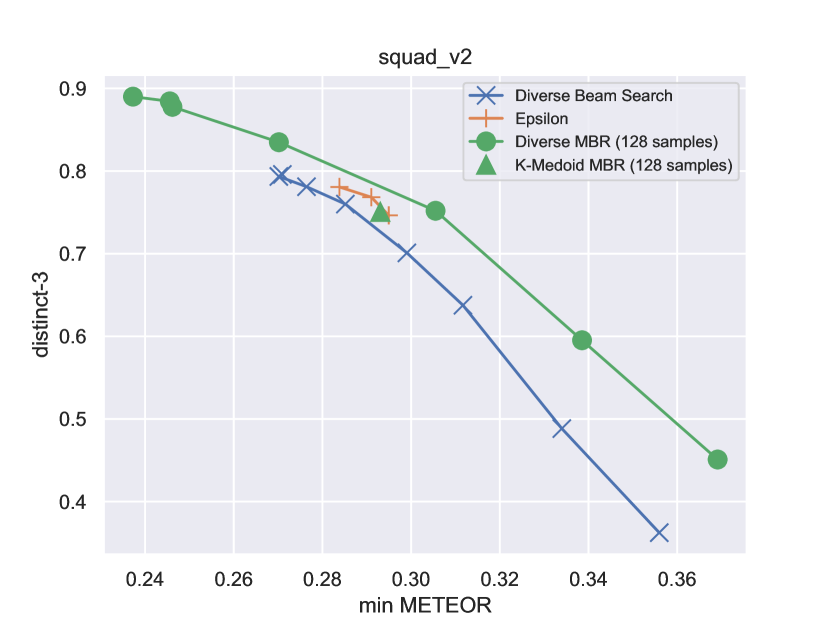
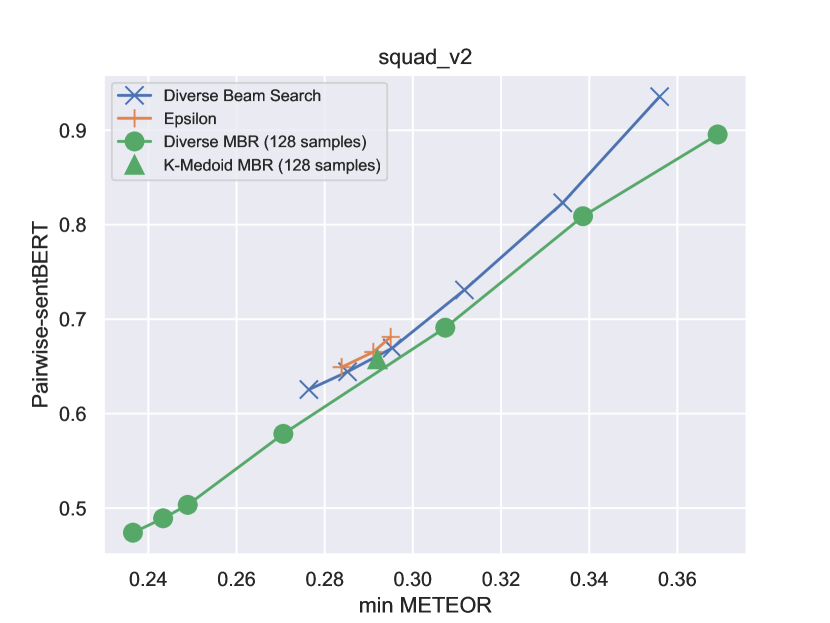
We generate outputs. For DBS, we set the diversity penalty to and . For MBR we generate samples with epsilon sampling with . The diversity penalty is set to and . The mean METEOR and the diversity metrics are shown in Figure 4. Compared with the same METEOR score, DMBR has better distinct-2 and 3 than DBS. The pairwise-BLEU and pairwise-sentBERT (Figure 5) of DMBR are slightly worse than DBS and epsilon sampling compared with the same mean METEOR score.
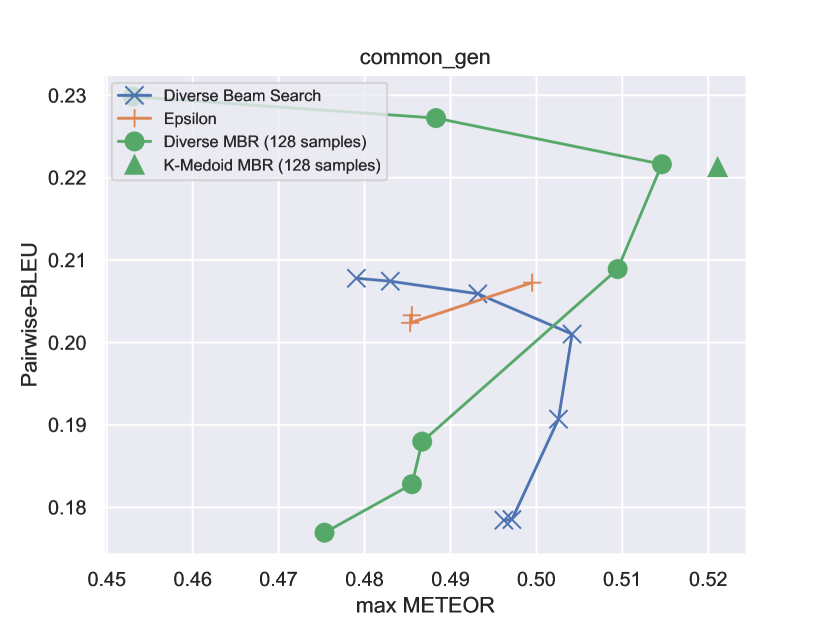
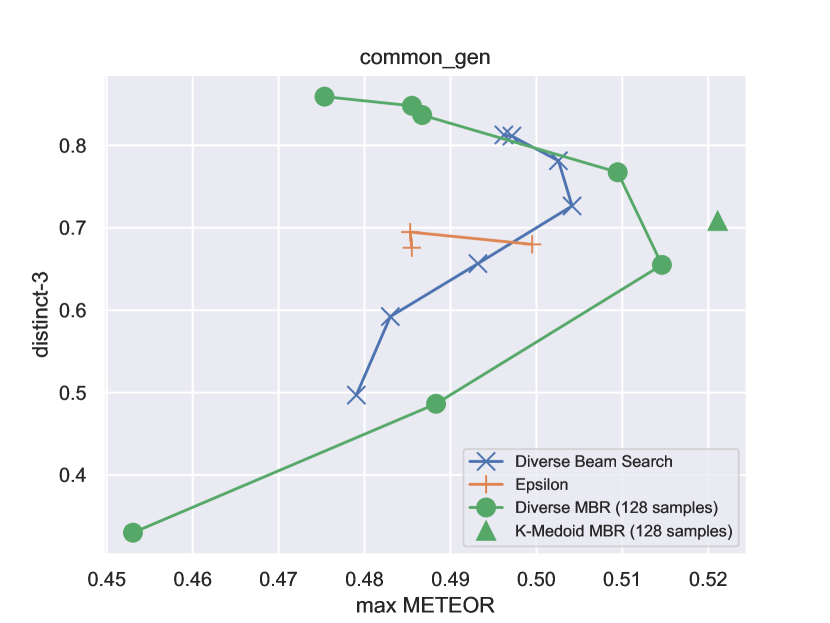
4.4 Generative Common Sense Reasoning using Large Language Model
CommonGen is a constrained text generation task to evaluate the ability of common sense reasoning of the system Lin et al. (2020). Given a set of common concepts, the task is to generate a coherent sentence describing an everyday scenario using these concepts.
We use Zephyr-7B with prompting as a text generation model.
We use the following prompt:
Generate a short and interesting sentence using all the words provided from the user as is. Make sure that it is short and all the words are included without rewording.
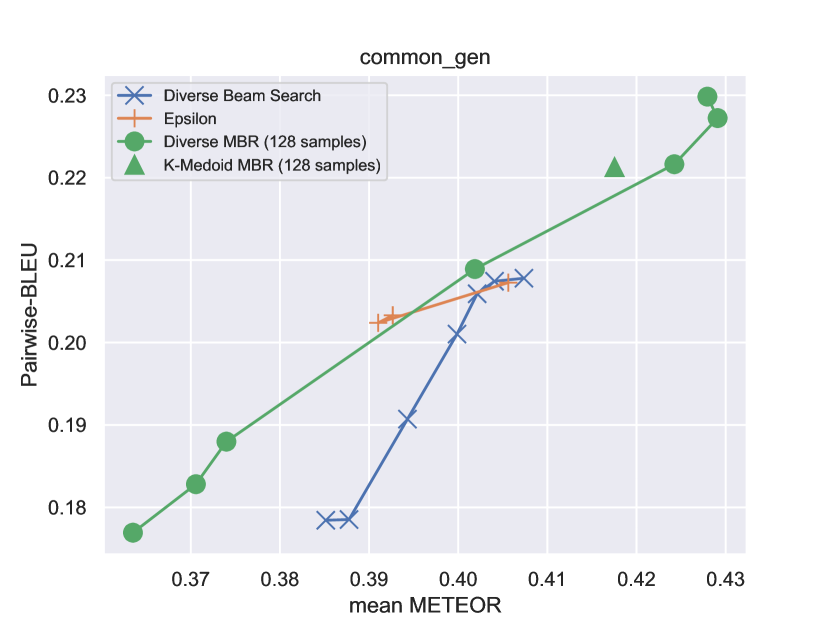
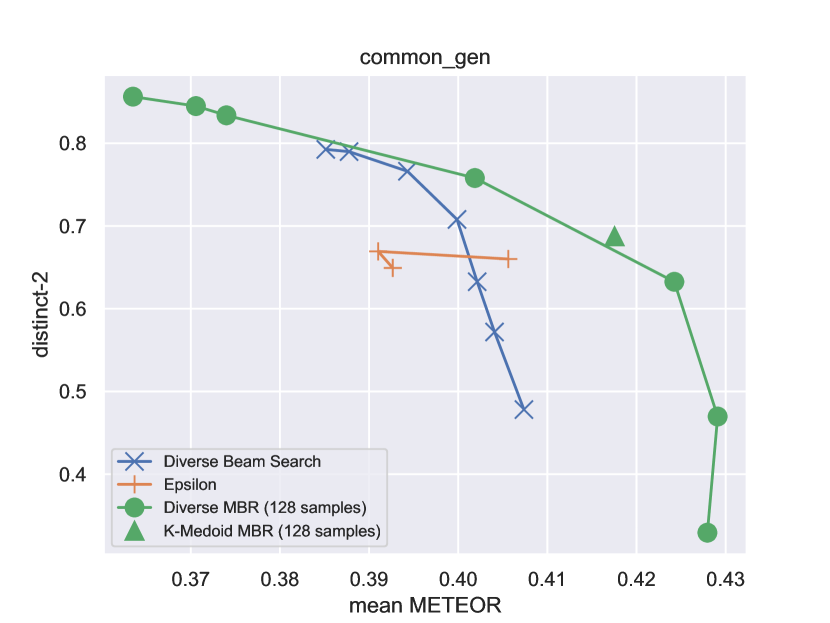
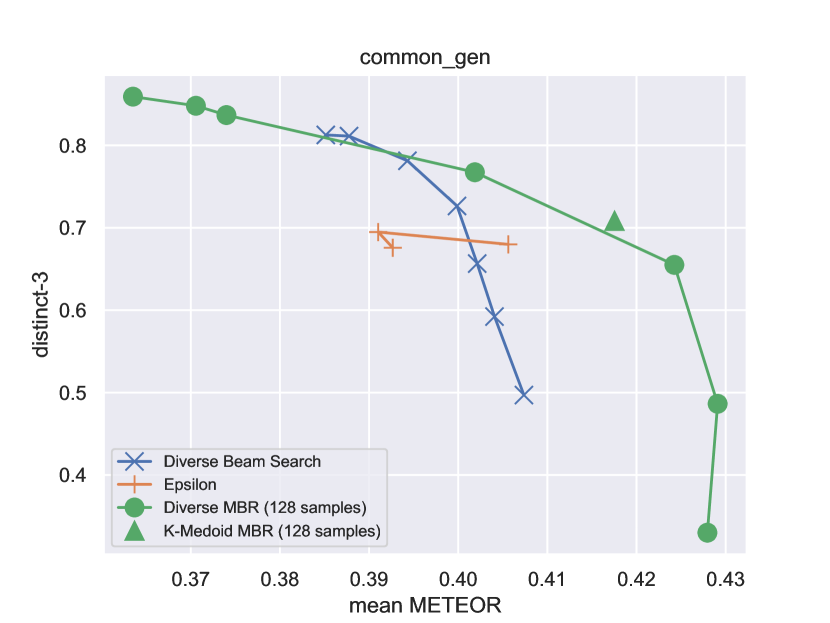
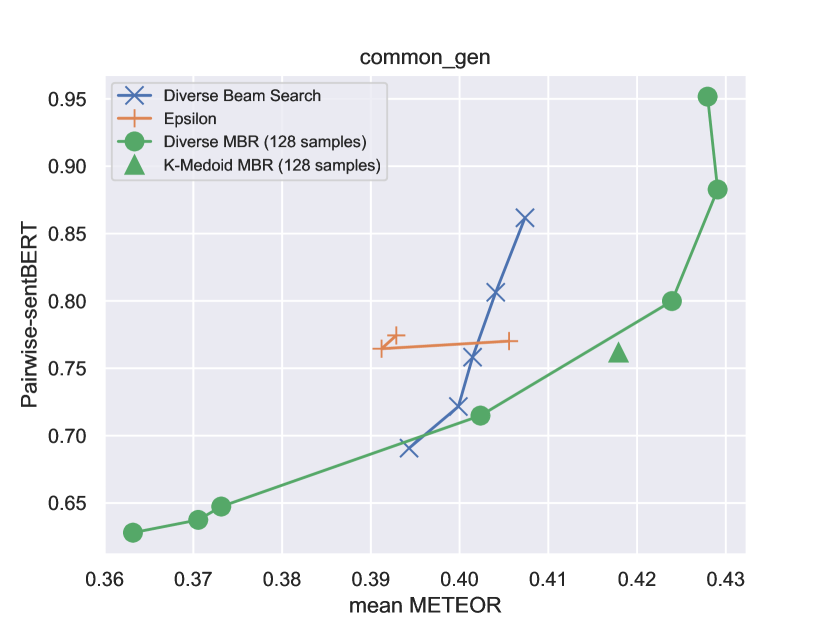
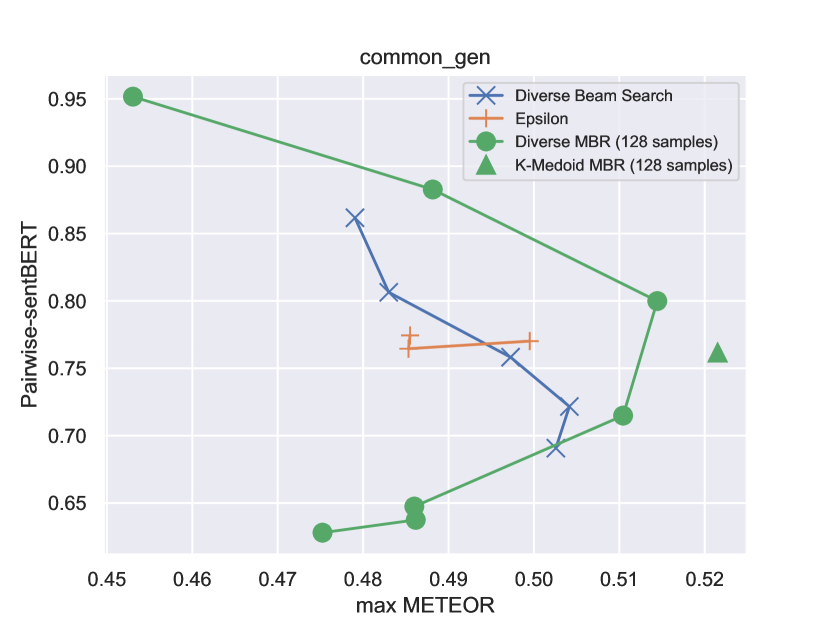
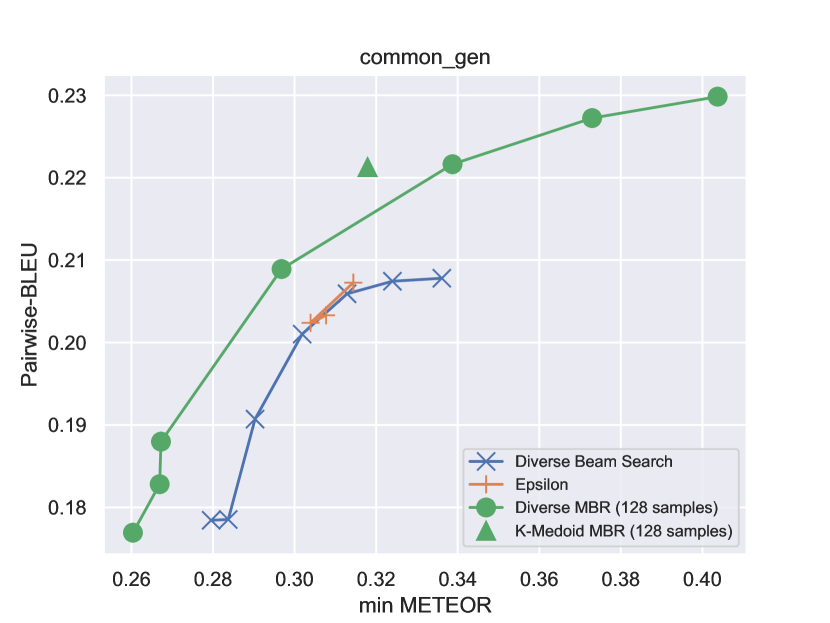
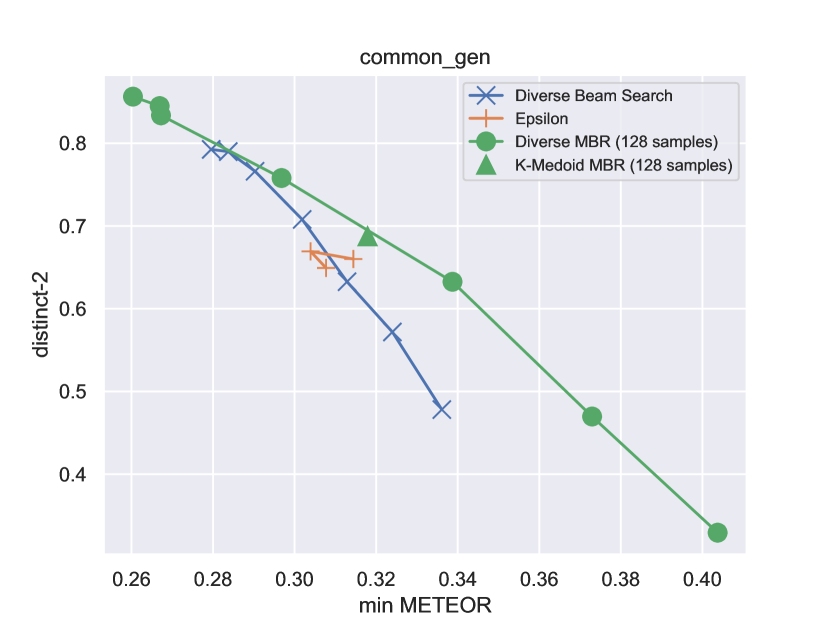
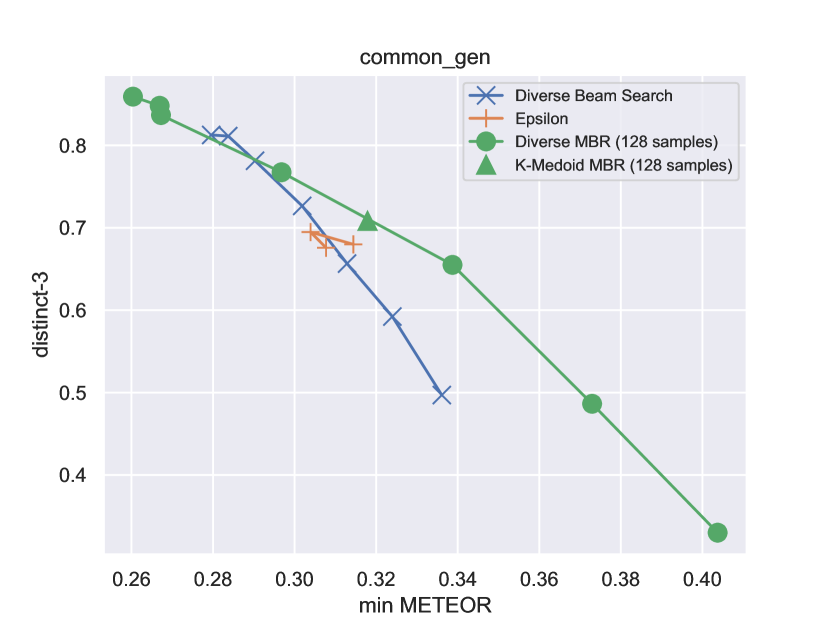
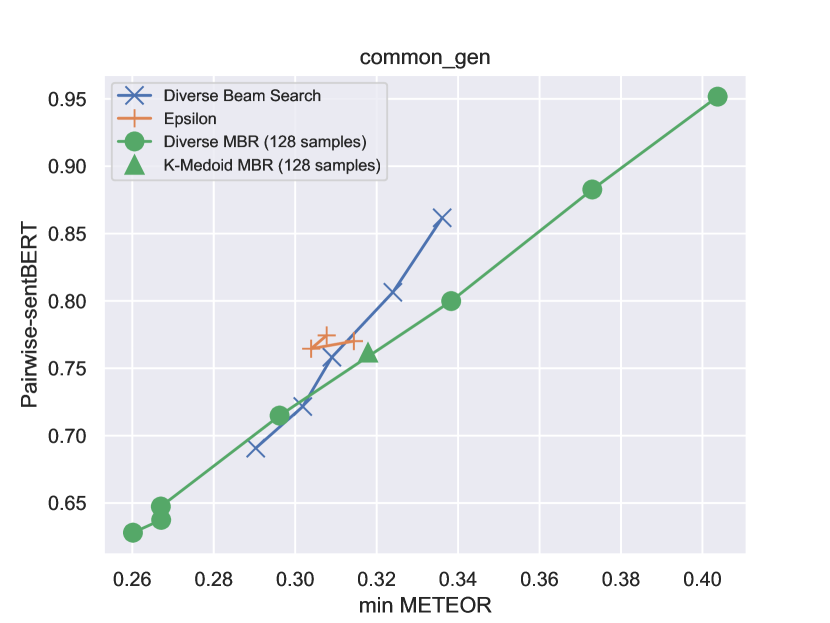
The other experimental setting is the same as in Section 4.3. The mean METEOR and the diversity metrics are shown in Figure 4. DMBR has better distinct-2 and 3 than DBS and epsilon sampling but slightly worse pairwise-BLEU.
Coverage
The task encourages the generated sentence to contain as many input concepts as possible, so we also consider the coverage of the input concepts. The definition of coverage is the number of captured concepts divided by the number of input concepts. To compute the captured concepts, we use a Porter stemmer Porter (1980) to extract the stems of the input concepts and the generated sequences and compute the number of overlaps.888https://www.nltk.org/_modules/nltk/stem/porter.html Overall, the coverage is low () for all the decoding algorithms. For , the average coverage is and for beam search, DBS-1.0, MBR, DMBR-1.0, and KMBR, respectively. We speculate this is because the text generation model is not trained to follow the instructions on the lexical constraints without few-shot prompting.
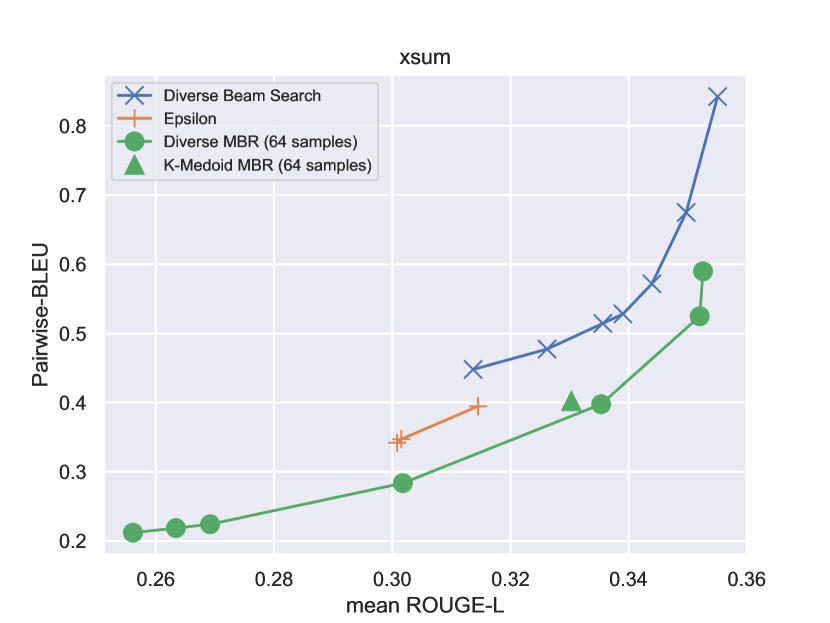
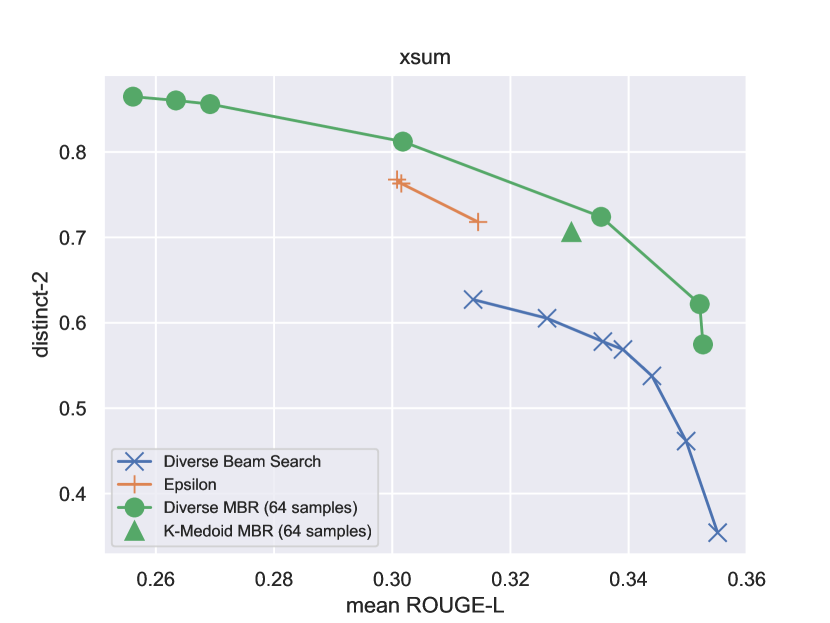
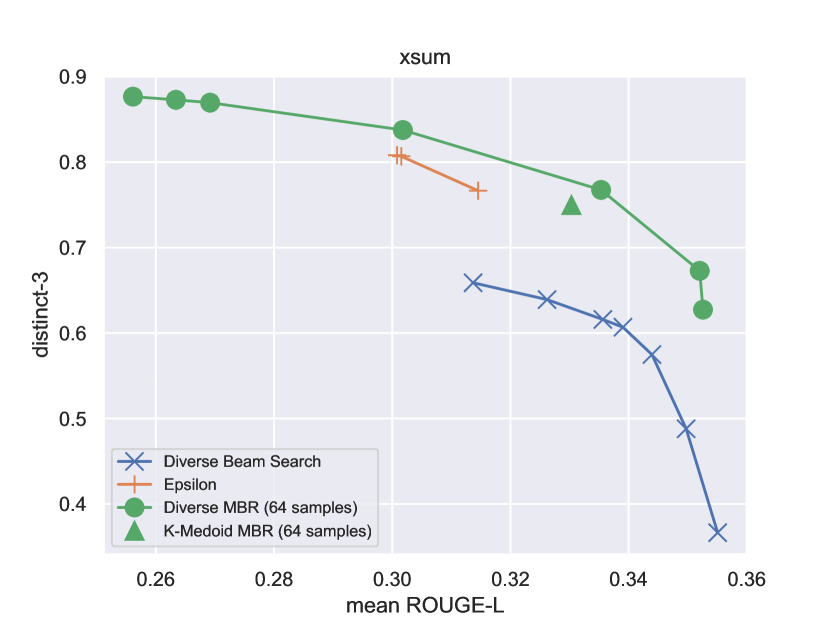
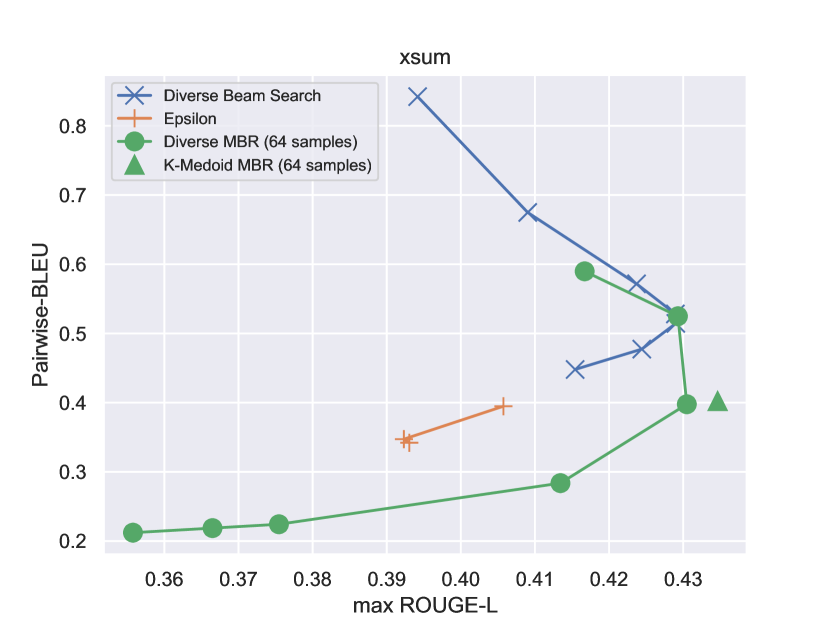
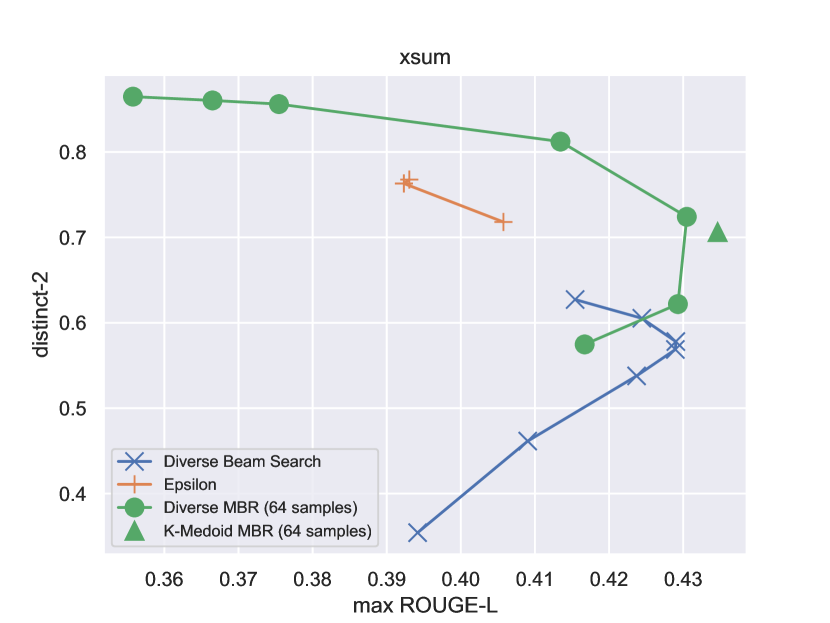
4.5 Text Summarization
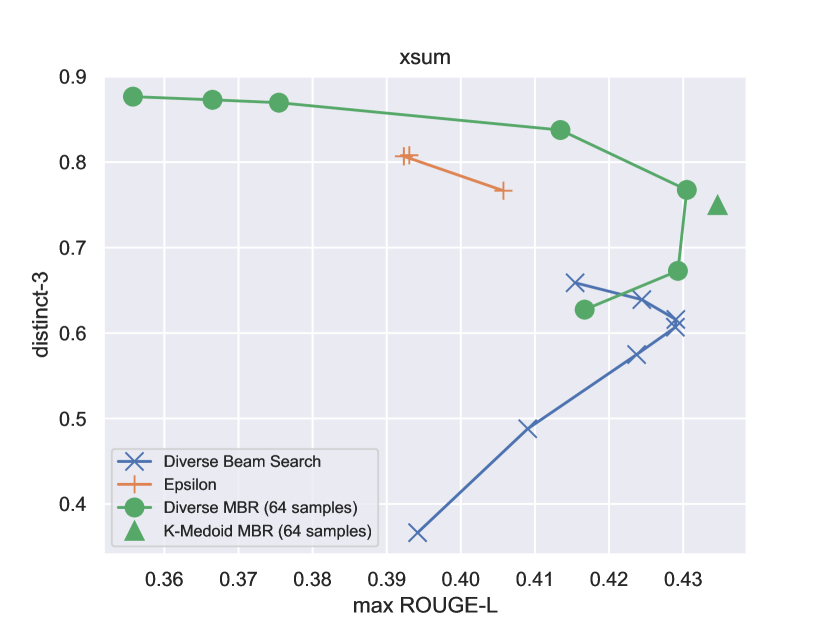
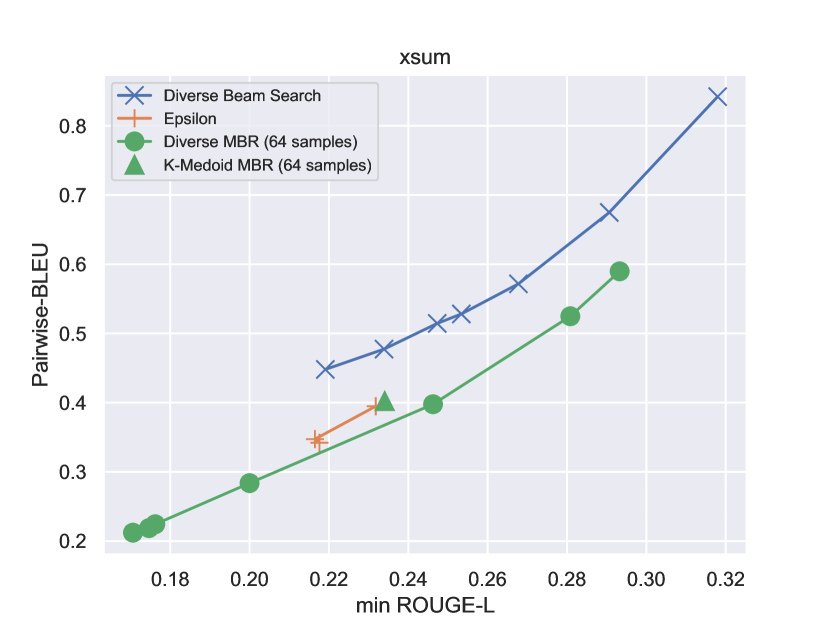
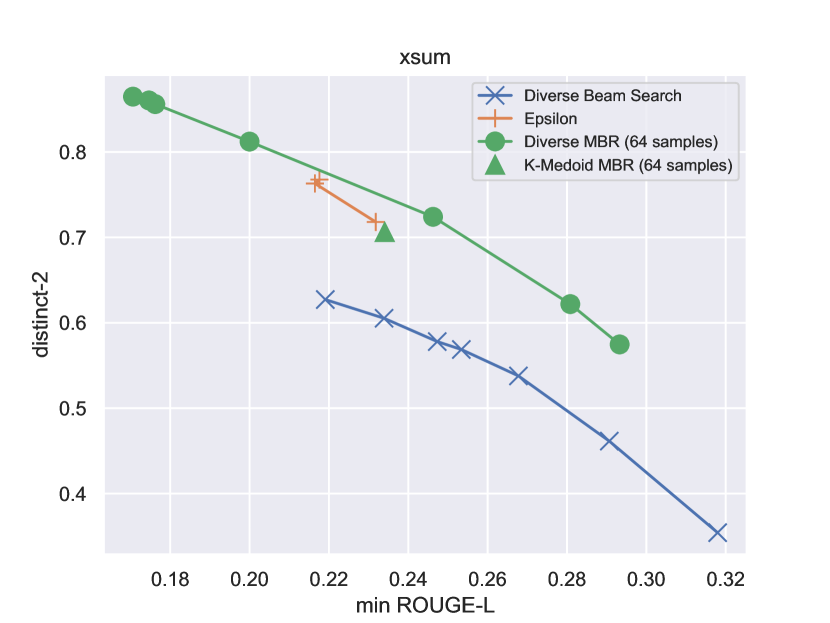
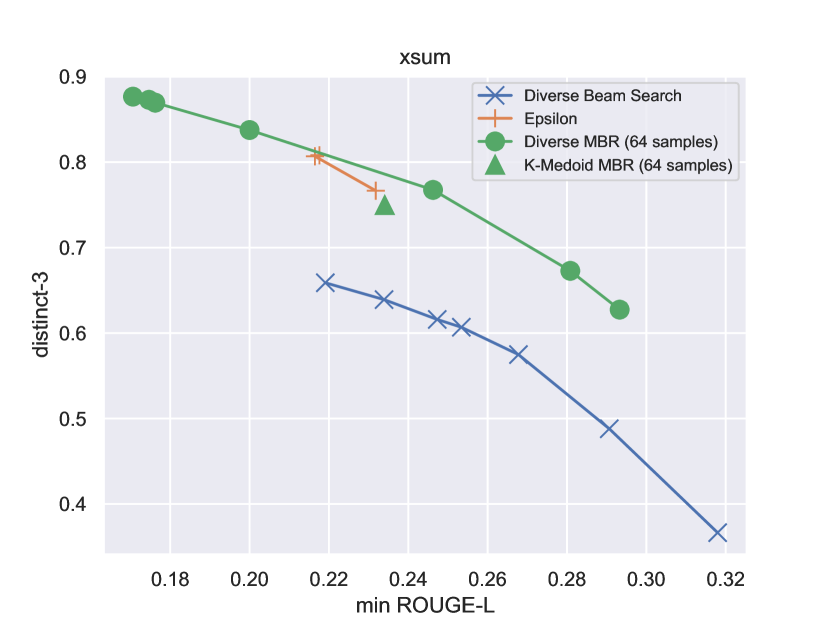
We use the Extreme Summarization (XSum) dataset as a benchmark for an abstractive single-document summarization Narayan et al. (2018). We use a BART model pretrained on XSum dataset Lewis et al. (2020).999https://huggingface.co/facebook/bart-large-xsum We evaluate the quality of the outputs by ROUGE-L using HuggingFace’s evaluate library Lin (2004). We generate outputs per each input document. For DBS, we set the diversity penalty to . For MBR we generate 64 samples with epsilon sampling with . The diversity penalty for DMBR is set to . The results are shown in Figure 4. DMBR achieves better diversity than DBS measured by P-BLEU and distinct-n.
5 Related Work
Several work have investigated strategies for increasing the diversity of text generation by modifying the decoding algorithm. Many of the studies have proposed modifications to beam search to promote diverse set of beams Vijayakumar et al. (2016); Li and Jurafsky (2016); Kulikov et al. (2019); Kool et al. (2019); Tam (2020); Meister et al. (2021b, a). Beam search-based diverse decoding algorithms are often deployed for directed text generation tasks such as image captioning. Some other work has proposed extension to random sampling algorithm to increase quality of the output at a cost of diversity Fan et al. (2018); Tu et al. (2019); Holtzman et al. (2020); Zhang et al. (2021); Hewitt et al. (2022); Vilnis et al. (2023).
Our work is most closely related to the Post-Decoding Clustering (PDC) approach Kriz et al. (2019); Ippolito et al. (2019). Similarly to DMBR, PDC generates a set of outputs and then chooses which ones to select as the final set of outputs. Kriz et al. (2019) proposes to cluster similar sentences by K-means and select outputs closest to the centroid of each cluster as the final outputs. Ippolito et al. (2019) instead select outputs with the highest log-likelihood from each cluster.
MBR decoding has been studied in many NLP tasks including parsing Goodman (1996), speech recognition Goel and Byrne (2000), bilingual word alignment Kumar and Byrne (2002), and machine translation Kumar and Byrne (2004). It has recently gained attention in machine translation as a decision rule to overcome some of the biases of MAP decoding in neural machine translation Eikema and Aziz (2020); Müller and Sennrich (2021); Eikema and Aziz (2022). Although it is shown to generate high-quality texts in directed text generation tasks such as machine translation, using MBR to generate a diverse set of outputs is yet to be investigated.
6 Conclusions
We study the problem of generating a set of texts with high quality and diversity. Our approach is to promote diversity to MBR which is shown to generate high quality texts so that it can generate high quality and diversity outputs. We extend MBR and propose DiverseMBR and KMBR that seek to optimize both the diversity and the quality when selecting a set of outputs. Because both algorithms takes exponential time to compute exactly, we devise approximate algorithms to make it feasible. We evaluate DMBR and KMBR on machine translation, image captioning, question generation, generative common sense reasoning, and text summarization tasks and show that overall they achieve better quality-diversity trade-off than DBS. We also observe that both methods, especially KMBR, achieve higher maximum BLEU score than MBR, analoguous to DBS achieving higher BLEU score than beam search.
7 Limitations
Our experiments are focused on directed text generation tasks. The evaluation of the methods in open-ended text generation tasks such as story generation is future work.
We rely on automatic evaluations to evaluate the quality and the diversity of the generated texts. Human evaluation is desirable, especially for evaluating diversity. Although the automatic evaluation metrics for diversity used in this paper (e.g. pairwise-BLEU, distinct-n, sentence-BERT) are shown to correlate with human evaluation, there is still a clear gap between automatic metrics and humans Tevet and Berant (2021).
DMBR and KMBR are much slower than DBS as they require the computation of the MBR objective which needs a computation of the utility function for times. Although recent work has shown that the computation of the MBR objective can be significantly reduced Cheng and Vlachos (2023); Jinnai and Ariu (2024), it is not directly applicable to DMBR and KMBR. How to reduce the inference time of these algorithms is future work.
Acknowledgements
We thank Naoto Ohsaka for providing insights on approximation algorithms for a non-monotonic submodular function maximization problem.
References
- Banerjee and Lavie (2005) Satanjeev Banerjee and Alon Lavie. 2005. METEOR: An automatic metric for MT evaluation with improved correlation with human judgments. In Proceedings of the ACL Workshop on Intrinsic and Extrinsic Evaluation Measures for Machine Translation and/or Summarization, pages 65–72, Ann Arbor, Michigan. Association for Computational Linguistics.
- Barrault et al. (2019) Loïc Barrault, Ondřej Bojar, Marta R. Costa-jussà, Christian Federmann, Mark Fishel, Yvette Graham, Barry Haddow, Matthias Huck, Philipp Koehn, Shervin Malmasi, Christof Monz, Mathias Müller, Santanu Pal, Matt Post, and Marcos Zampieri. 2019. Findings of the 2019 conference on machine translation (WMT19). In Proceedings of the Fourth Conference on Machine Translation (Volume 2: Shared Task Papers, Day 1), pages 1–61, Florence, Italy. Association for Computational Linguistics.
- Buchbinder and Feldman (2018) Niv Buchbinder and Moran Feldman. 2018. Submodular functions maximization problems. In Teofilo F. Gonzalez, editor, Handbook of Approximation Algorithms and Metaheuristics, Second Edition, Volume 1: Methologies and Traditional Applications, pages 753–788. Chapman and Hall/CRC.
- Cheng and Vlachos (2023) Julius Cheng and Andreas Vlachos. 2023. Faster minimum Bayes risk decoding with confidence-based pruning. In Proceedings of the 2023 Conference on Empirical Methods in Natural Language Processing, pages 12473–12480, Singapore. Association for Computational Linguistics.
- Cho (2016) Kyunghyun Cho. 2016. Noisy parallel approximate decoding for conditional recurrent language model. arXiv preprint arXiv:1605.03835.
- Choudhary et al. (2017) Sajal Choudhary, Prerna Srivastava, Lyle Ungar, and João Sedoc. 2017. Domain aware neural dialog system. arXiv preprint arXiv:1708.00897.
- Chung et al. (2022) Hyung Won Chung, Le Hou, Shayne Longpre, Barret Zoph, Yi Tay, William Fedus, Eric Li, Xuezhi Wang, Mostafa Dehghani, Siddhartha Brahma, et al. 2022. Scaling instruction-finetuned language models. arXiv preprint arXiv:2210.11416.
- Eikema and Aziz (2020) Bryan Eikema and Wilker Aziz. 2020. Is MAP decoding all you need? the inadequacy of the mode in neural machine translation. In Proceedings of the 28th International Conference on Computational Linguistics, pages 4506–4520, Barcelona, Spain (Online). International Committee on Computational Linguistics.
- Eikema and Aziz (2022) Bryan Eikema and Wilker Aziz. 2022. Sampling-based approximations to minimum Bayes risk decoding for neural machine translation. In Proceedings of the 2022 Conference on Empirical Methods in Natural Language Processing, pages 10978–10993, Abu Dhabi, United Arab Emirates. Association for Computational Linguistics.
- Fan et al. (2018) Angela Fan, Mike Lewis, and Yann Dauphin. 2018. Hierarchical neural story generation. In Proceedings of the 56th Annual Meeting of the Association for Computational Linguistics (Volume 1: Long Papers), pages 889–898, Melbourne, Australia. Association for Computational Linguistics.
- Farinhas et al. (2023) António Farinhas, José G. C. de Souza, and André F. T. Martins. 2023. An empirical study of translation hypothesis ensembling with large language models. arXiv.
- Feige (1998) Uriel Feige. 1998. A threshold of ln n for approximating set cover. J. ACM, 45(4):634–652.
- Feldman et al. (2017) Moran Feldman, Christopher Harshaw, and Amin Karbasi. 2017. Greed is good: Near-optimal submodular maximization via greedy optimization. In Proceedings of the 2017 Conference on Learning Theory, volume 65 of Proceedings of Machine Learning Research, pages 758–784. PMLR.
- Freitag et al. (2023) Markus Freitag, Behrooz Ghorbani, and Patrick Fernandes. 2023. Epsilon sampling rocks: Investigating sampling strategies for minimum bayes risk decoding for machine translation. arXiv preprint arXiv:2305.09860.
- Freitag et al. (2022) Markus Freitag, David Grangier, Qijun Tan, and Bowen Liang. 2022. High quality rather than high model probability: Minimum Bayes risk decoding with neural metrics. Transactions of the Association for Computational Linguistics, 10:811–825.
- Gimpel et al. (2013) Kevin Gimpel, Dhruv Batra, Chris Dyer, and Gregory Shakhnarovich. 2013. A systematic exploration of diversity in machine translation. In Proceedings of the 2013 Conference on Empirical Methods in Natural Language Processing, pages 1100–1111, Seattle, Washington, USA. Association for Computational Linguistics.
- Goel and Byrne (2000) Vaibhava Goel and William J Byrne. 2000. Minimum bayes-risk automatic speech recognition. Computer Speech & Language, 14(2):115–135.
- Goodman (1996) Joshua Goodman. 1996. Parsing algorithms and metrics. In 34th Annual Meeting of the Association for Computational Linguistics, pages 177–183, Santa Cruz, California, USA. Association for Computational Linguistics.
- Graves (2012) Alex Graves. 2012. Sequence transduction with recurrent neural networks. arXiv preprint arXiv:1211.3711.
- Hewitt et al. (2022) John Hewitt, Christopher Manning, and Percy Liang. 2022. Truncation sampling as language model desmoothing. In Findings of the Association for Computational Linguistics: EMNLP 2022, pages 3414–3427, Abu Dhabi, United Arab Emirates. Association for Computational Linguistics.
- Holtzman et al. (2020) Ari Holtzman, Jan Buys, Li Du, Maxwell Forbes, and Yejin Choi. 2020. The curious case of neural text degeneration. In International Conference on Learning Representations.
- Ippolito et al. (2019) Daphne Ippolito, Reno Kriz, João Sedoc, Maria Kustikova, and Chris Callison-Burch. 2019. Comparison of diverse decoding methods from conditional language models. In Proceedings of the 57th Annual Meeting of the Association for Computational Linguistics, pages 3752–3762, Florence, Italy. Association for Computational Linguistics.
- Jinnai and Ariu (2024) Yuu Jinnai and Kaito Ariu. 2024. Hyperparameter-free approach for faster minimum bayes risk decoding. arXiv preprint arXiv:2401.02749.
- Jinnai et al. (2023) Yuu Jinnai, Tetsuro Morimura, Ukyo Honda, Kaito Ariu, and Kenshi Abe. 2023. Model-based minimum bayes risk decoding. arXiv preprint arXiv:2311.05263.
- Kaufman and Rousseeuw (2009) Leonard Kaufman and Peter J Rousseeuw. 2009. Finding groups in data: an introduction to cluster analysis. John Wiley & Sons.
- Kool et al. (2019) Wouter Kool, Herke Van Hoof, and Max Welling. 2019. Stochastic beams and where to find them: The gumbel-top-k trick for sampling sequences without replacement. In International Conference on Machine Learning, pages 3499–3508. PMLR.
- Krause et al. (2017) Jonathan Krause, Justin Johnson, Ranjay Krishna, and Li Fei-Fei. 2017. A hierarchical approach for generating descriptive image paragraphs. In 2017 IEEE Conference on Computer Vision and Pattern Recognition, CVPR 2017, Honolulu, HI, USA, July 21-26, 2017, pages 3337–3345. IEEE Computer Society.
- Kriz et al. (2019) Reno Kriz, João Sedoc, Marianna Apidianaki, Carolina Zheng, Gaurav Kumar, Eleni Miltsakaki, and Chris Callison-Burch. 2019. Complexity-weighted loss and diverse reranking for sentence simplification. In Proceedings of the 2019 Conference of the North American Chapter of the Association for Computational Linguistics: Human Language Technologies, Volume 1 (Long and Short Papers), pages 3137–3147, Minneapolis, Minnesota. Association for Computational Linguistics.
- Kulikov et al. (2019) Ilia Kulikov, Alexander Miller, Kyunghyun Cho, and Jason Weston. 2019. Importance of search and evaluation strategies in neural dialogue modeling. In Proceedings of the 12th International Conference on Natural Language Generation, pages 76–87, Tokyo, Japan. Association for Computational Linguistics.
- Kumar and Byrne (2002) Shankar Kumar and William Byrne. 2002. Minimum Bayes-risk word alignments of bilingual texts. In Proceedings of the 2002 Conference on Empirical Methods in Natural Language Processing (EMNLP 2002), pages 140–147. Association for Computational Linguistics.
- Kumar and Byrne (2004) Shankar Kumar and William Byrne. 2004. Minimum Bayes-risk decoding for statistical machine translation. In Proceedings of the Human Language Technology Conference of the North American Chapter of the Association for Computational Linguistics: HLT-NAACL 2004, pages 169–176, Boston, Massachusetts, USA. Association for Computational Linguistics.
- Laban et al. (2020) Philippe Laban, John Canny, and Marti A. Hearst. 2020. What’s the latest? a question-driven news chatbot. In Proceedings of the 58th Annual Meeting of the Association for Computational Linguistics: System Demonstrations, pages 380–387, Online. Association for Computational Linguistics.
- Lewis et al. (2020) Mike Lewis, Yinhan Liu, Naman Goyal, Marjan Ghazvininejad, Abdelrahman Mohamed, Omer Levy, Veselin Stoyanov, and Luke Zettlemoyer. 2020. BART: Denoising sequence-to-sequence pre-training for natural language generation, translation, and comprehension. In Proceedings of the 58th Annual Meeting of the Association for Computational Linguistics, pages 7871–7880, Online. Association for Computational Linguistics.
- Li et al. (2016) Jiwei Li, Michel Galley, Chris Brockett, Jianfeng Gao, and Bill Dolan. 2016. A diversity-promoting objective function for neural conversation models. In Proceedings of the 2016 Conference of the North American Chapter of the Association for Computational Linguistics: Human Language Technologies, pages 110–119, San Diego, California. Association for Computational Linguistics.
- Li and Jurafsky (2016) Jiwei Li and Dan Jurafsky. 2016. Mutual information and diverse decoding improve neural machine translation. arXiv preprint arXiv:1601.00372.
- Li et al. (2023) Junnan Li, Dongxu Li, Silvio Savarese, and Steven Hoi. 2023. BLIP-2: Bootstrapping language-image pre-training with frozen image encoders and large language models. In Proceedings of the 40th International Conference on Machine Learning, volume 202 of Proceedings of Machine Learning Research, pages 19730–19742. PMLR.
- Lin et al. (2020) Bill Yuchen Lin, Wangchunshu Zhou, Ming Shen, Pei Zhou, Chandra Bhagavatula, Yejin Choi, and Xiang Ren. 2020. CommonGen: A constrained text generation challenge for generative commonsense reasoning. In Findings of the Association for Computational Linguistics: EMNLP 2020, pages 1823–1840, Online. Association for Computational Linguistics.
- Lin (2004) Chin-Yew Lin. 2004. ROUGE: A package for automatic evaluation of summaries. In Text Summarization Branches Out, pages 74–81, Barcelona, Spain. Association for Computational Linguistics.
- Lin and Och (2004) Chin-Yew Lin and Franz Josef Och. 2004. Automatic evaluation of machine translation quality using longest common subsequence and skip-bigram statistics. In Proceedings of the 42nd Annual Meeting of the Association for Computational Linguistics (ACL-04), pages 605–612, Barcelona, Spain.
- Lin et al. (2014) Tsung-Yi Lin, Michael Maire, Serge Belongie, James Hays, Pietro Perona, Deva Ramanan, Piotr Dollár, and C Lawrence Zitnick. 2014. Microsoft coco: Common objects in context. In Computer Vision–ECCV 2014: 13th European Conference, Zurich, Switzerland, September 6-12, 2014, Proceedings, Part V 13, pages 740–755. Springer.
- Meister et al. (2021a) Clara Meister, Afra Amini, Tim Vieira, and Ryan Cotterell. 2021a. Conditional Poisson stochastic beams. In Proceedings of the 2021 Conference on Empirical Methods in Natural Language Processing, pages 664–681, Online and Punta Cana, Dominican Republic. Association for Computational Linguistics.
- Meister et al. (2020) Clara Meister, Ryan Cotterell, and Tim Vieira. 2020. If beam search is the answer, what was the question? In Proceedings of the 2020 Conference on Empirical Methods in Natural Language Processing (EMNLP), pages 2173–2185, Online. Association for Computational Linguistics.
- Meister et al. (2021b) Clara Meister, Martina Forster, and Ryan Cotterell. 2021b. Determinantal beam search. In Proceedings of the 59th Annual Meeting of the Association for Computational Linguistics and the 11th International Joint Conference on Natural Language Processing (Volume 1: Long Papers), pages 6551–6562, Online. Association for Computational Linguistics.
- Mulla and Gharpure (2023) Nikahat Mulla and Prachi Gharpure. 2023. Automatic question generation: A review of methodologies, datasets, evaluation metrics, and applications. Prog. in Artif. Intell., 12(1):1–32.
- Müller and Sennrich (2021) Mathias Müller and Rico Sennrich. 2021. Understanding the properties of minimum Bayes risk decoding in neural machine translation. In Proceedings of the 59th Annual Meeting of the Association for Computational Linguistics and the 11th International Joint Conference on Natural Language Processing (Volume 1: Long Papers), pages 259–272, Online. Association for Computational Linguistics.
- Narayan et al. (2018) Shashi Narayan, Shay B. Cohen, and Mirella Lapata. 2018. Don’t give me the details, just the summary! topic-aware convolutional neural networks for extreme summarization. In Proceedings of the 2018 Conference on Empirical Methods in Natural Language Processing, pages 1797–1807, Brussels, Belgium. Association for Computational Linguistics.
- Nemhauser et al. (1978) George L Nemhauser, Laurence A Wolsey, and Marshall L Fisher. 1978. An analysis of approximations for maximizing submodular set functions—i. Mathematical programming, 14:265–294.
- Ng et al. (2019) Nathan Ng, Kyra Yee, Alexei Baevski, Myle Ott, Michael Auli, and Sergey Edunov. 2019. Facebook FAIR’s WMT19 news translation task submission. In Proceedings of the Fourth Conference on Machine Translation (Volume 2: Shared Task Papers, Day 1), pages 314–319, Florence, Italy. Association for Computational Linguistics.
- Papineni et al. (2002) Kishore Papineni, Salim Roukos, Todd Ward, and Wei-Jing Zhu. 2002. Bleu: a method for automatic evaluation of machine translation. In Proceedings of the 40th Annual Meeting of the Association for Computational Linguistics, pages 311–318, Philadelphia, Pennsylvania, USA. Association for Computational Linguistics.
- Park and Jun (2009) Hae-Sang Park and Chi-Hyuck Jun. 2009. A simple and fast algorithm for k-medoids clustering. Expert systems with applications, 36(2):3336–3341.
- Porter (1980) Martin F Porter. 1980. An algorithm for suffix stripping. Program, 14(3):130–137.
- Post (2018) Matt Post. 2018. A call for clarity in reporting BLEU scores. In Proceedings of the Third Conference on Machine Translation: Research Papers, pages 186–191, Brussels, Belgium. Association for Computational Linguistics.
- Radford et al. (2019) Alec Radford, Jeffrey Wu, Rewon Child, David Luan, Dario Amodei, Ilya Sutskever, et al. 2019. Language models are unsupervised multitask learners. OpenAI blog, 1(8):9.
- Rajpurkar et al. (2018) Pranav Rajpurkar, Robin Jia, and Percy Liang. 2018. Know what you don’t know: Unanswerable questions for SQuAD. In Proceedings of the 56th Annual Meeting of the Association for Computational Linguistics (Volume 2: Short Papers), pages 784–789, Melbourne, Australia. Association for Computational Linguistics.
- Rajpurkar et al. (2016) Pranav Rajpurkar, Jian Zhang, Konstantin Lopyrev, and Percy Liang. 2016. SQuAD: 100,000+ questions for machine comprehension of text. In Proceedings of the 2016 Conference on Empirical Methods in Natural Language Processing, pages 2383–2392, Austin, Texas. Association for Computational Linguistics.
- Rdusseeun and Kaufman (1987) LKPJ Rdusseeun and P Kaufman. 1987. Clustering by means of medoids. In Proceedings of the statistical data analysis based on the L1 norm conference, neuchatel, switzerland, volume 31.
- Reimers and Gurevych (2019) Nils Reimers and Iryna Gurevych. 2019. Sentence-BERT: Sentence embeddings using Siamese BERT-networks. In Proceedings of the 2019 Conference on Empirical Methods in Natural Language Processing and the 9th International Joint Conference on Natural Language Processing (EMNLP-IJCNLP), pages 3982–3992, Hong Kong, China. Association for Computational Linguistics.
- Sakaue (2020) Shinsaku Sakaue. 2020. Guarantees of stochastic greedy algorithms for non-monotone submodular maximization with cardinality constraint. In International Conference on Artificial Intelligence and Statistics, pages 11–21. PMLR.
- Shen et al. (2019) Tianxiao Shen, Myle Ott, Michael Auli, and Marc’Aurelio Ranzato. 2019. Mixture models for diverse machine translation: Tricks of the trade. In International conference on machine learning, pages 5719–5728. PMLR.
- Song et al. (2020) Kaitao Song, Xu Tan, Tao Qin, Jianfeng Lu, and Tie-Yan Liu. 2020. Mpnet: Masked and permuted pre-training for language understanding. Advances in Neural Information Processing Systems, 33:16857–16867.
- Stahlberg and Byrne (2019) Felix Stahlberg and Bill Byrne. 2019. On NMT search errors and model errors: Cat got your tongue? In Proceedings of the 2019 Conference on Empirical Methods in Natural Language Processing and the 9th International Joint Conference on Natural Language Processing (EMNLP-IJCNLP), pages 3356–3362, Hong Kong, China. Association for Computational Linguistics.
- Sultan et al. (2020) Md Arafat Sultan, Shubham Chandel, Ramón Fernandez Astudillo, and Vittorio Castelli. 2020. On the importance of diversity in question generation for QA. In Proceedings of the 58th Annual Meeting of the Association for Computational Linguistics, pages 5651–5656, Online. Association for Computational Linguistics.
- Sutskever et al. (2014) Ilya Sutskever, Oriol Vinyals, and Quoc V. Le. 2014. Sequence to sequence learning with neural networks. In Proceedings of the 27th International Conference on Neural Information Processing Systems - Volume 2, NIPS’14, page 3104–3112, Cambridge, MA, USA. MIT Press.
- Suzgun et al. (2023) Mirac Suzgun, Luke Melas-Kyriazi, and Dan Jurafsky. 2023. Follow the wisdom of the crowd: Effective text generation via minimum Bayes risk decoding. In Findings of the Association for Computational Linguistics: ACL 2023, pages 4265–4293, Toronto, Canada. Association for Computational Linguistics.
- Tam (2020) Yik-Cheung Tam. 2020. Cluster-based beam search for pointer-generator chatbot grounded by knowledge. Computer Speech & Language, 64:101094.
- Tevet and Berant (2021) Guy Tevet and Jonathan Berant. 2021. Evaluating the evaluation of diversity in natural language generation. In Proceedings of the 16th Conference of the European Chapter of the Association for Computational Linguistics: Main Volume, pages 326–346, Online. Association for Computational Linguistics.
- Tu et al. (2019) Lifu Tu, Xiaoan Ding, Dong Yu, and Kevin Gimpel. 2019. Generating diverse story continuations with controllable semantics. In Proceedings of the 3rd Workshop on Neural Generation and Translation, pages 44–58, Hong Kong. Association for Computational Linguistics.
- Vijayakumar et al. (2018) Ashwin Vijayakumar, Michael Cogswell, Ramprasaath Selvaraju, Qing Sun, Stefan Lee, David Crandall, and Dhruv Batra. 2018. Diverse beam search for improved description of complex scenes. In Proceedings of the AAAI Conference on Artificial Intelligence, volume 32.
- Vijayakumar et al. (2016) Ashwin K Vijayakumar, Michael Cogswell, Ramprasath R. Selvaraju, Qing Sun, Stefan Lee, David Crandall, and Dhruv Batra. 2016. Diverse beam search: Decoding diverse solutions from neural sequence models. arXiv preprint arXiv:1610.02424.
- Vilnis et al. (2023) Luke Vilnis, Yury Zemlyanskiy, Patrick Murray, Alexandre Passos, and Sumit Sanghai. 2023. Arithmetic sampling: Parallel diverse decoding for large language models. arXiv preprint arXiv:2210.15458.
- Wang and Chan (2019) Qingzhong Wang and Antoni B. Chan. 2019. Describing like humans: On diversity in image captioning. In IEEE Conference on Computer Vision and Pattern Recognition, CVPR 2019, Long Beach, CA, USA, June 16-20, 2019, pages 4195–4203. Computer Vision Foundation / IEEE.
- Wolf et al. (2020) Thomas Wolf, Lysandre Debut, Victor Sanh, Julien Chaumond, Clement Delangue, Anthony Moi, Pierric Cistac, Tim Rault, Remi Louf, Morgan Funtowicz, Joe Davison, Sam Shleifer, Patrick von Platen, Clara Ma, Yacine Jernite, Julien Plu, Canwen Xu, Teven Le Scao, Sylvain Gugger, Mariama Drame, Quentin Lhoest, and Alexander Rush. 2020. Transformers: State-of-the-art natural language processing. In Proceedings of the 2020 Conference on Empirical Methods in Natural Language Processing: System Demonstrations, pages 38–45, Online. Association for Computational Linguistics.
- Xu et al. (2023) Jiacheng Xu, Caiming Xiong, Silvio Savarese, and Yingbo Zhou. 2023. Best-k search algorithm for neural text generation. In Proceedings of the 61st Annual Meeting of the Association for Computational Linguistics (Volume 1: Long Papers), pages 12385–12401, Toronto, Canada. Association for Computational Linguistics.
- Zhang et al. (2021) Hugh Zhang, Daniel Duckworth, Daphne Ippolito, and Arvind Neelakantan. 2021. Trading off diversity and quality in natural language generation. In Proceedings of the Workshop on Human Evaluation of NLP Systems (HumEval), pages 25–33, Online. Association for Computational Linguistics.
- Zhang* et al. (2020) Tianyi Zhang*, Varsha Kishore*, Felix Wu*, Kilian Q. Weinberger, and Yoav Artzi. 2020. Bertscore: Evaluating text generation with bert. In International Conference on Learning Representations.
Appendix A Proof of Submodularity
Appendix B Examples of Generations
We show outputs generated by the decoding algorithms. Table 1, 2, 3, 4, 5, and 6 are the examples of the generations with various sampling algorithms for each domain evaluated in Section 4. The examples show the generations of the first input source of each dataset.
WMT’19 De-En () Epsilon () Beautiful Munich Woman 2018: Beautiful Munchausen in Hvar: Nine dates Beauty and the Beast in Hvar, 2018: Nine Dates The Best Munich Women 2018 in Hvar: Nine Dates Beautiful Munich 2018 in Hvar: nine dates Beam Beautiful Munich Woman 2018: Beautiful Municipal Woman 2018 in Hvar: Nine Dates Beautiful Munich 2018: Beautiful Munch 2018 in Hvar: Nine Dates Beautiful Munich Woman 2018: Beautiful Munch 2018 in Hvar: Nine Dates Beautiful Munich Woman 2018: Beautiful Municipal Woman 2018 in Hvar: Nine dates DBS-0.5 Beautiful Munich 2018: Beautiful Munchwoman 2018 in Hvar: Nine Dates Beautiful Munich Woman 2018: Beautiful Municipal Woman 2018 in Hvar: Nine Dates Beautiful Munich 2018: Beautiful Munch 2018 in Hvar: Nine Dates Beautiful Munich 2018: Beautiful Hvar 2018: Nine Dates DBS-1.0 Beautiful Munich 2018: Beautiful Munchwoman 2018 in Hvar: Nine Dates Beautiful Munich Woman 2018: Beautiful Municipal Woman 2018 in Hvar: Nine Dates Beauty in Hvar 2018: Nine Dates Beautiful Munich 2018: Beautiful Hvar in 2018: Nine Dates DBS-2.0 Nice Munich 2018: Beautiful Munich 2018 in Hvar: Nine Dates Beautiful Munich 2018: Beautiful Munchwoman 2018 in Hvar: Nine Dates Beautiful Munich Woman 2018: Beautiful Municipal Woman 2018 in Hvar: Nine Dates Beauty in Hvar 2018: Nine Dates DBS-5.0 Nice Munich 2018: Beautiful Munich 2018 in Hvar: Nine Dates Beautiful Munich 2018: Beautiful Munchwoman 2018 in Hvar: Nine Dates Pretty Woman 2018: Pretties in Hvar: Nine Dates Beauty in Hvar 2018: Nine Dates MBR Beautiful Munich 2018: Beautiful Munch 2018 in Hvar: Nine Dates Beautiful Munich 2018: Beautiful Munch 2018 in Hvar: Nine Dates Beautiful Munich 2018: Beautiful Munch 2018 in Hvar: Nine Dates Beautiful Munich 2018: Beautiful Munch 2018 in Hvar: Nine Dates DMBR-0.5 Beautiful Munich 2018 in Hvar: nine dates Beautiful Munich 2018: Beautiful Munch 2018 in Hvar: Nine Dates Pretty Little Liars 2018: Prettiest Girls in Hvar: Nine Dates Beautiful Munich Woman 2018: Beautiful Munic 2018 in Hvar: Nine Dates DMBR-1.0 2018 Pretty Little Liars in Hvar: Nine Dates Pretty Muenchen 2018: Pretties Muencher 2018 in Hvar: Nine Dates Beauty and the City 2018: The Best of the City in 2018: Nine Dates 2018 Beautiful Munich: Beautiful Hvar in Hvars - nine dates DMBR-2.0 2018 Pretty Little Liars in Hvar: Nine Dates Pretty Muenchen 2018: Pretties Muencher 2018 in Hvar: Nine Dates Beauty and the City 2018: The Best of the City in 2018: Nine Dates 2018 Beautiful Munich: Beautiful Hvar in Hvars - nine dates KMBR Nice Munich 2018: Beautiful Munich 2018 in Hvar: Nine dates Beautiful Munich 2018: Beautiful Munch 2018 in Hvar: Nine Dates Beautiful Munich Girl in 2018 in Hvar: Nine Dates Pretty Little Liars 2018: Pretties in Hvar: Nine Dates
WMT’19 Ru-En () Epsilon () Named number of Ukraine conscripts preparing for departure to Donbas The number of recruits from Ukraine about to be sent to Donbas is revealed The number of Ukraine’s new recruits to be sent to Donbas is announced The number of new recruits from Ukraine preparing to be sent to Donbass has been announced Beam The number of recruits from Ukraine preparing to be sent to Donbass has been announced The number of recruits from Ukraine preparing to be sent to Donbas has been announced The number of new recruits from Ukraine preparing to be sent to Donbass has been announced The number of recruits from Ukraine who are preparing to be sent to Donbass has been announced DBS-0.5 The number of recruits from Ukraine preparing to be sent to Donbass has been announced The number of new recruits from Ukraine preparing to be sent to Donbass has been announced Number of recruits from Ukraine preparing to be sent to Donbass is announced The number of recruits from Ukraine preparing to be sent to Donbas has been announced DBS-1.0 The number of recruits from Ukraine preparing to be sent to Donbass has been announced The number of new recruits from Ukraine preparing to be sent to Donbass has been announced Number of recruits from Ukraine preparing to be sent to Donbass is announced The number of Ukrainian recruits being prepared for deployment to Donbas has been announced DBS-2.0 The number of recruits from Ukraine preparing to be sent to Donbass has been announced Number of recruits from Ukraine preparing to be sent to Donbass is announced The number of new recruits from Ukraine preparing to be sent to Donbass has been announced Named the number of recruits from Ukraine preparing for deployment in the Donbass region DBS-5.0 The number of recruits from Ukraine preparing to be sent to Donbass has been announced Number of recruits from Ukraine preparing to be sent to Donbass is announced Named the number of recruits from Ukraine preparing for deployment to Donbass Announces Number of Ukrainian Recruits Ready for Deployment to Donbass MBR The number of recruits from Ukraine preparing to be sent to Donbass is announced The number of recruits from Ukraine preparing to be sent to Donbas is announced The number of recruits from Ukraine preparing to be sent to Donbass was announced. The number of recruits from Ukraine preparing to be sent to Donbas has been announced DMBR-0.5 Number of new recruits from Ukraine being prepared for deployment to Donbass The number of Ukrainian recruits preparing to be sent to Donbas has been announced The number of Ukraine recruits to be sent to Donbass was announced The number of recruits from Ukraine who are preparing to go to Donbass is announced DMBR-1.0 The number of new recruits being sent from Ukraine to Donbas has been named Number of Ukrainian recruits in preparation for deployment to the Donbass Announces the Number of Recruiters from Ukraine to Be Prepared for Designating in Donbas The number of Ukraine’s recruits preparing to be sent to Donetsk has been announced DMBR-2.0 The number of new recruits being sent from Ukraine to Donbas has been named Number of Ukrainian recruits in preparation for deployment to the Donbass Announces the Number of Recruiters from Ukraine to Be Prepared for Designating in Donbas The number of Ukraine’s recruits preparing to be sent to Donetsk has been announced KMBR The number of Ukrainian recruits preparing to be sent to Donbass has been announced The number of recruits from Ukraine preparing to be sent to Donbass is announced The number of new recruits from Ukraine preparing to be sent to Donbass has been announced The number of recruits from Ukraine preparing to be sent to Donbass
MS COCO () Epsilon () a person riding a motorcycle down a dirt road a man riding on his motorcycle on the dirt road a man on a motorcycle sitting on the top of a dirt path a person is sitting on the back of a motorcycle Beam a man riding a motorcycle on a dirt road a man on a motorcycle on a dirt road a man is riding a motorcycle on a dirt road a man is riding a motorcycle down a dirt road DBS-0.5 a man riding a motorcycle on a dirt road a man on a dirt bike on a dirt road a man is riding a motorcycle down a dirt road a man riding a motorcycle on a dirt road DBS-1.0 a man riding a motorcycle on a dirt road the man is riding his motorcycle down a dirt road a man on a dirt bike on a dirt road a person is riding a motorcycle down a dirt road DBS-2.0 a man riding a motorcycle on a dirt road the man is sitting on the back of the motorcycle man riding a motorcycle on a dirt road a person on a dirt bike on a dirt road DBS-5.0 a man riding a motorcycle on a dirt road the man is sitting on the back of the motorcycle man riding a motorcycle on a dirt road there is someone on the back of a dirt bike on a dirt road MBR a man sitting on a motorcycle on a dirt road a man riding a motorcycle down a dirt road a man riding a motorcycle on a dirt path a man on a dirt motorcycle riding on a mountain road DMBR-0.5 a person on a dirt bike sits on the back of a dirt road a man is riding a motor bike down a dirt path a man on a motorcycle near mountains a man riding on the back of a motorcycle on a dirt road DMBR-1.0 a person on a dirt bike is riding down a dirt road a motorcyclist sitting on the back of his motorcycle a man on a motorcycle near mountains a man is riding down a dirt road with a mountain in the distance DMBR-2.0 a person on a dirt bike is riding down a dirt road a motorcyclist sitting on the back of his motorcycle a man on a motorcycle near mountains a man is riding down a dirt road with a mountain in the distance KMBR a man sitting on a motorcycle on a dirt road a man riding a dirt bike near the mountains a man riding a motorcycle down a dirt road a man sits on the back of a dirt bike on a dirt road
SQuADv2 () Epsilon () What group of people gave their name to the region of Normandy in France? (Short answer: Normans) What group of people in the paragraph are commonly associated with the region of Normandy in France? What group of people in the paragraph are referred to by the term "Normans"? What nationality did the Normals originate from in the tenth and eleventh centuries? Beam What people are referred to as Normans in the paragraph? What people are referred to as "Normans" in the paragraph? What people are referred to as "Normans" in the paragraph and where did they originate from? What people are referred to as Normans in the given paragraph? (Note: The answer is "Normans" itself.) DBS-0.5 What people are referred to as Normans in the paragraph? What group of people in the paragraph are commonly referred to as "Normans"? What people gave their name to Normancy in the tenth and eleventh centuries? What people in the paragraph are known for giving their nameto a region and being descended from Norse raiders? DBS-1.0 What group of people in the paragraph are commonly referred to as "Normans"? What people are referred to as Normans in the paragraph? What people gave their name to Normancy in the tenth and eleventh centuries? What ethnic group gave their name to Normancy in the tenth and eleventh centuries? DBS-2.0 What group of people in the paragraph are commonly referred to as "Normans"? What people gave their name to Normancy in the tenth and eleventh centuries? Who gave their name to Normancy in the paragraph provided? What ethnic group gave their name to Normancy in the tenth and eleventh centuries? DBS-5.0 What people gave their name to Normancy in the tenth and eleventh centuries? Who gave their name to Normancy in the paragraph provided? Question: What people in the paragraph are known as Normans, and where did they originate from? (Answer: Normans originated from NorSE raiders in Denmark, Norway, and What group of people gave their name to Normancy in the paragraph provided? (Answer: Normans) MBR What ethnic group gave their name to Normancy in the Middle Ages? What group of people in the paragraph gave their Name to Normancy in France? What ethnic group in the Middle Ages gave their name to the region of Normandy in France? What ethnic group gave their name to the region of Normandy in France? DMBR-0.5 What people gave their name to Normancy in the tenth and eleventh centuries? What ethnic group gave their name to Normany? (Answer: Normans) What people were the Normals named after in the region of Normandy in France? What group of people in the paragraph are known as the Normands? DMBR-1.0 What people gave their name to Normamy in the10t and ith centuries? What group of people in the paragraph are known as Normans? (Note: The answer is simply "Normans" as the question asks to answer with a single word.) What people from Denmark-, Icelander- and Norway-descent were known as in France in the tenth and eleventh centuries? What ethnically distinct group gave their name to the region of Normandy in France and how did they come to do so? (2 parts) DMBR-2.0 What nationality were the Normals originally before giving their name to Normandy? What people gave their name to Normamy in the10t and ith centuries? What group of people in the paragraph are known as Normans? (Note: The answer is simply "Normans" as the question asks to answer with a single word.) What people from Denmark-, Icelander- and Norway-descent were known as in France in the tenth and eleventh centuries? KMBR What people gave their name to Normancy in the tenth and eleventh centuries? What ethnic group gave their name to the region of Normandy in France? What nationality did the Normals originate from in the tenth and eleventh centuries? What group of people in the paragraph are known as Normans?
CommonGen () Epsilon () The standing crop in the fields catches the eye with its verdant hue. The standing crops in the agricultural field appear majestic as the observer looks on. The standing crops in the scenic field are currently being observed by onlookers. In the field, a statue appears to be standing despite not actually looking like it’s standing due to its stationary position. Beam In the field, a look stands out. Standing in the open field, one’s gaze wanders afar. Standing in the open field, one’s gaze is fixed on the horizon. In the countryside, a stationary telescope gazes out at the landscape. DBS-0.5 In the countryside, a stationary telescope gazes out at the landscape. In the field, a look stands out. The farmer’s eyes scanned the horizon, waiting for his crops to come to their feet. In the countryside, a stationary view meets the eye. DBS-1.0 In the countryside, a stationary telescope gazes out at the landscape. Standing in the open field, one’s gaze wanders afar. The farmer’s eyes scanned the horizon, waiting for his crops to come to their feet. In the field, a look stands out. DBS-2.0 In the countryside, a stationary telescope gazes out at the landscape. Standing in the open field, one’s gaze wanders afar. The farmer’s eyes scanned the horizon, waiting for his crops to come to their feet. "In the countryside, a farmer stops to survey the landscape with a keen gaze." (Field, look, stand) DBS-5.0 In the countryside, a stationary telescope gazes out at the landscape. Standing in the open field, one’s gaze wanders afar. "In the countryside, a farmer stops to survey the landscape with a keen gaze." (Field, look, stand)\n Alternatively: "In a rural area, an agricultural worker paus The farmer’s eyes scanned the horizon, waiting for his crops to come to their feet.\nSentence: In the farmer’ s field, the look stood. \nExplanation MBR The standing figure in the open field catches the eye with its striking appearance. The standing figure in the open field catches the eye with its striking appearance. In the field, a stationary scene catches the eye. In the field, a statue appears to be standing and looking in a specific direction. DMBR-0.5 In the field, a stationary gaze is observed. The standing figure in the open field catches the eye with its captivating appearance. In the field, a statue appears to be standing and looking out into the distance. The standing crops in the agricultural field undergo visual inspections, known as field looks. DMBR-1.0 The standing crops in the agricultural field undergo visual inspections, known as field looks. The field appeared still and stationary in the standstill of the stand.’ In the field, a look stands out. The standing figure gazes out into the open expanse of greenery in the distance. DMBR-2.0 In the field, a stationary observation is called a field look or stand. The standing crops in the open field catch the eye with their vivid green hues on a sunny day. The field appeared still and stationary in the standstill of the stand.’ In the field, a sculpture appears to be standing and gazing outwards, as if looking in a particular direction. KMBR In the field, a statue appears to be standing and looking in a specific direction. The standing crops in the open field catch the eye of passersby. The standing figure gazes out into the open expanse of the field. In the field, a stationary view can be observed.
XSum () Epsilon () A charity which helps prison leavers is claiming there is a "desperate need" for more housing for those released after prison. There is a "desperate need" for housing for former inmates who are left homeless after leaving prison, a charity has said. The number of referrals to a homelessness charity by people released from prison in Wales is at an all-time high, it has been claimed. A charity has called for more homes for men who are left homeless after leaving prison in Wales. Beam There is a "desperate need" for housing for men and women released from prison in Wales, a charity has said. There is a "desperate need" for housing for men and women released from prison, a charity has said. There is a "desperate need" for housing for former prisoners in Wales, a charity has said. There is a "desperate need" for housing for men and women released from prison in Wales, a charity has claimed. DBS-0.5 A charity which helps former prisoners find housing has said there is a "desperate need" for more one-bedroom flats. More needs to be done to help former prisoners find accommodation after they leave prison, a charity has said. The number of people referred to a charity for help finding housing after leaving prison has more than doubled in the past year, it has been revealed. The number of people being referred to a charity for help finding housing after leaving prison has risen by more than a third in the past year, figures show. DBS-1.0 More needs to be done to help former prisoners find accommodation after they leave prison, a charity has said. A charity which helps former prisoners find housing has said there is a "desperate need" for accommodation for them after they leave prison. The number of people being referred to a charity for help finding housing after leaving prison has risen by more than a third in the past year, figures show. The number of homeless people in Wales has risen by more than 50% in the past year, a charity has said. DBS-2.0 There is a "desperate need" for more housing for men and women who leave prison, a charity has said. More needs to be done to help former prisoners find accommodation after they leave prison, a charity has said. A charity which helps former prisoners find housing has said there is a "desperate need" for accommodation for them after they leave prison. The number of people being referred to a charity for help finding housing after leaving prison has risen by more than a third in the past year, figures show. DBS-5.0 There is a "desperate need" for more housing for men and women who leave prison, a charity has said. More needs to be done to help former prisoners find accommodation after they leave prison, a charity has said. A charity which helps former prisoners find housing has said there is a "desperate need" for accommodation for them after they leave prison. The number of people being referred to a charity for help finding housing after leaving prison has risen by more than a third in the past year, figures show. MBR The number of former prisoners needing help to find housing is on the rise in Wales, a charity has said. There is a "desperate" need for better housing for people leaving prison, a charity has said. The number of homeless people in Wales is rising because of a "desperate" need for help to find accommodation after they leave prison, a charity has said. The number of people needing help to find accommodation after being released from prison in Wales is rising, a charity has said. DMBR-0.5 A charity which helps prisoners find housing has said there is a "desperate need" for more support. The number of former prisoners in Wales being referred for help to find housing is at its highest level for seven years, new figures have shown. The number of people being put on the streets by homelessness services in Wales after being released from prison has doubled this year, according to a charity. More affordable homes should be built for people leaving prison, a charity has said. DMBR-1.0 Welsh jailing for homeless people could save money for the public purse, according to a homeless charity. The number of people being referred to Wales’ prisons because of problems getting housing has risen by 30%. There is a "desperate" need for better support for prison leavers, with more than one a day being referred to an accommodation charity, a charity has said. A charity which helps ex-prisoners find housing after being released has said it is "desperately" in need of more one-bedroom flats. DMBR-2.0 More one-bedroom flats could be built in Wales to help ease a "desperate" need for accommodation for former prison leavers, a charity has said. Welsh jailing for homeless people could save money for the public purse, according to a homeless charity. The number of people being referred to Wales’ prisons because of problems getting housing has risen by 30%. A charity which helps men and women leave prison says there are "desperate" problems for them after they leave. KMBR More affordable homes should be built for people leaving prison, a charity has said. The number of former prisoners needing help to find housing is on the rise in Wales, a charity has said. There is a "desperate" need for better housing for people leaving prison, a charity has said. A charity that helps men and women find housing after leaving prison has claimed there is a "desperate need" for more flats.
Appendix C Additional Results
The evaluation of the diversity as a function of minimum BLEU over the outputs on WMT’19 datasets is present in 7. DMBR achieves a better trade-off than DBS and sampling algorithms with the same minimum BLEU score.
The Oracle (maximum) and the minimum quality scores on MS COCO, SQuADv2, CommonGen, and XSum with an output size of 4 are present in Figure 8 and 9. We observe similar trends as in machine translation tasks.
Figure 10 shows the pairwise sentence BERT as a function of the minimum BLEU and METEOR scores on MS COCO, SQuAD, and CommonGen. The result indicates that DMBR and DBS are successfully generating semantically diverse outputs.
Table 7, 8, 9, 10, 11, 12, and 13 show the summary of the experimental results described in Section 4.


Quality Diversity Decoder min BLEU mean BLEU max BLEU Pairwise-BLEU distinct-1 distinct-2 distinct-3 WMT’19 De-En () Epsilon 17.09 27.11 38.06 34.13 0.40 0.55 0.60 Top-k 15.42 25.81 37.51 28.87 0.42 0.59 0.65 Nucleus 13.81 24.14 35.51 25.70 0.46 0.63 0.67 Ancestral 9.20 18.82 30.19 15.72 0.55 0.73 0.76 Beam 27.36 34.98 43.93 68.64 0.29 0.35 0.36 DBS-0.5 25.47 34.46 43.55 60.59 0.31 0.38 0.41 DBS-1.0 22.11 32.52 43.71 52.01 0.34 0.43 0.46 DBS-2.0 19.58 30.60 42.65 47.46 0.37 0.47 0.49 DBS-5.0 17.34 28.41 40.56 45.02 0.40 0.50 0.51 DBS-10.0 17.05 27.90 39.97 43.95 0.41 0.51 0.52 DBS-20.0 17.05 27.90 39.97 43.95 0.41 0.51 0.52 MBR 31.25 35.17 39.20 75.14 0.28 0.33 0.35 DMBR-0.1 27.80 34.74 41.85 61.80 0.31 0.39 0.42 DMBR-0.3 21.21 32.03 43.51 40.74 0.37 0.50 0.55 DMBR-0.5 13.59 25.80 39.94 22.84 0.45 0.64 0.69 DMBR-1.0 10.76 20.59 33.41 15.54 0.51 0.71 0.75 DMBR-2.0 10.47 19.45 30.93 14.94 0.51 0.72 0.76 KMBR 21.28 31.93 44.36 43.92 0.36 0.48 0.52 WMT’19 Ru-En () Epsilon 16.30 26.14 37.10 34.74 0.38 0.54 0.60 Top-k 14.35 23.98 34.68 29.07 0.41 0.58 0.64 Nucleus 12.88 22.26 32.98 25.29 0.45 0.63 0.68 Ancestral 6.15 15.57 26.52 11.88 0.58 0.77 0.79 Beam 24.90 31.78 39.69 69.76 0.28 0.34 0.36 DBS-0.5 23.39 31.45 39.66 60.67 0.30 0.38 0.41 DBS-1.0 20.34 29.90 40.14 52.35 0.33 0.43 0.46 DBS-2.0 18.08 28.08 39.02 48.01 0.36 0.47 0.49 DBS-5.0 16.32 26.37 37.16 47.23 0.38 0.48 0.50 DBS-10.0 15.94 25.89 36.53 46.24 0.39 0.49 0.51 DBS-20.0 15.94 25.89 36.53 46.24 0.39 0.49 0.51 MBR 28.08 32.28 36.44 75.12 0.27 0.33 0.35 DMBR-0.1 24.91 31.73 38.91 61.97 0.30 0.38 0.42 DMBR-0.3 19.74 29.60 40.33 41.30 0.35 0.50 0.55 DMBR-0.5 13.47 24.48 37.51 23.58 0.43 0.63 0.68 DMBR-1.0 10.49 19.84 31.51 16.23 0.48 0.70 0.75 DMBR-2.0 10.06 18.90 30.03 15.51 0.49 0.71 0.76 KMBR 19.84 29.75 41.09 45.23 0.35 0.47 0.52
Quality Diversity Decoder min BLEU mean BLEU max BLEU Pairwise-BLEU distinct-1 distinct-2 distinct-3 WMT’19 De-En () Epsilon 13.94 27.32 43.54 33.94 0.25 0.40 0.48 Top-k 12.19 25.46 42.23 28.39 0.28 0.46 0.54 Nucleus 10.49 23.90 40.17 25.37 0.33 0.51 0.58 Ancestral 5.34 17.28 34.05 13.23 0.47 0.67 0.72 Beam 23.82 34.02 47.28 63.21 0.17 0.23 0.25 DBS-0.5 19.15 32.43 46.96 52.07 0.19 0.27 0.31 DBS-1.0 15.77 29.76 46.69 42.89 0.23 0.34 0.38 DBS-2.0 12.28 26.88 44.73 36.31 0.27 0.40 0.44 DBS-5.0 8.89 23.60 41.72 31.37 0.32 0.46 0.50 MBR 28.43 34.77 41.58 70.36 0.16 0.21 0.24 DMBR-0.1 25.98 34.60 43.78 63.20 0.17 0.24 0.27 DMBR-0.3 19.56 32.26 46.43 46.23 0.21 0.32 0.38 DMBR-0.5 11.67 26.52 45.01 27.75 0.28 0.46 0.54 DMBR-1.0 9.30 21.03 38.56 18.62 0.33 0.56 0.64 DMBR-2.0 9.05 20.14 36.95 18.01 0.33 0.56 0.64 KMBR 15.56 29.88 47.62 39.36 0.24 0.36 0.43 WMT’19 De-En () Epsilon 12.61 27.54 46.32 34.16 0.19 0.33 0.41 Top-k 10.93 25.56 45.03 28.68 0.22 0.39 0.48 Nucleus 9.30 23.83 42.75 25.41 0.27 0.45 0.53 Ancestral 4.09 16.77 36.51 12.61 0.42 0.64 0.70 Beam 21.69 33.32 49.22 60.45 0.13 0.18 0.21 DBS-0.5 15.74 30.82 48.86 46.99 0.15 0.24 0.28 DBS-1.0 12.24 27.83 48.15 37.74 0.19 0.30 0.36 DBS-2.0 8.89 24.52 45.74 30.21 0.23 0.37 0.43 DBS-5.0 5.56 20.34 42.22 23.72 0.29 0.46 0.52 MBR 26.39 34.50 43.50 67.08 0.12 0.17 0.20 DMBR-0.1 24.40 34.36 45.33 62.08 0.12 0.18 0.22 DMBR-0.3 18.57 32.45 48.22 48.08 0.15 0.24 0.30 DMBR-0.5 10.66 27.03 48.03 29.86 0.21 0.37 0.46 DMBR-1.0 8.76 21.68 41.96 20.44 0.25 0.46 0.56 DMBR-2.0 8.64 20.79 40.61 19.74 0.25 0.46 0.56 KMBR 12.30 28.36 49.59 35.44 0.19 0.32 0.39
Quality Diversity Decoder min BLEU mean BLEU max BLEU Pairwise-BLEU distinct-1 distinct-2 distinct-3 WMT’19 Ru-En () Epsilon 13.38 25.95 41.34 34.92 0.24 0.39 0.47 Top-k 11.79 24.07 39.09 29.57 0.27 0.44 0.52 Nucleus 9.70 22.39 37.71 25.57 0.32 0.50 0.58 Ancestral 3.82 14.69 30.21 11.05 0.48 0.70 0.75 Beam 21.83 31.21 43.11 64.87 0.16 0.22 0.25 DBS-0.5 17.60 29.68 43.08 52.23 0.19 0.27 0.31 DBS-1.0 14.51 27.62 43.15 43.67 0.22 0.32 0.37 DBS-2.0 11.97 25.06 41.28 37.18 0.25 0.38 0.43 DBS-5.0 8.56 22.12 38.48 32.54 0.30 0.44 0.49 MBR 25.22 31.87 38.90 69.76 0.15 0.21 0.24 DMBR-0.1 23.01 31.65 40.82 62.81 0.16 0.23 0.27 DMBR-0.3 18.25 29.80 42.84 47.04 0.20 0.31 0.37 DMBR-0.5 11.26 24.99 42.27 28.25 0.26 0.44 0.53 DMBR-1.0 8.89 20.23 36.68 19.38 0.31 0.53 0.63 DMBR-2.0 8.68 19.51 35.20 18.85 0.31 0.54 0.63 KMBR 14.67 27.94 44.57 40.54 0.22 0.35 0.41 WMT’19 Ru-En () Epsilon 12.05 25.97 43.70 34.95 0.18 0.31 0.40 Top-k 10.28 24.05 41.80 29.48 0.21 0.37 0.46 Nucleus 8.27 22.46 40.72 25.60 0.26 0.44 0.52 Ancestral 2.95 14.68 33.05 11.06 0.43 0.66 0.72 Beam 20.33 30.77 45.10 62.37 0.12 0.17 0.20 DBS-0.5 14.61 28.47 45.04 47.34 0.15 0.23 0.27 DBS-1.0 11.61 25.96 44.89 38.50 0.18 0.29 0.35 DBS-2.0 8.71 22.96 42.24 30.84 0.22 0.36 0.42 DBS-5.0 5.17 19.23 38.88 24.43 0.27 0.45 0.51 MBR 23.63 31.49 40.51 66.12 0.11 0.17 0.20 DMBR-0.1 21.84 31.36 42.00 61.51 0.12 0.18 0.22 DMBR-0.3 17.36 29.96 44.47 48.76 0.14 0.23 0.29 DMBR-0.5 10.35 25.23 44.37 30.36 0.20 0.35 0.45 DMBR-1.0 8.29 20.82 40.27 21.31 0.23 0.43 0.54 DMBR-2.0 8.14 20.10 38.77 20.60 0.23 0.44 0.54 KMBR 11.88 26.69 46.17 36.90 0.18 0.30 0.38
Quality Diversity Decoder min BLEU mean BLEU max BLEU Pairwise-BLEU distinct-1 distinct-2 distinct-3 MS COCO () Epsilon 13.64 23.83 36.94 16.13 0.48 0.68 0.71 Beam 25.07 34.19 44.58 54.44 0.30 0.38 0.40 DBS-0.5 21.89 32.26 43.65 40.28 0.34 0.46 0.49 DBS-1.0 18.99 30.61 43.55 31.95 0.38 0.53 0.56 DBS-2.0 16.88 28.99 42.51 28.74 0.42 0.57 0.58 DBS-5.0 15.05 27.06 40.17 26.10 0.45 0.59 0.60 MBR 23.84 32.31 42.01 46.24 0.33 0.44 0.47 DMBR-0.1 21.22 31.61 43.45 35.18 0.36 0.51 0.55 DMBR-0.3 16.55 28.55 43.40 18.34 0.45 0.65 0.68 DMBR-0.5 11.74 23.83 39.74 10.41 0.55 0.76 0.76 DMBR-1.0 9.48 18.97 32.17 7.26 0.61 0.81 0.79 DMBR-2.0 9.17 17.94 30.29 7.01 0.61 0.82 0.79 KMBR 16.91 29.02 43.92 20.73 0.45 0.62 0.65 MS COCO () Epsilon 10.85 23.42 42.66 15.84 0.33 0.56 0.63 Beam 21.34 33.82 50.28 46.73 0.18 0.26 0.30 DBS-0.5 15.53 30.21 48.42 31.49 0.24 0.37 0.42 DBS-1.0 12.85 28.01 47.83 24.28 0.27 0.44 0.50 DBS-2.0 10.88 25.93 45.87 20.73 0.31 0.49 0.54 DBS-5.0 8.49 22.91 42.93 16.86 0.37 0.55 0.59 MBR 18.64 30.98 47.04 37.60 0.22 0.34 0.41 DMBR-0.1 17.82 30.77 47.65 33.78 0.23 0.37 0.44 DMBR-0.3 14.18 28.60 48.96 22.39 0.28 0.47 0.55 DMBR-0.5 9.75 23.65 45.37 12.74 0.37 0.61 0.68 DMBR-1.0 8.12 18.77 37.70 8.89 0.43 0.69 0.74 DMBR-2.0 7.90 18.19 36.71 8.62 0.43 0.70 0.74 KMBR 11.13 26.23 48.62 17.09 0.33 0.53 0.61 MS COCO () Epsilon 9.74 23.51 46.65 15.86 0.26 0.48 0.58 Beam 19.07 33.44 53.70 42.83 0.14 0.21 0.26 DBS-0.5 12.35 28.71 51.03 27.09 0.19 0.32 0.39 DBS-1.0 10.14 26.41 49.98 20.77 0.23 0.40 0.47 DBS-2.0 8.22 23.65 47.55 16.14 0.28 0.47 0.54 DBS-5.0 5.65 19.57 43.78 12.10 0.34 0.56 0.61 MBR 16.06 30.12 50.00 33.03 0.17 0.30 0.38 DMBR-0.1 15.53 29.92 50.35 31.03 0.18 0.32 0.40 DMBR-0.3 13.23 28.43 51.37 23.46 0.21 0.38 0.48 DMBR-0.5 8.95 23.77 49.38 13.82 0.29 0.52 0.62 DMBR-1.0 7.51 19.33 42.51 9.85 0.33 0.60 0.69 DMBR-2.0 7.42 18.63 40.72 9.54 0.33 0.61 0.70 KMBR 8.72 24.19 50.32 14.82 0.28 0.50 0.60
Quality Diversity Decoder min METEOR mean METEOR max METEOR Pairwise-BLEU distinct-1 distinct-2 distinct-3 SQuADv2 () Epsilon 28.38 38.99 50.36 16.72 0.55 0.75 0.78 Beam 35.60 39.28 43.13 16.82 0.31 0.36 0.36 DBS-0.5 31.17 39.66 48.80 17.42 0.47 0.61 0.64 DBS-1.0 29.53 39.78 50.72 17.27 0.53 0.70 0.73 DBS-2.0 28.52 39.16 50.27 16.86 0.55 0.74 0.76 DBS-5.0 27.64 38.61 50.26 16.12 0.56 0.76 0.78 MBR 36.91 41.45 46.32 19.27 0.35 0.43 0.45 DMBR-0.1 33.85 41.36 49.38 19.02 0.43 0.56 0.60 DMBR-0.3 30.55 40.84 51.66 18.45 0.54 0.72 0.75 DMBR-0.5 27.02 38.70 51.35 17.23 0.62 0.82 0.83 DMBR-1.0 24.56 35.83 48.59 14.89 0.65 0.87 0.88 DMBR-2.0 23.73 35.07 48.59 14.32 0.65 0.88 0.89 KMBR 29.31 40.43 52.21 18.79 0.55 0.73 0.75 SQuAD v2 () Epsilon 25.18 38.92 54.61 16.90 0.41 0.63 0.70 Beam 33.06 39.32 46.09 16.87 0.19 0.25 0.27 DBS-0.5 26.65 39.52 53.61 17.30 0.35 0.52 0.57 DBS-1.0 25.79 39.32 54.22 17.04 0.38 0.58 0.63 DBS-2.0 24.18 38.42 54.34 16.25 0.41 0.64 0.70 DBS-5.0 22.11 37.14 53.91 15.28 0.43 0.69 0.75 MBR 34.36 41.37 49.17 19.15 0.22 0.31 0.35 DMBR-0.1 32.04 41.23 51.47 18.99 0.27 0.39 0.44 DMBR-0.3 28.56 40.76 54.78 18.35 0.35 0.55 0.61 DMBR-0.5 24.07 38.94 55.46 17.03 0.44 0.68 0.74 DMBR-1.0 21.64 36.07 53.73 14.87 0.49 0.78 0.83 DMBR-2.0 21.48 35.72 53.57 14.49 0.49 0.78 0.84 KMBR 25.53 39.81 55.80 18.28 0.41 0.62 0.67 SQuAD v2 () Epsilon 23.83 38.84 56.55 16.93 0.33 0.56 0.64 Beam 31.34 39.36 47.87 16.87 0.15 0.21 0.23 DBS-0.5 24.31 39.26 55.94 17.11 0.29 0.47 0.53 DBS-1.0 23.32 38.97 56.78 16.79 0.31 0.52 0.59 DBS-2.0 21.30 37.71 56.61 15.76 0.35 0.60 0.68 DBS-5.0 19.91 36.66 56.47 14.75 0.38 0.67 0.74 MBR 32.57 41.17 51.26 19.08 0.18 0.27 0.32 DMBR-0.1 30.99 41.18 53.15 18.89 0.21 0.32 0.37 DMBR-0.3 27.39 40.68 55.93 18.31 0.27 0.45 0.53 DMBR-0.5 23.05 38.88 57.71 17.00 0.36 0.61 0.68 DMBR-1.0 20.76 36.43 56.50 15.06 0.41 0.70 0.77 DMBR-2.0 20.51 35.90 55.99 14.63 0.41 0.70 0.78 KMBR 23.45 39.30 57.87 17.76 0.34 0.57 0.64
Quality Diversity Decoder min METEOR mean METEOR max METEOR Pairwise-BLEU distinct-1 distinct-2 distinct-3 CommonGen () Epsilon 0.31 0.41 0.50 0.21 0.49 0.66 0.68 Beam 0.34 0.41 0.48 0.21 0.37 0.48 0.50 DBS-0.5 0.32 0.40 0.48 0.21 0.43 0.57 0.59 DBS-1.0 0.31 0.40 0.50 0.20 0.48 0.66 0.68 DBS-2.0 0.30 0.40 0.50 0.20 0.51 0.71 0.73 DBS-5.0 0.29 0.39 0.50 0.19 0.56 0.77 0.78 MBR 0.40 0.43 0.45 0.23 0.29 0.33 0.33 DMBR-0.1 0.37 0.43 0.49 0.23 0.37 0.47 0.49 DMBR-0.3 0.34 0.42 0.51 0.22 0.47 0.63 0.65 DMBR-0.5 0.30 0.40 0.51 0.21 0.56 0.76 0.77 DMBR-1.0 0.27 0.37 0.49 0.18 0.63 0.84 0.85 DMBR-2.0 0.26 0.36 0.48 0.18 0.63 0.86 0.86 KMBR 0.32 0.42 0.52 0.22 0.51 0.69 0.71 CommonGen () Epsilon 28.61 40.73 53.41 20.93 0.36 0.55 0.60 Beam 30.46 40.45 51.44 20.80 0.25 0.36 0.40 DBS-0.5 28.43 40.18 52.40 20.54 0.32 0.48 0.53 DBS-1.0 27.12 39.99 53.36 20.31 0.35 0.54 0.59 DBS-2.0 25.36 39.23 54.30 19.22 0.41 0.66 0.72 DBS-5.0 23.71 37.92 53.85 17.66 0.45 0.73 0.79 MBR 38.82 42.68 46.83 22.90 0.17 0.22 0.23 DMBR-0.1 36.19 42.79 50.27 22.71 0.22 0.30 0.33 DMBR-0.3 31.71 42.39 53.81 22.16 0.30 0.46 0.51 DMBR-0.5 26.92 40.32 54.41 20.92 0.40 0.62 0.66 DMBR-1.0 23.85 37.28 52.74 18.51 0.48 0.74 0.78 DMBR-2.0 23.67 36.79 51.84 18.05 0.48 0.75 0.80 KMBR 27.65 41.00 55.55 21.58 0.38 0.59 0.64 CommonGen () Epsilon 27.10 40.73 55.01 20.93 0.29 0.49 0.54 Beam 28.69 40.42 53.28 20.78 0.20 0.31 0.36 DBS-0.5 26.14 39.91 54.69 20.35 0.27 0.44 0.50 DBS-1.0 24.56 39.58 55.34 19.96 0.30 0.51 0.58 DBS-2.0 22.81 38.48 56.10 18.50 0.36 0.64 0.72 DBS-5.0 20.79 36.83 55.43 16.70 0.40 0.71 0.79 MBR 37.70 42.60 48.06 22.84 0.13 0.18 0.20 DMBR-0.1 35.44 42.76 51.08 22.65 0.16 0.24 0.27 DMBR-0.3 31.05 42.45 54.86 22.16 0.22 0.37 0.42 DMBR-0.5 25.84 40.42 56.23 20.92 0.32 0.54 0.60 DMBR-1.0 22.90 37.66 54.91 18.75 0.39 0.67 0.73 DMBR-2.0 22.76 37.26 54.66 18.34 0.40 0.67 0.74 KMBR 25.62 40.50 57.15 21.12 0.32 0.54 0.61
Quality Diversity Decoder min ROUGE-L mean ROUGE-L max ROUGE-L Pairwise-BLEU distinct-1 distinct-2 distinct-3 XSum () Epsilon 21.65 30.15 39.23 34.73 0.55 0.76 0.81 Beam 31.80 35.51 39.42 84.21 0.30 0.35 0.37 DBS-0.5 26.78 34.39 42.37 57.17 0.41 0.54 0.57 DBS-1.0 24.73 33.56 42.90 51.45 0.43 0.58 0.62 DBS-2.0 23.39 32.62 42.44 47.74 0.45 0.61 0.64 DBS-5.0 21.91 31.37 41.54 44.80 0.47 0.63 0.66 MBR 29.33 35.26 41.67 58.98 0.43 0.57 0.63 DMBR-0.1 28.08 35.20 42.93 52.48 0.47 0.62 0.67 DMBR-0.3 24.62 33.53 43.05 39.77 0.54 0.72 0.77 DMBR-0.5 20.00 30.18 41.34 28.37 0.62 0.81 0.84 DMBR-1.0 17.46 26.34 36.65 21.87 0.66 0.86 0.87 DMBR-2.0 17.06 25.61 35.58 21.21 0.66 0.86 0.88 KMBR 23.41 33.03 43.46 40.22 0.53 0.71 0.75