+49 (0)7531 882027 Universität Konstanz] Department of Chemistry, Universität Konstanz, Konstanz, Germany \abbreviations
Temporal evolution of interparticle potentials of PMMA colloids in CHB/decaline
Abstract
Colloidal dispersions composed of polymethylmetacrylate particles dispersed in a mixture of cyclohexylbromide and decalin find widespread use as model systems in optical microscopy experiments. While the system allows simultaneous density and refractive index matching, preparing particles with hard potentials remains challenging and strong variations in the physical parameters of samples prepared in the same manner are common. Here, we present data on the measurement of forces between individual pairs of particles over the course of tens of days using a blinking optical tweezer method. Our results show that the variations in the particle properties are indeed caused by a temporal evolution of the particles’ charging. Additional measurements of the influence of tetrabutylammonium bromide (TBAB) addition to the dispersions show that already small concentrations of added TBAB drastically decrease the electrostatic forces between colloidal particles. However, small, non-negligible contact potentials remain even at the highest TBAB concentrations added.
keywords:
colloids, optical tweezers, hard spheres, real space imaging1 Introduction
Apart from their importance in nature and technology, colloidal particles are attractive models for atomic and molecular systems 1. With typical diameters in the micrometer range, they are easily visualized e.g. using confocal fluorescence microscopy 2, 3. In such optical experiments, colloidal particles can be considered as ’big atoms’ that are detectable on an individual particle basis 4. The tracking of thousands of individual particles gives information that is not accessible in atomic or molecular samples 5. A prototypical example for a phenomenon that can be studied in this manner is the glass transition 6.
To use colloids as models in optical microscopy experiments, a number of prerequisites has to be fulfilled. In most cases one needs to simultaneously match the density and the refractive index of the colloidal particles to the dispersion medium used: Density matching has the advantage of reducing the movement of particles due to sedimentation during measurements. Refractive index matching of particles and fluid, by contrast, reduces scattering, thus allowing imaging of the particles deep in the sample, and reduces van der Waals forces between particles. To date, a few combinations of particles and dispersion media are known for which density and refractive index can be matched at the same time 7, 8, 9, 10. A widely used combination consists of sterically stabilized polymethylmetacrylate (PMMA) colloids in a solution of cyclohexylbromide (CHB) and cis-decalin 11, 12, 13, 14, 15, 16, 17. Apart from the two physical properties just discussed, a lot of effort is often taken to prepare particles with hard sphere potentials, i.e. an infinitely high potential for distances smaller than the particle diameter and zero potential everywhere else. Particles of this type are attractive due to their physical simplicity, since for suspensions of particles with perfectly hard potentials, volume fraction is the only parameter controlling structure and dynamics in dense suspensions and no interparticle forces have to be considered in their theoretical description. However, due to charging, colloids don’t possess perfectly hard potentials 18. In addition, strong variations of parameters like Debye lengths, particle potentials, and particle charges are commonly observed even for samples prepared in the same manner 19. Since the electrostatic properties of dispersed colloids are known to be very susceptible to impurities such as ions or glue residues introduced by the sample chamber preparation 20, one usually assumes imperfections in the preparation as causes for the observed variations.
Particles with potentials closely resembling hard spheres can be prepared, when the two main contributions to the potential are screened. These contributions are electrostatic and van der Waals forces. To overcome the attractive forces arising from van der Waals forces, frequently a steric stabilizer consisting of poly(12-hydroxystearic acid) (PHSA) is covalently attached to the particles. While the chains of the stabilizer create a certain softness in the potential, surface force measurements proved that the influence of the stabilizer on the potential is short range and not measurable for distances greater 20 nm away from the particles’ surfaces 21. Thus, especially for spheres with diameters in the range, the stabilizer has only little effect on the hardness of the potential. The main deviation from hard potentials therefore arises from electrostatic forces. Several approaches have been used to gain information on electrostatic particle potentials. Indirect information about the potential between pairs of particles has been obtained in different manners: by comparing the radial distribution function of a particle ensemble with results of its theoretical description or simulation results 22, 23, 24, by measuring the conductivity and mobility with electrophoresis 11, 22, 24, 25, 19, 26, and by examination of the crystallisation behavior of dispersions as a function of volume fraction 27, 28, 11, 23. Direct measurements of interparticle forces are possible using optical tweezers to trap particles while monitoring their interaction via distance measurements. Variations of this approach have been used to study interparticle potentials in a number of different systems 29, 30, 31, 32, 33, 34, 20, 10.
Here, we report quantitative measurements of interparticle forces based on a method known as blinking optical tweezers, first established by Crocker and Grier 35 and later modified by Sainis and coworkers 29. With such an experiment, we deduce interparticle potentials for individual PMMA particle pairs in mixtures of CHB and decalin. To trap PMMA particles in the index matching solvent, we use an approach pioneered by Dullens and coworkers that consists in using core/shell particles with a refractive index matching shell and a higher refractive index core material. The cores can then be trapped by optical tweezers 10. In our case, PMMA colloids containing a polystyrene (PS) core are employed 36. Due to the refractive index mismatch of the core, no labelling of the the particles is necessary and their positions can be tracked with bright-field microscopy. Since the chosen core to shell volume ratio is 1:46, the particles used can be assumed to very closely mimic the behavior of pure PMMA colloids. With this system, we investigate the temporal changes of forces between pairs of colloids over the course of tens of days. While all particles initially are significantly charged, we find that the charging decreases by a factor of three within five days. In order to minimize the effect of charging, organic salts such as tetrabutylammonium chloride (TBAC) or bromide (TBAB) are commonly added to the dispersions 37, 38, 17, 15. This strategy is also employed for other systems similar to PMMA in CHB/decalin 39, 40. We therefore also investigated, how the addition of TBAB to a dispersion of PMMA particles in CHB/decalin affects the interparticle forces and found that already small amounts of TBAB lead to a significant hardening of the particle potentials. Temporal changes of the interparticle forces then become negligible. Yet, even at the highest TBAB concentrations tested, the potentials retained a non-negligible softness.
2 Results and discussion
2.1 Particle Synthesis
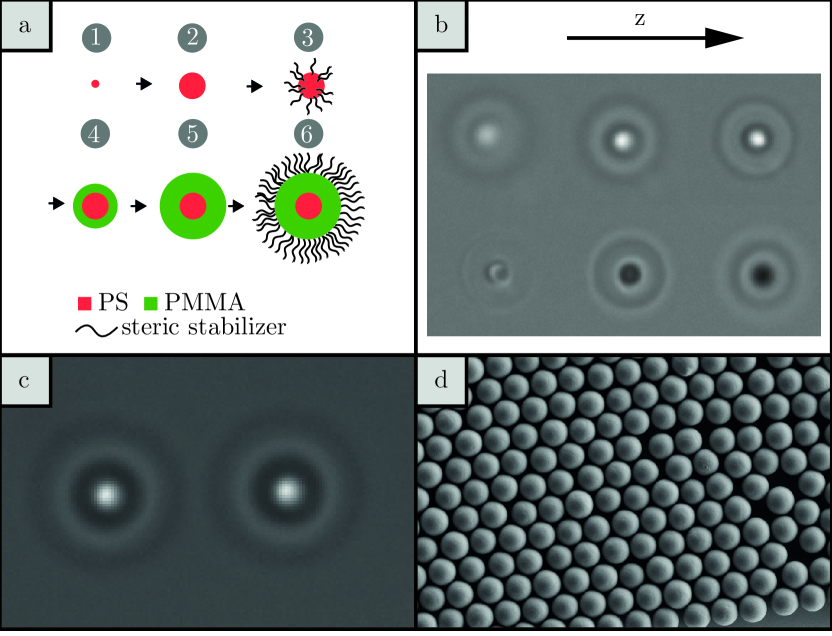
The protocol for the synthesis of the PS/PMMA core/shell particles shown in Fig. 1 was adapted from Klein et al.36. Following this procedure, first PS seed particles with a diameter of 190 nm were synthesized. Their diameter was increased to 600 nm by growing an additional PS layer in an emulsion polymerisation step. To this end, 35 ml doubly distilled water (Carl Roth) and 0.6 ml of the cores suspended in water (solid content 3.4%) were heated to 73∘C under nitrogen in a 100 ml Schlenk flask. Meanwhile, 73 mg of potassium peroxodisulfate (Sigma Life Science) were mixed with 10 ml doubly distilled water and a monomer mixture consisting of 10 g distilled styrene (Merck) and 0.4 g 1,3-diisopropenylbenzene (DIPB, Tokyo Chemical Industries) was prepared. 1 ml of the K2S2O8 mixture was given to the particles. 10 min later the nitrogen flow was stopped and 1.6 ml of the monomer mixture were added with a rate of 0.8 ml/h using a syringe pump. The particles were stirred for another two hours, then cooled down to room temperature, and filtered with glass wool. The same seeded emulsion polymerisation step was repeated with 4 ml of the synthesized particle solution and 32 ml of doubly destilled water to create bigger PS cores with a diameter of 1.5 µm. These were then transferred to n-hexane/dodecane as described by Klein et al. 36. First, the particles were centrifuged and the supernatant was replaced with acetone. We found it necessary to change the duration of the particles being in acetone to at least 12 h. Then the particles were transferred to 19.5 g petroleum ether (PE) (boiling point 90% 40-60∘C, Sigma-Aldrich). 30 drops of the steric stabilizer poly(12-hydroxystearic acid) (PHSA) grafted onto a backbone of PMMA (PHSAgPMMA)41 were added. After 2 min of sonication, the particles were washed three times with PE and sonication in between before transfer to a mixture of n-hexane/dodecane (2:1 (wt%:wt%)) (n-hexane: for HPLC, VWR Chemicals). The particles were again centrifuged and filled up with 1.23 g of the n-hexane/dodecane solution.
With the PS cores as seed, a seeded dispersion polymerization step was used to grow a first PMMA shell resulting in particles with a diameter of 2.8 µm. For this purpose, a monomer mixture consisting of 21.3 ml methyl methacrylat (Sigma-Aldrich), 0.39 ml methacrylic acid (Sigma-Aldrich), 2.5 ml stabilizer, and 20.8 g n-hexane/dodecane mixture was prepared. In a 25 ml Schlenk tube, 39 mg azo-bis-isobutyronitrile (Sigma-Aldrich) and the PS seed particles in n-hexane/dodecane were stirred with 250 rpm with a 1 cm magnetic stirrer bar. 8 l octyl mercaptan (Sigma-Aldrich) were added and the particles were heated to 95∘C. 4.8 g of the monomer mixture were added at a rate of 3 ml/h using a syringe pump. After waiting for 2 h and cooling down to room temperature, the particles were filtered, and washed with PE. After the last centrifugation, the supernatant was removed and the particles were filled up with 2 ml PE. 0.3 ml of the particles were surface smoothed with a mixture of 9.7 g cis/trans-decalin (98%, Carl Roth) and 1.5 g acetone and 2 drops of stabilizer for 40 min 42. It was important to thoroughly mix the smoothing solution before adding the particles. After quenching with 25 ml decalin, the particles were then transferred to pure decalin. 0.29 g (solid weight) of these particles were used again as seed particles for another seeded dispersion polarization leading to particles with a diameter of 5.5 µm. This resulted in 1.6 g of particles. The particles were again smoothed with a mixture of 135 g decalin and 21 g acetone for 1.5 h before transfer to pure decalin. Finally, the particles were sterically stabilized by locking (PHSAgPMMA) covalently onto the particles’ surface. During smoothing, some particles coalesced. These were removed by sedimentation. The final particles had a core diameter of 1.420.08 µm (determined with SEM, 5.4% polydispersity) and a shell diameter of 5.07 µm (determined with SEM, 2.5% polydispersity).
2.2 Sample Preparation
The solvent for the particles was a (85wt%/15wt%) mixture of CHB (98%, Tokyo Chemical Industries) and decalin. We only used CHB from freshly opened bottles, as the ion concentration in CHB is changing over time due to dissociation 43, 44, 34, 20. To avoid contact between particles, the particle concentration was kept smaller than 10 per l, equivalent to a volume fraction of . In some experiments, tetrabutylammonium bromide (TBAB, Sigma-Aldrich) was added to quantify the screening effect of this salt. In these cases, first a 368 M solution of TBAB dissolved in CHB was prepared under constant stirring in nitrogen atmosphere over a minimum of three days. When necessary, this solution was diluted with CHB. Then the CHB/TBAB solution was mixed with decalin containing the particles.
The sample chamber consisted of a glass slide (75 x 25 x 3 mm), with a centered round pit (diameter 8 mm, depth 0.5 mm) on the bottom side. From the other side, an additional small hole (diameter 2.8 mm, depth 2.5 mm) was cut. Before usage, these glass slides and glass coverslips (18 x 18 x 0.17 mm, Marienfeld) were washed for an hour in an ultrasonic bath set to 45°C first with doubly distilled water and then for another hour in ethanol (for spectroscopy, Uvasol® Supelco®) before drying in a nitrogen flow. Care was taken to touch the glasses only with clean tweezers. The bottom whole was covered with a coverslip and the edges were sealed with an epoxy resin (UHU Plus Sofortfest). As the resin is known to influence the interparticle potential when not properly hardened 20, we waited at least 12 h before filling in the sample liquid. After the liquid was inserted with a glass pipette, another glass coverslip was put on the top hole and sealed with epoxy resin. To avoid contact of the soft resin with the sample liquid, we waited for another 12 h before moving the sample chamber.
2.3 Experimental Setup and Raw Data Processing
The experimental setup consists of a diode laser (P=250 mW, nm, FPL785S250, Thorlabs). The laser beam is directed over a spatial light modulator (SLM, X10468, Hamamatsu) and coupled via relay optics into a microscope (DMI 6000B, Leica). Phase masks were sent to the SLM to form two optical traps in the sample. Interparticle forces were deduced with a well-established method 29. In brief, two particles were trapped and released periodically at initial distances between the particle centers. The laserdiode was switched on and off by a program every 500 ms. The off-times were 100 ms. During the time the traps were switched off, images were taken with an exposure time of 250 µs at a rate of 1000 fps using a CMOS camera (mvBlueFOX3-2 2004 C, Matrix Vision). Pixel sizes in the image plane were 115.5 nm x 115.5 nm. The free diffusing particles were recorded for 100 frames and from the resulting images, two dimensional trajectories and were generated. Typically, the statistics of a single force curve is based on more than measurements.
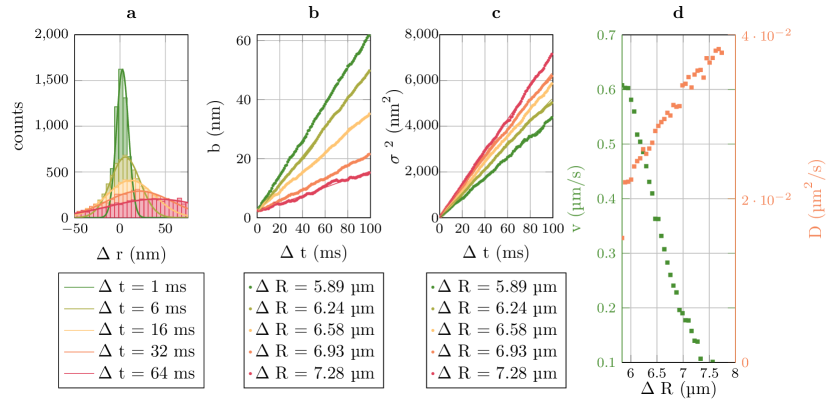
To outline the data processing, exemplary data from samples without added TBAB are depicted in Fig. 2. Fig. 2a shows the measured distance distribution of for several time intervals . These curves are fitted with a Gaussian distribution function . The parameters and are linearly dependent on (Figure 2b and Figure 2c). A linear fit yields and (Figure 2d). With these parameters the forces are calculated using 29
The particles were slightly defocused during the measurements. This facilitates the fitting of the observed two dimensional intensity distribution using Gaussian functions (see Figure 1 b and c). In this manner, particle positions could be determined with subpixel precision. As the distance between measurement spot and glass surface might have an influence on the measured the potentials 22, all data were acquired at depths 100 µm above the lower glass coverslip surface.
2.4 Results
2.4.1 Temporal evolution of interparticle forces
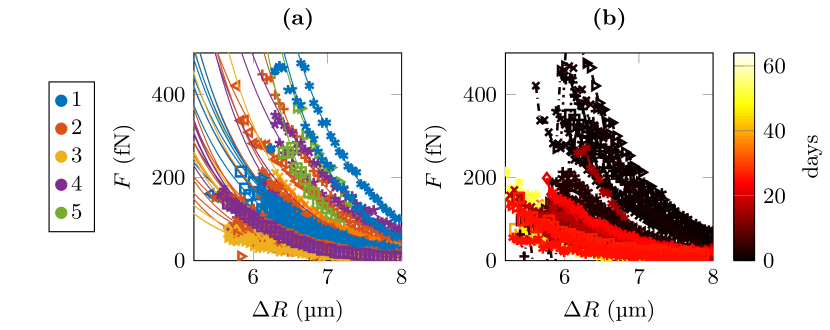
In a first series of experiments, we investigated samples of PMMA particles in CHB/decalin without added TBAB. Fig. 3a shows all data recorded from different sample chambers plotted together. Since the force data are expected to be highly susceptible to impurities introduced during sample preparation, especially ions and glue residues in the sample fluid, we wondered whether the strong variations in the determined force curves reflected the purity of the samples. This reasoning was motivated by a previous report of similar variations in parameters like Debye lengths and effective charges for different samples despite their careful preparation 19. Sorting of the same data as a function of time after sample preparation, however, shows that the observed variations are not caused by irregularities in the sample preparation, but are rather much due to a change of the samples as a function of time after preparation (cf. Fig. 3b).
This observation prompted us to analyze the data for a long series of experiments on one sample chamber in greater detail (Fig. 4). All the force measured in our experiments are well described by a screened Coulomb force 29
| (1) |
where is the elementary charge, is the surface potential, is the particle radius, is the Bjerrum length, and is the Debye screening length. The solid lines shown in the force data are fits with Eq. (1), where and are fitting parameters. To account for particle polydispersity, the particle radius , by contrast, was determined from bright-field microscopy. This was done by focusing the particles such that their outer rims became slightly visible. Knowing the Debye length and the surface potential , an apparent surface charge can be calculated 22
| (2) |
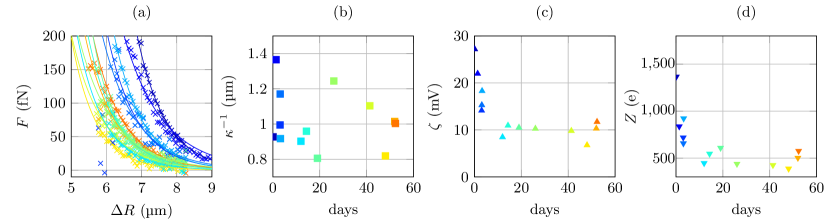
Our data show that the interaction between the colloids stabilizes roughly five days after sample preparation. The values for the determined Debye lengths are scattered between 0.8 and 1.4 , but show no trend in their temporal evolution. This means that the ion concentration in the dispersion fluid hardly changes with time. potentials and, as a result also the apparent surface charges Z of the colloids, by contrast, clearly show a rapid decay immediately after sample preparation, before settling at constant values of approximately one third of their starting values after five days. The plateau values of the surface charges Z are on the order of 500 elementary charges.
It has been postulated that the charging of colloidal particles in CHB could be due to its dissociation and slightly preferential adsorption of protons 19, 20. Our method does not allow us to draw conclusions about the sign of the charges on the colloids, as appears quadratically in Eq. 1. However, we can infer from the stable observed Debye lengths that in the samples investigated, no significant decomposition of CHB took place after their preparation. This does not exclude the possibility that a certain number of ions present in the CHB before filling the sample chambers is adsorbed by the particles. Also in this case, the degree of CHB dissociation must, however, be very small, since the dispersion contains only few particles that are able to adsorb the ions. A second and perhaps most likely possibility is that the colloids get charged during the filling procedure of the sample chambers. This charge would then be redistributed in the dispersion over the course of several days before reaching an equilibrium. The values for the various parameters that we determine after this equilibration process coincide well with earlier measurements of PMMA particles in CHB/cis-decalin. Using microelectrophoresis, van der Linden and coworkers were able to determine apparent surface charges between 456 and 1015 elementary charges for slightly smaller particles with a diameter of 1.98 19. Also there, strong variations in parameters like the apparent surface charge were reported in different samples despite identical preparation protocols. It is not known, whether also in their case differences in the sample preparation times account for this behavior. One should note, however, that the authors assumed a Debye length of , significantly larger than our and other previously reported values for the same system 45, 23.
2.4.2 Influence of TBAB addition on interparticle forces
As has been pointed out above, a common procedure to reach hard potentials in colloidal dispersions is to screen particle charges by the addition of salt. In organic dispersion media such as decalin used here, often TBAC or TBAB are employed11. We therefore also investigated the effect of TBAB on the forces between PMMA dispersed in CHB/decalin.
Measurements for four different TBAB concentrations (0 µmol, 92 µmol, 184 µmol and 368 µmol) are shown in Figure 5. As discussed above, samples without added TBAB needed roughly five days to show a stable behaviour, therefore only measurements that were taken more than one week after filling are shown in Figure 5. For each concentration, data for several colloid pairs were collected and each measurement shown is from a different particle pair. In the same sample cell, small differences between particle pairs are commonly observed. These can be explained by the polydispersity of the particles and by the previously observed phenomenon of fluctuating charges on colloids 46, 47, 48. In addition, variations in particle charges could also result from different degrees of the covalent binding of the steric stabilizer, that is known to strongly influence the surface charge 19.
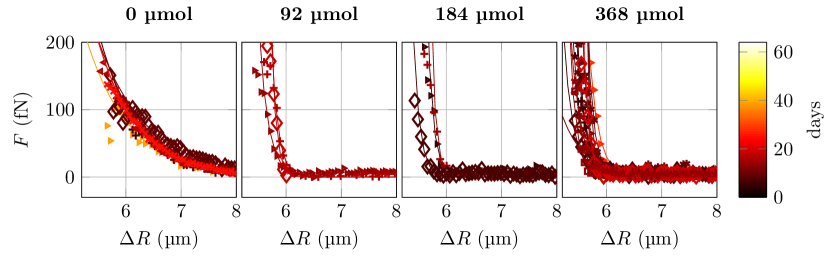
The measured force curves show no sign of an attractive potential. This is expected due to the fact that firstly, the steric stabilisation of the PMMA particles reduces van der Waals forces and secondly, because our spatial resolution of 50 nm in is too small to observe the latter. The expected screening effect when adding TBAB is clearly visible from the shape of the force curves. Again, we determine values for the Debye lengths , for potentials, and for apparent surface charges Z as described above. These values are collected in table 1.
| (µ mol) | (mV) | () | (µm) | () | |
|---|---|---|---|---|---|
| 0 | 28 | 527 | 29.6 | ||
| 92 | 3 | 1541 | 0.13 | 6.0 | |
| 184 | 3 | 2.4 | 902 | 1.5 | |
| 368 | 13 | 460 | 0.16 | 1.0 | |
The determined values indicate a clear change in the Debye length already when adding small concentrations of TBAB. Remarkably, the Debye length is roughly the same for all TBAB concentrations different from zero. This leads us to the conclusion, that above a concentration of 92 µmol TBAB, the free charge concentration in the sample liquid does not change much anymore, as the Debye length directly correlates with the number of free charges in the dispersion fluid. For µmol, the value of µm is in the same range as the value of 1.4 µm for dilute systems found by Royall and coworkers 23, but differs from µm published earlier 11. The results also agree well with the findings of Ref. 49, where µm was determined for µmol and µm for µmol in a system of 2.8 µm sized PMMA particles in CHB/cis-decalin. Similarly Leunissen and colleagues found nm for =190 µmol 45.
The potentials that we observed, decrease with higher TBAB concentrations. As expected, this means that the potential is getting harder even for larger concentrations , as for an ideal step function there should be a surface potential of zero. Also the apparent surface potential , which can be calculated from the integral of Eq. 1, shows a decrease from 29.6 with no added TBAB to 1.0 with 368 µmol. These values are in good agreement with the results from Yethiraj and coworkers 11, where crystallisation at a concentration of µmol was observed to occur at a volume fraction 0.42-0.45, indicating hard sphere like behaviour.
As pointed out, it is not possible for us to determine the sign of . Previous electrophoretic mobility measurements showed a change from positive to negative potentials of the particles, when the TBAB concentration was added 12, 50, 25. We therefore assume that also in our case, the particle’s potentials changed from being positive without added TBAB to being negative for higher concentrations of TBAB. This means that we do not expect to observe a monotonous decrease of as observed by Kim et al. 25. The absolute average charge has its maximum value of 1541 elementary charges at µmol. Since the apparent surface charge is itself linearly dependent on , the sign of which cannot be determined with our method, also the sign of remains unknown. Our values for Z compare well with experimental data reported earlier such as in CHB/decalin (27 wt%) for 2.8 µm PMMA spheres 49.
From the data depicted in Fig. 5 it is obvious that the effects from the addition of TBAB are so strong that in this case and in contrast to the samples made from pure CHB/decalin, no temporal evolution of the particle interaction is detected. This can be rationalized by the large number of ions present in the dispersion fluid after TBAB addition that overwhelms any small changes due to charge exchange between particles and fluid.
3 Conclusion
In this work, we report measurements of forces between individual pairs of PMMA particles dispersed in decalin. To measure these forces directly, we employed a variant of the blinking tweezer method 29. The forces that we determine agree well with previously published data. As has been reported before by van der Linden and coworkers 19, we also find, however, that the observed interparticle forces varied strongly. Using measurement series extending over tens of days, we could show that the variations are not due to impurities introduced during sample preparation, but to the temporal evolution of the particle charging. Since we found no concomitant temporal change of the Debye lengths, we assume that the charging of the particles is not caused by dissociation of CHB, but by the filling procedure. Quantitative measurements of the effect of the addition of TBAB to the dispersion as a screening agent shows that this increased the hardness of the particle potential. Already small amounts of TBAB lead to a large effect. In this case no temporal change of the interparticle forces was detected. However, even after TBAB addition, the particle potentials are not perfectly hard, as the contact potential even at the highest TBAB concentration was found to be approximately 1 .
Acknowledgments
The authors thank Franziska Rabold and John Geiger for help with the particle synthesis. This work was funded by the Deutsche Forschungsgemeinschaft (DFG) as SFB 1432, project C07.
References
- Manoharan 2015 Manoharan, V. N. Colloidal matter: Packing, geometry, and entropy. Science 2015, 349
- van Blaaderen and Wiltzius 1995 van Blaaderen, A.; Wiltzius, P. Real-Space Structure of Colloidal Hard-Sphere Glasses. Science 1995, 270, 1177–1179
- Crocker and Grier 1996 Crocker, J. C.; Grier, D. G. Methods of digital video microscopy for colloidal studies. J. Colloid Interface Sci. 1996, 179, 298–310
- Poon 2004 Poon, W. Colloids as big atoms. Science 2004, 304, 830–831
- Weeks et al. 2000 Weeks, E. R.; Crocker, J. C.; Levitt, A. C.; Schofield, A.; Weitz, D. A. Three-dimensional direct imaging of structural relaxation near the colloidal glass transition. Science 2000, 287, 627–631
- Weeks 2017 Weeks, E. R. Introduction to the Colloidal Glass Transition. ACS Macro Letters 2017, 6, 27–34
- Wiederseiner et al. 2011 Wiederseiner, S.; Andreini, N.; Epely-Chauvin, G.; Ancey, C. Refractive-index and density matching in concentrated particle suspensions: a review. Exp. Fluids 2011, 50, 1183–1206
- Kodger et al. 2015 Kodger, T.; Guerra, R. E.; Sprakel, J. Precise colloids with tunable interactions for confocal microscopy. Sci. Rep. 2015, 5, 14635–14645
- Park et al. 2018 Park, N.; Umanzor, E. J.; Conrad, J. C. Aqueous Colloid and Polymer Depletion System for Confocal Microscopy and Rheology. Front. Phys. 2018, 6, 42
- Liu et al. 2019 Liu, Y.; Yanagishima, T.; Curran, A.; Edmond, K. V.; Sacanna, S.; Dullens, R. P. A. Colloidal Organosilica Spheres for Three-Dimensional Confocal Microscopy. Langmuir 2019, 35, 7962–7969
- A.Yethiray and A.van Blaaderen 2003 A.Yethiray; A.van Blaaderen A colloidal model system with an interaction tunable from hard sphere to soft and dipolar. Nature 2003, 421, 513–517
- Royall et al. 2003 Royall, C. P.; Leunissen, M. E.; van Blaaderen, A. A new colloidal model system to study long-range interactions quantitatively in real space. J. Phys.: Cond. Matt. 2003, 15, S3581–S3596
- Kaufman and Weitz 2006 Kaufman, L. J.; Weitz, D. A. Direct imaging of repulsive and attractive colloidal glasses. J. Chem. Phys. 2006, 125, 074716
- Edmond et al. 2012 Edmond, K. V.; Elsesser, M. T.; Hunter, G. L.; Pine, D. J.; Weeks, E. R. Decoupling of rotational and translational diffusion in supercooled colloidal fluids. Proc. Natl. Acad. Sci. USA 2012, 109, 17891–17896
- Besseling et al. 2012 Besseling, T. H.; Hermes, M.; Fortini, A.; Dijkstra, M.; Imhof, A.; van Blaaderen, A. Oscillatory shear-induced 3D crystalline order in colloidal hard-sphere fluids. Soft Matter 2012, 8, 6931–6939
- Wood et al. 2018 Wood, N.; Russo, J.; Turci, F.; Royall, C. P. Coupling of sedimentation and liquid structure: Influence on hard sphere nucleation. J. Chem. Phys. 2018, 149, 204506
- Roller et al. 2021 Roller, J.; Laganapan, A.; Meijer, J.-M.; Fuchs, M.; Zumbusch, A. Observation of liquid glass in suspensions of ellipsoidal colloids. Proc. Natl. Acad. Sci. USA 2021, 118
- Royall et al. 2013 Royall, C. P.; Poon, W. C. K.; Weeks, E. R. In search of colloidal hard spheres. Soft Matter 2013, 9, 17–27
- van der Linden et al. 2015 van der Linden, M. N.; Stiefelhagen, J. C. P.; Heessels-Gürboğa, G.; van der Hoeven, J. E. S.; Elbers, N. A.; Dijkstra, M.; van Blaaderen, A. Charging of poly(methyl methacrylate) (PMMA) colloids in cyclohexyl bromide: locking, size dependence, and particle mixtures. Langmuir 2015, 31, 65–75
- Choi et al. 2019 Choi, K. H.; Kang, D. W.; Kim, K. H.; Kim, J.; Lee, Y.; Im, S. H.; Park, B. J. Direct measurement of electrostatic interactions between poly(methyl methacrylate) microspheres with optical laser tweezers. Soft Matter 2019, 15, 8051–8058
- Bryant et al. 2002 Bryant, G.; Williams, S. R.; Qian, L.; Snook, I. K.; Perez, E.; Pincet, F. How hard is a colloidal “hard-sphere” interaction? Phys. Rev. E 2002, 66, 060501
- Hsu et al. 2005 Hsu, M. F.; Dufresne, E. R.; Weitz, D. A. Charge Stabilization in Nonpolar Solvents. Langmuir 2005, 21, 4881–4887
- Royall et al. 2006 Royall, C. P.; Leunissen, M. E.; Hynninen, A.-P.; Dijkstra, M.; van Blaaderen, A. Re-entrant melting and freezing in a model system of charged colloids. J. Chem. Phys. 2006, 124, 244706
- Espinosa et al. 2010 Espinosa, C. E.; Guo, Q.; Singh, V.; Behrens, S. H. Particle Charging and Charge Screening in Nonpolar Dispersions with Nonionic Surfactants. Langmuir 2010, 26, 16941–16948
- Kim et al. 2014 Kim, Y.; A.Shah, A.; Solomon, M. Spatially and temporally reconfigurable assembly of colloidal crystals. Nat. Comm. 2014, 5, 3676
- Farrokhbin et al. 2019 Farrokhbin, M.; Stojimirović, B.; Galli, M.; Khajeh Aminian, M.; Hallez, Y.; Trefalt, G. Surfactant mediated particle aggregation in nonpolar solvents. Phys. Chem. Chem. Phys. 2019, 21, 18866–18876
- Pusey and van Megen 1986 Pusey, P. N.; van Megen, W. Phase behaviour of concentrated suspensions of nearly hard colloidal spheres. Nature 1986, 320, 340–342
- Dinsmore et al. 2001 Dinsmore, A. D.; Weeks, E. R.; Prasad, V.; Levitt, A. C.; Weitz, D. A. Three-dimensional confocal microscopy of colloids. Appl. Opt. 2001, 40, 4152–4159
- Sainis et al. 2007 Sainis, S. K.; Germain, V.; Dufresne, E. R. Statistics of particle trajectories at short time intervals reveal fN-scale colloidal forces. Phys. Rev. Lett. 2007, 99, 018303
- Sainis et al. 2008 Sainis, S. K.; Germain, V.; Mejean, C. O.; Dufresne, E. R. Electrostatic Interactions of Colloidal Particles in Nonpolar Solvents: Role of Surface Chemistry and Charge Control Agents. Langmuir 2008, 24, 1160–1164
- Sainis et al. 2008 Sainis, S. K.; Germain, V.; Mejean, C. O.; Dufresne, E. R. Electrostatic Interactions of Colloidal Particles in Nonpolar Solvents: Role of Surface Chemistry and Charge Control Agents. Langmuir 2008, 24, 1160–1164
- Gutsche et al. 2011 Gutsche, C. et al. Micro-rheology on (polymer-grafted) colloids using optical tweezers. J. Phys.: Cond. Matt. 2011, 23, 184114
- El Masri et al. 2011 El Masri, D.; van Oostrum, P.; Smallenburg, F.; Vissers, T.; Imhof, A.; Dijkstra, M.; van Blaaderen, A. Measuring colloidal forces from particle position deviations inside an optical trap. Soft Matter 2011, 7, 3462–3466
- Evans et al. 2016 Evans, D. J.; Hollingsworth, A. D.; Grier, D. G. Charge renormalization in nominally apolar colloidal dispersions. Phys. Rev. E 2016, 93, 042612
- Crocker and Grier 1994 Crocker, J. C.; Grier, D. G. Microscopic measurement of the pair interaction potential of charge-stabilized colloid. Phys. Rev. Lett. 1994, 73, 352–355
- Klein et al. 2014 Klein, M. K.; Saenger, N. R.; Schuetter, S.; Pfleiderer, P.; Zumbusch, A. Shape-Tunable Core–Shell Microparticles. Langmuir 2014, 30, 12457–12464
- Wu et al. 2009 Wu, Y. L.; Derks, D.; van Blaaderen, A.; Imhof, A. Melting and crystallization of colloidal hard-sphere suspensions under shear. Proc. Natl. Acad. Sci. USA 2009, 106, 10564–10569
- Roller et al. 2020 Roller, J.; Geiger, J. D.; Voggenreiter, M.; Meijer, J.-M.; Zumbusch, A. Formation of nematic order in 3D systems of hard colloidal ellipsoids. Soft Matter 2020, 16, 1021–1028
- El Masri et al. 2012 El Masri, D.; Vissers, T.; Badaire, S.; Stiefelhagen, J. C. P.; Vutukuri, H. R.; Helfferich, P.; Zhang, T. H.; Kegel, W. K.; Imhof, A.; van Blaaderen, A. A qualitative confocal microscopy study on a range of colloidal processes by simulating microgravity conditions through slow rotations. Soft Matter 2012, 8, 6979–6990
- Zargar et al. 2013 Zargar, R.; Nienhuis, B.; Schall, P.; Bonn, D. Direct Measurement of the Free Energy of Aging Hard Sphere Colloidal Glasses. Phys. Rev. Lett. 2013, 110, 258301
- Elsesser and Hollingsworth 2010 Elsesser, M. T.; Hollingsworth, A. D. Revisiting the Synthesis of a Well-Known Comb-Graft Copolymer Stabilizer and Its Application to the Dispersion Polymerization of Poly(methyl methacrylate) in Organic Media. Langmuir 2010, 26, 17989–17996
- Schütter et al. 2017 Schütter, S.; Roller, J.; Kick, A.; Meijer, J.-M.; Zumbusch, A. Real-space imaging of translational and rotational dynamics of hard spheres from the fluid to the crystal. Soft Matter 2017, 13, 8240–8249
- Green and Maccoll 1955 Green, J. H. S.; Maccoll, A. Studies in the pyrolysis of organic bromides. Part V. The pyrolysis of cyclohexyl bromide. J. Chem. Soc. 1955, 2449–2454
- Golinkin et al. 1970 Golinkin, H. S.; Parbhoo, D. M.; Robertson, R. E. Solvation differences in the hydrolysis of certain alicyclic bromides. Can. J. Chem. 1970, 48, 1296–1301
- Leunissen et al. 2005 Leunissen, M. E.; Christova, C. G.; Hynninen, A.-P.; Royall, C. P.; Campbell, A. I.; Imhof, A.; Dijkstra, M.; van Roij, R.; van Blaaderen, A. Ionic colloidal crystals of oppositely charged particles. Nature 2005, 437, 235
- Strubbe et al. 2006 Strubbe, F.; Beunis, F.; Neyts, K. Determination of the effective charge of individual colloidal particles. J. Colloid and Interface Sci. 2006, 301, 302–309
- Strubbe et al. 2008 Strubbe, F.; Beunis, F.; Neyts, K. Detection of Elementary Charges on Colloidal Particles. Phys. Rev. Lett. 2008, 100, 218301
- Schreuer et al. 2018 Schreuer, C.; Vandewiele, S.; Brans, T.; Strubbe, F.; Neyts, K.; Beunis, F. Single charging events on colloidal particles in a nonpolar liquid with surfactant. J. Appl. Phys. 2018, 123, 015105
- Elbers et al. 2016 Elbers, N. A.; van der Hoeven, J. E. S.; de Winter, D. A. M.; Schneijdenberg, C. T. W. M.; van der Linden, M. N.; Filion, L.; van Blaaderen, A. Repulsive van der Waals forces enable Pickering emulsions with non-touching colloids. Soft Matter 2016, 12, 7265–7272
- Leunissen et al. 2007 Leunissen, M. E.; Zwanikken, J.; van Roij, R.; Chaikin, P. M.; van Blaaderen, A. Ion partitioning at the oil–water interface as a source of tunable electrostatic effects in emulsions with colloids. Phys. Chem. Chem. Phys. 2007, 9, 6405–6414