Current address: ]Commonwealth Fusion Systems, Devens, MA 01434, USA
Plasmoid formation and strong radiative cooling in a driven magnetic reconnection experiment
Abstract
We present results from the first experimental study of strongly radiatively-cooled magnetic reconnection. Two exploding aluminum wire arrays, driven simultaneously by the Z machine (, ), generate a radiatively-cooled reconnection layer () in which the total cooling rate exceeds the hydrodynamic transit rate (). Measurements of X-ray emission from the reconnection layer using a filtered diode ( keV) show a narrow (50 ns FWHM) burst of emission at after current start, consistent with the formation and subsequent rapid cooling of the reconnection layer. Time-gated X-ray images of the reconnection layer show fast-moving (up to 50 km/s) hotspots inside the layer, consistent with the presence of plasmoids observed in 3D resistive magnetohydrodynamic simulations. X-ray spectroscopy shows that these hotspots generate the majority of Al K-shell emission (at around 1.6 keV) prior to the onset of cooling, and exhibit temperatures of , much greater than the temperature of the plasma inflows and the rest of the reconnection layer.
Magnetic reconnection is a ubiquitous process in magnetized plasmas, responsible for the explosive conversion of magnetic energy into heat and kinetic energy Parker [1957]; Yamada et al. [2010]; Ji et al. [2022]. In extreme high-energy-density (HED) astrophysical systems, such as black hole accretion disks and their coronae Goodman and Uzdensky [2008]; Beloborodov [2017]; Werner et al. [2019]; Mehlhaff et al. [2021], pulsar magnetospheres Lyubarsky and Kirk [2001]; Uzdensky and Spitkovsky [2014]; Cerutti et al. [2015]; Schoeffler et al. [2019], and gamma-ray bursts Spruit et al. [2001]; Uzdensky and MacFadyen [2007]; Giannios [2008]; Uzdensky [2011]; McKinney and Uzdensky [2012], strong radiative cooling (e.g. inverse external Compton or synchrotron cooling) modifies the energy balance, by removing internal energy faster than it is injected into the reconnection layer Uzdensky and McKinney [2011]; Uzdensky [2011, 2016]. This can trigger the radiative collapse of the layer — a runaway cooling and compression process — which generates a cold, thin, and dense current sheet, that is theoretically predicted to increase the reconnection rate Dorman and Kulsrud [1995]; Uzdensky and McKinney [2011].
Despite the importance of radiative cooling in astrophysical systems, there has been limited investigation of radiatively-cooled reconnection in laboratory plasmas, as it is difficult to achieve the cooling rates necessary to observe significant cooling on experimental time scales. Previous experiments on magnetically-driven devices, such as MRX Yamada et al. [1997, 2010], have provided valuable insight into reconnection physics in a low-density regime where radiative cooling is negligible, including evidence for Sweet-Parker reconnection Yamada et al. [1997]; Ji et al. [1999], strong ion heating Hsu et al. [2000], and the Hall effect Ren et al. [2005]. In contrast, laser-driven experiments operate in a strongly-driven HED regime Rosenberg et al. [2015], and have provided evidence for two-fluid effects, magnetic flux pile-up, and particle acceleration Rosenberg et al. [2015]; Nilson et al. [2006]; Li et al. [2007]; Fiksel et al. [2014]; Chien et al. [2023]. Despite the high densities and temperatures in these laser-driven experiments, the cooling parameter was small, as the plasma ions in the reconnection layer have no bound electrons at these high temperatures Fox et al. [2012]; Fiksel et al. [2014], limiting cooling by line emission. A third type of reconnection experiment, driven by pulsed-power-driven, provide access to reconnection in a strongly-driven HED regime Lebedev et al. [2019]. Experiments on the MAGPIE facility drove a current pulse through a dual exploding wire array Suttle et al. [2016]; Hare et al. [2018]; Lebedev et al. [2019], and either observed plasmoid formation with minimal cooling at higher Lundquist numbers Hare et al. [2017a], or evidence for sudden cooling of the ions at a lower Suttle et al. [2018].
In this Letter, we present results from the Magnetic Reconnection on Z (MARZ) experiments, which generate a radiatively-cooled reconnection layer by driving a dual exploding wire array using the Z machine (20 MA, 300 ns rise time, Sandia National Labs) Sinars et al. [2020]. In contrast to previous pulsed-power experiments, the MARZ experiments demonstrate both a high and a high cooling parameter (). We make the first quantitative measurements of reconnection in a strongly radiatively-cooled regime, using temporally- and spatially-resolved X-ray diagnostics to measure emission from the reconnection layer. This is of particular astrophysical significance, as radiative emission is the key, and often only, signature of reconnection in extreme astrophysical objects Uzdensky [2011]. We observe the formation and subsequent radiative cooling of the reconnection layer. Furthermore, the layer exhibits sub-millimeter-scale fast-moving hotspots that emit most of the high-energy X-rays from the layer. Radiative resistive magnetohydrodynamic (MHD) simulations of the experiment Datta et al. [2024] show that these hotspots are likely to be plasmoids generated by the tearing instability Uzdensky et al. [2010]. These simulations are performed in GORGON — an Eulerian resistive MHD code with van Leer advection Ciardi et al. [2007] — which implements multi-group radiation transport, using spectral emissivity and opacity data from SpK Crilly et al. [2023]. Simulation details are provided in Ref. Datta et al. [2024].

Fig. 1a shows the experimental setup. The load comprises two tall, diameter exploding wire arrays, each with 150 equally-spaced diameter aluminum wires. The arrays have a center-to-center separation, with a gap between the mid-plane and the wires. Each array generates radially diverging plasma flows with azimuthally-oriented frozen-in magnetic field that is advected with the flow Suttle et al. [2016, 2018]; Hare et al. [2017a, b, 2018]. The outflows collide at the mid-plane, where the anti-parallel magnetic field lines generate a reconnection layer. The arrays are driven in parallel by the Z machine; Fig. 1b shows the current measured by a b-dot probe near the load Webb et al. [2023], which is well approximated by . Photon Doppler velocimetry Porwitzky and Brown [2018] measured equal division of current between the arrays across multiple shots. The arrays are over-massed, so they generate continuous plasma flows throughout the experiment without exploding Harvey-Thompson et al. [2009]; Datta et al. [2023a]. The plasma flows are highly-collisional (), strongly-driven (, ), and quasi-2D with minimal variation in the direction. There is no guide field, and the ion skin depth () is small compared to the width of the reconnection layer ().
We use inductive probes and visible spectroscopy to characterize the magnetic field, ion density, and electron temperature in the outflows from the arrays, which form the inflows into the reconnection layer. The inductive probes Byvank et al. [2017] are positioned at different radii ( and ) around the arrays (see Fig. 1a). Opposite-polarity probe pairs with a vertical separation are used at each location for redundancy and to check for the influence of the common mode Datta et al. [2022a, b]. The probes are calibrated, and the magnetic field is determined by numerically integrating the signals. The magnetic fields measured by probes at and from the wires (see Fig. 1b) are similar in shape, but displaced in time, consistent with the advection of the field between the probes at a flow velocity of Datta et al. [2022a].
We use an optical fiber to collect visible radiation from the plasma along a path (diameter ) in the plane, centered from the wires, to a spectrometer ( range, resolution) coupled to a streak camera ( sweep time, resolution) Schaeuble et al. [2021]. The spectra show Al-II (Mg-like) and Al-III (Na-like) emission lines. We infer density from the width of the well-isolated Al-II line, and temperature from the line ratio of the inter-stage Al-II and Al-III (, ) lines. This is done by fitting synthetic spectra, generated using PrismSPECT and radiation transport simulations, to the experimental data Datta et al. [2023b]. The electron temperature in the outflows from the arrays increases from to between , and the ion density is .
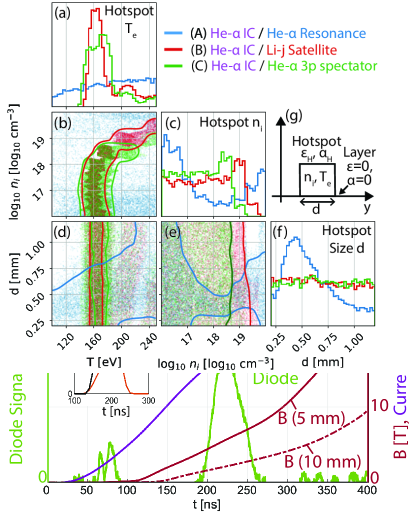
A filtered X-ray diode viewing the reconnection layer from the top (vertical green arrow in Fig. 1a) provides time-resolved measurements of the emitted X-ray power. The beryllium filter transmits photons with energy . X-ray emission from the reconnection layer (green curve in Fig. 1b) exhibits a sharp peak at , with a full-width-at-half-maximum of about . The signal is reproducible over multiple shots and viewing angles. The X-ray emission is narrower than the driving current pulse, and reaches a maximum well before peak current, indicating that this feature is driven by the dynamics of the reconnection layer, rather than the driving current.
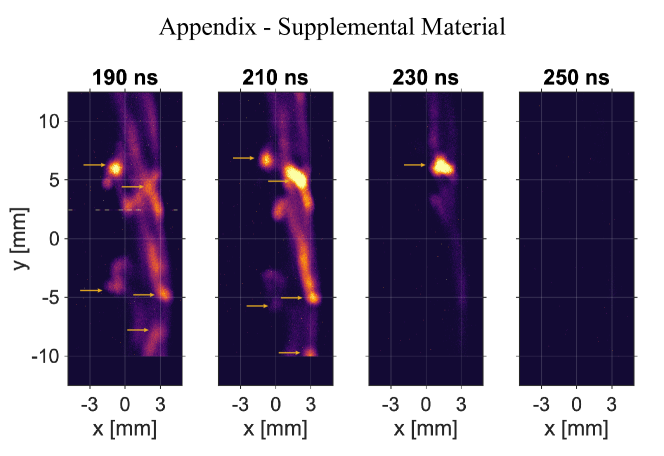
We probe the temporal evolution of the reconnection layer with two ultra-fast X-ray imaging pinhole cameras Claus et al. [2015]. The cameras (4 frames, exposure) provide a field of view through a diameter pinhole (magnification = , geometric resolution ), filtered with -thick aluminized mylar ( photons). The cameras view the reconnection layer with polar angles of and respectively, and with azimuthal angles (from the axis) of and , thus viewing both the top and side of the layer (see Fig. 1a). Figs. 2 (a-c) show an elongated, bright layer with strongly-emitting, localized ( size) hotspots (indicated by green arrows) between . The intensity of the emission initially increases, reaching a maximum at , and then decreases. Fig. 2 shows images from only one camera (); images from the second camera, containing similar features, are in the supplementary material. The hotspots move along the -direction, away from the center of the layer. From the translation of the hotspots between , we estimate their velocity (Fig. 2e), which shows acceleration from rest to over . We show later that this is consistent with the expected and simulated outflow velocity from the reconnection layer.

An X-ray spectrometer with a spherically-bent crystal Harding et al. [2015] provides time-integrated spatially-resolved (along , resolution: ) spectral measurements (resolution: eV) of X-ray emission from the reconnection layer (see Fig. 1a). Fig. 3a shows the X-ray spectrum, which exhibits He-like and Li-like satellite Al K-shell transitions with energies of about 1.6 keV. These transitions are labeled in Fig. 3b, which shows a lineout of the recorded spectrum averaged over . Here, we show the X-ray spectrum from the same experimental shot as the diode signal and X-ray images; however, this spectrum is reproducible across multiple shots. Although the spectrum is time-integrated, the filtered X-ray diode ( Be, keV) localizes the spectra in time to .
| ] | [eV] | [T] | p [MPa] | [km/s] | [mm] | [ns] | ||||||
|---|---|---|---|---|---|---|---|---|---|---|---|---|
| Pre-shock Inflow | 0.8 | 1.9 | 2 | 3.9 | 0.7 | 140 | - | 20 | 5 | 0.7 | - | 2 |
| Post-shock Inflow | 6 | 30 | 8 | 30 | 300 | 20 | - | 50 | 30 | 0.1 | - | 1 |
| Reconnection Layer | 6 | 60 | 10 | - | 700 | - | 72 | - | 50 | 0.1 | 120 | 1 |
Combining the spatial, temporal, and spectral measurements of the X-ray emission provides information about the evolution of the reconnection layer. The narrow burst of X-ray emission from the reconnection layer, as recorded simultaneously by the diode (Fig. 1b) and X-ray cameras (Fig. 2), provides evidence for formation and radiative cooling of the layer. The initial rise of the diode signal indicates increasing density and/or temperature of the layer during the formation stage. The layer temperature is initially hot enough to generate emission. The sharp fall in the X-ray emission after is consistent with a rapidly cooling reconnection layer. X-ray images of the layer exhibit a similar intensity evolution as the diode, with a maximum intensity around (Fig. 2). Resistive MHD simulations confirm that X-ray emission from the reconnection layer provides a diagnostic signature of strong radiative cooling Datta et al. [2024]: in the absence of radiative cooling, simulations show that X-ray emission would continue to rise due to increasing layer density at a constant, high temperature, as shown by the black curve in the inset of Fig. 1b. However, radiative cooling results in a sharp decline in the simulated X-ray emission after an initial rise (orange curve, Fig. 1b), similar to the experimentally-measured emission.
To obtain quantitative measurements of temperature and density in the reconnection layer from the X-ray spectra in Fig. 3 during the onset of radiative cooling, we use non-local thermodynamic equilibrium spectral emissivity and absorption opacity tables generated using SCRAM Hansen et al. [2007] to solve the radiation transport equation Drake [2013] along the diagnostic line-of-sight. SCRAM includes spectral line broadening effects, and incorporates photo-pumping by assuming cylindrical geometry with diameter of . These radiation transport calculations constrain the composition of the emitting plasma: because of the higher opacity of the He- resonance transition compared to the other lines in Fig. 3b, it is strongly damped in homogeneous layers of length . Therefore, only sub-millimeter-sized hotspots, strongly emitting in the Al K-shell, can account for the similar measured intensities of the He- resonance and inter-combination (IC) lines. The experimental spectrum is best matched by the emission from localized, dense hotspots of size and , embedded within a colder, less dense reconnection layer. An example spectrum calculated assuming emission from a single hotspot of size , temperature , and ion density in a non-emitting () non-absorbing layer (), is shown by the dashed curve in Fig. 3b, and reproduces the line ratios and line widths of the experimental spectrum. The model includes the effect of source and instrument broadening, but neglects Doppler shift, which is , as calculated from the hotspot velocities in Fig. 2e. Radiation transport also provides an upper limit of about on the layer temperature, to prevent over-damping of the He- resonance line generated from the hotspots. This model is further supported by X-ray images of the layer (see Fig. 2), which show brightly-emitting hotspots in size inside the less brightly-emitting reconnection layer. Fig. 3a further shows that the hotspots form contiguous elongated structures along of length .
To constrain the density (), temperature (), and size () of the hotspots for which the experimental X-ray spectrum is valid, we uniformly and randomly sample values of to obtain solutions that match within the experimentally observed line ratios. Comparing the relative intensities of the He- IC with the Li-j satellite line and He- with 3p spectator transition constrains to a narrow band around , and provides an upper bound of on the hotspot ion density. Assuming that the hotspot density lies between the upper bound of and the lower bound of (inflow density from visible spectroscopy), this sampling contrains .
We also observe hotspots in synthetic X-ray images produced from 3D resistive MHD simulations of the experiment Datta et al. [2024] (Fig. 2d). In these simulations, plasmoids generated by the tearing instability are hotter and denser than the rest of the current sheet, and are regions of intense Al K-shell X-ray emission Datta et al. [2024]. The experimentally measured hotspot velocity is also consistent with the simulated velocity in the outflows from the reconnection layer, as seen in Fig. 2e. The plasmoid instability in the simulations occurs at Lundquist numbers smaller than the canonical critical value Uzdensky et al. [2010]; which may be due to density perturbations, compressibility, or non-uniform plasma resistivity Datta et al. [2024]. The simulations further show that despite the generation of plasmoids, the reconnection rate follows the scaling predicted by the radiatively-cooled Sweet-Parker theory in Ref. Uzdensky and McKinney [2011].
These 3D simulations also show that the plasmoid position in the -plane varies along the direction, due to the MHD kink instability Datta et al. [2024]. We see preliminary evidence for this modulation in the axially-resolved X-ray spectrum in Fig. 3a, where the spectral positions of the lines exhibit modulations of up to along . Ray tracing calculations Harding et al. [2015] show that these deviations correspond to -displacements in the source position, comparable to the kink instability amplitude in the simulation.
Using these experimental measurements, we calculate key physical and dimensionless parameters for the inflows and the reconnection layer. Table 1 summarizes the experimentally determined parameters in the layer inflows (array outflows) right before onset of radiative cooling (). The magnetic field is averaged from probe measurements at and , while and are from visible spectroscopy. From these, we estimate the thermal pressure , adiabatic index Drake [2013], and the Alfvén and sound speeds . We assume as the estimated energy equilibration time Richardson [2019] is smaller than the hydrodynamic time .
The layer inflows are super-Alfvénic (); consequently we expect magnetic flux pile-up to generate shocks upstream of the reconnection layer, dividing the inflow to the reconnection layer into pre-shock and post-shock regions, as observed in both the simulations Datta et al. [2024] and previous experiments Suttle et al. [2016, 2018]; Fox et al. [2011]; Olson et al. [2021]. Since the plasma is highly collisional, we estimate the post-shock plasma conditions by solving the Rankine-Hugoniot equations for a fast perpendicular MHD shock Goedbloed et al. [2010]; Boyd and Sanderson [2003], resulting in an increase in the density and magnetic field, and a decrease in the inflow velocity by a factor of about 8. Estimated values in the post-shock inflow region are shown in Table 1.
To estimate the plasma parameters in the reconnection layer, we assume that (1) a pressure balance exists between the layer and the post-shock inflow, and (2) right before onset of cooling, there is little compression of the layer, such that mass density is roughly equal inside and just outside the layer in the post-shock inflow. Both assumptions are supported by simulations Datta et al. [2024]. The estimated layer temperature and ion density at this time are therefore and respectively. The temperature is below the upper bound (), while the density is close to the upper bound () determined from X-ray spectroscopy.
We extrapolate the linear velocity trend in Fig. 2e to (, field line radius of curvature at the mid-plane), and estimate the layer outflow velocity . This velocity closely matches the magnetosonic velocity (computed from the Alfvén speed outside the layer , and the sound speed inside the layer ), which is the theoretical outflow velocity from the reconnection layer Ji et al. [1999]; Hare et al. [2017a]. The estimated Lundquist number is , and the predicted Sweet-Parker layer width is Parker [1957]; Yamada et al. [2010]. This width is much larger than both the estimated ion-ion mean free path () and the ion skin depth (), indicating high collisionality, and justifying the use of resistive MHD models. Using the post-shock inflow velocity , we infer the reconnection rate at this time , which is roughly comparable to the Sweet-Parker rate Parker [1957].
Finally, we provide order-of-magnitude estimates of the dominant terms in the layer power balance. The inferred current density in the layer, provides an Ohmic heating power of . The estimated compressional heating is . Viscous heating and thermal conduction are negligible. We estimate the radiative loss from the layer by solving the radiation transport equation along a mean chord with a length approximated as the volume-to-surface area ratio of a rectangular slab of width and length Datta et al. [2024]. Using spectral emissivities and opacities from SpK Crilly et al. [2023], the resulting loss rate is , corresponding to a cooling parameter at 220 ns. The experimentally-measured hotspot temperature and density provide an upper bound on the cooling rate . Cooling therefore dominates heating within the reconnection layer, consistent with the strong cooling observed in Figs. 1(b) & 2(a-c).
In summary, we present the first experimental evidence of strong radiative cooling in a pulsed-power-driven reconnection experiment with . The key results are:
1. The reconnection layer exhibits millimeter-scale fast-moving hotspots with strong X-ray emission, consistent with the presence of magnetic islands generated by the plasmoid instability in 3D resistive MHD simulations.
2. The majority of the high-energy X-rays are generated by these hotspots, which exhibit a temperature (about ) higher than both the inflow (about ) and bulk layer temperature ().
3. The reconnection layer undergoes strong radiative cooling, characterized by the rapid decrease in X-ray emission from the layer.
Using experimentally measured values in the inflow region, we estimate the plasma parameters inside the reconnection layer, which are consistent with the bounds determined from experimental diagnostics. Lastly, we estimate that at the time of peak X-ray emission, the cooling rate in the layer is much higher than the heating rate. Strong cooling is necessary to trigger radiative collapse of the reconnection layer. Future experiments will characterize the evolution of the plasma properties during this radiative collapse process, using time-resolved measurements of the layer width, temperature, density, and outflow velocity. The findings in this Letter are of particular relevance to the generation of radiative emission from reconnection-driven astrophysical events, and to the global dynamics of reconnection in strongly-cooled systems. These experiments also provide a novel platform for the investigation of radiative effects in HED and laboratory astrophysics experiments, and for validation of radiation (magneto) hydrodynamic and atomic codes.
The authors would like to thank the Z machine operations teams and the target fabrication team for their contributions to this work.
Experimental time on the Z facility was provided through the Z Fundamental Science Program.
This work was funded by NSF and NNSA under grant no. PHY2108050, and by the NSF EAGER grant no. PHY2213898. RD acknowledges support from the MIT MathWorks and the MIT College of Engineering Exponent fellowships. DAU gratefully acknowledges support from NASA grants 80NSSC20K0545 and 80NSSC22K0828. This work was supported by Sandia National Laboratories, a multimission laboratory managed and operated by National Technology and Engineering Solutions of Sandia, LLC, a wholly owned subsidiary of Honeywell International Inc., for the U.S. Department of Energy’s National Nuclear Security Administration under contract DE-NA0003525. This paper describes objective technical results and analysis. Any subjective views or opinions that might be expressed in the paper do not necessarily represent the views of the U.S. Department of Energy or the United States Government.
References
- Parker [1957] E. N. Parker, J. Geophys. Res. 62, 509 (1957).
- Yamada et al. [2010] M. Yamada, R. Kulsrud, and H. Ji, Rev. Mod. Phys. 82, 603 (2010).
- Ji et al. [2022] H. Ji, W. Daughton, J. Jara-Almonte, A. Le, A. Stanier, and J. Yoo, Nature Reviews Physics 4, 263 (2022).
- Goodman and Uzdensky [2008] J. Goodman and D. Uzdensky, ApJ 688, 555 (2008).
- Beloborodov [2017] A. M. Beloborodov, ApJ 850, 141 (2017).
- Werner et al. [2019] G. R. Werner, A. A. Philippov, and D. A. Uzdensky, Monthly Notices of the Royal Astronomical Society: Letters 482, L60 (2019).
- Mehlhaff et al. [2021] J. Mehlhaff, G. Werner, D. Uzdensky, and M. Begelman, MNRAS 508, 4532 (2021).
- Lyubarsky and Kirk [2001] Y. Lyubarsky and J. Kirk, ApJ 547, 437 (2001).
- Uzdensky and Spitkovsky [2014] D. A. Uzdensky and A. Spitkovsky, ApJ 780, 3 (2014).
- Cerutti et al. [2015] B. Cerutti, A. Philippov, K. Parfrey, and A. Spitkovsky, MNRAS 448, 606 (2015).
- Schoeffler et al. [2019] K. M. Schoeffler, T. Grismayer, D. Uzdensky, R. Fonseca, and L. Silva, Astrophys. J. 870, 49 (2019).
- Spruit et al. [2001] H. C. Spruit, F. Daigne, and G. Drenkhahn, Astron. Astrophys. 369, 694 (2001).
- Uzdensky and MacFadyen [2007] D. A. Uzdensky and A. I. MacFadyen, Phys. Plasmas 14 (2007), 10.1063/1.2721969.
- Giannios [2008] D. Giannios, Astron.Astrophys. 480, 305 (2008).
- Uzdensky [2011] D. A. Uzdensky, Space Sci. Rev. 160, 45 (2011).
- McKinney and Uzdensky [2012] J. C. McKinney and D. A. Uzdensky, Monthly Notices of the Royal Astronomical Society 419, 573 (2012).
- Uzdensky and McKinney [2011] D. A. Uzdensky and J. C. McKinney, Phys. Plasmas 18, 042105 (2011).
- Uzdensky [2016] D. A. Uzdensky, Radiative magnetic reconnection in astrophysics (Springer, 2016) p. 473.
- Dorman and Kulsrud [1995] V. L. Dorman and R. M. Kulsrud, ApJ. 449, 777 (1995).
- Yamada et al. [1997] M. Yamada, H. Ji, S. Hsu, T. Carter, R. Kulsrud, N. Bretz, F. Jobes, Y. Ono, and F. Perkins, Phys. Plasmas 4, 1936 (1997).
- Ji et al. [1999] H. Ji, M. Yamada, S. Hsu, R. Kulsrud, T. Carter, and S. Zaharia, Phys. Plasmas 6, 1743 (1999).
- Hsu et al. [2000] S. C. Hsu, G. Fiksel, T. Carter, H. Ji, R. Kulsrud, and M. Yamada, Phys. Rev. Lett. 84, 3859 (2000).
- Ren et al. [2005] Y. Ren, M. Yamada, S. Gerhardt, H. Ji, R. Kulsrud, and A. Kuritsyn, Phys. Rev. Lett. 95, 055003 (2005).
- Rosenberg et al. [2015] M. Rosenberg, C. Li, W. Fox, A. Zylstra, C. Stoeckl, F. Séguin, J. Frenje, and R. Petrasso, Phys. Rev. Lett. 114, 205004 (2015).
- Nilson et al. [2006] P. Nilson, L. Willingale, M. Kaluza, C. Kamperidis, S. Minardi, M. Wei, P. Fernandes, M. Notley, S. Bandyopadhyay, M. Sherlock, et al., Phys. Rev. Lett. 97, 255001 (2006).
- Li et al. [2007] C. Li, F. Séguin, J. Frenje, J. Rygg, R. Petrasso, R. Town, O. Landen, J. Knauer, and V. Smalyuk, Phys. Rev. Lett. 99, 055001 (2007).
- Fiksel et al. [2014] G. Fiksel, W. Fox, A. Bhattacharjee, D. Barnak, P.-Y. Chang, K. Germaschewski, S. Hu, and P. Nilson, Phys. rev. Lett. 113, 105003 (2014).
- Chien et al. [2023] A. Chien, L. Gao, S. Zhang, H. Ji, E. G. Blackman, W. Daughton, A. Stanier, A. Le, F. Guo, R. Follett, et al., Nature Physics 19, 254 (2023).
- Fox et al. [2012] W. Fox, A. Bhattacharjee, and K. Germaschewski, Phys. Plasmas 19, 056309 (2012).
- Lebedev et al. [2019] S. Lebedev, A. Frank, and D. Ryutov, Rev. Mod. Phys. 91, 025002 (2019).
- Suttle et al. [2016] L. Suttle, J. Hare, S. Lebedev, G. Swadling, G. Burdiak, A. Ciardi, J. Chittenden, N. Loureiro, N. Niasse, F. Suzuki-Vidal, et al., Phys. rev. Lett. 116, 225001 (2016).
- Hare et al. [2018] J. Hare, L. Suttle, S. Lebedev, N. Loureiro, A. Ciardi, J. Chittenden, T. Clayson, S. Eardley, C. Garcia, J. Halliday, et al., Phys. Plasmas 25, 055703 (2018).
- Hare et al. [2017a] J. Hare, L. Suttle, S. Lebedev, N. Loureiro, A. Ciardi, G. Burdiak, J. Chittenden, T. Clayson, C. Garcia, N. Niasse, et al., Phys. Rev. Lett. 118, 085001 (2017a).
- Suttle et al. [2018] L. Suttle, J. Hare, S. Lebedev, A. Ciardi, N. Loureiro, G. Burdiak, J. Chittenden, T. Clayson, J. Halliday, N. Niasse, et al., Phys. Plasmas 25, 042108 (2018).
- Sinars et al. [2020] D. Sinars, M. Sweeney, C. Alexander, D. Ampleford, T. Ao, J. Apruzese, C. Aragon, D. Armstrong, K. Austin, T. Awe, et al., Phys. Plasmas 27, 070501 (2020).
- Datta et al. [2024] R. Datta, A. J. Crilly, J. P. Chittenden, S. Chowdhry, K. Chandler, N. Chaturvedi, C. E. Myers, W. R. Fox, S. B. Hansen, C. A. Jennings, H. Ji, C. C. Kuranz, S. V. Lebedev, D. A. Uzdensky, and J. D. Hare, arXiv (2024), 10.48550/arXiv.2401.01795, 2401.01795 .
- Uzdensky et al. [2010] D. Uzdensky, N. Loureiro, and A. Schekochihin, Phys. Rev. Lett. 105, 235002 (2010).
- Ciardi et al. [2007] A. Ciardi, S. Lebedev, A. Frank, E. Blackman, J. Chittenden, C. Jennings, D. Ampleford, S. Bland, S. Bott, J. Rapley, et al., Phys. Plasmas 14, 056501 (2007).
- Crilly et al. [2023] A. Crilly, N. Niasse, A. Fraser, D. Chapman, K. McLean, S. Rose, and J. Chittenden, High Energy Density Physics , 101053 (2023).
- Hare et al. [2017b] J. Hare, S. Lebedev, L. Suttle, N. Loureiro, A. Ciardi, G. Burdiak, J. Chittenden, T. Clayson, S. Eardley, C. Garcia, et al., Phys. Plasmas 24, 102703 (2017b).
- Webb et al. [2023] T. Webb, D. Bliss, G. Chandler, D. Dolan, G. Dunham, A. Edens, E. Harding, M. Johnston, M. Jones, S. Langendorf, et al., Rev. Sci. instrum. 94 (2023), 10.1063/5.0123448.
- Porwitzky and Brown [2018] A. Porwitzky and J. Brown, Phys. Plasmas 25 (2018), 10.1063/1.5026983.
- Harvey-Thompson et al. [2009] A. Harvey-Thompson, S. Lebedev, S. Bland, J. Chittenden, G. Hall, A. Marocchino, F. Suzuki-Vidal, S. Bott, J. Palmer, and C. Ning, Physics of Plasmas 16 (2009), 10.1063/1.3077305.
- Datta et al. [2023a] R. Datta, J. Angel, J. B. Greenly, S. N. Bland, J. P. Chittenden, E. S. Lavine, W. M. Potter, D. Robinson, T. W. O. Varnish, E. Wong, D. A. Hammer, B. R. Kusse, and J. D. Hare, Physics of Plasmas 30, 092104 (2023a).
- Byvank et al. [2017] T. Byvank, J. Banasek, W. Potter, J. Greenly, C. Seyler, and B. Kusse, Phys. Plasmas 24 (2017), 10.1063/1.3079752.
- Datta et al. [2022a] R. Datta, D. Russell, I. Tang, T. Clayson, L. Suttle, J. Chittenden, S. Lebedev, and J. Hare, Rev. Sci. Instrum. 93, 103530 (2022a).
- Datta et al. [2022b] R. Datta, D. R. Russell, I. Tang, T. Clayson, L. G. Suttle, J. P. Chittenden, S. V. Lebedev, and J. D. Hare, J. Plasma Phys. 88, 905880604 (2022b).
- Schaeuble et al. [2021] M. Schaeuble, T. Nagayama, J. Bailey, B. Dunlap, and S. Patel, Phys. Plasmas 28 (2021), 10.1063/5.0047931.
- Datta et al. [2023b] R. Datta, F. Ahmed, and J. D. Hare, arXiv preprint arXiv:2308.16828 (2023b), 10.48550/arXiv.2308.16828.
- Claus et al. [2015] L. Claus, L. Fang, R. Kay, M. Kimmel, J. Long, G. Robertson, M. Sanchez, J. Stahoviak, D. Trotter, and J. Porter, Target Diagnostics Physics and Engineering for Inertial Confinement Fusion IV 9591, 177 (2015).
- Harding et al. [2015] E. Harding, T. Ao, J. Bailey, G. Loisel, D. Sinars, M. Geissel, G. Rochau, and I. Smith, Rev. Sci. Instrum. 86 (2015), 10.1063/1.4918619.
- Hansen et al. [2007] S. Hansen, J. Bauche, C. Bauche-Arnoult, and M. Gu, High Energy Density Physics 3, 109 (2007).
- Drake [2013] R. Drake, High-Energy-Density Physics. Fundamentals, Inertial Fusion and Experimental Analysis (Springer, 2013).
- Richardson [2019] A. Richardson, NRL plasma formulary (US Naval Research Laboratory, 2019).
- Fox et al. [2011] W. Fox, A. Bhattacharjee, and K. Germaschewski, Phys. Rev. Lett. 106, 215003 (2011).
- Olson et al. [2021] J. Olson, J. Egedal, M. Clark, D. A. Endrizzi, S. Greess, A. Millet-Ayala, R. Myers, E. E. Peterson, J. Wallace, and C. B. Forest, J. Plasma Phys. 87, 175870301 (2021).
- Goedbloed et al. [2010] J. P. Goedbloed, R. Keppens, and S. Poedts, Advanced Magnetohydrodynamics: With Applications to Laboratory and Astrophysical Plasmas (Cambridge University Press, 2010).
- Boyd and Sanderson [2003] T. J. M. Boyd and J. J. Sanderson, The Physics of Plasmas (Cambridge University Press, 2003).