Phase-shifted remote photoplethysmography for estimating heart rate and blood pressure from facial video
Gyutae Hwanga (gyutae741@jbnu.ac.kr), Sang Jun Leea (sj.lee@jbnu.ac.kr)
a Division of Electronics and Information Engineering, Jeonbuk National University, 567 Baekje-daero, Deokjin-gu, Jeonju 54896, Republic of Korea
Corresponding Author:
Sang Jun Lee
Division of Electronics and Information Engineering, Jeonbuk National University, 567 Baekje-daero, Deokjin-gu, Jeonju 54896, Republic of Korea
Email: sj.lee@jbnu.ac.kr
Abstract
Human health can be critically affected by cardiovascular diseases, such as hypertension, arrhythmias, and stroke. Heart rate and blood pressure are important biometric information for the monitoring of cardiovascular system and early diagnosis of cardiovascular diseases. Existing methods for estimating the heart rate are based on electrocardiography and photoplethyomography, which require contacting the sensor to the skin surface. Moreover, catheter and cuff-based methods for measuring blood pressure cause inconvenience and have limited applicability. Therefore, in this thesis, we propose a vision-based method for estimating the heart rate and blood pressure. This thesis proposes a 2-stage deep learning framework consisting of a dual remote photoplethysmography network (DRP-Net) and bounded blood pressure network (BBP-Net). In the first stage, DRP-Net infers remote photoplethysmography (rPPG) signals for the acral and facial regions, and these phase-shifted rPPG signals are utilized to estimate the heart rate. In the second stage, BBP-Net integrates temporal features and analyzes phase discrepancy between the acral and facial rPPG signals to estimate SBP and DBP values. To improve the accuracy of estimating the heart rate, we employed a data augmentation method based on a frame interpolation model. Moreover, we designed BBP-Net to infer blood pressure within a predefined range by incorporating a scaled sigmoid function. To demonstrate the effectiveness of the proposed method, experiments were conducted on the MMSE-HR and V4V datasets. Our method resulted in estimating the heart rate with the mean absolute error (MAE) of 1.78 BPM, reducing the MAE by 34.31 % compared to the recent method, on the MMSE-HR dataset. The MAE for estimating the systolic blood pressure (SBP) and diastolic blood pressure (DBP) were 10.19 mmHg and 7.09 mmHg. On the V4V dataset, the MAE for the heart rate, SBP, and DBP were 3.83 BPM, 13.64 mmHg, and 9.4 mmHg, respectively. We expect that the proposed method will contribute to the advancement of sensing technology for the monitoring of human health.
keywords:
Computer vision, deep learning, physiological measurement, remote photoplethysmography, heart rate, blood pressure1 Introduction
The cardiovascular system consists of the heart and blood vessels, and it circulates blood throughout the body, delivering oxygen and nutrients to tissues while removing waste substances. Abnormalities in the cardiovascular system can lead to various cardiovascular diseases such as cardiomyopathy, hypertensive heart disease, arrhythmias, with potentially severe implications for overall health. Moreover, cardiovascular diseases associated with blood vessels, such as hypertension and stroke, are contribute to increasing the global mortality rate [Gaidai et al., 2023]. However, these diseases can be detected at an early stage through the monitoring of the heart rate and blood pressure using healthcare devices such as smartwatches. For example, arrhythmias caused by abnormalities in the sinoatrial node can be prevented through the measurement of bradycardia, tachyarrhythmia, and irregular heart rates. Additionally, consistent readings of systolic blood pressure (SBP) above 120 mmHg and diastolic blood pressure (DBP) above 90 mmHg may indicate the potential presence of hypertension. Recently, interest in cardiovascular diseases has led to growing attention on research for healthcare services [Etemadi et al., 2023, Aggarwal & Pandey, 2023] and estimation of biometric information [Alnaggar et al., 2023, Gupta et al., 2023].
Heart rate and blood pressure are main biometric information for the monitoring of cardiovascular diseases [Perret-Guillaume et al., 2009, Fuchs & Whelton, 2020], and these information can be measured by utilizing various physiological sensors and medical equipment. Heart rate is commonly measured by using electrocardiography (ECG) and photoplethysmography (PPG). ECG uses electrodes attached to the body to record the electrical activity caused by contractions and relaxations of the heart. PPG is a non-invasive method that uses a light source and photodetector at the skin surface to measure the volumetric variations of blood in micro vessels. The heart rate is measured by computing peak-to-peak intervals in the time domain or by analyzing the power spectral density in the frequency domain from the ECG or PPG signals. On the other hand, blood pressure can be measured based on an oscillometric method, which records the magnitude of pressure oscillations using a cuff, or an invasive catheter-based approach. The catheter-based method involves the direct insertion of a sensor into an artery to measure continuous arterial blood pressure (ABP). Peak and valley values of the ABP signal are utilized as SBP and DBP, respectively. The blood pressure can also be estimated from pulse transit time (PTT) measured by ECG or PPG sensors at the heart and acral sites. PTT is the time taking for a blood pulse wave to travel from the heart to an acral site, and it known that PTT is closely correlated with blood pressure [Geddes et al., 1981]. Although there have been proposed BP estimation methods by analyzing PTT from ECG or PPG signals [Barvik et al., 2021, Ganti et al., 2020], these approaches have the intrinsic limitation of requiring skin contact.
Recently, camera sensors have been utilized to obtain physiological information, and it is called remote photoplethysmography (rPPG). From a facial video, the rPPG technique extracts subtle variations in skin color induced by cardiovascular pulse. The extracted temporal changes in pixel intensities are then transformed into continuous waveforms analogous to conventional PPG signals. The precision of the rPPG technique can be critically influenced by many factors such as ambient light conditions, motion artifacts, and different skin tones. Despite these challenges, rPPG receives much attention due to the non-contact and non-invasive attributes that facilitate remote monitoring of biometric information.
Deep learning methods have been utilized to extract rPPG signals and to estimate the heart rate [Chen & McDuff, 2018, Yu et al., 2022, Ouzar et al., 2023]. Additionally, various datasets [Bobbia et al., 2019, Niu et al., 2019, Soleymani et al., 2011, Li et al., 2018, Stricker et al., 2014, Zhang et al., 2016b, Revanur et al., 2021] have been released for the development and evaluation of these deep learning algorithms. PPG signals in the existing datasets were collected at acral sites such as fingertips, and therefore, there exist temporal discrepancies between the pulse waves in the PPG signals and facial videos. However, most previous methods ignore the time shift between the two modalities and adopt a time domain loss between PPG signals measured at an acral site and rPPG signals extracted from facial videos. For example, Lu et al. [2021] and Yu et al. [2022] employed negative Pearson correlation loss to measure the similarity between the PPG signals and estimated rPPG signals in the time domain. In this paper, we introduced two types of phase-shifted rPPG signals, referred to as acral rPPG and facial rPPG, to consider the temporal discrepancy between facial videos and PPG signals measured at an acral site. The acral rPPG is guided by a time domain loss function, while the facial rPPG is guided by frequency domain features which have temporally global characteristics.
On the other hand, blood pressure can be estimated from PPG signals, both ECG and PPG signals, or facial videos. While PPG-based methods are widely utilized in wearable devices, this approach has the limitation of requiring physical contact to obtain PPG signals. Although the approach of utilizing both ECG and PPG signals can measure blood pressure based on PTT information, it also has the disadvantage of requiring contact with ECG and PPG sensors. Recently, camera-based methods have been proposed to estimate blood pressure in a non-contact manner by utilizing spatiotemporal features in facial videos. However, there is a performance gap between the camera-based and PPG-based methods. The objective of this study is to improve the performance of the camera-based approach by utilizing phase-shifted information in the acral and facial rPPG signals.
This paper proposes a 2-stage deep learning pipeline consisting of a dual remote photoplethysmography network (DRP-Net) and bounded blood pressure network (BBP-Net). In the first stage, DRP-Net infers the acral and facial rPPG signals, and it is used to estimate the heart rate. In the second stage, BBP-Net integrates temporal features based on a multi-scale fusion (MSF) module and analyzes phase discrepancy between the acral and facial rPPG signals to estimate SBP and DBP values. To improve the precision of blood pressure estimation, a scaled sigmoid function is employed in the BBP-Net to constrain the estimate into a certain range. Experiments were conducted on the MMSE-HR database [Zhang et al., 2016b] and V4V database [Revanur et al., 2021] to demonstrate the effectiveness of the proposed method for estimating heart rate and blood pressure from facial videos. The main contributions of this paper can be summarized as follows.
-
1.
We propose a novel 2-stage deep learning framework consisting of DRP-Net and BBP-Net networks.
-
2.
We employ a frame interpolation algorithm for the augmentation of bradycardia and pyknocardia video clips.
-
3.
We introduce the concept of phase-shifted rPPG for considering the temporal discrepancy between pulse waves in facial videos and PPG signals.
-
4.
We propose a novel loss function and employ a scaled sigmoid layer to improve the accuracy of heart rate and blood pressure.
-
5.
Our proposed method achieved the state-of-the-art performance for estimating heart rate and blood pressure on the MMSE-HR and V4V database.
The rest of this paper is organized as follows. Section 2 presents related work. Section 3.1 presents overall pipeline of the proposed method. Section 3.2 and Section 3.3 explain details about preprocessing and data augmentation process. Section 3.4, Section 3.5, and Section 3.6 present the DRP-Net, BBP-Net, and loss functions, respectively. Sections 4 and Section 5 present experimental results and conclusion.
2 Related work
2.1 Estimation of rPPG signals from facial videos
Image processing techniques and mathematical models have been utilized to analyze subtle variations in color intensities and to estimate rPPG signals. Poh et al. [2010] computed pulse waves by averaging on RGB color channels, and independent component analysis was conducted to extract rPPG signals. Lewandowska et al. [2011] estimated rPPG signals by conducting a channel selection process and principal component analysis on color intensities in a forehead region. De Haan & Jeanne [2013] proposed a chrominance-based method, called CHROM, to improve the performance of rPPG against motion artifacts. Wang et al. [2016] proposed the POS algorithm, which analyzes the plane orthogonal to the skin tone in the normalized RGB space. Meanwhile, with the success of deep learning methods for computer vision tasks, data driven approaches started to be applied in the estimation of rPPG signals.
The deep learning-based rPPG estimation technique focuses on learning trends in PPG that are robust to motion and external brightness changes from video sequence data with spatiotemporal characteristics. Chen & McDuff [2018] introduced a convolutional attention network (CAN) that employs a Siamese-structured 2 dimensional CNN model. This model takes both a difference map of adjacent viewpoints and the original viewpoint image. Spatial attentions are utilized to emphasize skin regions in the difference images, effectively integrating the models. Nowara et al. [2021] aimed to estimate spatial noise factors including motion and illumination using the inverse of spatial attentions of the CAN model. They integrated the LSTM to enhance spatial denoising and improve temporal robustness in PPG. Yu et al. [2019] proposed PhysNet, which employs a 3D CNN-based encoder to extract spatiotemporal features and a decoder along the time axis to estimate rPPG. They also introduced a loss function based on the Pearson correlation coefficient. Yu et al. [2022] proposed a loss function based on temporal difference convolution (TDC) using neighboring frame differences of a 4 dimensional feature map as query and key, and KL divergence of periodic component distributions. Yu et al. [2023] is a SlowFast Network for temporal improvement of the estimated signal, which has shown promising heart rate estimation accuracy even in cross-domain. However, existing studies primarily focuses on providing performance results of heart rate estimation using the power spectrum of rPPG, and less consideration is given to the blood pressure estimation steps based on rPPG.
2.2 Deep learning methods for estimating blood pressure
For non-invasive blood pressure estimation, researchers have attempted to develop deep learning algorithms utilizing physiological signal measured from various sensors. Miao et al. [2020] proposed a deep learning model based on ResNet and LSTM for continuous blood pressure estimation from single channel ECG. Panwar et al. [2020] introduced PP-Net, which consists of a 1D convolution and LSTM, to estimate SBP, DBP, and heart rate from PPG signals. Huang et al. [2022] utilized PTT information for blood pressure estimation and proposed a deep learning framework based on MLP-Mixer. Additionally, they introduced the multi-filter to multi-channel (MFMC) preprocessing of ECG and PPG signals. Similarly, Jia et al. [2022] estimate the blood pressure using a deep learning algorithm that learns PTT information from images of the face and palm. However, algorithms using sensor data as input are limited by their dependence on contact sensors, or the need to acquire data from multiple body parts, which restricts movement of subjects when measuring blood pressure.
Image-based blood pressure estimation methods have been conducted by combining rPPG estimation through mathematical modeling and leveraging deep learning model to estimate blood pressure from PPG signal. Schrumpf et al. [2021] conducted the study to estimate blood pressure from rPPGs by employing a rPPG extraction technique via a POS algorithm from ROI sequences and a PPG-based blood pressure estimation algorithm. Wu et al. [2022] also applied a POS algorithm to ROI sequence in 3 regions for rPPG extraction, and proposed a deep learning method to process rPPG and biometric information that can be estimated from it in parallel for blood pressure estimation. Bousefsaf et al. [2022] proposed an algorithm that extracts rPPG as G-channel averages of ROI, preprocesses them through continuous wavelet transform (CWT) in both time and frequency domains, and employs U-Net architecture to estimate continuous blood pressure signal. Chen et al. [2023] estimated blood pressure without rPPG extraction by employing spatiotemporal mapping of ROI sequences and a combined CNN and LSTM structure. While existing blood pressure estimation studies utilize mathematical modeling methods for rPPG extraction, we propose a deep learning algorithm for image-based rPPG estimation, which demonstrates improved performance in both heart rate and blood pressure estimation.
3 Proposed method
3.1 Overall training pipeline
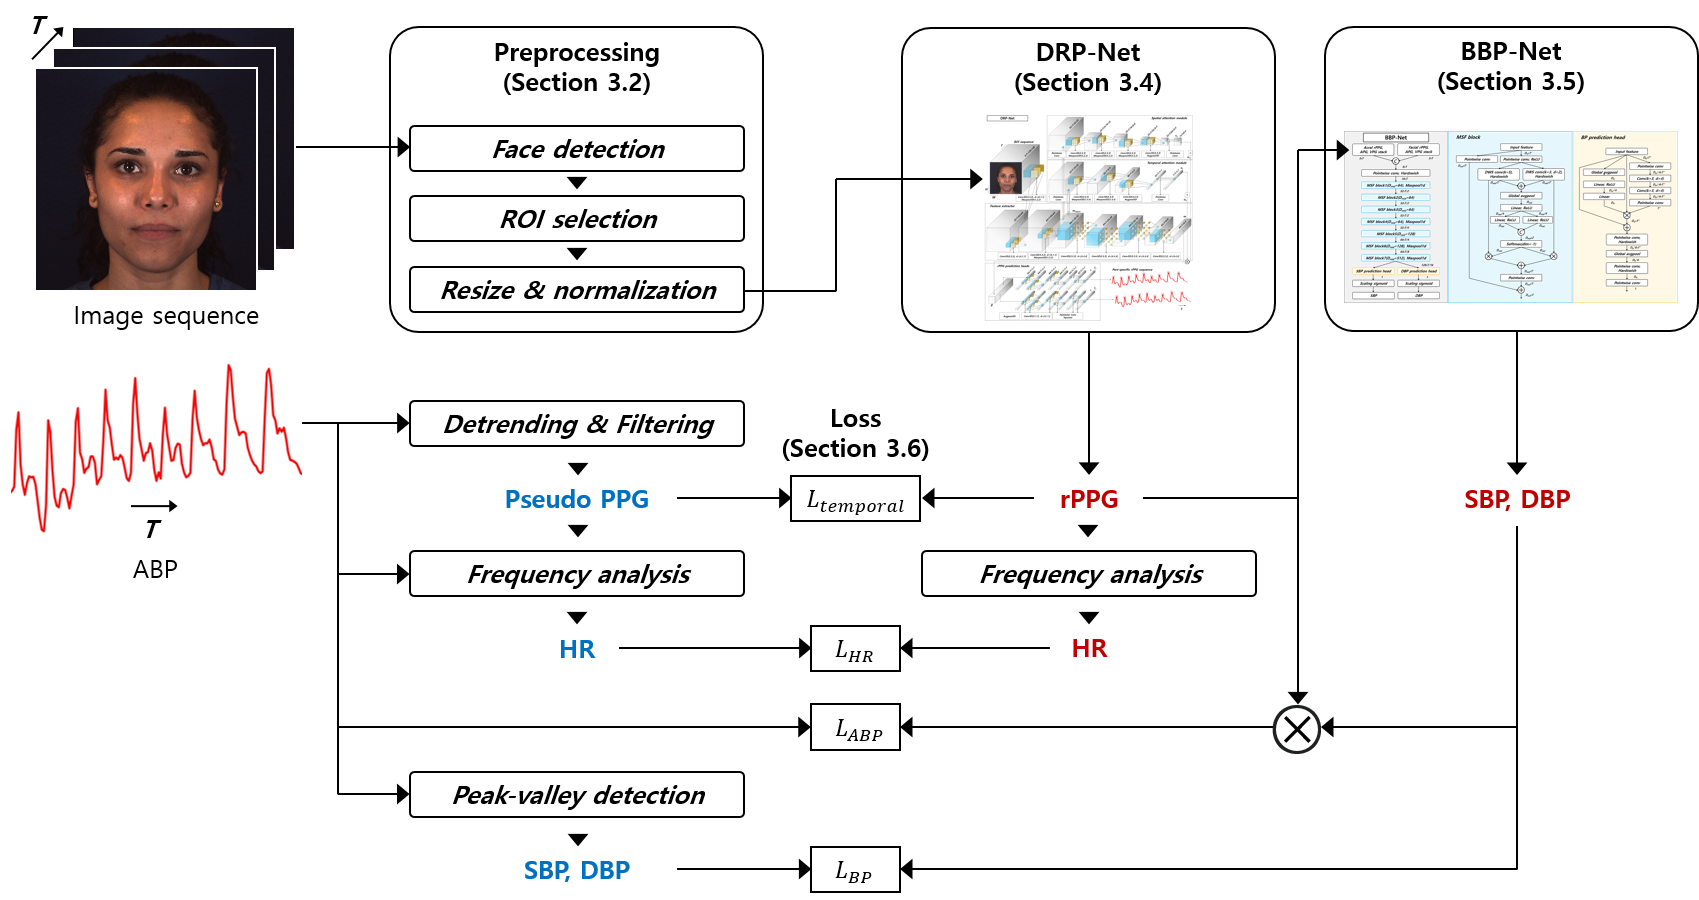
This paper proposes a 2-stage deep learning framework which consists of DRP-Net and BBP-Net for estimating the heart rate and blood pressure from facial videos. The proposed deep learning model extracts acral and facial rPPG signals and analyzes their temporal discrepancy to estimate SBP and DBP values. Fig. 1 presents the overview of the training pipeline of the proposed method. In the preprocessing step, facial regions are detected within a video clip to define a region of interest (ROI). The DRP-Net extracts acral and facial rPPG signals from the ROI sequence, and the BBP-Net predicts SBP and DBP values. To train the DRP-Net and BBP-Net, ground truth signals are generated from ABP signals. Pseudo PPG signals are computed by detrending and bandpass filtering to supervise the training of the DRP-Net Fast Fourier transform (FFT) and power spectrum density analysis are conducted to extract HR values from pseudo PPG and rPPG signals. Additionally, peaks and valleys are detected from the ABP signals to compute the ground truth SBP and DBP values. In Fig. 1, blue and red colors indicate ground truth and predicted signals, respectively.
3.2 Preprocessing and ground truth generation
The preprocessing step extracts normalized ROI regions from the input images to remove the redundant background information. The pretrained MTCNN [Zhang et al., 2016a] model was utilized to detect facial regions, and an ROI was decided to include all facial regions within a short video clip. The ROI regions are cropped and resized into the size of 128128, and the ROI images were normalized into the range between 0 and 1 to reduce the effect of light conditions.
On the other hand, pseudo PPG signals were generated from ABP signals by conducting detrending, bandpass filtering, and normalization. Detrending is the process of computing moving average of the ABP signals to remove high frequency noise components, and filtering was conducted to extract physiologically meaningful information from a pre-defined frequency band. Following the previous literatureHu et al. [2022], we used the smaller window size of 150 for detrending and extracted the information within the frequency band between 0.5 hz and 3 hz. The filtered signals were normalized into the range between -2 and 2 to generate pseudo PPG signals. Additionally, ground truth HR was computed by detecting the frequency value corresponding to the maximum power spectrum density. Ground truth values for SBP and DBP were computed by averaging peak and valley values within a time interval.
3.3 Data augmentation
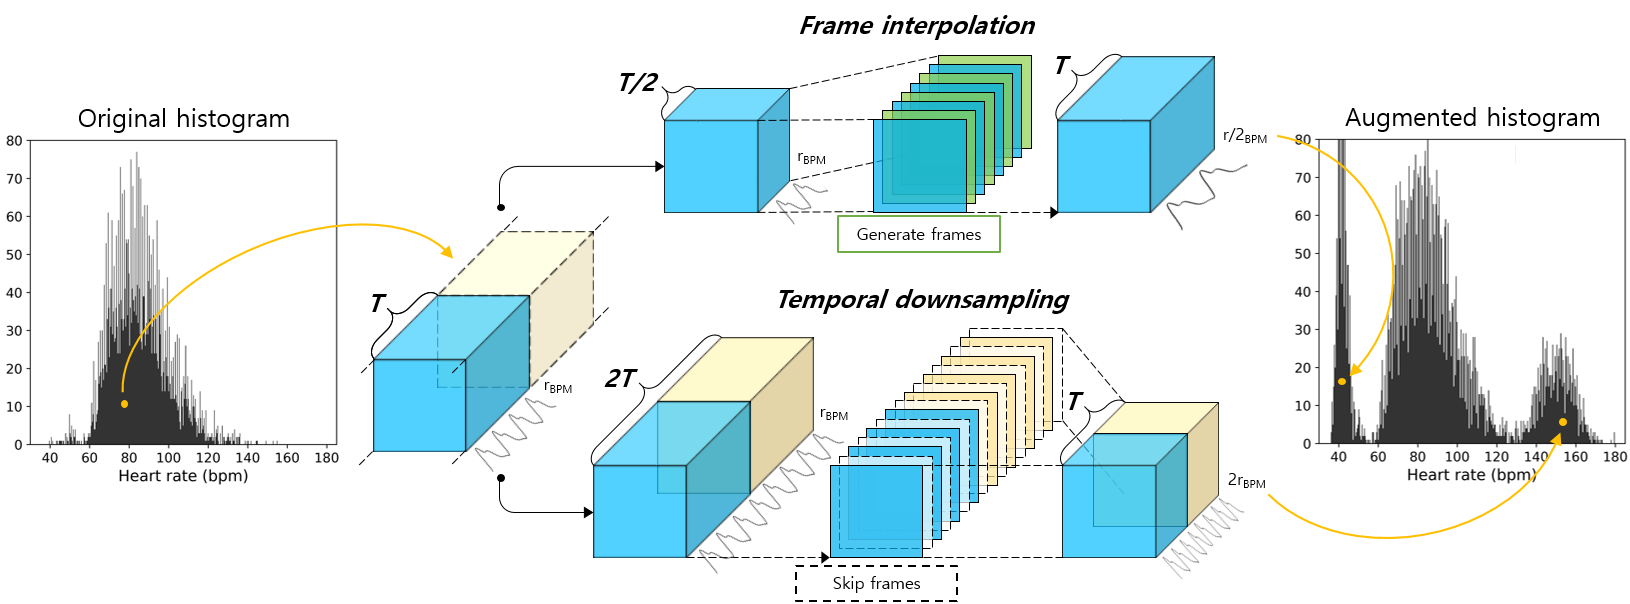
Biometric information such as heart rate follows a Gaussian distribution and requires augmentation of long-tailed data due to data imbalance. In this paper, we propose upsampling and downsampling of the time axis based on frame interpolation to augment the data, and the process is shown in Fig. 2. In the training dataset, the original video sequence and signals with a window length of contain heart rate information of BPM. To augment the bradycardia data, the window length original video with a heart rate of BPM is used, and interpolation of the intermediate frames increases the sequence length to and reduces the heart rate to about BPM. The algorithm used for frame interpolation is FILM-Net [Reda et al., 2022] with transfer learning parameters. In contrast, the augmentation of tachycardia data uses the window length original video with a heart rate of BPM, and skips an even number of frames to generate the window length sequence data with the heart rate of BPM. The augmentation of heart rate data by upsampling and downsampling of frames has been proposed in Yu et al. [2020]. The difference with our proposed method is that we use a deep learning-based frame interpolation method for upsampling.
3.4 Dual remote photoplethysmography network (DRP-Net)
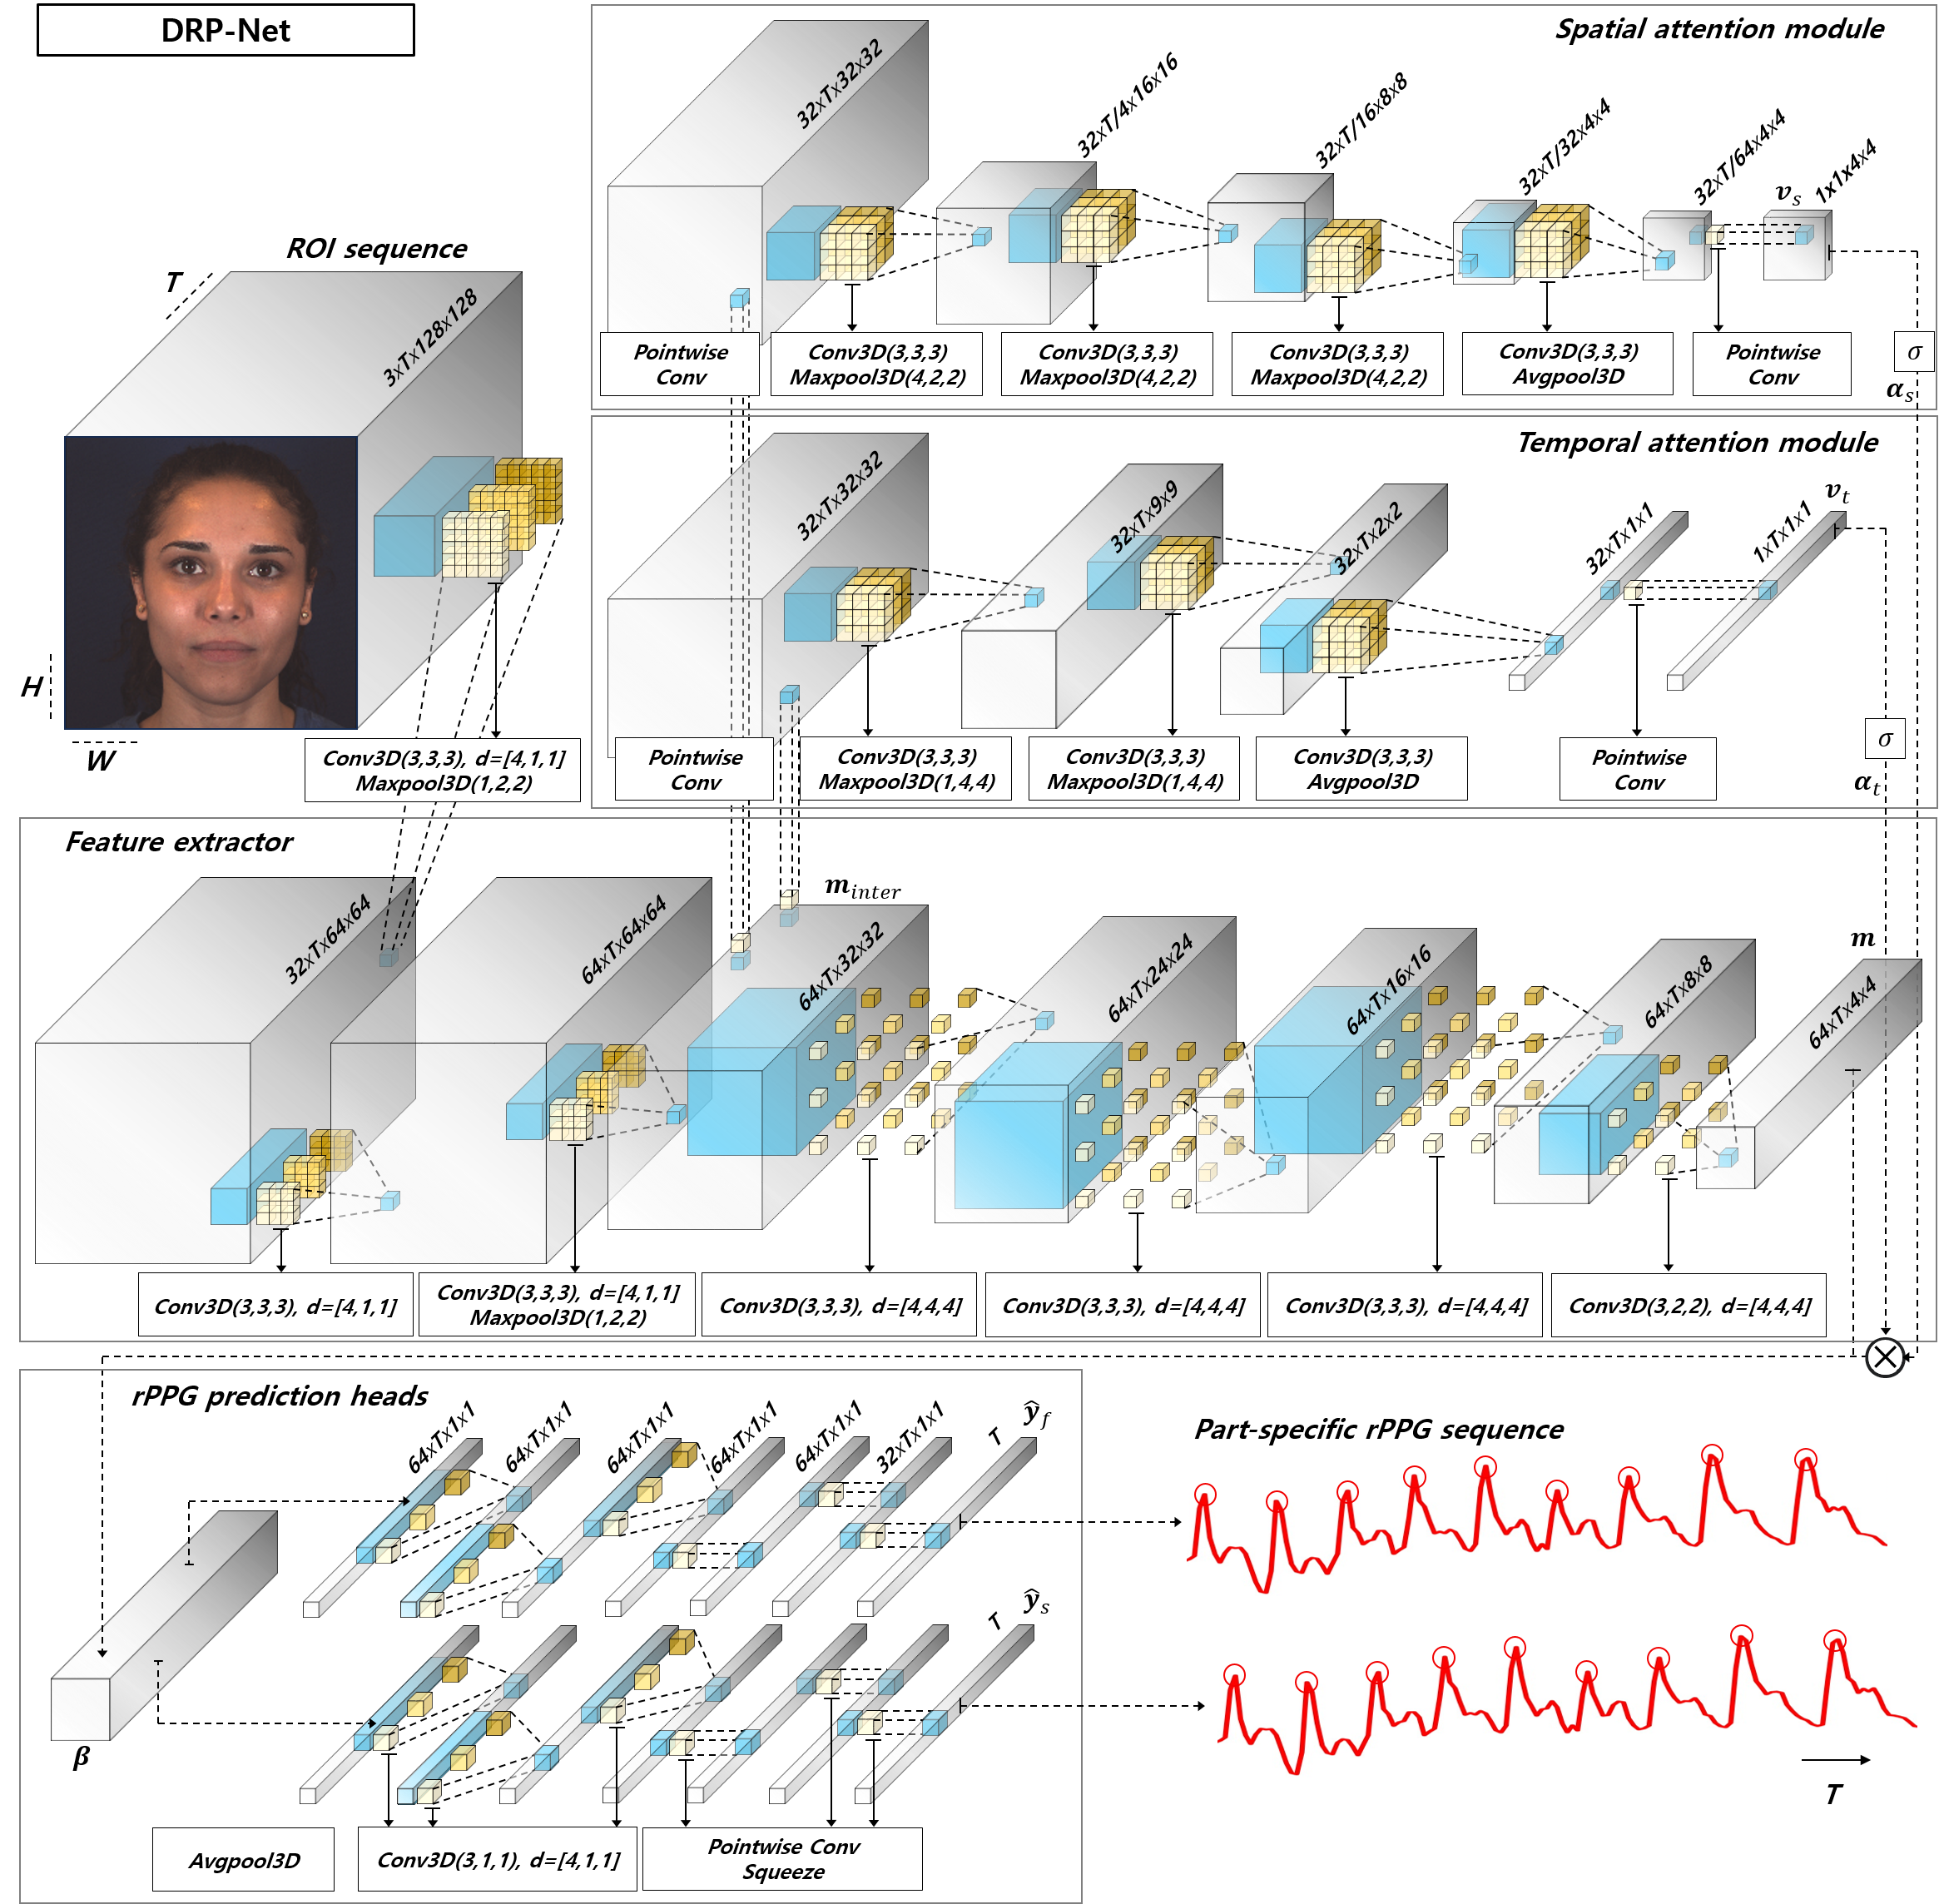
In this paper, we propose a dual remote photoplethysmography network (DRP-Net) to estimate phase-shifted rPPGs from image sequences, whose structure is shown in Fig. 3. It is important for the rPPG estimation algorithm to learn spatiotemporal features to capture the time-series pulse wave signal in the facial image sequence . DRP-Net is a 3 dimensional CNN model, consisting of a feature extractor, spatial and temporal attention modules, and an rPPG prediction heads. The feature extractor employs atrous convolution to learn sparse local features over a large receptive field, while reducing the spatial dimension and maintaining the temporal dimension. The feature extractor produces a spatiotemporal feature map , and it consists of the 7 atrous convolutions and 3 max pooling layers. In addition, the intermediate feature map from the feature extractor is utilized in the spatial and temporal attention modules in parallel. The spatial attention module consists of 3 dimensional convolution, max pooling, average pooling, and pointwise convolution for dimensionality reduction to obtain . The spatial attention vector is computed by applying the sigmoid function to , and is defined as follows.
| (1) |
where separate the regions that contain physiological information from the background regions, giving the skin regions higher weights. Similarly, we obtain from the temporal attention module, and the temporal attention vector is defined as
| (2) |
where gives relatively low weight to motion noise at the frame level and optimizes the model to minimize its impact. The rPPG prediction head estimates phase-shifted facial rPPG and acral rPPG , and the input is defined as follows.
| (3) |
where denotes elementwise multiplication, which gives the weights of temporal and spatial attention vectors and to spatiotemporal feature map m.
3.5 Bounded blood pressure network (BBP-Net)
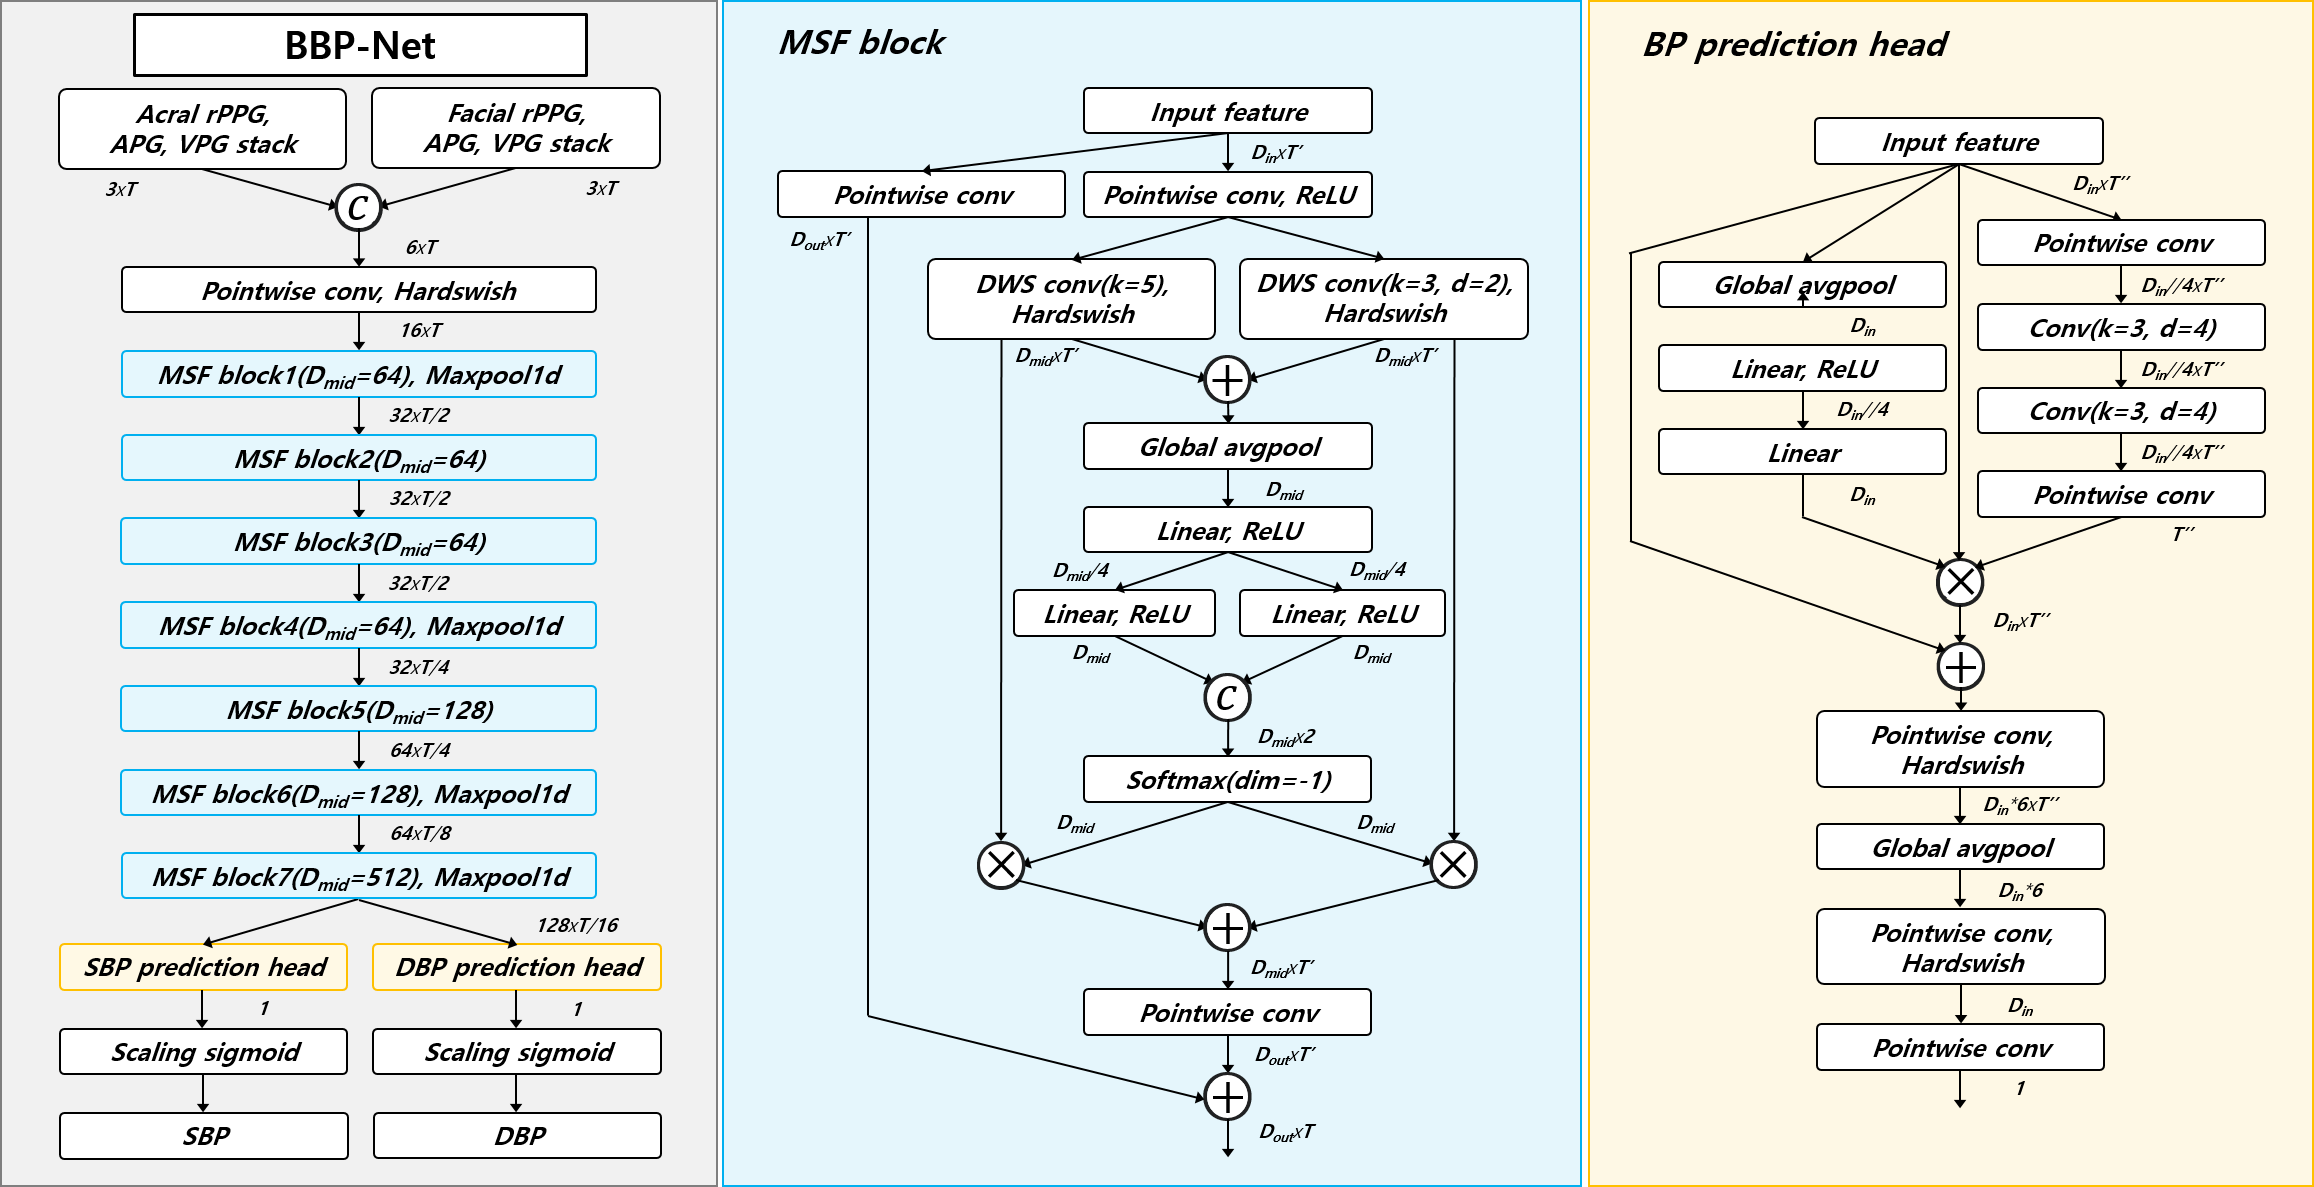
To estimate SBP and DBP from facial rPPG and acral rPPG , we designed a multi-scale feature fusion (MSF)-based bounded blood pressure network (BBP-Net), which is shown in Fig. 4. BBP-Net takes the set of physiological signals as a stack of velocity plethysmograms (VPGs) and acceleration plethysmograms (APGs), which are the first and second derivatives of the facial and acral rPPG. The structure of BBP-Net is designed with a backbone network based on MSF blocks and a parallel BP prediction heads, and scaling sigmoid function. The MSF block performs depth-wise separable (DWS) convolution with kernel sizes of the 3 and 5 in parallel. Then it performs a linear operation and a channel-wise softmax operation to compute the weight vector. Every MSF blocks contain the residual connections. The BP prediction head includes the computation process to obtain the weight vector by employing the bottleneck attention module (BAM) [Park et al., 2018] and residual connections in parallel. We modify the sigmoid function into a scaling sigmoid function to bound the estimated blood pressure to the normal range, and it is defined as follows.
| (4) |
where is the estimated blood pressure, and and are heuristic parameters that represent the range of reasonable blood pressure. and are the logit estimated from the BP prediction head and temperature, respectively. The structure of BBP-Net is based on the architecture proposed by Hu et al. [2022], which is designed to estimate SBP and DBP from PPG, and has achieved state-of-the-art (SOTA) performance on the UCI-dataset. While previous studies that take a single PPG of size as input, we utilize the phase-shifted information of the rPPG and employ a scaling sigmoid function.
3.6 Loss functions
Since the purpose of DRP-Net and BBP-Net is regression to estimate the biometrics of rPPG, heart rate, and blood pressure, we designed a loss function based on the mean squared error (MSE). The loss function of DRP-Net for heart rate estimation is denoted as
| (5) |
where and are the predicted and ground truth heart rate, respectively, and is the number of data samples. The loss function in the frequency domain is defined based on the power spectrum of the physiological signal via FFT and can be defined as follows.
| (6) |
where and denote the rPPG predicted by DRP-Net and the PPG obtained from the sensor, respectively. In the case of using only frequency domain losses, the range of predicted signal’s amplitude is relatively small, therefore we propose as a loss function for scaling.
| (7) |
where and denote the peak and valley values of the signal, respectively, and the average of these values is denoted by . is the time domain loss function but it is independent of the phase of the predicted signal. In addition, we define a loss function in the time domain to train an acral rPPG that simulates the scale and phase of the PPG. It is defined as
| (8) |
The total loss function to optimize the facial rPPG is , which guides the model to distinguish pulse waves in the facial image sequence. On the other hand, acral rPPG utilizes to simulate the phase of the PPG. BBP-Net for blood pressure estimation employs Huber loss [Collins, 1976] to predict SBP and DBP which we define as . Additionally, acral rPPG scaled with SBP and DBP ranges is adjusted by minimizing to the ABP signal.
4 Experimental results
Experiments were conducted on a hardware environment including Intel Core i9-10940X CPU, 64 GB DDR4 RAM, and NVIDIA Geforce RTX 3090 Ti. Python and Pytorch were used for the implementation of the proposed algorithm. For experimental details, a time window of 150 (6 seconds), a batch size of 8, and a decay factor of 0.99 were used, and the learning rate of the Adam optimizer was set to 0.001 and 0.0001 for MMSE-HR and V4V, respectively. To evaluate the accuracy of estimated heart rate and blood pressure, we adopted the mean absolute error (MAE) and root mean squared error (RMSE). Moreover, the proposed method was evaluated using the Pearson correlation coefficient r.
4.1 Datasets
To demonstrate the heart rate and blood pressure estimation accuracy of the proposed method, we experimented on the MMSE-HR (Multimodal Spontaneous Expression-Heart Rate) [Zhang et al., 2016b] and V4V (Vision for Vitals) database [Revanur et al., 2021]. The two datasets are sub-datasets of the MMSE database (BP4D+), which consists of synchronized facial image sequences and continuous blood pressure signals. As introduced in Section 3.1, the biometric information of PPG, heart rate, SBP, and DBP can be calculated by preprocessing the blood pressure signals. To ensure data diversity, tasks were performed to arouse amusement, pain, anger, and disgust. RGB video was recorded at the resolution of 10401392 and the frame rate of 25 FPS, and blood pressure signals were collected at the sampling rate of 1000 Hz. The MMSE-HR database released at the CVPR 2016 for The Heart Rate Estimation Algorithm Challenge includes 102 samples from 17 male and 23 female subjects. The average signal lengths are 30 seconds. The V4V database released at the ICCV workshop 2021 for The 1st Vision for Vitals Challenge includes 1,358 data samples split into 724 training, 276 validation, and 358 test samples. The average signal lengths are 40 seconds, collected from 179 subjects.
| Methods | Window (sec) | MAE (BPM) | RMSE | r |
| POS [De Haan & Jeanne, 2013] | - | 5.77 | - | 0.82 |
| DeepPhys [Chen & McDuff, 2018] | 30 | 4.72 | 8.68 | 0.82 |
| Benefit of distraction [Nowara et al., 2021] | 2 | 2.27 | 4.9 | 0.94 |
| EfficientPhys-C [Liu et al., 2021] | video level | 3.48 | 7.21 | 0.86 |
| CAN with synthetic data [McDuff et al., 2022] | 30 | 2.26 | 3.7 | - |
| PhysFormer [Yu et al., 2022] | 6.4 | 2.84 | 5.36 | 0.92 |
| Spatiotemporal feature [Jaiswal & Meenpal, 2022] | 5 | 6.4 | 6.82 | 0.95 |
| X-iPPGNet [Ouzar et al., 2023] | 2 | 4.1 | 5.32 | 0.85 |
| PhysFormer++ [Yu et al., 2023] | 6.4 | 2.71 | 5.15 | 0.93 |
| Ours (facial) | 6 | 1.78 | 4.27 | 0.95 |
| Ours (acral) | 6 | 1.91 | 4.74 | 0.93 |
4.2 Quantitative results on MMSE-HR database
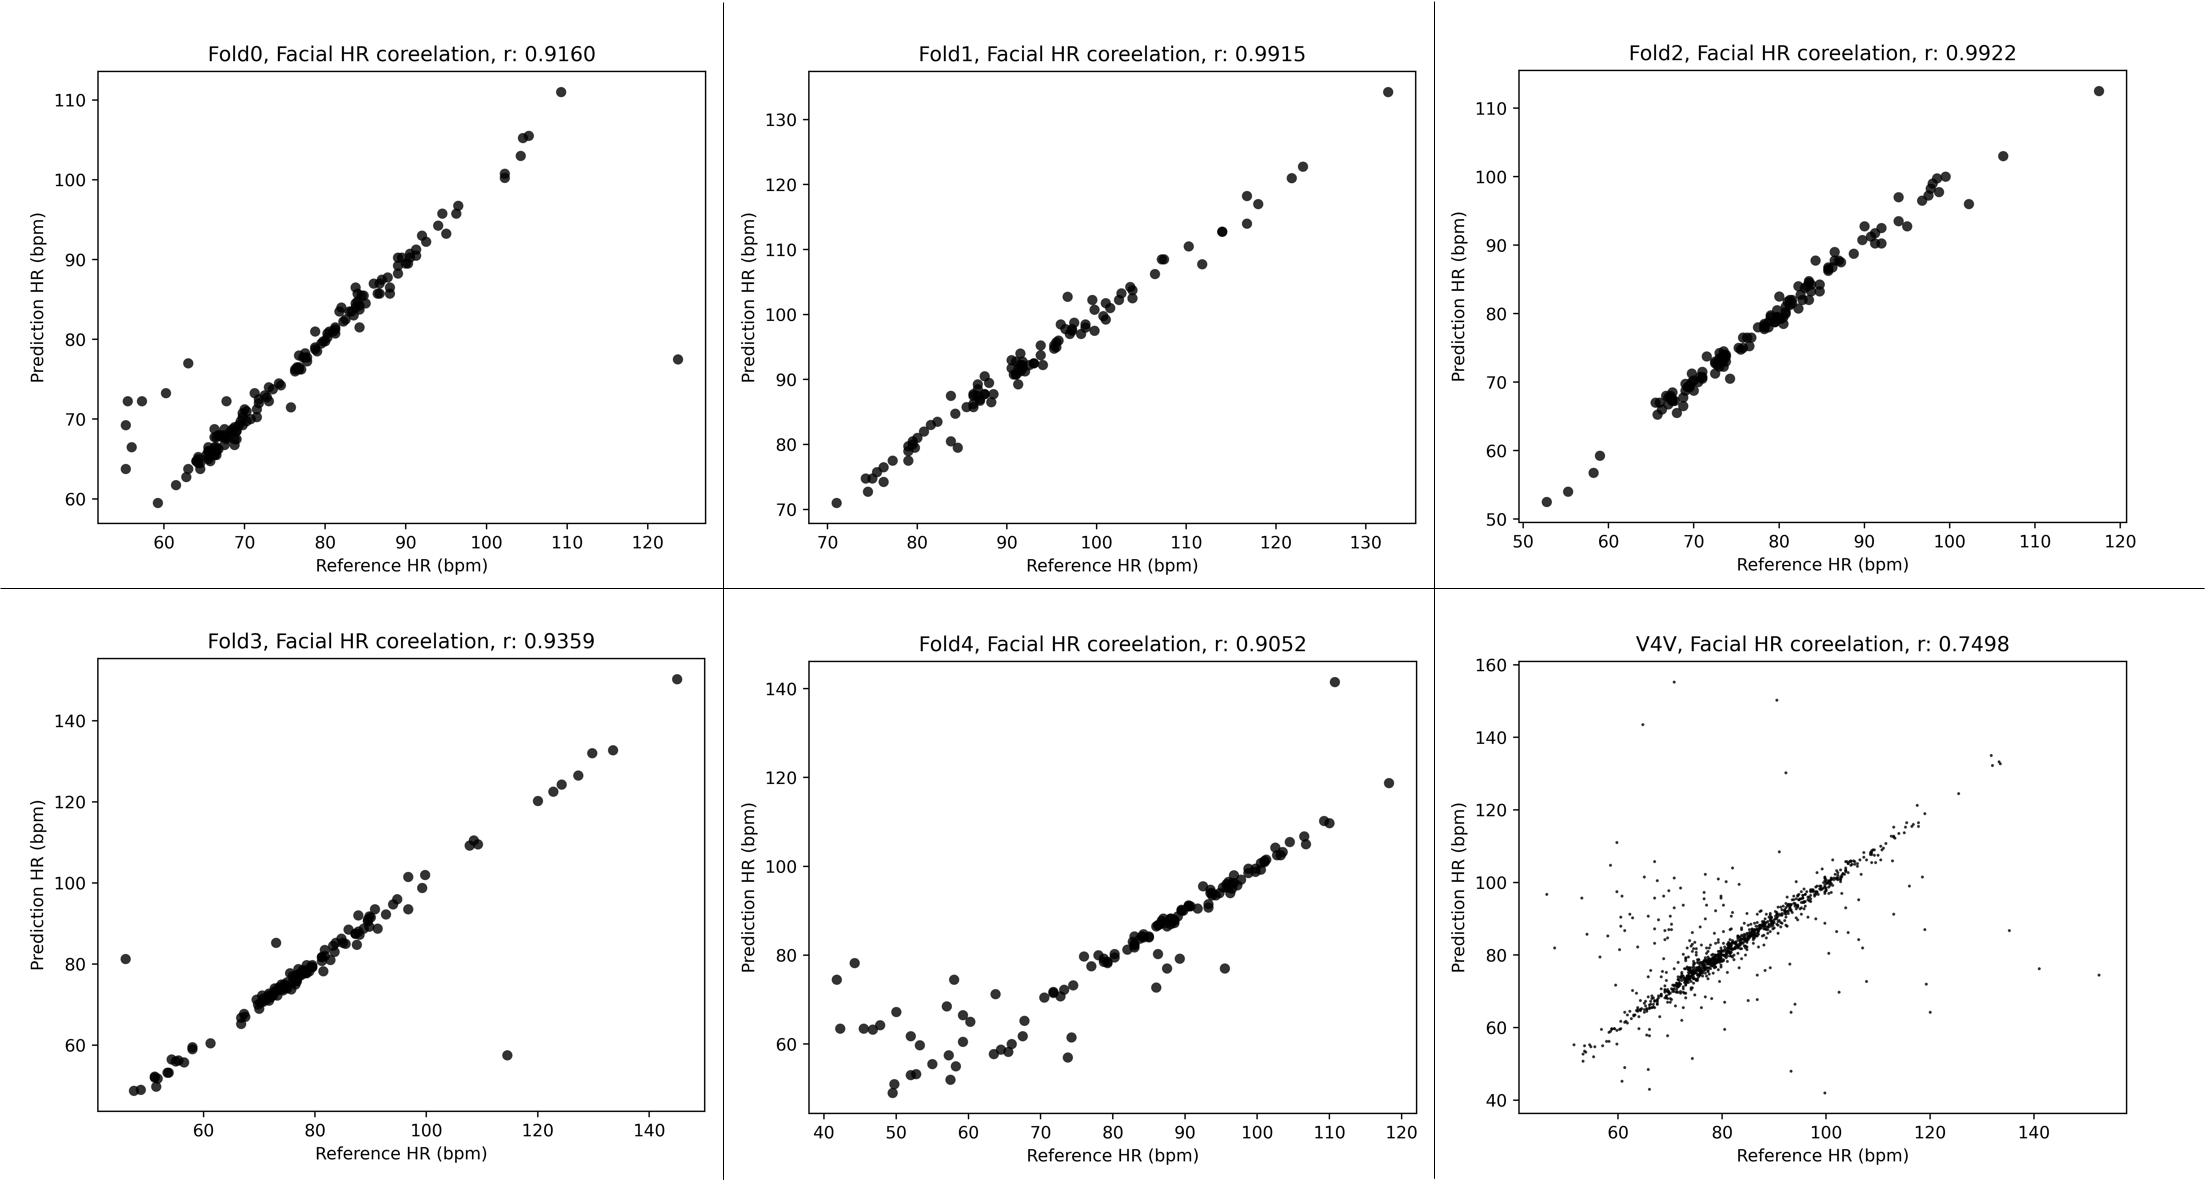
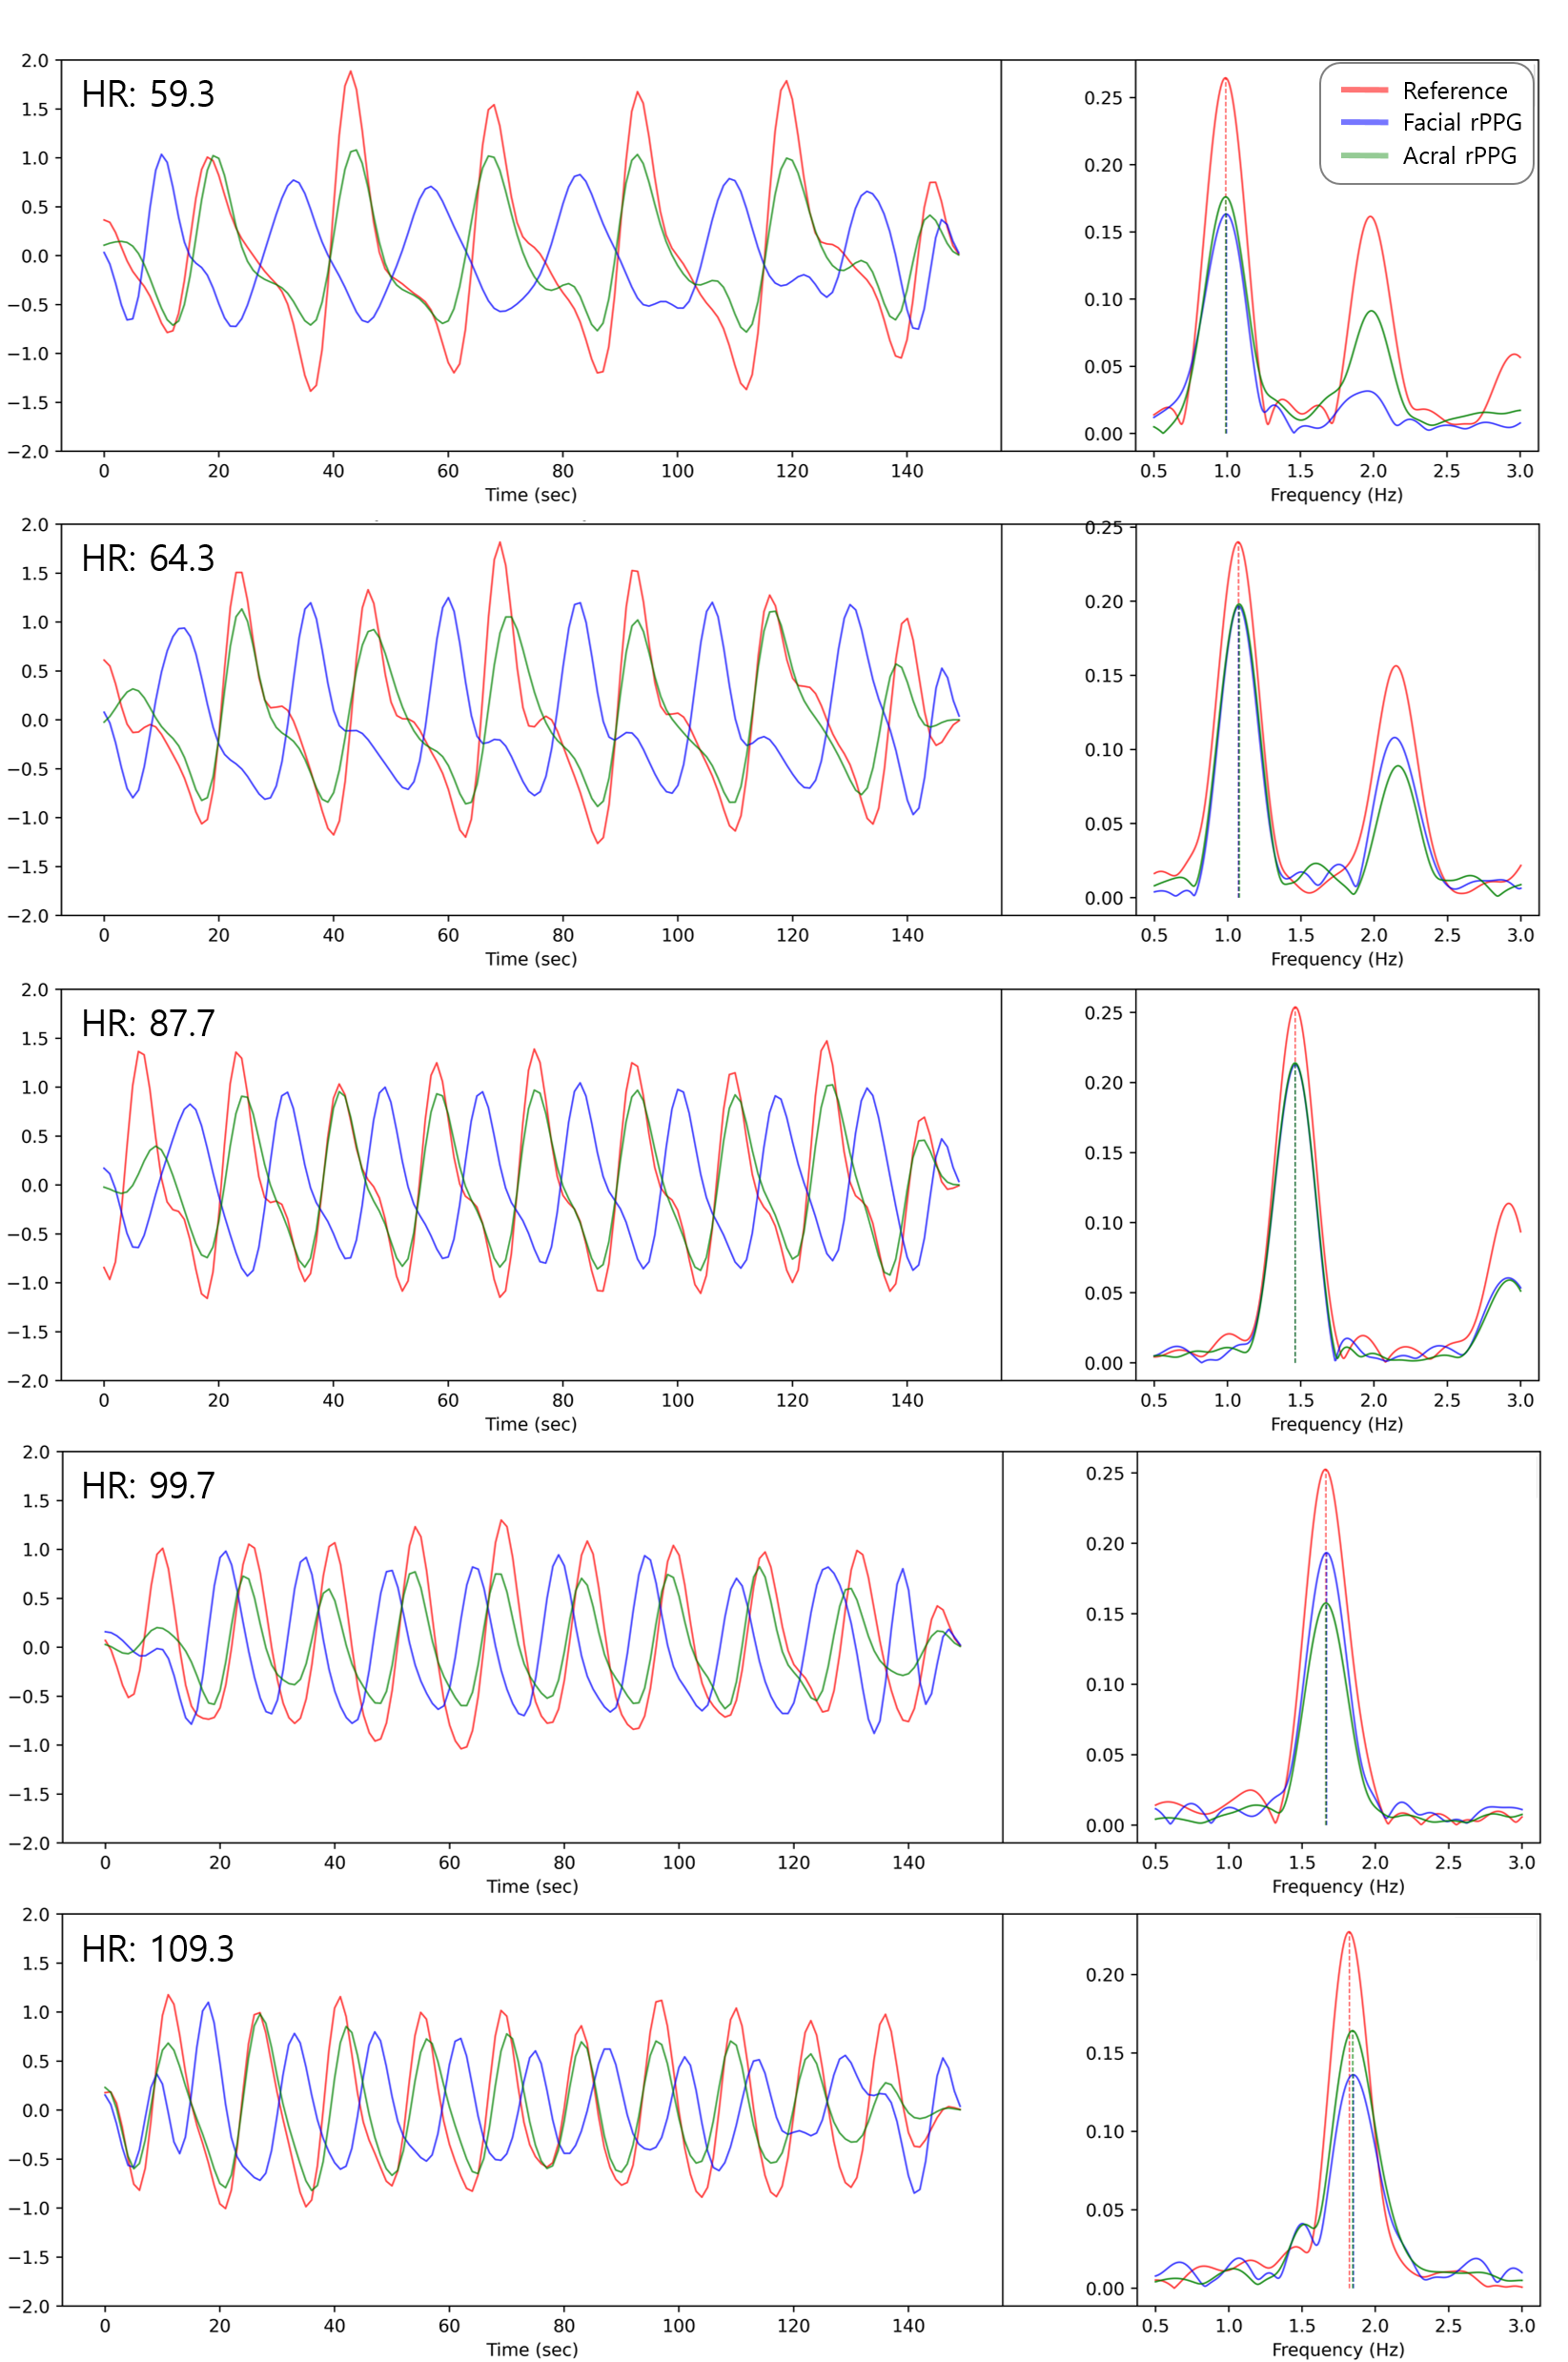
In this section, we compare the heart rate estimation performance of the proposed algorithm with previous methods using the public dataset MMSE-HR. To deal with the size of the MMSE-HR database, we employed the 5-fold cross-validation method for heart rate estimation, and the folds were split independently between subjects to demonstrate generalizability. Table. 1 presents the average heart rate estimation performance of facial and acral rPPG. The proposed method achieved MAE, RMSE, and r of 1.85, 4.51, and 0.948, respectively, and outperformed previous deep learning-based approaches. The Pearson correlation of predicted and actual heart rate based on facial rPPG per fold is shown in Fig. 5. This graphs represent a linear trend, indicating a significant similarity between the predicted and actual heart rate. Algorithms (Nowara et al. [2021], Jaiswal & Meenpal [2022], Ouzar et al. [2023]) with short input image sequences provide fast inference times but at the cost of higher error rates. Video transformer-based algorithms such as Yu et al. [2022] and Yu et al. [2023] show considerable performance in cross-dataset tests. However, they require high-performance computing equipment due to their extensive parameters and computational demands. Additionally, Fig. 6 shows the 2 predicted rPPG and their phase differences as the cardiac cycle increases. Comparing the 2 approaches in our proposed method in Table. 1, it indicates that the heart rate estimation error based on the facial rPPG is lower than the acral rPPG. These experimental findings suggest that forcing the rPPG phase leads to decreased model performance and emphasize the importance of inferring actual pulse waves from captured region.
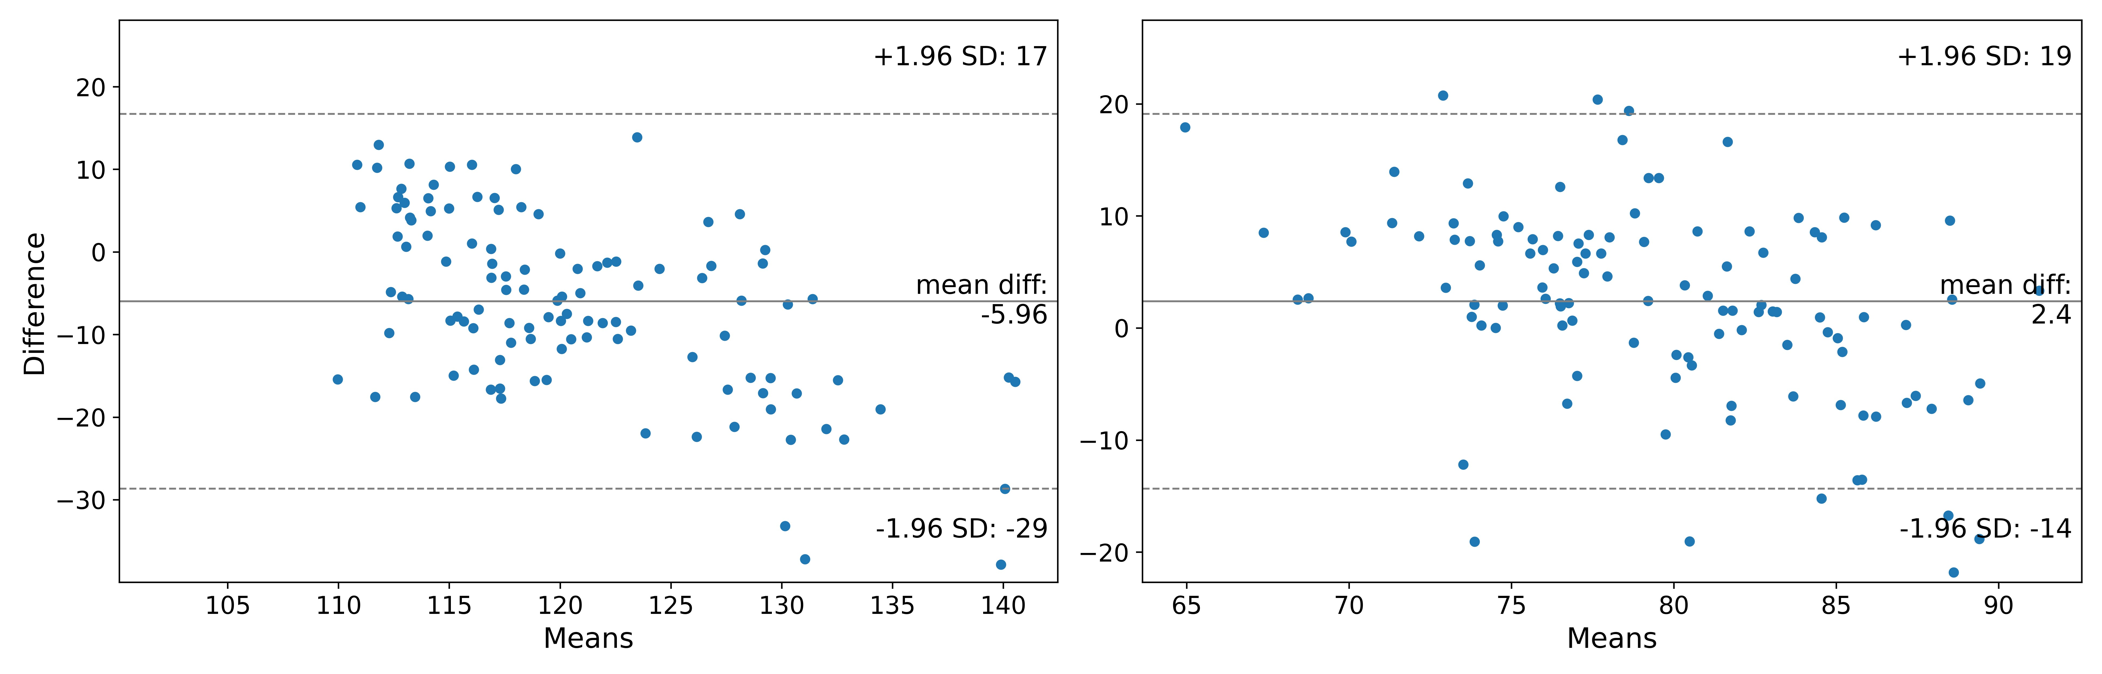
The proposed BBP-Net for blood pressure estimation also outperformed the existing methods, achieving MAE and RMSE of 10.19 and 13.01 for SBP and 7.09 and 8.86 for DBP, respectively. Table. 2 presents the results of the blood pressure estimation experiment on the MMSE-HR database, and Fig. 7 shows the results of the Bland-Altman plot. The Rong & Li [2021] and Schrumpf et al. [2021] algorithms extracted rPPG using a mathematical approach and estimated blood pressure through handcrafted features and deep learning-based models, respectively. These studies are similar to our approach in extracting rPPG as an intermediate step. However, our method improves performance by considering phase-shifted information for blood pressure estimation. Chen et al. [2023] proposed a blood pressure estimation model based on a 2 dimensional spatiotemporal map, a video preprocessing technique based on the YUV color space. However, they neglect pulse waves at the acral sites of the body, resulting in higher SBP and DBP error rates compared to the proposed method. The experimental results in Table. 2 represent that the temporal information in the pulse wave is meaningful for non-contact blood pressure estimation.
4.3 Quantitative results on V4V database
In this section, we conducted experiments on V4V database to compare the heart rate estimation performance of the proposed DRP-Net with existing algorithms and the experimental results are shown in Table. 3. The experiments are conducted on the training and test data, and the graph 6 in Fig. 5 shows a Pearson correlation plot of the predicted and actual heart rates. The metrics for DRP-Net heart rate estimation performance using V4V are the same as for the MMSE-HR database. The proposed method using face rPPG outperformed in MAE and r, with 3.83 and 0.75, respectively. Additionally, the proposed method with acral rPPG achieved MAE, RMSE, and r of 4.13, 10.14, and 0.72, respectively This result is a slightly higher error than facial rPPG, similar to the results on the MMSE-HR database. The performance comparison between Yu et al. [2019] and DRP-Net shows that the wider receptive fields through 3D atrous convolution is beneficial for heart rate estimation than the encoder-decoder structure based on 3D CNN. The performance comparison with Kim et al. [2022] shows contrasting MAE and RMSE results. It indicates that the outliers of heart rate predicted by the proposed method are larger, while the average error is smaller.
| Methods | SBP | DBP | |||||
| MAE (mmHg) | RMSE | MAE (mmHg) | RMSE | ||||
| AlexNet | 18.582 | - | 13.46 | - | |||
| ResNet | 15.456 | - | 12.528 | - | |||
| LSTM | 14.579 | - | 13.119 | - | |||
| NIBPP [Schrumpf et al., 2021] | 31.359 | - | 20.621 | - | |||
|
15.121 | - | 11.169 | - | |||
|
13.749 | - | 14.833 | - | |||
| Ours | 13.640 | 16.782 | 9.402 | 11.903 | |||
The blood pressure estimation results of BBP-Net is shown in Table. 4. Our proposed algorithm achieved MAE and RMSE of 13.64, 16.78 and 9.40, 11.90 for SBP and DBP, respectively. The performance of the baseline algorithms (AlexNet, ResNet, LSTM) is reported in Hamoud et al. [2023]. Blood pressure estimation performance of BBP-Net outperforms baseline algorithms such as AlexNet, ResNet, and LSTM, as well as Schrumpf et al. [2021] and the algorithm proposed by Hamoud et al. [2023]. While the SBP and DBP estimation performance presented in the Hamoud et al. [2023] has the limitation that each performance is a combination of different models, the BBP-Net estimates both blood pressures simultaneously. As shown in the experimental results on the V4V database, the rPPG estimated from the 2 body parts and its phase-shifted information are effective in improving the estimation performance of blood pressure.
4.4 Ablation study
|
rPPG | Fold 0 | Fold 1 | Fold 2 | Fold 3 | Fold 4 | Average | ||
| 2 | facial | 11.22 | 13.71 | 9.79 | 11.96 | 15.15 | 12.37 | ||
| acral | 12.17 | 11.31 | 10.34 | 11.73 | 14.10 | 11.93 | |||
| 4 | facial | 1.86 | 2.56 | 1.90 | 2.32 | 4.26 | 2.58 | ||
| acral | 1.79 | 2.79 | 1.95 | 2.17 | 4.05 | 2.55 | |||
| 6 | facial | 1.58 | 1.08 | 0.88 | 1.79 | 3.58 | 1.78 | ||
| acral | 1.46 | 1.00 | 0.82 | 1.97 | 4.29 | 1.91 | |||
| 8 | facial | 1.20 | 1.15 | 0.91 | 1.06 | 3.11 | 1.49 | ||
| acral | 1.13 | 1.04 | 0.58 | 1.45 | 3.20 | 1.48 |
| Augmentation | rPPG | MAE (BPM) |
| X | facial | 2.149 |
| acral | 2.002 | |
| O | facial | 1.783 |
| acral | 1.909 |
| Peak valley loss | rPPG | MAE (BPM) |
| X | facial | 3.670 |
| acral | 4.178 | |
| O | facial | 1.783 |
| acral | 1.909 |
The window size of the input image sequence is an important heuristic parameter in terms of the computational power and the latency of model. Smaller window sizes have the advantage of lower latency in inference time, while the loss of temporal information can decrease the performance. Table. 5 presents the performance with different window size and fold, and it demonstrates that the average heart rate estimation performance increases as the window size increases. The reduced performance observed at a window size of 2 seconds is due to the dilation ratio of DRP-Net being relatively large compared to the sequence information. However, estimation of blood pressure requires long temporal information of rPPG, therefore we selected window size of 6 seconds and a dilation ratio of 4. Table. 6 indicates the results of heart rate estimation of DRP-Net with and without data augmentation techniques. The performance of all estimated rPPG improved after data augmentation. This result demonstrate that training with data from bradycardia and tachycardia via frame interpolation and down-sampling improves the generalization performance of the model. In addition, the experimental results of excluding the peak and valley guides from the loss function are demonstrated in Table. 7 to investigate the impact of . The average MAE without increases about 2 BPM, which indicates that the amplitude information in the PPG contributes the improvement of heart rate estimation performance.
| Input rPPG | SBP MAE (mmHg) | DBP MAE (mmHg) |
| facial rPPG | 12.323 | 9.503 |
| acral rPPG | 13.190 | 8.669 |
| both | 10.192 | 7.090 |
| Scaling sigmoid function | SBP | DBP | |||
| MAE (mmHg) | RMSE | MAE (mmHg) | RMSE | ||
| X | 19.57 | 25.34 | 10.15 | 13.34 | |
| O | 10.19 | 13.01 | 7.09 | 8.86 | |
The ablation study for the blood pressure estimation model consists of the types of input rPPG and the existence of the scaling sigmoid function. Table. 8 presents the estimation error of the SBP and DBP based on the facial or acral rPPG, and the estimation performance of both cases are lower than using dual rPPG. This results indicate that the phase-shifted information of pulse waves in different body parts contributes to improved estimation performance of SBP and DBP. Additionally, Table. 9 shows the performance of blood pressure estimation with and without the scaling sigmoid function. Without the scaling sigmoid function, the MAE for SBP and DBP was significantly increased to 9 mmHg and 3 mmHg, respectively. These experimental results suggest the importance of guiding the model towards a reasonable blood pressure range.
4.5 International standards and blood pressure estimation performance
| 5 mmHg | 10 mmHg | 15 mmHg | ||
| MMSE-HR | SBP | 46.02 % | 65.49 % | 75.22 % |
| DBP | 81.42 % | 92.04 % | 94.69 % | |
| V4V | SBP | 65.24 % | 72.94 % | 81.39 % |
| DBP | 64.17 % | 80.11 % | 86.63 % | |
| BHS standard | grade A | 60 % | 85 % | 95 % |
| grade B | 50 % | 75 % | 90 % | |
| grade C | 40 % | 65 % | 85 % |
| ME (mmHg) | SDE (mmHg) | ||
| MMSE-HR | SBP | -0.13 | 16.78 |
| DBP | 1.58 | 11.8 | |
| V4V | SBP | 5.96 | 11.57 |
| DBP | -2.4 | 8.53 | |
| AAMI standard | 5 | 8 |
We compare the performance of our proposed blood pressure estimation algorithm with international standards, the British Hypertension Society (BHS) [O’Brien et al., 1990] and The Association for the Advancement of Medical Instrumentation (AAMI) [Stergiou et al., 2018]. The BHS standard evaluates the absolute number of blood pressure estimation errors as a cumulative percentage, and Table. 10 presents the standards and blood pressure estimation performance. On the MMSE-HR database, the proposed method achieves grade B with 81 % DBP estimation performance for errors of 5 mmHg or less. Additionally, DBP estimation performance on the V4V database also reached grade C. The AAMI standard in Table. 11 indicates that blood pressure estimation performance meets the standard when the mean error (ME) and standard deviation error (SDE) are under 5 and 8 mmHg, respectively. In the MMSE-HR database, the estimation performance of SBP and DBP for ME is -0.13 mmHg and 1.58 mmHg, respectively, which meets the standard. The result on the V4V database shows that ME is 5.96 mmHg at SBP and -2.4 mmHg at DBP.
5 Conclusion
This paper proposed the deep learning framework based on facial images for contactless heart rate and blood pressure estimation. We assumed that phase differences exist between pulse waves due to inconsistencies in data measurement sites. Based on this assumption, we improved blood pressure estimation performance and demonstrated with extensive experiments. To estimate pulse waves of 2 physiological sites from facial images, we proposed the DRP-Net that focuses on spatiotemporal feature extraction. DRP-Net estimates facial rPPG using information in the time-global frequency domain to predict pulse waves from the face, and predicts acral rPPG that mimic the phase of PPG. As a result, the proposed model achieved the MAE of 1.78 and 1.91 BPM based on acral and facial rPPG in heart rate estimation task. Moreover, we proposed BBP-Net to estimate blood pressure based on the phase analysis and temporal features of the dual rPPG, applying the modified sigmoid function to bound the predicted blood pressure to the reasonable range. In the blood pressure estimation task, we achieved MAE of SBP and DBP of 10.19 mmHg and 7.09 mmHg, respectively. However, the public datasets used in this study have the limitation in that they do not include pulse wave data from the face, making it unable to verify the accuracy of the predicted facial rPPG phase. We were also constrained by the absence of other public datasets containing both facial images and blood pressure data, limiting experimentation in various domains. Inspired by these limitations, we have plan to collect real-world dataset which includes facial videos, PPG, and blood pressure with various data collection scenarios and develop sensor acquisition system in our future research. Additionally, we will conduct research on improving the performance of physiological measurement system using the collected real-world dataset.
References
- Aggarwal & Pandey [2023] Aggarwal, S., & Pandey, K. (2023). Early identification of pcos with commonly known diseases: obesity, diabetes, high blood pressure and heart disease using machine learning techniques. Expert Systems with Applications, 217, 119532.
- Alnaggar et al. [2023] Alnaggar, M., Siam, A. I., Handosa, M., Medhat, T., & Rashad, M. (2023). Video-based real-time monitoring for heart rate and respiration rate. Expert Systems with Applications, 225, 120135.
- Barvik et al. [2021] Barvik, D., Cerny, M., Penhaker, M., & Noury, N. (2021). Noninvasive continuous blood pressure estimation from pulse transit time: A review of the calibration models. IEEE Reviews in Biomedical Engineering, 15, 138–151.
- Bobbia et al. [2019] Bobbia, S., Macwan, R., Benezeth, Y., Mansouri, A., & Dubois, J. (2019). Unsupervised skin tissue segmentation for remote photoplethysmography. Pattern Recognition Letters, 124, 82–90.
- Bousefsaf et al. [2022] Bousefsaf, F., Desquins, T., Djeldjli, D., Ouzar, Y., Maaoui, C., & Pruski, A. (2022). Estimation of blood pressure waveform from facial video using a deep u-shaped network and the wavelet representation of imaging photoplethysmographic signals. Biomedical Signal Processing and Control, 78, 103895.
- Chen & McDuff [2018] Chen, W., & McDuff, D. (2018). Deepphys: Video-based physiological measurement using convolutional attention networks. In Proceedings of the european conference on computer vision (ECCV) (pp. 349–365).
- Chen et al. [2023] Chen, Y., Zhuang, J., Li, B., Zhang, Y., & Zheng, X. (2023). Remote blood pressure estimation via the spatiotemporal mapping of facial videos. Sensors, 23, 2963.
- Collins [1976] Collins, J. R. (1976). Robust estimation of a location parameter in the presence of asymmetry. The Annals of Statistics, (pp. 68–85).
- De Haan & Jeanne [2013] De Haan, G., & Jeanne, V. (2013). Robust pulse rate from chrominance-based rppg. IEEE Transactions on Biomedical Engineering, 60, 2878–2886.
- Etemadi et al. [2023] Etemadi, M., Abkenar, S. B., Ahmadzadeh, A., Kashani, M. H., Asghari, P., Akbari, M., & Mahdipour, E. (2023). A systematic review of healthcare recommender systems: Open issues, challenges, and techniques. Expert Systems with Applications, 213, 118823.
- Fuchs & Whelton [2020] Fuchs, F. D., & Whelton, P. K. (2020). High blood pressure and cardiovascular disease. Hypertension, 75, 285–292.
- Gaidai et al. [2023] Gaidai, O., Cao, Y., & Loginov, S. (2023). Global cardiovascular diseases death rate prediction. Current Problems in Cardiology, (p. 101622).
- Ganti et al. [2020] Ganti, V. G., Carek, A. M., Nevius, B. N., Heller, J. A., Etemadi, M., & Inan, O. T. (2020). Wearable cuff-less blood pressure estimation at home via pulse transit time. IEEE journal of biomedical and health informatics, 25, 1926–1937.
- Geddes et al. [1981] Geddes, L., Voelz, M., Babbs, C., Bourland, J., & Tacker, W. (1981). Pulse transit time as an indicator of arterial blood pressure. psychophysiology, 18, 71–74.
- Gupta et al. [2023] Gupta, K., Bajaj, V., & Ansari, I. A. (2023). A support system for automatic classification of hypertension using bcg signals. Expert Systems with Applications, 214, 119058.
- Hamoud et al. [2023] Hamoud, B., Kashevnik, A., Othman, W., & Shilov, N. (2023). Neural network model combination for video-based blood pressure estimation: New approach and evaluation. Sensors, 23, 1753.
- Hu et al. [2022] Hu, Q., Wang, D., & Yang, C. (2022). Ppg-based blood pressure estimation can benefit from scalable multi-scale fusion neural networks and multi-task learning. Biomedical Signal Processing and Control, 78, 103891.
- Huang et al. [2022] Huang, B., Chen, W., Lin, C.-L., Juang, C.-F., & Wang, J. (2022). Mlp-bp: A novel framework for cuffless blood pressure measurement with ppg and ecg signals based on mlp-mixer neural networks. Biomedical Signal Processing and Control, 73, 103404.
- Jaiswal & Meenpal [2022] Jaiswal, K. B., & Meenpal, T. (2022). Heart rate estimation network from facial videos using spatiotemporal feature image. Computers in Biology and Medicine, 151, 106307.
- Jia et al. [2022] Jia, M., Qin, Y., Song, C., Yue, Z., & Ding, S. (2022). Cebpm: A cloud-edge collaborative noncontact blood pressure estimation model. IEEE Transactions on Instrumentation and Measurement, 71, 1–12.
- Kim et al. [2022] Kim, D.-Y., Cho, S.-Y., Lee, K., & Sohn, C.-B. (2022). A study of projection-based attentive spatial–temporal map for remote photoplethysmography measurement. Bioengineering, 9, 638.
- Lewandowska et al. [2011] Lewandowska, M., Rumiński, J., Kocejko, T., & Nowak, J. (2011). Measuring pulse rate with a webcam—a non-contact method for evaluating cardiac activity. In 2011 federated conference on computer science and information systems (FedCSIS) (pp. 405–410). IEEE.
- Li et al. [2018] Li, X., Alikhani, I., Shi, J., Seppanen, T., Junttila, J., Majamaa-Voltti, K., Tulppo, M., & Zhao, G. (2018). The obf database: A large face video database for remote physiological signal measurement and atrial fibrillation detection. In 2018 13th IEEE international conference on automatic face & gesture recognition (FG 2018) (pp. 242–249). IEEE.
- Liu et al. [2021] Liu, X., Hill, B. L., Jiang, Z., Patel, S., & McDuff, D. (2021). Efficientphys: Enabling simple, fast and accurate camera-based vitals measurement. arXiv preprint arXiv:2110.04447, .
- Lu et al. [2021] Lu, H., Han, H., & Zhou, S. K. (2021). Dual-gan: Joint bvp and noise modeling for remote physiological measurement. In Proceedings of the IEEE/CVF conference on computer vision and pattern recognition (pp. 12404–12413).
- McDuff et al. [2022] McDuff, D., Hernandez, J., Liu, X., Wood, E., & Baltrusaitis, T. (2022). Using high-fidelity avatars to advance camera-based cardiac pulse measurement. IEEE Transactions on Biomedical Engineering, 69, 2646–2656.
- Miao et al. [2020] Miao, F., Wen, B., Hu, Z., Fortino, G., Wang, X.-P., Liu, Z.-D., Tang, M., & Li, Y. (2020). Continuous blood pressure measurement from one-channel electrocardiogram signal using deep-learning techniques. Artificial Intelligence in Medicine, 108, 101919.
- Niu et al. [2019] Niu, X., Han, H., Shan, S., & Chen, X. (2019). Vipl-hr: A multi-modal database for pulse estimation from less-constrained face video. In Computer Vision–ACCV 2018: 14th Asian Conference on Computer Vision, Perth, Australia, December 2–6, 2018, Revised Selected Papers, Part V 14 (pp. 562–576). Springer.
- Nowara et al. [2021] Nowara, E. M., McDuff, D., & Veeraraghavan, A. (2021). The benefit of distraction: Denoising camera-based physiological measurements using inverse attention. In Proceedings of the IEEE/CVF international conference on computer vision (pp. 4955–4964).
- O’Brien et al. [1990] O’Brien, E., Petrie, J., Littler, W., de Swiet, M., Padfield, P. L., O’Malley, K., Jamieson, M., Altman, D., Bland, M., & Atkins, N. (1990). The british hypertension society protocol for the evaluation of automated and semi-automated blood pressure measuring devices with special reference to ambulatory systems. Journal of hypertension, 8, 607–619.
- Ouzar et al. [2023] Ouzar, Y., Djeldjli, D., Bousefsaf, F., & Maaoui, C. (2023). X-ippgnet: A novel one stage deep learning architecture based on depthwise separable convolutions for video-based pulse rate estimation. Computers in Biology and Medicine, 154, 106592.
- Panwar et al. [2020] Panwar, M., Gautam, A., Biswas, D., & Acharyya, A. (2020). Pp-net: A deep learning framework for ppg-based blood pressure and heart rate estimation. IEEE Sensors Journal, 20, 10000–10011.
- Park et al. [2018] Park, J., Woo, S., Lee, J.-Y., & Kweon, I. S. (2018). Bam: Bottleneck attention module. arXiv preprint arXiv:1807.06514, .
- Perret-Guillaume et al. [2009] Perret-Guillaume, C., Joly, L., & Benetos, A. (2009). Heart rate as a risk factor for cardiovascular disease. Progress in cardiovascular diseases, 52, 6–10.
- Poh et al. [2010] Poh, M.-Z., McDuff, D. J., & Picard, R. W. (2010). Advancements in noncontact, multiparameter physiological measurements using a webcam. IEEE transactions on biomedical engineering, 58, 7–11.
- Reda et al. [2022] Reda, F., Kontkanen, J., Tabellion, E., Sun, D., Pantofaru, C., & Curless, B. (2022). Film: Frame interpolation for large motion. In European Conference on Computer Vision (pp. 250–266). Springer.
- Revanur et al. [2021] Revanur, A., Li, Z., Ciftci, U. A., Yin, L., & Jeni, L. A. (2021). The first vision for vitals (v4v) challenge for non-contact video-based physiological estimation. In Proceedings of the IEEE/CVF International Conference on Computer Vision (pp. 2760–2767).
- Rong & Li [2021] Rong, M., & Li, K. (2021). A blood pressure prediction method based on imaging photoplethysmography in combination with machine learning. Biomedical Signal Processing and Control, 64, 102328.
- Schrumpf et al. [2021] Schrumpf, F., Frenzel, P., Aust, C., Osterhoff, G., & Fuchs, M. (2021). Assessment of non-invasive blood pressure prediction from ppg and rppg signals using deep learning. Sensors, 21, 6022.
- Soleymani et al. [2011] Soleymani, M., Lichtenauer, J., Pun, T., & Pantic, M. (2011). A multimodal database for affect recognition and implicit tagging. IEEE transactions on affective computing, 3, 42–55.
- Stergiou et al. [2018] Stergiou, G. S., Alpert, B., Mieke, S., Asmar, R., Atkins, N., Eckert, S., Frick, G., Friedman, B., Graßl, T., Ichikawa, T. et al. (2018). A universal standard for the validation of blood pressure measuring devices: Association for the advancement of medical instrumentation/european society of hypertension/international organization for standardization (aami/esh/iso) collaboration statement. Hypertension, 71, 368–374.
- Stricker et al. [2014] Stricker, R., Müller, S., & Gross, H.-M. (2014). Non-contact video-based pulse rate measurement on a mobile service robot. In The 23rd IEEE International Symposium on Robot and Human Interactive Communication (pp. 1056–1062). IEEE.
- Wang et al. [2016] Wang, W., Den Brinker, A. C., Stuijk, S., & De Haan, G. (2016). Algorithmic principles of remote ppg. IEEE Transactions on Biomedical Engineering, 64, 1479–1491.
- Wu et al. [2022] Wu, B.-F., Wu, B.-J., Tsai, B.-R., & Hsu, C.-P. (2022). A facial-image-based blood pressure measurement system without calibration. IEEE Transactions on Instrumentation and Measurement, 71, 1–13.
- Yu et al. [2020] Yu, Z., Li, X., Niu, X., Shi, J., & Zhao, G. (2020). Autohr: A strong end-to-end baseline for remote heart rate measurement with neural searching. IEEE Signal Processing Letters, 27, 1245–1249.
- Yu et al. [2019] Yu, Z., Li, X., & Zhao, G. (2019). Remote photoplethysmograph signal measurement from facial videos using spatio-temporal networks. arXiv preprint arXiv:1905.02419, .
- Yu et al. [2023] Yu, Z., Shen, Y., Shi, J., Zhao, H., Cui, Y., Zhang, J., Torr, P., & Zhao, G. (2023). Physformer++: Facial video-based physiological measurement with slowfast temporal difference transformer. International Journal of Computer Vision, 131, 1307–1330.
- Yu et al. [2022] Yu, Z., Shen, Y., Shi, J., Zhao, H., Torr, P. H., & Zhao, G. (2022). Physformer: Facial video-based physiological measurement with temporal difference transformer. In Proceedings of the IEEE/CVF conference on computer vision and pattern recognition (pp. 4186–4196).
- Zhang et al. [2016a] Zhang, K., Zhang, Z., Li, Z., & Qiao, Y. (2016a). Joint face detection and alignment using multitask cascaded convolutional networks. IEEE signal processing letters, 23, 1499–1503.
- Zhang et al. [2016b] Zhang, Z., Girard, J. M., Wu, Y., Zhang, X., Liu, P., Ciftci, U., Canavan, S., Reale, M., Horowitz, A., Yang, H. et al. (2016b). Multimodal spontaneous emotion corpus for human behavior analysis. In Proceedings of the IEEE conference on computer vision and pattern recognition (pp. 3438–3446).