These authors contributed equally to this work.
These authors contributed equally to this work.
[2]\fnmVijayakumar \surMurugesan
[1]\fnmMatthias \surTroyer
1]\orgdivAzure Quantum, \orgnameMicrosoft, \orgaddress\streetOne Microsoft Way, \cityRedmond, \stateWA, \postcode98052, \countryUSA
2]\orgdivPhysical and Computational Sciences Directorate, \orgnamePacific Northwest National Laboratory, \orgaddress\street902 Battelle Blvd., \cityRichland, \stateWA, \postcode99352, \countryUSA
3]\orgdivMicrosoft Surface, \orgnameMicrosoft, \orgaddress\streetOne Microsoft Way, \cityRedmond, \stateWA, \postcode98052, \countryUSA
Accelerating computational materials discovery with artificial intelligence and cloud high-performance computing: from large-scale screening to experimental validation
Abstract
High-throughput computational materials discovery has promised significant acceleration of the design and discovery of new materials for many years. Despite a surge in interest and activity, the constraints imposed by large-scale computational resources present a significant bottleneck. Furthermore, examples of large-scale computational discovery carried through experimental validation remain scarce, especially for materials with product applicability. Here we demonstrate how this vision became reality by first combining state-of-the-art artificial intelligence (AI) models and traditional physics-based models on cloud high-performance computing (HPC) resources to quickly navigate through more than 32 million candidates and predict around half a million potentially stable materials. By focusing on solid-state electrolytes for battery applications, our discovery pipeline further identified 18 promising candidates with new compositions, and rediscovered a decade’s worth of collective knowledge in the field as a byproduct. By employing around one thousand virtual machines (VMs) in the cloud, this process took less than 80 hours. We then synthesized and experimentally characterized the structures and conductivities of our top candidates, the NaxLi3-xYCl6 (0 3) series, demonstrating the potential of these compounds to serve as solid electrolytes. Additional candidate materials that are currently under experimental investigation could offer more examples of the computational discovery of new phases of Li- and Na-conducting solid electrolytes. We believe that this unprecedented approach of synergistically integrating AI models and cloud HPC not only accelerates materials discovery but also showcases the potency of AI-guided experimentation in unlocking transformative scientific breakthroughs with real-world applications.
keywords:
materials discovery, high-performance computing, artificial intelligence, solid-state electrolytes1 Introduction
Materials discovery has been integral to human progress throughout history, marking pivotal shifts in civilization from the stone age to the modern era. Traditionally, materials have been discovered predominantly through exploration and trial-and-error laboratory experiments. In the last few decades, computational methods have become increasingly popular for predicting and understanding material properties. However, the goal of discovering materials with targeted properties in silico has yet to be realized. In recent years, advancements in computational science and AI, together with curated datasets emerging in public databases like the Materials Project [1], AFLOWLIB [2], Open Quantum Materials Database [3], Materials Cloud [4], and others have created opportunities for a new age of materials discovery, where computational approaches take the lead in the prediction-synthesis-characterization cycle.
ML models for materials science have the potential to vastly expedite the computational discovery process. State-of-the-art machine learning (ML) models can predict the results of physics-based quantum mechanical calculations but are several orders of magnitude faster, making them ideal for predicting general material properties [5, 6, 7]. In addition to direct property prediction, combining universal ML potentials such as M3GNet [8], CHGNet [9], and GNoME [10] has made it possible to perform geometric optimization, and hence evaluate thermodynamic stability, for arbitrary combinations of elements and structures. The significant speed advantage of ML-based techniques over direct simulation has made it possible to explore materials across a vast chemical space that greatly exceeds the number of known materials.
Some recent studies have produced massive amounts of data on hypothetical materials [8, 10], but without experimental validation. Autonomous labs have shown early success in synthesizing materials [11], but the technical validation of those materials’ functional properties remains to be demonstrated. Discovering technologically relevant materials is likely orders of magnitude harder than discovering synthesizable materials because the former are usually outliers in the materials distribution with unique, sometimes counter-intuitive, combinations of properties [12].
Even with the acceleration offered by ML-based potentials over quantum mechanical energy and force calculations, the lack of required large-scale computational resources is a challenge that has slowed progress. While it is relatively trivial to generate material candidates, the evaluation of those candidates still requires significant computing resources. This challenge can be overcome through cloud HPC, the scale of which has recently become widely known due to its ability to train and host large-scale AI models like GPT-4, which require a massive number of graphics processing units. In the realm of computational materials discovery, these advancements imply that cloud computing can effectively manage smaller-scale, complex calculation jobs, greatly increasing the number of material candidates that can be evaluated computationally. Additionally, these reproducible cloud-based workflows substantially reduce entry barriers for new users, thereby democratizing the materials discovery process.
In this work, we demonstrate the utility and impact of the combined strengths of AI and cloud HPC to design and discover materials. We showcase the discovery and experimental validation of new material compositions with targeted properties by filtering a vast pool of potential solid-state electrolytes for battery technology applications. The outcomes of this process are noteworthy for their rapid identification of promising material candidates, reflecting insights that have emerged over the last decade in this field. This efficient screening and discovery process significantly reduces the overall time from concept to solution in materials discovery.
2 Large-scale materials discovery
2.1 Exploring a vast chemical space
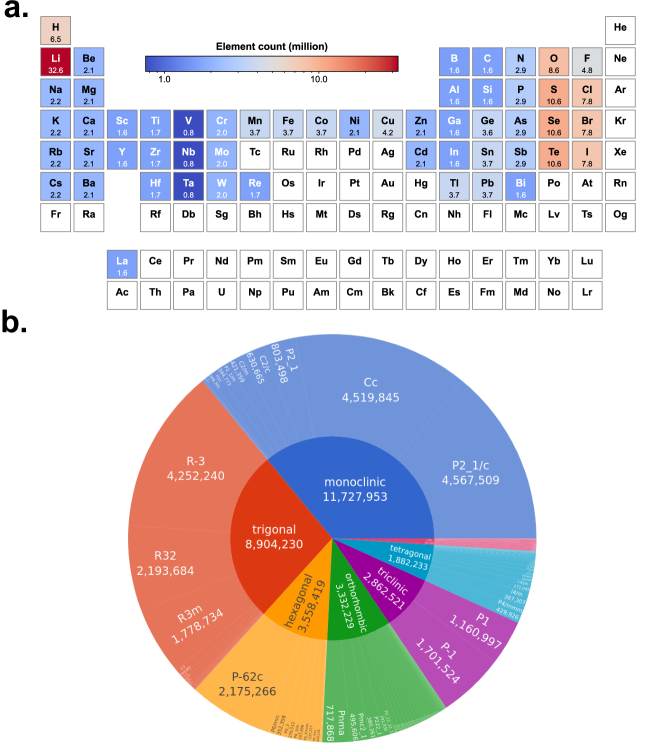
Structure candidates were generated based on ionic substitution to known crystal structures. This approach has previously demonstrated success in helping discover new materials in various applications [14, 15, 16, 17]. However, unlike previous approaches, the current work does not constrain substitution by ionic similarity learned from mining materials databases [14] and therefore has a broader search space. We chose 54 elements, indicated by the colored cells in Figure 1a, as our starting point for the most likely compositions of Li-conducting solid-state electrolytes. We chose to remove later-row transition metals and most lanthanides because those are not commonly found in Li battery materials. Noble gases and actinides are typically not part of viable functional materials applications and hence were not included.
Common oxidation states of the 54 elements were obtained from Pymatgen [18] data. To generate the initial structure candidates, we used the 2022 version of the Inorganic Crystal Structure Database (ICSD) [19], and then used Pymatgen [18] StructureMatcher to match similar structures and obtain structure prototypes. We used only the ordered structures with integer site occupancies that quantum mechanical calculations can handle, and performed iso-valent substitutions to those prototypes, which generated 32,598,079 initial candidates. The space groups of those candidates are shown in Figure 1b. Our candidate materials cover 184 out of 230 space groups and represent all seven crystal systems. Compared to the candidates generated in matterverse.ai [8], the current approach expands the number of prototype structures, does not have a 50-atom limit, and is not limited to a specific group of anions.
The distribution of candidates in this study covers most of the technically interesting elements and space groups. Notably, the substitution approach used here to identify candidate structures is intentionally broad but is not necessarily thorough for a given composition. This contrasts with other prediction approaches for crystal structures such as AIRSS [20], USPEX [21], and CALYPSO [22], which have a narrower scope but are more thorough. Our broader search strategy has a less-biased focus on specific regions of material space and therefore should lead to a more diverse selection of new materials.
2.2 Screening workflow for stable materials and solid electrolytes
This large space of materials candidates was first screened for stability, producing 589,609 candidates that were predicted to be stable. From this pool of candidates, we selected materials with desired properties for solid-state electrolytes. Our funnel-based screening workflow started with property filters that use AI models to quickly screen initial candidates, and then applied physics-based density functional theory (DFT) calculations to serve as high-accuracy filters on the most promising candidates (Figure 2). In general, a filtering process should start with the fastest calculations to focus computational effort on the top candidates.
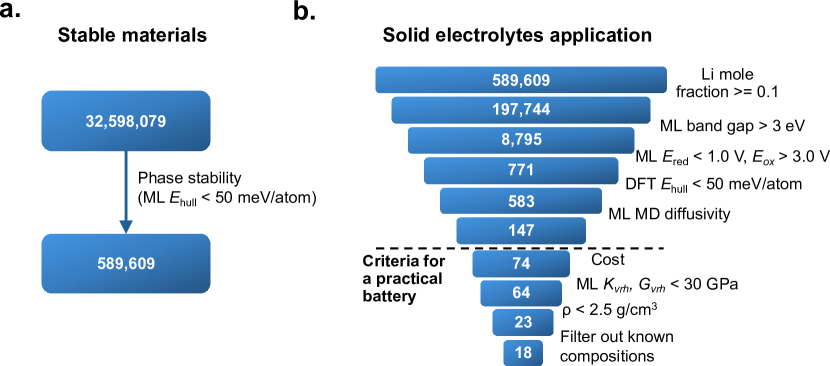
Figure 2 illustrates these two workflow stages. The first stage, shown in Figure 2a, identified stable materials using ML potentials to perform structural relaxation and assess thermodynamic phase stabilities using pymatgen [18] and Materials Project reference data [1]. For compositions with multiple polymorphic structures, we kept only the lowest energy structure. This step reduced the number of candidates from 32.6 million to 589,609 materials that were predicted to be stable.
The second stage of the workflow, shown in Figure 2b, filtered this large pool of materials to discover those with electronic and electrochemical properties that are suitable for solid electrolytes in battery applications. We first filtered the candidates to include materials with Li site mole fractions of at least 0.1 to ensure a reasonable number of sites that support Li+ conduction. Then we used the band gap to screen for electronic insulators and provide an upper limit for the electrochemical stability window (ESW); this filtering retained candidates that had an ML-predicted band gap of greater than 3 eV. Next, we applied a more accurate ESW filter by calculating the redox potential from the ML-predicted energies and retained only those candidates with energetically unfavorable reduction ( V w.r.t. Li/Li+) and oxidation ( V w.r.t. Li/Li+).
After the AI-based step, we used HPC simulations, starting with DFT relaxation and static calculations to confirm the stability predicted by ML, and performed molecular dynamics (MD) simulations using ML potentials. We assessed Li conductivity using Li diffusivity as a proxy, following the approach by Zhu et al. [17], where Li diffusivity was calculated at 800 K and 1200 K. We applied a diffusion constant filter of , which corresponds roughly to a Li migration barrier of less than 0.4 eV, and cm2 s-1. We ended up with 147 promising candidates that passed all criteria.
In the latter half of the second stage (Figure 2b), we filtered the candidates to select only those with properties needed to integrate each material into practical batteries. We aimed to reduce the cost by removing Be, Sc, Cs, Rb, and Hf; this filter also served as a proxy for filtering by mineral abundance. By predicting and removing candidates with high bulk and shear moduli (greater than 30 GPa), we retained materials that were soft and could potentially form a cohesive interface with cathodes and anodes. Finally, we removed high density materials (greater than 2.5 g cm-3) because mass density is inversely related to energy density. Together, the two workflow stages identified 23 final candidates as well as a large dataset of properties for the original pool of 32,598,079 candidates. Eighteen of the 23 final candidates have compositions that have not been previously reported. To account for possible disordered phases of the final candidates, we calculated structure energies for enumerated ordered structures of Na-Li compounds from partial substituted disordered structures, and kept the lowest energy structures.
2.3 Infrastructure for cloud-based materials discovery
The Microsoft Azure Quantum team designed a cloud HPC system based on the Azure HPC On-Demand Platform [23]. The latest implementation of this infrastructure is available through Azure Quantum Elements [24]. We used easily accessible cloud-based resources of Azure Quantum Elements to perform all tasks from simple Python scripting to complex DFT and MD calculations. Figure 3 shows the core infrastructure of our large-scale computational materials discovery workflow.
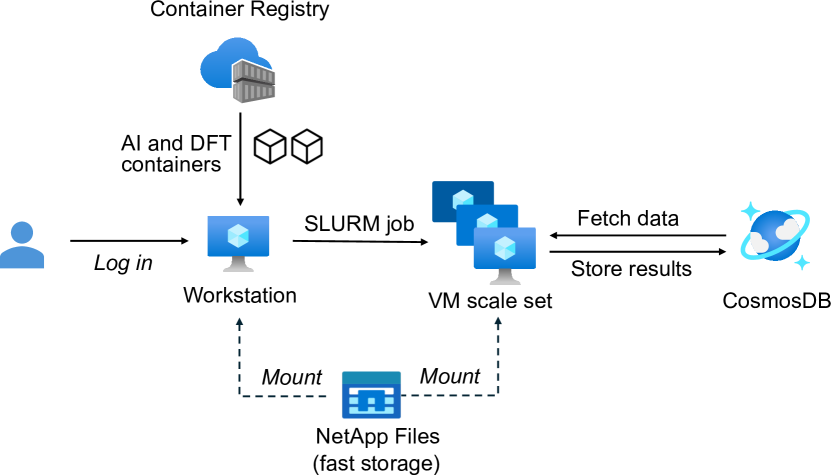
The ML models and DFT code were built into Docker [25] container images and hosted in a private Azure Container Registry. At runtime, a workstation virtual machine (VM) fetched the container images to NetApp Files [26] storage mounted to the workstation and job queues or VM scale sets. We submitted computational jobs that run the containers to the VM scale sets via the SLURM job scheduler [27]. The VM scale set is the counterpart of a partition or a queue in conventional HPC, and the number of VMs is adjustable at deployment time given sufficient quota. Each job runs a container and is thus separate from the other jobs.
Data and metadata, such as job status and job chunk status, were kept in a searchable database hosted in CosmosDB [28] and accessed via a MongoDB API [29]. Status tracking is essential for taking advantage of pre-emptible or low-priority VMs in the cloud, and for making sure the job can be restarted. In this study, we used approximately one thousand VMs to run ML potential-based optimization and DFT jobs.
2.4 Screening results and trends
By using approximately 1,000 VMs for less than 80 hours, this filtering workflow created one of the largest datasets for ESW of 8,795 materials and produced diffusivity data on a diverse set of 583 material compositions and structures. This information will be important to guide the future design of electrolytes.
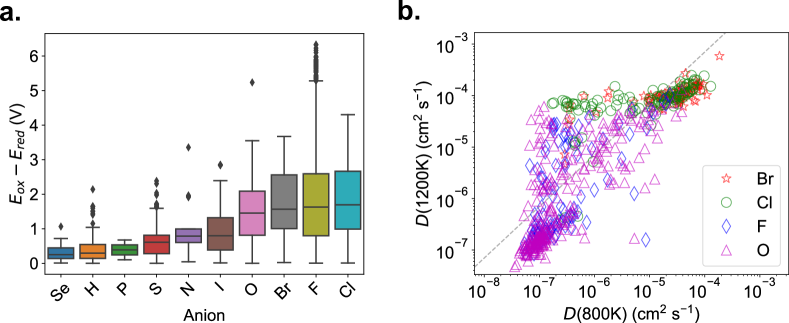
Figure 4a shows the ESW for 8,795 wide band gap materials, grouped by the presence of specific anions. For multi-anion materials, we selected the highest electronegativity anion as the representative one. We found that early row halides such as F, Cl and Br tend to have larger ESW. Oxides follow closely, but other chalcogenides such as S and Se have very small ESWs. The trend matched well with a previous study from Wang et al. [30] on Li ternary systems, where = metal cation, = F, Cl, Br, I, O, S. The ESW trend suggests that chlorides, fluorides, and bromides are better candidates for solid electrolytes when electrochemical stability is a requirement.
The 583 candidates that passed the ESW filters all contained either Br, Cl, F, or O. The Li diffusivities of the materials at 800 K and 1200 K are plotted in Figure 4b and were used to select materials with sufficiently low activation energies for Li movement across a range of temperatures. Oxides and fluoride materials tend to have diffusivities that vary widely across compound species. This variation is likely due to the sensitivity of Li conductivities to structural changes. For example, even for the same composition, the tetragonal phase Li7La3Zr2O12 has much lower Li conductivity compared to the cubic phase [31]. Bromides and chlorides tend to have consistently good high-temperature diffusivities, and hence are promising families of compounds to explore as electrolytes.
2.5 Final candidates
Ultimately, we focused on four rare-earth metal-based halides for experimental validation (Table 1). These halides included three candidates that passed through all property filters in our workflow, Li5YCl8, Li7Y2Cl13, and Na2LiYCl6, as well as a Pna21 polymorph of known composition Li3YCl6, which passed the property-based filters. The Pm1 phase of Li3YCl6 is a well-known material with Li and Y site disorder [32, 33, 34, 35]. We generated ordered enumerated structures from the known Pm1 phases, but the energies of those structures were much higher. Hence, we included the predicted Pna21 phase in our study to explore additional properties of this structure.
| Composition | Space group | (meV/atom) | Band gap (eV) | (V) | (V) | (mS/cm) |
|---|---|---|---|---|---|---|
| Li3YCl6 | Pna21 | 24 | 4.91 | 0.65 | 4.27 | 12.17 |
| Li5YCl8 | Cmmm | 32 | 4.99 | 0.65 | 4.27 | 1.12 |
| Li7Y2Cl13 | Pn | 39 | 5.06 | 0.65 | 4.27 | 1.70 |
| Na2LiYCl6 | R | 15 | 5.20 | 0.65 | 3.80 | 0.12 |
| \botrule |
All materials in Table 1 have good DFT ESWs (Figure S1), large DFT band gaps (Supplementary Figure S2), and good ab initio molecular dynamics (AIMD) Li conductivities at room temperature (Supplementary Figure S3). Of particular interest is Na2LiYCl6 because of its Li-Na dual conductivity properties (see Supplementary Figure S3 and Supplementary Figure S4). Both from a fundamental scientific perspective and in terms of technological applications, discovering a structural framework that enables the co-diffusion of two distinct alkali cations holds potential to greatly expand the design formulations of solid-state electrolyte materials.
2.6 Synthesis and experimental characterization
2.6.1 Structure and composition
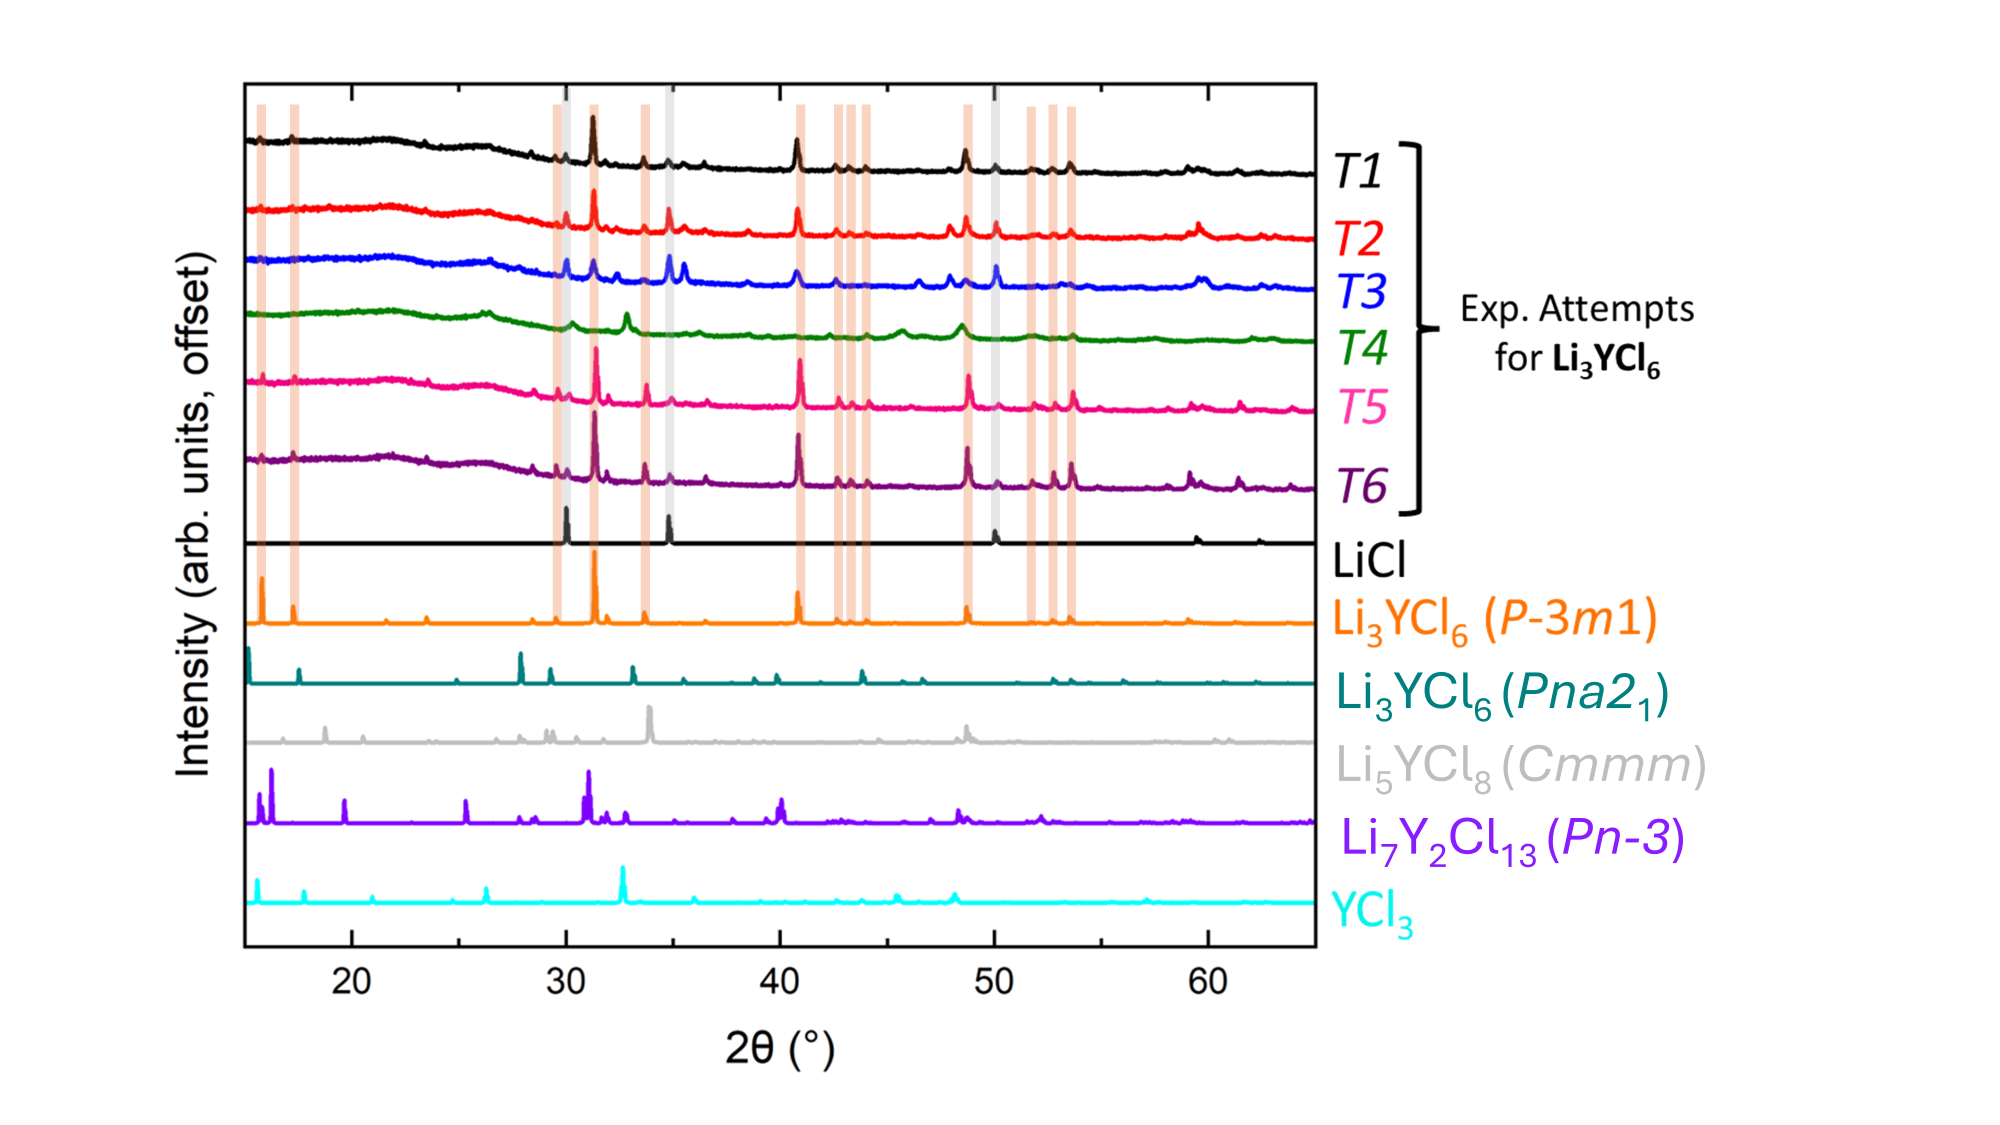
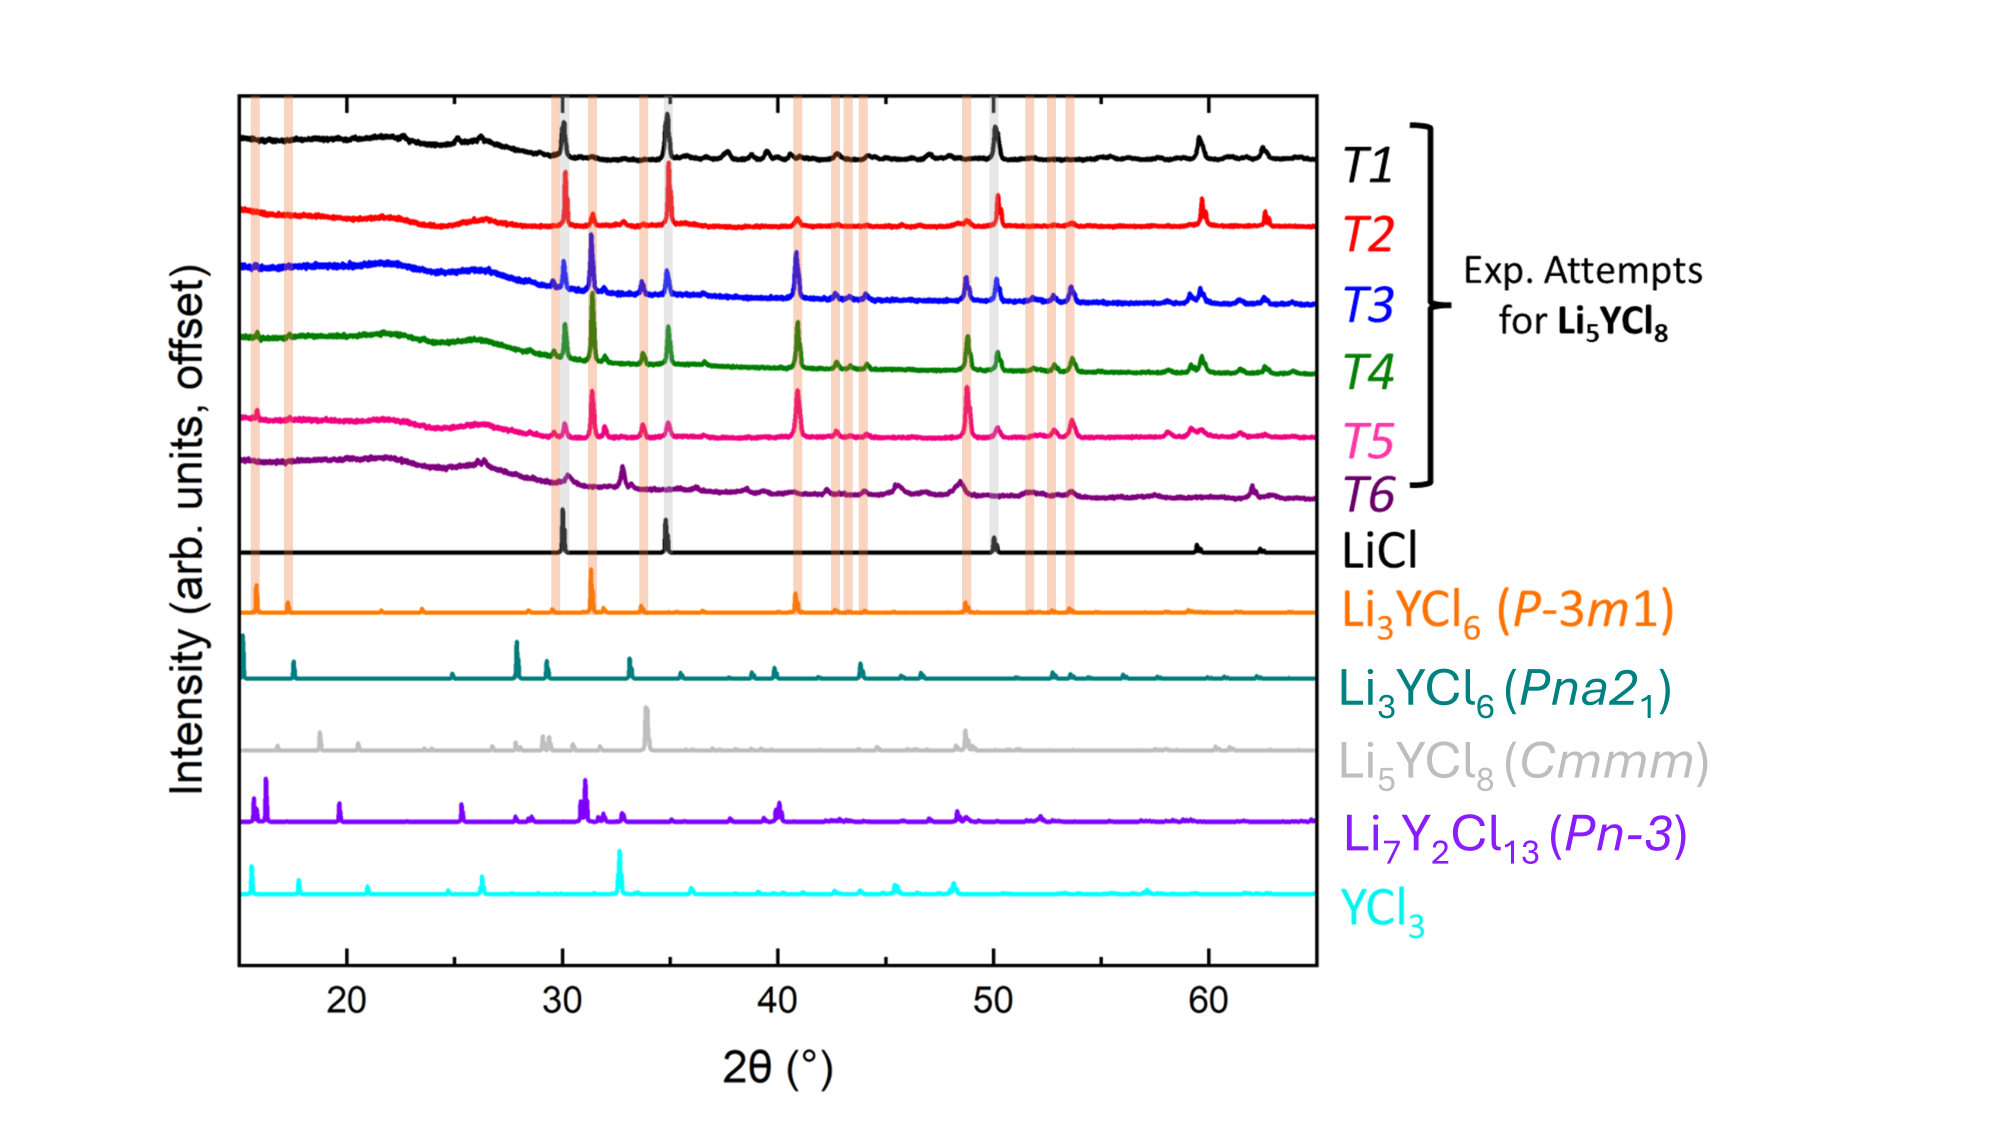
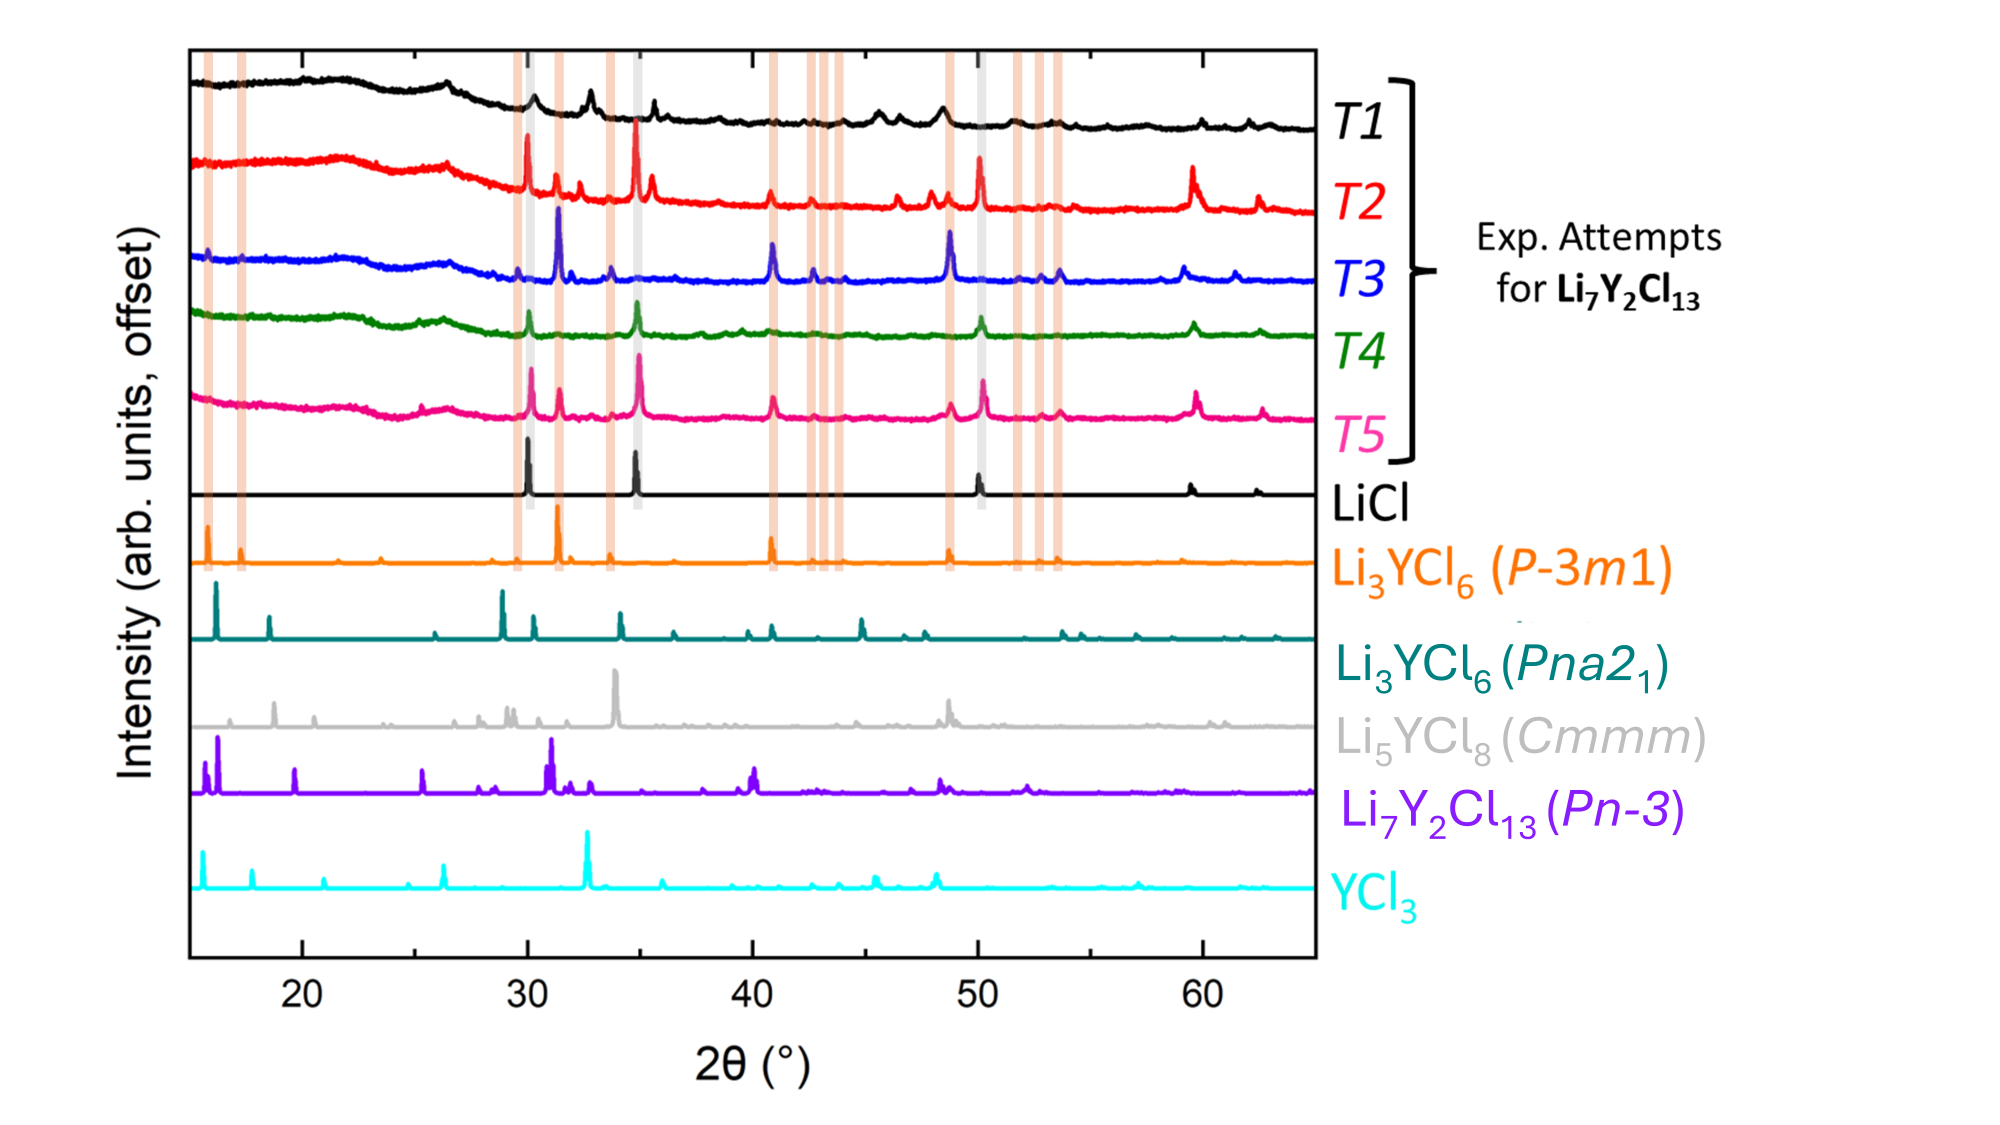
The attempted synthetic approaches for Li3YCl6, Li5YCl8, and Li7Y2Cl13 resulted in Li3YCl6 in the well-known Pm1 phase [32] (see Supplementary Figure S5 to Supplementary Figure S7). The powder X-ray diffraction (PXRD) pattern of synthesized Na2LiYCl6 matched with the predicted structure in the Na3YCl6 R phase, as shown in Figure 5. Given the similarity between Li and Na, we also synthesized compositions of a NaxLi3-xYCl6 series with different Na and Li ratios. \AcPXRD patterns (Figure 5a) reveal that the trigonal R Na3YCl6 is the main phase observed for 1.5 to 3 [36], while the main phase for 0 to 0.5 samples matches the X-ray diffraction (XRD) pattern of trigonal Li3YCl6 with space group Pm1 [32].

Additional experiments are ongoing to fully understand the role of Na in these materials for chemical and structural stability. Small amounts of unreacted NaCl and LiCl were observed in the synthesized composition and 1 to 2 compositions, respectively. Sample crystallinity was greatly affected by humidity during the transfer and measurement of the samples to the diffractometer. It was difficult to accurately refine unit cell parameters from PXRD data due to large background from the Kapton tape and the broadened peaks of the PXRD patterns. Preliminary single-crystal XRD data suggests successful synthesis of the Na2LiYCl6 R phase. Additional single-crystal XRD measurements are ongoing to confirm successful synthesis for all compositions in this series.
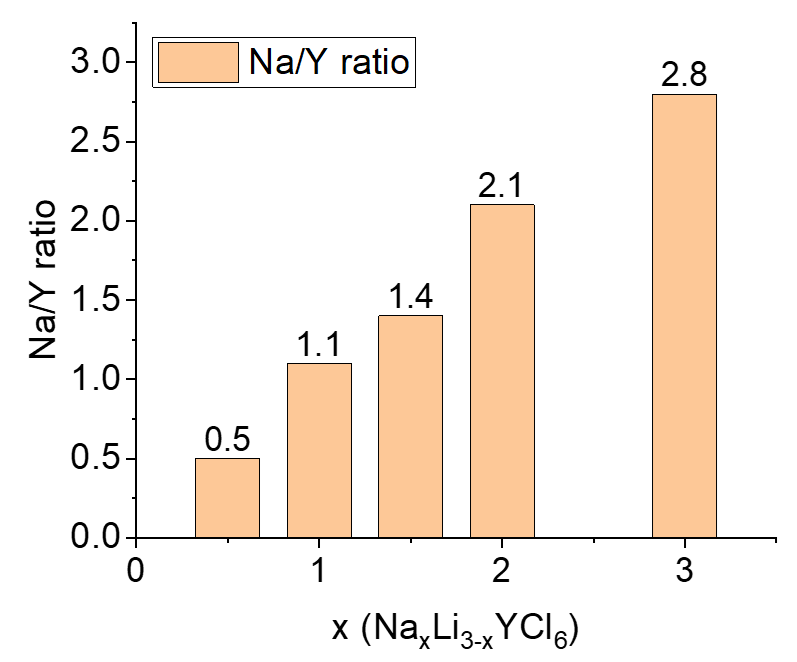
XPS was used to confirm the atomic percentages of Li, Na, Y, and Cl in the NaxLi3-xYCl6 samples. For from 0 to 3, the Li/Na ratio matches qualitatively with the nominal values from the compositions (Figure 5b). \AcSEM and energy-dispersive X-ray spectroscopy (EDS) (see Figure S8 and Table S1) confirmed the relative elemental ratios of Na, Y, and Cl for the bulk of the samples.
2.6.2 Conductivity
The introduction of Li in place of Na remarkably boosted the ionic conductivity by more than two orders of magnitude, specifically at a substitution level of one third, exemplified by Na2LiYCl6 () exhibiting a conductivity of S/cm at 100 °C, compared to the meager S/cm at 100 °C observed in the parent Na3YCl6 material. The measured ionic conductivities (Figure 5c) across varying values consistently depict the rising trend associated with increased Li content. This trend strongly implies that the heightened mobility of Li+ ions actively contributes to the measured conductivity within these substituted compositions. Simultaneously, a significant reduction of activation energy (0.46–0.66 eV) was observed with the introduction of lithium ( 0.5 to 3) compared to the parent Na3YCl6 (0.82 eV). Notably, Na2LiYCl6 (with a similar R crystal structure as parent Na3YCl6, as shown in Figure 5d) displays a significantly lower activation energy ( 0.6 eV), indicating an amplified ionic diffusion process.
This enhancement in conductivity and reduction in activation energy can likely be attributed to the involvement of Li+ ions in ionic transportation, as well as potential alterations in the crystal structure, such as expansion of ion diffusion channels and local structural disorder resulting from Li+ substitution. The trigonal crystal structure of parent Na3YCl6 (R) contains one fully occupied and two partially occupied Na sites, enabling diffusion pathways through and between channels, predominantly facilitating ionic conduction along the -axis [37]. The heightened conductivity observed upon lithium substitution suggests that the evolving occupancy and distribution of Na and Li sites potentially modulate the energy landscape along the -axis, thereby fostering accelerated ionic diffusion. Further investigation is warranted to validate the effects of Na/Li distribution on ion conduction pathways and the associated transport mechanisms. Nonetheless, this material, NaxLi3-xYCl6, discovered through our integrated computational approach, embodies a structural framework capable of accommodating two distinct mobile cations. This characteristic not only signifies its potential for use in both Li- and Na-based solid-state batteries but also underscores its promise for designing new phases of ion-conducting materials through computational discovery.
3 Discussion
Functional discovery. Discovering materials presents an enduring challenge, while identifying functional materials pertinent to specific applications proves even more formidable. Existing AI models provide a good starting point in this process, but identifying and demonstrating the industry applicability of discovered materials requires accurate predictions and experimental validation, which can be time consuming, resource intensive, and expensive. To expedite the discovery of industry-relevant materials, the initially large pool of material candidates must first be filtered, using AI models, to produce a smaller pool of prospective candidates that are likely to be synthesizable. In this study, we have successfully used this approach, combining state-of-the-art AI models with cloud HPC to predict half a million stable and potentially synthesizable materials from an initial pool of over 32 million. From that smaller pool of stable materials, the filters we applied revealed only a small number of functional materials with properties that would make them suitable for targeted applications.
Designing solid-state electrolytes. We predicted new compositions of Na- and Li-containing electrolytes based on the known Na3YCl6 R structure and we experimentally validated the formation of NaxLi3-xYCl6-based compounds. The Na/Li substitutional compounds in this series showed experimental conductivities that make them viable candidates for future development as a solid-state electrolyte material. The alkali cation substitution, resulting in stable halide phases exhibiting significant conductivity, represents a contemporary approach compared to the conventional aliovalent doping methodology reported for halide-based electrolytes [38, 39]. In particular, this structural framework’s capability to host both Na and Li ions efficiently could pave the way for versatile battery designs, offering potential advantages in terms of cost, stability, and performance. In addition to identifying these viable candidates, this discovery workflow also generated new computational data for guiding the design of electrolytes. In particular, we rediscovered a decade’s worth of ESW trends for the widest range of materials to our knowledge. The broader view of ESW trends clearly suggests that the halide families have the most promising balance of ESW and conductivity. Our mechanical property predictions also suggest that these soft materials can form flexible interfaces with other battery components like solid electrodes, a main challenge in designing solid-state batteries. We are currently assessing the electrochemical stability and performance of these newly discovered materials in solid-state battery systems.
Next steps. The choice and execution of filters is very important when using computer-based methods to discover functional materials. To focus our experimental work on only the most promising candidates, we applied a stringent ESW filter that eliminated many material candidates in our search for a new solid electrolyte material. Most known electrolytes, including sulfides such as Li10GePS12 and oxides such as Li7La3Zr2O12, would not have passed through the filters used in this study [40]. By relaxing the conditions of these filters, it is likely that we could discover additional electrolyte candidate materials among the 8,795 compounds that entered the ESW filter. To train our ML models, we used only materials with integer atomic occupancies that are conducive to quantum mechanical calculations. However, it is very common for fast Li conductors to have disordered site occupancies and defects, neither of which are typically considered in high-throughput studies. Additional work is needed to expand the materials space to consider more complex materials going beyond ordered, perfect crystals. Future optimization of the workflow beyond screening will be based on the direct generation of materials with given properties, such as the method recently demonstrated by MatterGen [41].
Broader impact. We demonstrated the integration of AI and cloud HPC as an end-to-end workflow, beginning with AI exploration and enhanced by AI/DFT filters on cloud-based HPC, which holds the potential to revolutionize functional materials discovery. This transformative approach expands accessibility and significantly accelerates the identification, synthesis, and experimental validation of technologically relevant materials. This fusion of techniques holds the potential to significantly reduce the time and resources spent on traditional trial-and-error experimental discovery of functional materials.
4 Methods
4.1 \AcAI model, training, and data
We used the M3GNet model framework [8] for training ML potentials and retrained the Materials Project data on Standard_ND40rs_v2 VMs, each of which has 8 V100 32GB GPUs, on the Azure Quantum Elements platform. ML geometric optimization and inference were performed on Standard_HC44rs VMs.
We used the Horovod [42] training framework on multi-GPU training. The training hyperparameters are consistent with previous work [8]. The other property models such as band gap and elasticity models are from previous work [8].
Materials Project data for training ML potential were curated from the 2021.2.8 version and we expanded the structures from the previous M3GNet work. Materials were selected only if they had a task_type or task_label field from Materials Project. We filtered out materials that have energy per atom of less than -25 eV, or higher than 50 eV/atom, and we also removed structures that have an interatomic distance of less than 0.5 Å.
We curated a total of 117,970 materials, and for each material, we kept only the first, middle, and last relaxation snapshots in cases where the structure relaxation produced more than three snapshots. This process produced a total of 352,767 structures, with 352,767 energy values, 30,148,593 force components, and 2,116,602 unique stress components. We then divided the materials into training, validation, and testing categories. The snapshots in each category were 317,489, 17,633, and 17,645, respectively. The model error for the test data was 29.9 meV/atom, 72.1 meV/Å, and 0.40 GPa.
4.2 \AcDFT
DFT and AIMD calculations were performed with VASP [43, 44]. For structural relaxation, static calculations, and band-structure calculations, we used the Atomate workflows [45], FireWorks [46] workflow manager, and custodian error handlers [18], which is consistent with settings used in the Materials Project [1]. All DFT calculations were run on the Azure Quantum Elements platform using the Standard_HB120rs_v2 120-core VMs.
For AIMD, we created super-cells of at least 80 atoms. We used a time step of 2 fs and ran 100,000 steps (total 200 ps) for each MD trajectory at temperatures from 400 K to 700 K with ‘MPMDSet’ in pymatgen [18]. For Na2LiYCl6, which has a lower conductivity than other candidates, we raised the simulation temperature range to 700 K to 1000 K. The materials did not melt, which demonstrates their stability. We used Niggli reduction using Pymatgen[18] on the structure to obtain more regular lattices for simulations.
4.3 Synthesis methods
All reagents of sodium chloride (Sigma Aldrich, 99.999%), lithium chloride (Sigma Aldrich, anhydrous, 99.95%), and yttrium chloride (Sigma Aldrich, anhydrous, 99.99%) were used as received. All material handling of reagents and synthesized samples was carried out in an Ar-filled glovebox ( ppm O2, 0.5 ppm moisture) to minimize water contamination. Stoichiometric ratios of the NaCl, LiCl, and YCl3 powders were weighed out, ground together via mortar-and-pestle hand grinding, and then compacted into a pellet via a hydraulic press (200 bar) in stainless steel pressure dies. Each pellet was placed into a quartz ampoule, evacuated, flame-sealed, and then placed into a tube furnace with the pellet sample nearest to the thermocouple. The annealing temperature varied between 450 °C and 550 °C depending on the stoichiometry of the sample. The temperature profile used was a 10 °C/min ramp to the respective temperature followed by annealing for 5 hours. The furnace was then turned off to allow the samples to cool naturally. Once cooled, the sample ampoules were carefully opened in a glovebox, finely ground with a mortar and pestle, and then characterized. All products remained in the glovebox while handling.
4.4 Characterization methods
4.4.1 \AcXRD
All powder X-ray diffraction measurements were conducted on a Rigaku SmartLab SE Bragg-Brentano diffractometer with a Cu source ( Å) and D/teX Ultra 250 1D high-speed position-sensitive detector. Samples were placed in a SiO2 zero background well holder then covered with a single layer of Kapton tape inside a glovebox to avoid moisture degradation.
4.4.2 \AcXPS
The NaxLi3-xYCl6 (100 mg) fine powder was compacted into a pellet via a hydraulic press (100 bar) in stainless steel pressure dies inside an Ar-filled glovebox. The pellet was then loaded onto a sample holder and transferred to an XPS analysis chamber without exposing to air. \AcXPS analysis was performed using a Kratos Axis Ultra DLD spectrometer, which consists of an Al K monochromatic X-ray source (1486.6 eV) and a high-resolution spherical mirror analyzer. The X-ray source was operated at 150 W power and the emitted photoelectrons were collected at the analyzer entrance slit normal to the sample surface. The high-resolution spectra were collected at a pass energy of 40 eV with a step size of 0.1 eV. \AcXPS spectra were calibrated using C 1s signal at 285 eV. Data were processed using CasaXPS software. The Li 1s, Na 2s, Y 3d, and Cl 2p high-resolution spectra were used to calculate the composition of the samples.
4.4.3 \AcSEM and EDS
To confirm the relative ratios of Na, Y, and Cl in the samples, elemental analysis was performed using scanning electron microscopy (SEM) and EDS. Li is a light element so it cannot be detected by EDS. Therefore, only relative ratios of the non-Li elements were determined via this technique. Powders of sample were pressed into a flat, thin pellet and placed onto a conductive double-sided carbon adhesive dot placed on an aluminum stub. An electron beam at 20 kV accelerating voltage with 1.6 nA current was used with a working distance of 10 mm. At least 10 different sites on each pellet of different compositions (NaxLi3-xYCl6; = 0, 0.5, 1, 1.5, 2, 3) were measured to generate average statistics of the elemental quantification. Oxygen content was noted on the surface despite the quick transfer from the glovebox to the SEM instrument.
4.4.4 \AcEIS measurement
To determine ionic conductivity, 110 mg of fine electrolyte powder was loaded into a Split Cell (MSE Supplies) with a diameter of 12 mm, sandwiched between 2 stainless steel electrodes. The cell was then cold-pressed at 100 bars using a hydraulic press inside an Ar-filled glovebox. The cell was then removed from the glovebox, loaded into a pressure jig, and pressurized to 250 MPa. Impedance measurements were taken with an applied AC potential of 100 mV over a frequency range of 1 MHz to 100 mHz using Biologic VMP3. The electrochemical impedance spectra (EIS) were collected at various temperatures between 100 °C and 25 °C. At each temperature, the cell was rested for 2 h prior to collecting the EIS. The thickness of each pellet was measured using a digital micrometer (Mitutoyo) after completing the impedance measurement. The ionic conductivity of the pelletized electrolyte was determined using the EIS data.
Data and code availability
Code is available at https://github.com/materialsvirtuallab/m3gnet.
Acknowledgments
The authors thank the rest of the Microsoft Azure Quantum team for their support on engineering infrastructure. The authors thank Deborah Hutchinson for paper revisions. A portion of this research was performed on a project award DOI:10.46936/prop.proj.2023.61032/60012343 from the Environmental Molecular Sciences Laboratory, a DOE Office of Science User Facility sponsored by the Biological and Environmental Research program under Contract No. DE-AC05-76RL01830. The experimental research work conducted at PNNL was funded by Microsoft.
Author contributions
C.C. and M.T. conceived of the project. C.C. designed the workflow and carried out the calculations with input from N.B. and M.T. The project was managed by L.L., N.B., and B.B. who also procured resources. V.M. and D.N. conceived and designed the experimental analysis. D.N., A.K., and S.L. collected the experimental data. V.M., D.N., A.K., S.L., and K.M. analyzed and interpreted the experimental data. C.C., N.B., D.N., and S.L. wrote the paper. All authors contributed to discussions, analysis, and paper revision.
Competing interests
C.C., N.B, L.L., C.O., B.B., and M.T. work at Microsoft. Two provisional patents were filed.
References
- \bibcommenthead
- [1] Jain, A. et al. Commentary: The Materials Project: A materials genome approach to accelerating materials innovation. APL Materials 1, 011002 (2013). URL https://doi.org/10.1063/1.4812323.
- [2] Curtarolo, S. et al. AFLOWLIB.ORG: A distributed materials properties repository from high-throughput ab initio calculations. Computational Materials Science 58, 227–235 (2012). URL https://doi.org/10.1016/j.commatsci.2012.02.002.
- [3] Saal, J. E., Kirklin, S., Aykol, M., Meredig, B. & Wolverton, C. Materials design and discovery with high-throughput density functional theory: The Open Quantum Materials Database (OQMD). JOM 65, 1501–1509 (2013). URL https://doi.org/10.1007/s11837-013-0755-4.
- [4] Talirz, L. et al. Materials Cloud, a platform for open computational science. Scientific Data 7, 299 (2020). URL https://doi.org/10.1038/s41597-020-00637-5.
- [5] Chen, C., Ye, W., Zuo, Y., Zheng, C. & Ong, S. P. Graph networks as a universal machine learning framework for molecules and crystals. Chemistry of Materials 31, 3564–3572 (2019). URL https://doi.org/10.1021/acs.chemmater.9b01294.
- [6] Xie, T. & Grossman, J. C. Crystal graph convolutional neural networks for an accurate and interpretable prediction of material properties. Physical Review Letters 120, 145301 (2018). URL https://doi.org/10.1103/PhysRevLett.120.145301.
- [7] Choudhary, K. & DeCost, B. Atomistic line graph neural network for improved materials property predictions. npj Computational Materials 7, 1–8 (2021). URL https://doi.org/10.1038/s41524-021-00650-1.
- [8] Chen, C. & Ong, S. P. A universal graph deep learning interatomic potential for the periodic table. Nature Computational Science 2, 718–728 (2022). URL https://doi.org/10.1038/s43588-022-00349-3.
- [9] Deng, B. et al. CHGNet as a pretrained universal neural network potential for charge-informed atomistic modelling. Nature Machine Intelligence 5, 1031–1041 (2023). URL https://www.nature.com/articles/s42256-023-00716-3. Number: 9 Publisher: Nature Publishing Group.
- [10] Merchant, A. et al. Scaling deep learning for materials discovery. Nature 1–6 (2023). URL https://doi.org/10.1038/s41586-023-06735-9.
- [11] Szymanski, N. J. et al. An autonomous laboratory for the accelerated synthesis of novel materials. Nature 1–6 (2023). URL https://doi.org/10.1038/s41586-023-06734-w.
- [12] Zunger, A. Inverse design in search of materials with target functionalities. Nature Reviews Chemistry 2, 1–16 (2018). URL https://doi.org/10.1038/s41570-018-0121.
- [13] Riebesell, J. Pymatviz: visualization toolkit for materials informatics (2022). URL https://github.com/janosh/pymatviz.
- [14] Hautier, G., Fischer, C., Ehrlacher, V., Jain, A. & Ceder, G. Data mined ionic substitutions for the discovery of new compounds. Inorganic Chemistry 50, 656–663 (2011). URL https://doi.org/10.1021/ic102031h.
- [15] Wu, Y., Lazic, P., Hautier, G., Persson, K. & Ceder, G. First principles high throughput screening of oxynitrides for water-splitting photocatalysts. Energy & Environmental Science 6, 157–168 (2013). URL https://pubs.rsc.org/en/content/articlelanding/2013/ee/c2ee23482c.
- [16] Wang, Z. et al. Mining unexplored chemistries for phosphors for high-color-quality white-light-emitting diodes. Joule 2, 914–926 (2018). URL https://www.sciencedirect.com/science/article/pii/S2542435118300436.
- [17] Zhu, Z., Chu, I.-H. & Ong, S. P. Li3Y(PS4)2 and Li5PS4Cl2: New lithium superionic conductors predicted from silver thiophosphates using efficiently tiered ab initio molecular dynamics simulations. Chemistry of Materials 29, 2474–2484 (2017). URL https://doi.org/10.1021/acs.chemmater.6b04049.
- [18] Ong, S. P. et al. Python Materials Genomics (pymatgen): A robust, open-source python library for materials analysis. Computational Materials Science 68, 314–319 (2013). URL https://doi.org/10.1016/j.commatsci.2012.10.028.
- [19] Belsky, A., Hellenbrandt, M., Karen, V. L. & Luksch, P. New developments in the Inorganic Crystal Structure Database (ICSD): accessibility in support of materials research and design. Acta Crystallographica Section B: Structural Science 58, 364–369 (2002). URL https://doi.org/10.1107/S0108768102006948.
- [20] Pickard, C. J. & Needs, R. J. High-pressure phases of silane. Physical Review Letters 97, 045504 (2006). URL https://doi.org/10.1103/PhysRevLett.97.045504.
- [21] Glass, C. W., Oganov, A. R. & Hansen, N. USPEX—Evolutionary crystal structure prediction. Computer Physics Communications 175, 713–720 (2006). URL https://doi.org/10.1016/j.cpc.2006.07.020.
- [22] Wang, Y., Lv, J., Zhu, L. & Ma, Y. CALYPSO: A method for crystal structure prediction. Computer Physics Communications 183, 2063–2070 (2012). URL https://doi.org/10.1016/j.cpc.2012.05.008.
- [23] Azure HPC On-Demand Platform. URL https://azure.github.io/az-hop/. Accessed 2023.
- [24] Azure Quantum Elements. URL https://quantum.microsoft.com/en-us/our-story/quantum-elements-overview. Accessed 2023.
- [25] Docker. URL https://www.docker.com. Accessed 2023.
- [26] NetApp Files. URL https://www.netapp.com/. Accessed 2023.
- [27] Simple Linux Utility for Resource Management (SLURM). URL https://slurm.schedmd.com/overview.html. Accessed 2023.
- [28] CosmosDB. URL https://azure.microsoft.com/en-us/products/cosmos-db/. Accessed 2023.
- [29] MongoDB query API. URL https://www.mongodb.com/docs/manual/query-api/. Accessed 2023.
- [30] Wang, S. et al. Lithium chlorides and bromides as promising solid-state chemistries for fast ion conductors with good electrochemical stability. Angewandte Chemie International Edition 58, 8039–8043 (2019). URL https://doi.org/10.1002/anie.201901938.
- [31] Tan, J. & Tiwari, A. Synthesis of cubic phase Li7La3Zr2O12 electrolyte for solid-state lithium-ion batteries. Electrochemical and Solid-State Letters 15, A37 (2011). URL https://doi.org/10.1149/2.003203esl.
- [32] Schlem, R., Banik, A., Ohno, S., Suard, E. & Zeier, W. G. Insights into the lithium sub-structure of superionic conductors Li3YCl6 and Li3YBr6. Chemistry of Materials 33, 327–337 (2021). URL https://doi.org/10.1021/acs.chemmater.0c04352.
- [33] Asano, T. et al. Solid halide electrolytes with high lithium-ion conductivity for application in 4 V class bulk-type all-solid-state batteries. Advanced Materials 30, 1803075 (2018). URL https://doi.org/10.1002/adma.201803075.
- [34] Hu, L. et al. Revealing the Pnma crystal structure and ion-transport mechanism of the Li3YCl6 solid electrolyte. Cell Reports Physical Science 4, 101428 (2023). URL https://doi.org/10.1016/j.xcrp.2023.101428.
- [35] Steiner, H.-J. & Lutz, H. D. Neue schnelle ionenleiter vom typ MMIIICl6 (MI = Li, Na, Ag; MIII = In, Y). Zeitschrift für anorganische und allgemeine Chemie 613, 26–30 (1992). URL https://doi.org/10.1002/zaac.19926130104.
- [36] Stenzel, F. & Meyer, G. Ternare halogenide vom typ A3MX6. II. Das system Ag3-xNaxYCl6: Synthese, strukturen, ionenleitfahigkeit. Zeitschrift für anorganische und allgemeine Chemie 619, 652–660 (1993). URL https://doi.org/10.1002/zaac.19936190406.
- [37] Qie, Y. et al. Yttrium–sodium halides as promising solid-state electrolytes with high ionic conductivity and stability for Na-ion batteries. The Journal of Physical Chemistry Letters 11, 3376–3383 (2020). URL https://doi.org/10.1021/acs.jpclett.0c00010.
- [38] Wu, E. A. et al. A stable cathode-solid electrolyte composite for high-voltage, long-cycle-life solid-state sodium-ion batteries. Nature Communications 12, 1256 (2021). URL https://doi.org/10.1038/s41467-021-21488-7.
- [39] Mei, H.-X., Piccardo, P., Cingolani, A. & Spotorno, R. Unconventional solid-state electrolytes for lithium-based batteries: Recent advances and challenges. Journal of Power Sources 553, 232257 (2023). URL https://www.sciencedirect.com/science/article/pii/S0378775322012344.
- [40] Han, F., Zhu, Y., He, X., Mo, Y. & Wang, C. Electrochemical stability of Li10GeP2S12 and Li7La3Zr2O12 solid electrolytes. Advanced Energy Materials 6 (2016). URL https://doi.org/10.1002/aenm.201501590.
- [41] Zeni, C. et al. MatterGen: a generative model for inorganic materials design (2023). URL http://doi.org/10.48550/arXiv.2312.03687.
- [42] Sergeev, A. & Del Balso, M. Horovod: fast and easy distributed deep learning in TensorFlow (2018). URL http://doi.org/10.48550/arXiv.1802.05799.
- [43] Kresse, G. & Hafner, J. Ab initio molecular dynamics for liquid metals. Physical Review B 47, 558–561 (1993). URL https://doi.org/10.1103/PhysRevB.47.558.
- [44] Kresse, G. & Furthmüller, J. Efficiency of ab-initio total energy calculations for metals and semiconductors using a plane-wave basis set. Computational Materials Science 6, 15–50 (1996). URL https://doi.org/10.1016/0927-0256(96)00008-0.
- [45] Mathew, K. et al. Atomate: A high-level interface to generate, execute, and analyze computational materials science workflows. Computational Materials Science 139, 140–152 (2017). URL https://doi.org/10.1016/j.commatsci.2017.07.030.
- [46] Jain, A. et al. FireWorks: a dynamic workflow system designed for high-throughput applications. Concurrency and Computation: Practice and Experience 27, 5037–5059 (2015). URL https://doi.org/10.1002/cpe.3505.
Appendix A Acronyms
- AI
- artificial intelligence
- AIMD
- ab initio molecular dynamics
- DFT
- density functional theory
- EDS
- energy-dispersive X-ray spectroscopy
- EIS
- electrochemical impedance spectra
- ESW
- electrochemical stability window
- HPC
- high-performance computing
- GPU
- graphics processing unit
- ICSD
- Inorganic Crystal Structure Database
- MD
- molecular dynamics
- ML
- machine learning
- PBE
- Perdew-Burke-Ernzerhof
- PXRD
- powder X-ray diffraction
- SEM
- scanning electron microscopy
- VM
- virtual machine
- XPS
- X-ray photoelectron spectroscopy
- XRD
- X-ray diffraction
Appendix B Supplementary information
Electrochemical stability windows for the top candidates are shown in Figure S1. Band gaps for the top candidates are shown in Figure S2. The Li diffusivity results from AIMD are shown in Figure S3. Figure S4 shows Na conductivity results for the Na2LiYCl6 compound that contains both Li and Na.
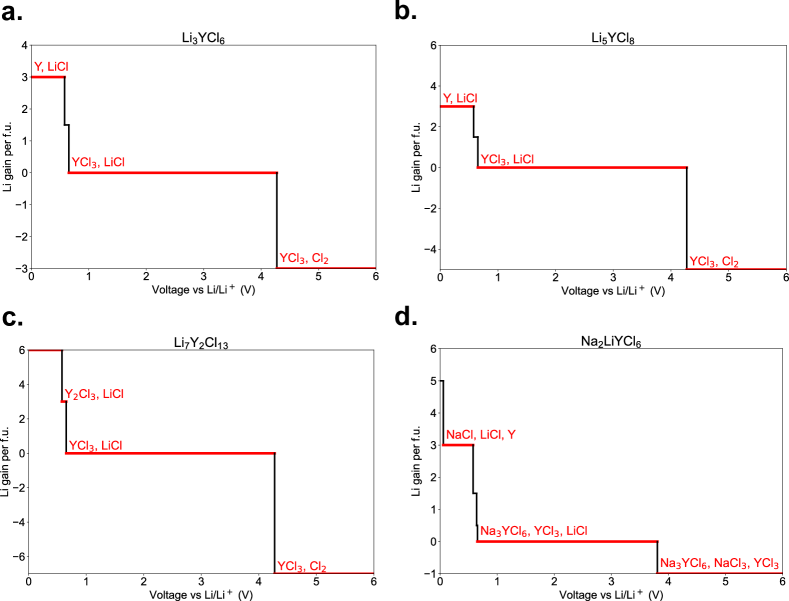
a. 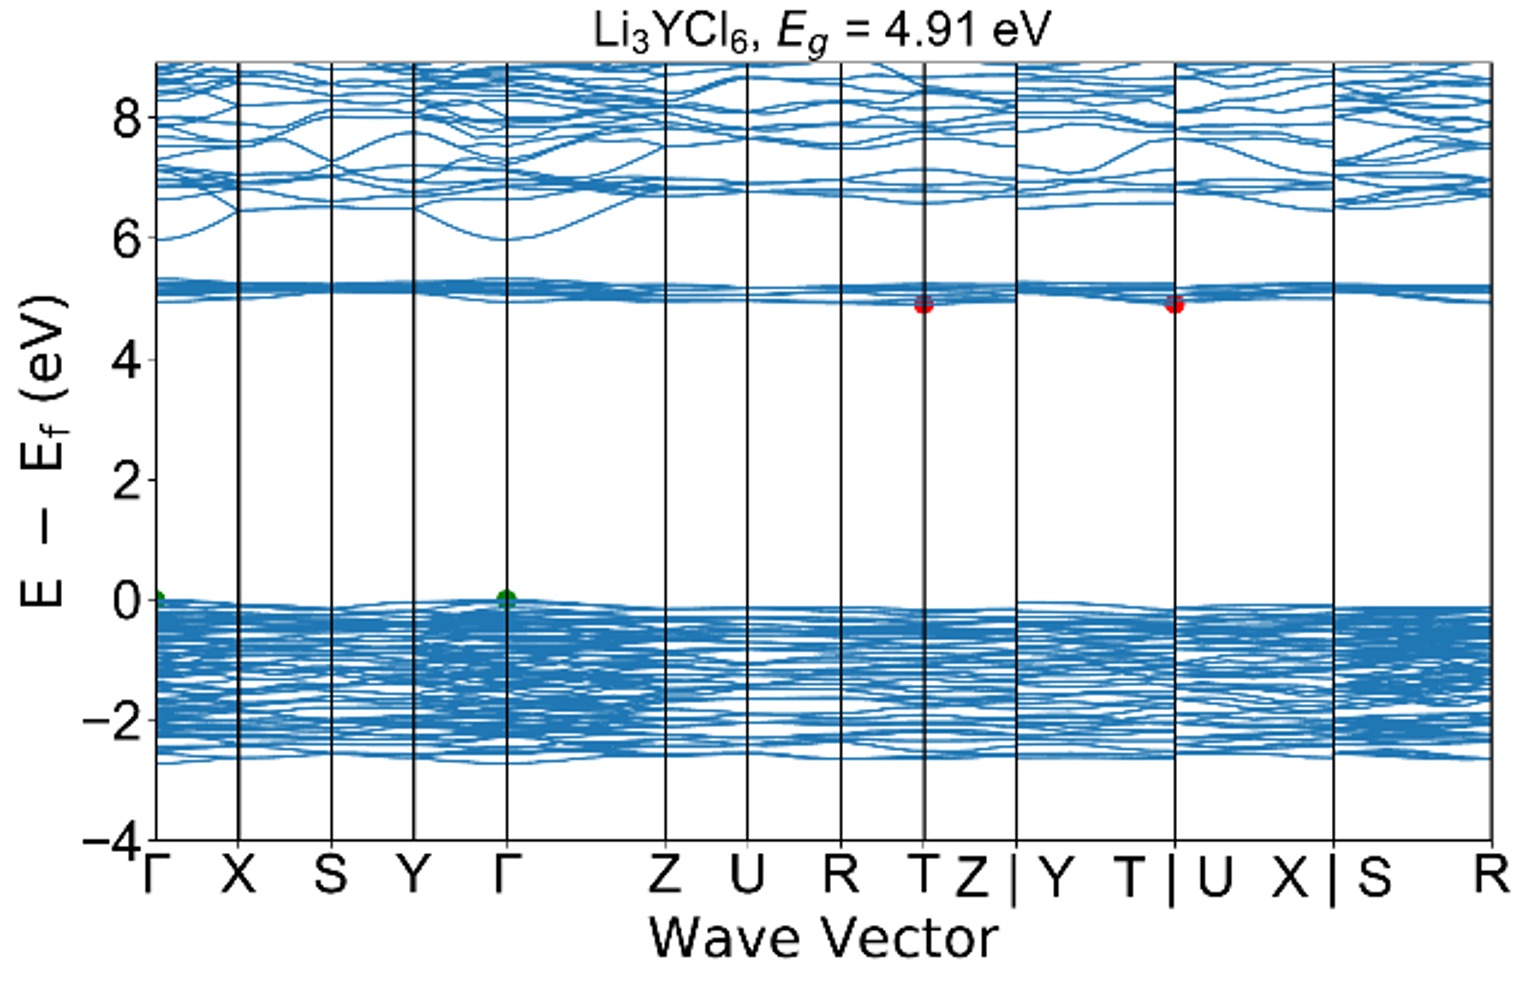 b.
b. 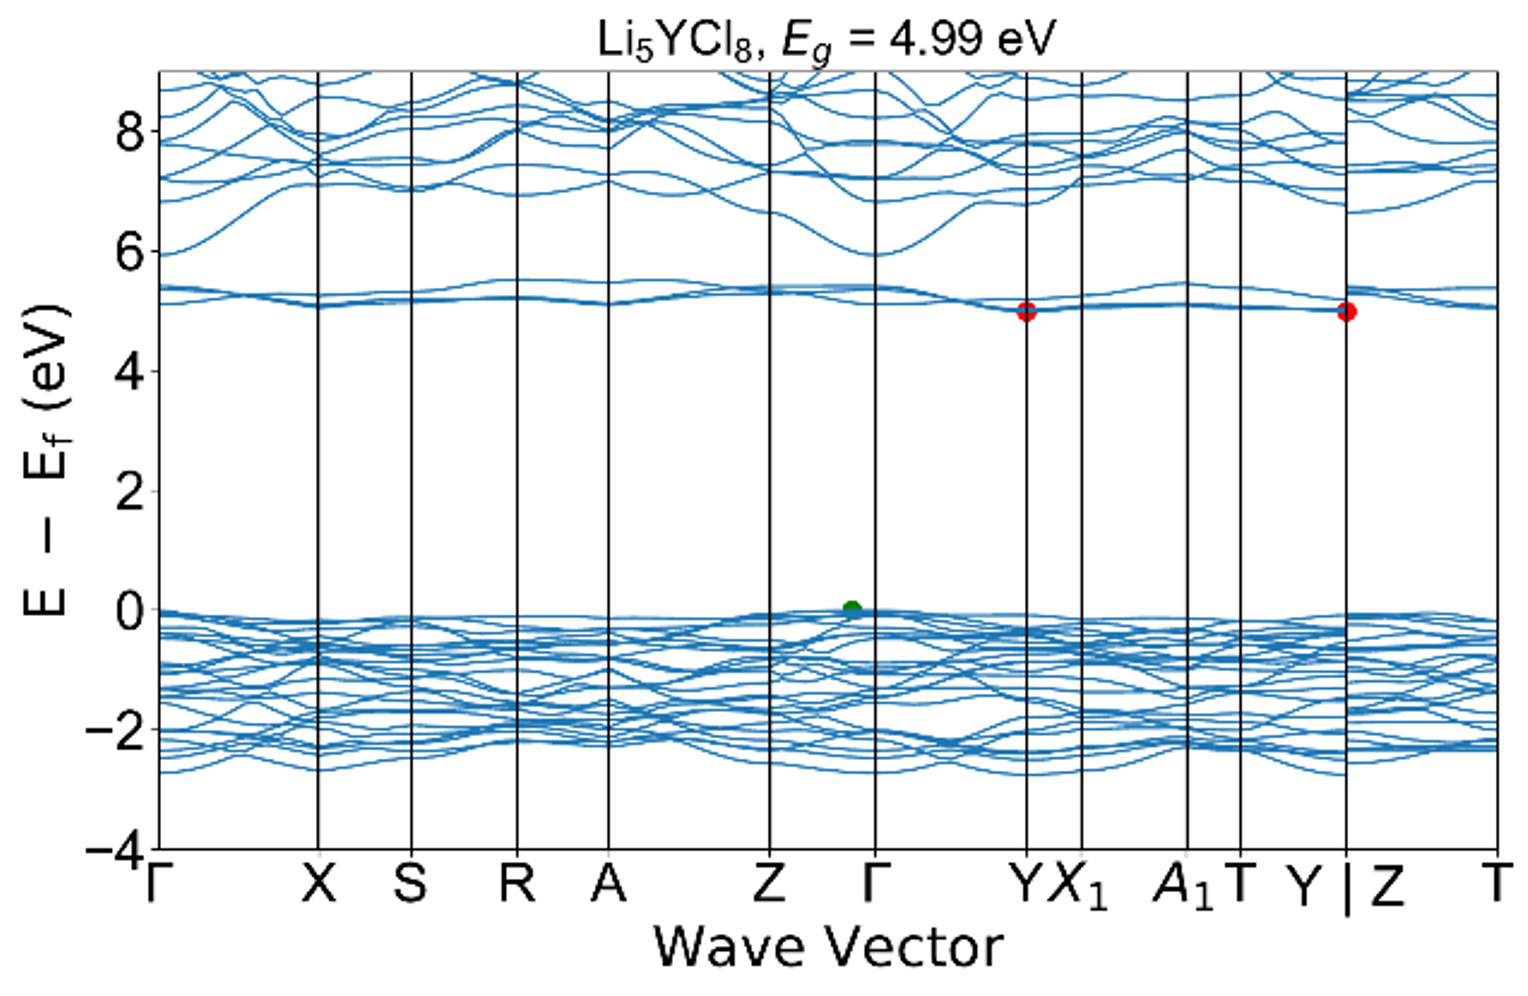 c.
c. 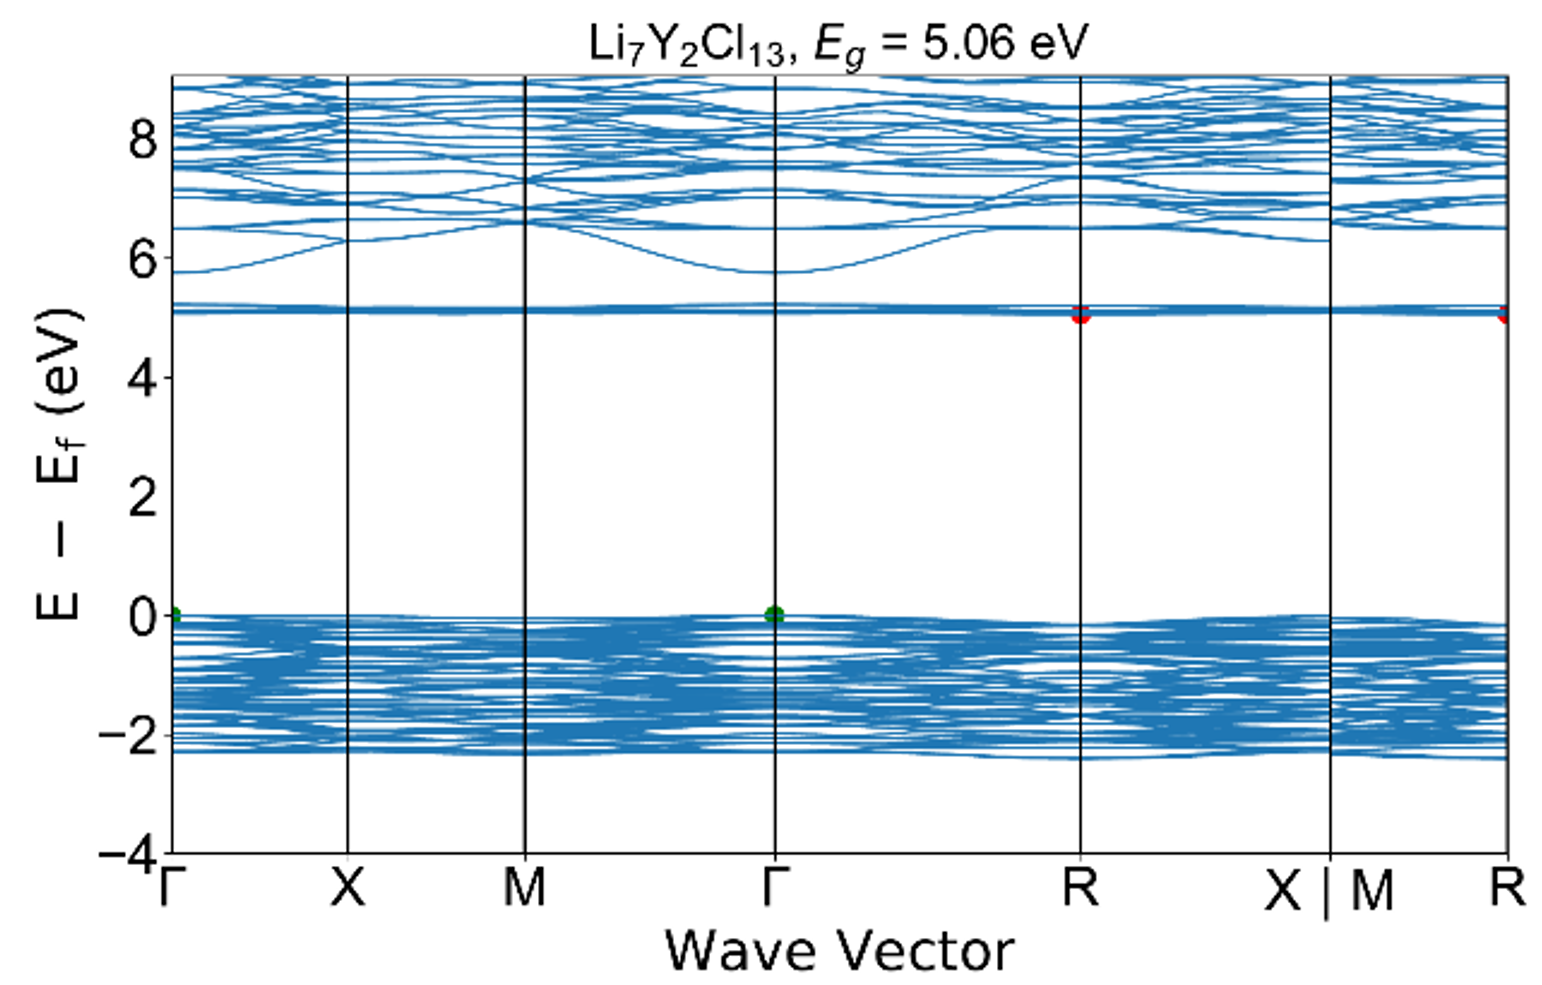 d.
d. 
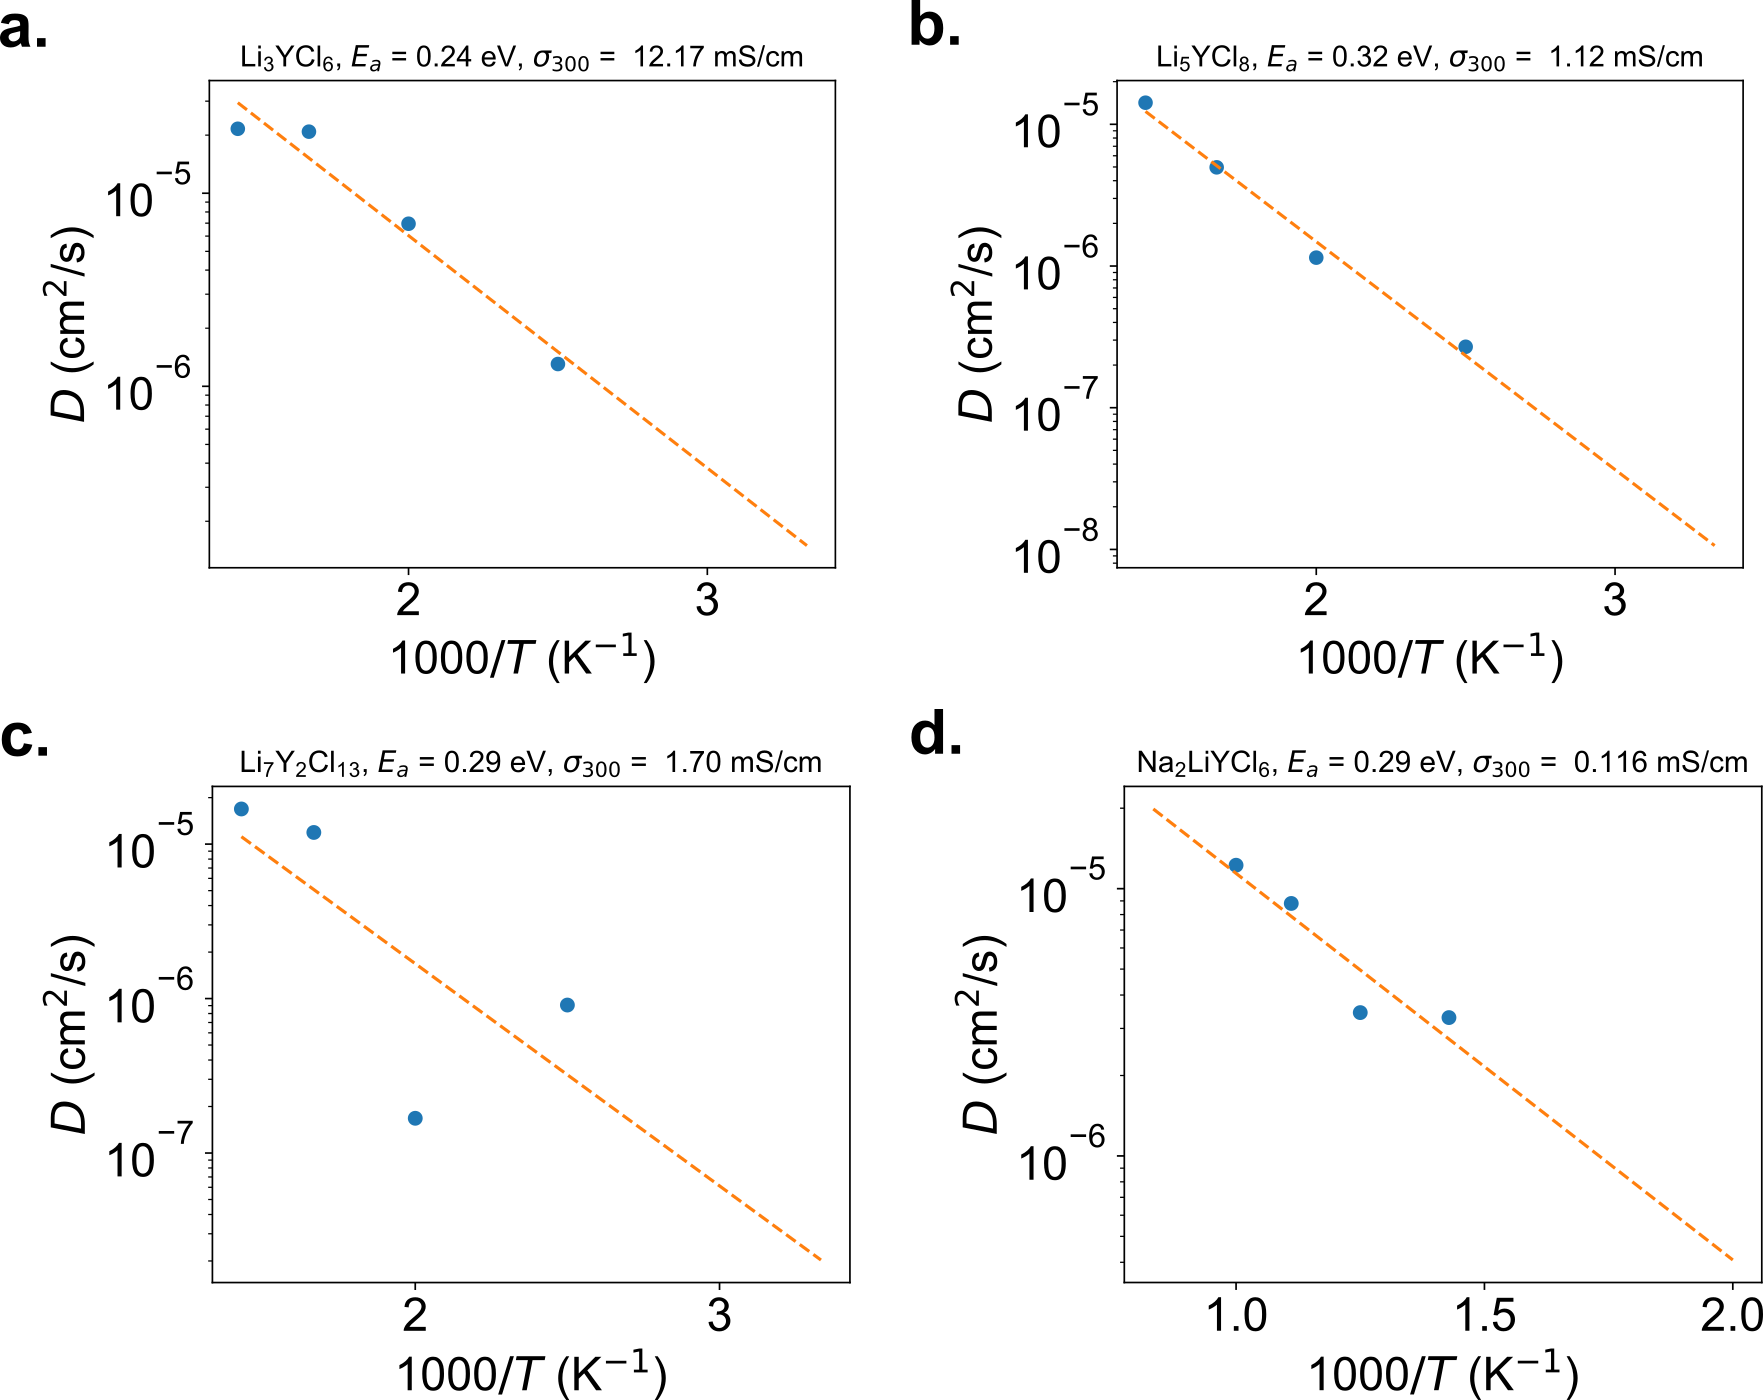
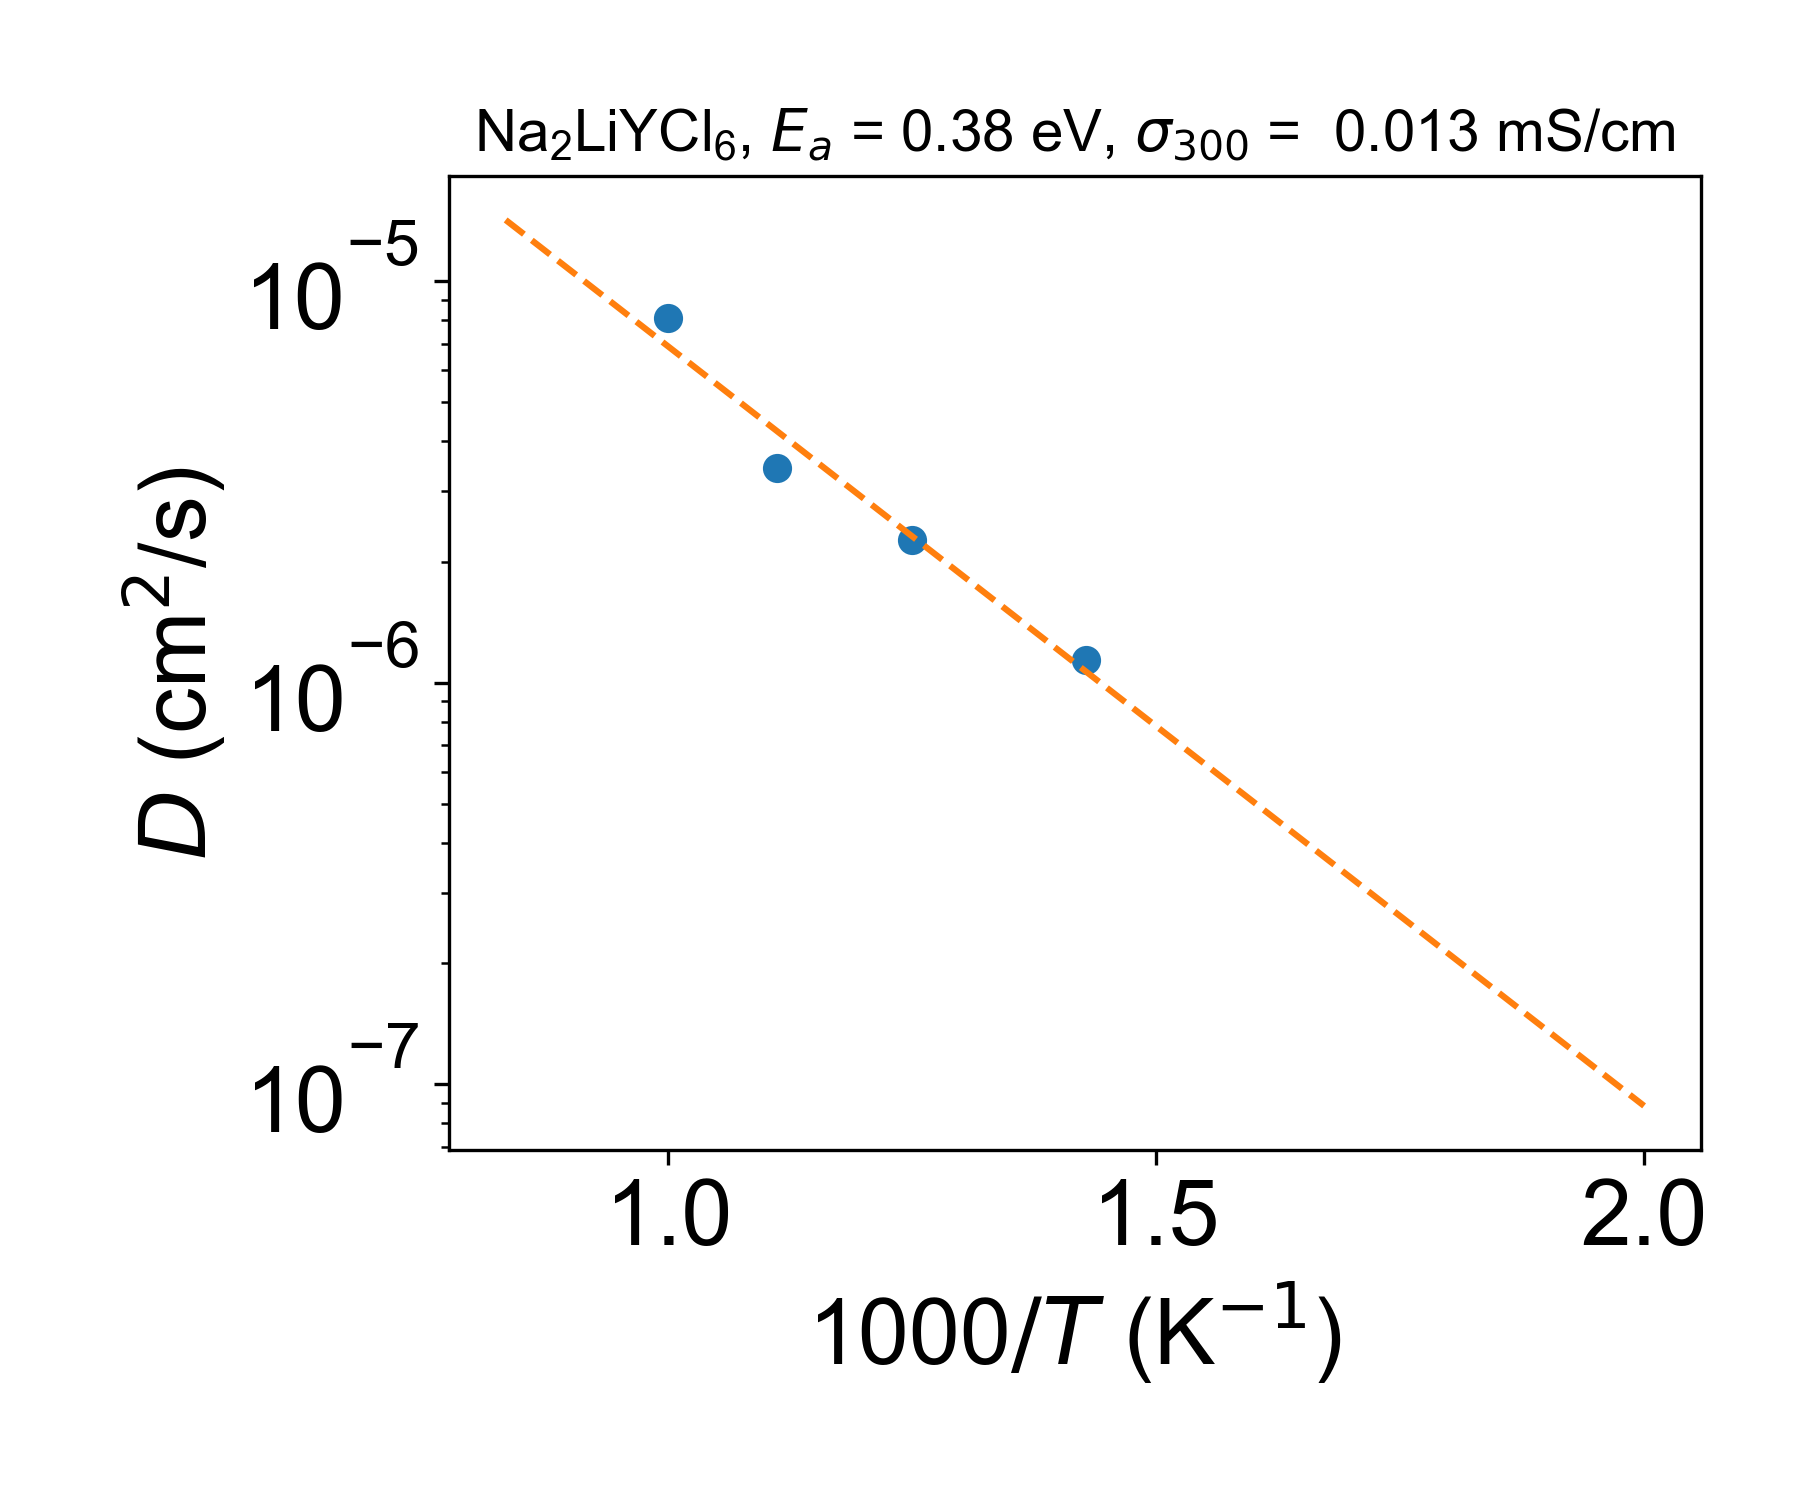
Table S1 shows the elemental compositions of the NaxLi3-xYCl6 series obtained from SEM/EDS analysis. \AcPXRD patterns are shown in Figures S5, S6, and S7. Figure S8 show the elemental ratios derived from the PXRD data.
| Nominal composition | Na | Li | Y | Cl |
|---|---|---|---|---|
| NaxLi3-xYCl6 | ||||
| 2.8 (2) | – | 1 | 5.5 (3) | |
| 2.1 (2) | – | 1 | 5.0 (5) | |
| 1.4 (6) | – | 1 | 5.0 (4) | |
| 1.1 (4) | – | 1 | 4.5 (6) | |
| 0.5 (1) | – | 1 | 4.3 (9) | |
| – | – | 1 | 4.7 (4) | |
| \botrule |