Hidden high ionization lines in the low luminosity type II SN 2021gmj
Abstract
We present comprehensive optical observations of SN 2021gmj, a type II supernova (SN II) discovered within a day of explosion by the Distance Less Than 40 Mpc (DLT40) survey. Follow up observations show that SN 2021gmj is a low luminosity SN II (LL SN II), with a peak magnitude and Fe II velocity of at 50 days past explosion. Using the expanding photosphere method we derive a distance of Mpc. From the tail of the light-curve we obtain a radioactive nickel mass of . The presence of circumstellar material (CSM) is suggested by the early light curve, early spectra and the presence of high velocity H in absorption. Analytical shock-cooling models of the early light curve cannot reproduce the fast rise, also supporting the idea that the early emission is partially powered by the interaction of the SN ejecta and CSM. The inferred low CSM mass of 0.025 in our hydrodynamic-modeling light curve analysis is also consistent with our spectroscopic observations. We observe a broad feature near 4600 Å, which may be high ionization lines of C, N or/and He II. This feature is reproduced by radiation hydrodynamic simulations of red supergiants with extended atmospheres. Several LL SNe II show similar spectral features implying that high density material around the progenitor may be common among them.
1 Introduction
Core collapse supernovae (CCSNe) result from the explosion of massive stars ( ). When a massive star retains more than of its hydrogen envelope, it explodes as a SN II (see Woosley et al. 1994; Sravan et al. 2019; Hiramatsu et al. 2021; Gilkis & Arcavi 2022). Recent studies have found the photometric and spectral properties of SNe II to be diverse (Anderson et al., 2014a; Sanders et al., 2015; Galbany et al., 2016; Valenti et al., 2016; Rubin et al., 2016; Pessi et al., 2019; de Jaeger et al., 2019; Hiramatsu et al., 2021). In terms of brightness, SNe II exhibit a large range of peak luminosities, from to mag in the -band (Anderson et al., 2014a; Valenti et al., 2016). During the plateau phase they also show a wide range of photometric decline rates that may correlate with the amount of hydrogen retained by the progenitor pre-explosion (e.g. Popov, 1993; Anderson et al., 2014a; Faran et al., 2014; Gutiérrez et al., 2014; Moriya et al., 2016; Hillier & Dessart, 2019). In addition, the light curve properties of SNe II also show heterogeneity at early phases (e.g. rise times, peak brightness and initial decline rates) that has been attributed to the interaction of the ejecta with circumstellar material (CSM) (Morozova et al., 2017, 2018; Subrayan et al., 2023; Hosseinzadeh et al., 2023).
Since the discovery of 1997D (de Mello et al., 1997; Turatto et al., 1998), the sub-group of SNe II that are particularly faint have been labeled low luminosity SNe II (LL SNe II). LL SNe II have a peak magnitude 16 mag (Spiro et al., 2014; Müller-Bravo et al., 2020), along with narrow spectral features (indicating low expansion velocities) (Pastorello et al., 2004; Spiro et al., 2014), suggesting explosion energies less than 1 foe1111 foe = ergs. In addition, LL SNe II decline more slowly during both the plateau and radioactive-decay light-curve phases than other SNe IIP (Anderson et al., 2014a; Valenti et al., 2016).
There are two scenarios that explain their observational characteristics. The first results from the explosion of a high mass star, , where material remains bound to the core post-collapse, forming a black hole as a remnant. In this scenario the total ejected mass is high, , but the radioactive yield is severely reduced due to fallback into the remnant (Zampieri et al., 1998). Secondly, Chugai & Utrobin (2000) proposed a scenario where the progenitor is a low-mass 8-12 Zero Age Main Sequence (ZAMS) star. Under this assumptions the ejecta mass is lower, , and the radioactive material is low due to the low mass of the progenitor’s iron core. Progenitor studies of LL SNe II, using either direct imaging (Smartt, 2009, 2015) or hydrodynamical models (Dessart et al., 2013; Spiro et al., 2014; Martinez & Bersten, 2019), have shown the LL SNe II progenitors to be red supergiants (RSGs) with ZAMS masses . The lack of observations of high mass progenitors favors the aforementioned low-mass progenitor scenario.
The very early spectra of type II SNe, within a few days of explosion, may also give us insight into the progenitors. In some instances, early spectra show narrow emission features which quickly disappear within days. The most common interpretation of these “flash features” is that they are produced by recombination of CSM after being ionized by the “flash” of hard radiation coming from either the shock-breakout or from the CSM-ejecta interaction (e.g. Niemela et al., 1985; Garnavich & Ann, 1994; Matheson et al., 2000; Leonard et al., 2000; Quimby et al., 2007; Gal-Yam et al., 2014; Shivvers et al., 2015; Yaron et al., 2017; Hosseinzadeh et al., 2018; Hiramatsu et al., 2021; Tartaglia et al., 2021; Bruch et al., 2021). These features have recently been observed to occur in of SNe II (Bruch et al., 2021). Khazov et al. (2016) suggests that the presence of flash features is related to SN luminosity, with SNe in their sample only showing flash features for mag and, in the same line, the Bruch et al. (2021) sample found that SNe without flash features are on average fainter. Despite that, recent studies have found LL SNe II with early spectral features related to CSM: SN 2016bkv (Hosseinzadeh et al., 2018), which was a LL SNe II with flash features and SN 2018lab (Pearson et al., 2023) that showed a ledge feature attributed to CSM interaction. Further study on the frequency of spectral features related to CSM in LL SNe II is required to understand the role of CSM in the diverse range of progenitors of SNe II.
In this paper we present optical observations and analysis of SN 2021gmj, a LL SNe II that shows early signatures indicative of CSM. In Section 2, we outline the observations taken and data reduction procedures. The reddening along the line of sight towards SN 2021gmj is estimated in Section 3. Section 4 describes the properties of NGC 3310, the host of SN 2021gmj. In Section 5, we estimate a distance to SN 2021gmj with the expanding photophere method (EPM). Section 6 goes on to describe the photometric evolution, including a multi-band and pseudo-bolometric comparison with other LL SNe II. We obtain the nickel mass in Section 7. Following this measurement, in Section 8 we study the early light-curve with analytic and hydrodynamic models to constrain the progenitor properties. Section 9 characterizes the spectroscopic observations of SN 2021gmj and describes the overall evolution, together with the early spectral features and possible signatures of CSM interaction. We then discuss the low progenitor mass of SN 2021gmj through analysis of nebular spectra in Section 10. In Section 11, we discuss the analysis performed and its implications. Our conclusions are presented in Section 12.
2 Observations and Data Reduction
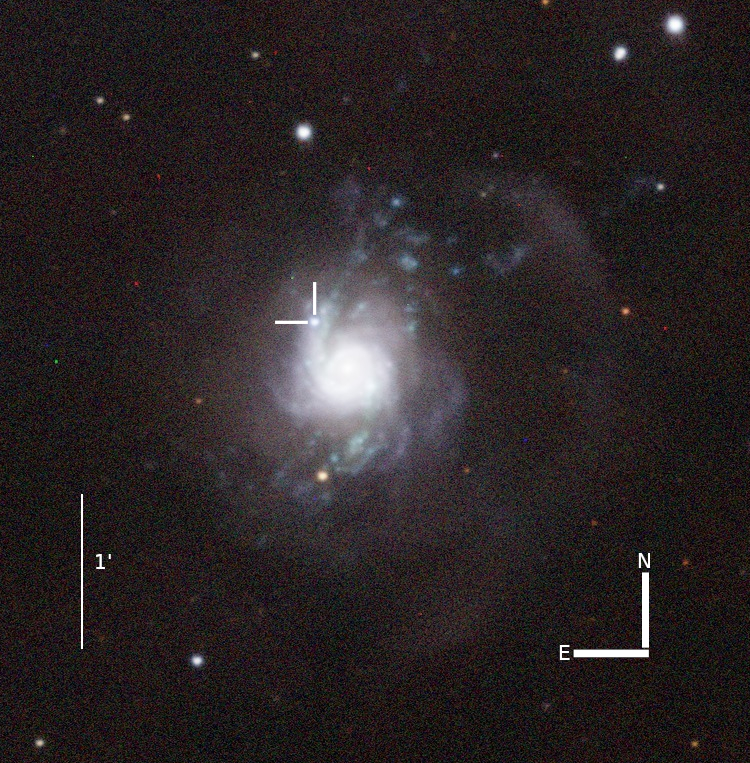
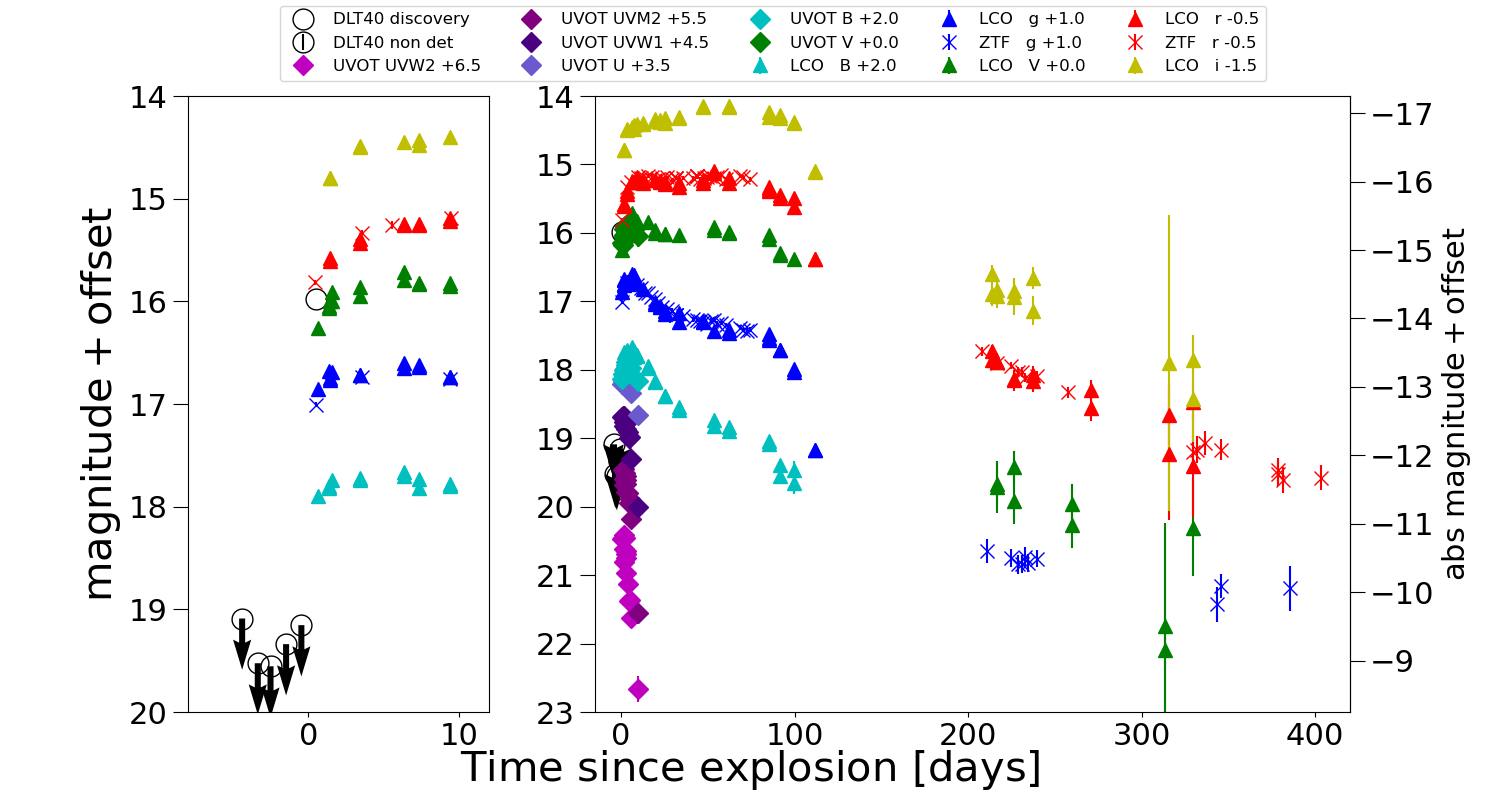
SN 2021gmj was discovered at RA(2000), Dec(2000) in the galaxy NGC 3310 (Figure 1) with the PROMPT-USASK telescope at Sleaford Observatory, Canada on 2021 March 20.32 UT (JD 2,459,293.82) at an apparent magnitude of 15.98 mag (Valenti et al., 2021) as part of the Distance Less Than 40 Mpc Survey (DLT40; Tartaglia et al., 2018). A non-detection 24hr earlier (JD 2,459,292.82), with a limiting magnitude of , constrains the explosion epoch. The SN was independently detected by the Zwicky Transient Facility (ZTF; Bellm et al., 2019; Graham et al., 2019) on the same night as the reported discovery in and bands at and mag, respectively, at JD 24,592,93.74 or 2021 March 20.24 UT (Zimmerman et al., 2021). Given the well-constrained last non-detection from DLT40 observations, we adopt a explosion date of 2021 March 19.78 UT throughout this paper. This date corresponds to the midpoint between the last non-detection and the discovery. The explosion epoch and error is then JD 2,459,293.28. In Table 1 we show basic information and parameters of SN 2021gmj derived in this work.
| Property | value |
|---|---|
| RA(2000) | |
| Dec(2000) | |
| Last non-detection | JD 2,459,292.82 |
| First detection | JD 2,459,293.74 |
| Explosion epoch | JD 2,459,293.3 |
| Host | NGC 3310 |
| Host Redshift | 0.00331 |
| mag | |
| mag | |
| Distance | Mpc |
| mag | |
| mag |
Shortly after discovery, high-cadence observations were triggered with the Las Cumbres Observatory (Brown et al., 2013) and with the Neil Gehrels Swift Observatory (Gehrels et al., 2004). Las Cumbres photometric data were reduced using the PyRAF-based pipeline lcogtsnpipe (Valenti et al., 2016). Apparent magnitudes were calibrated using the Sloan () and APASS () catalogs. Due to the high background emission from the host at or near the SN location, photometry was obtained after template subtraction using HOTPANTS (Becker, 2015). The templates used were obtained through the same instruments: Sinistro for the 1m data (Brown et al., 2011) and MuSCAT3 (Narita et al., 2020) for the single 2m epoch. Swift UVOT images were reduced as described in Brown et al. (2009). The SN coincidence loss corrected counts were obtained with a 5” aperture. The galaxy background coincidence loss corrected counts were extracted from the same region using a template image obtained in October 2021. We use updated zero-points that supersede Breeveld et al. (2011) to obtain the final calibrated magnitudes, with time-dependent sensitivity corrections updated in 2020222 https://heasarc.gsfc.nasa.gov/FTP/caldb/data/swift/uvota/. Unfiltered () DLT40 images were processed with a PyRAF-based pipeline. Background contamination was removed by subtracting a reference image, and the aperture photometry was extracted from the subtracted images. The final photometry is calibrated to the band using the APASS catalog. Light curves are shown in Figure 2.
Spectroscopic observations of SN 2021gmj started on 2021 March 20, approximately one day after discovery. The first spectrum was taken with the Liverpool Telescope, which showed SN 2021gmj to be a young SN II (Perley, 2021). Another early spectrum was taken with Ekar Copernico Telescope on 2021 March 21, confirming the classification of SN 2021gmj as a SN II (Ciroi et al., 2021). Our spectroscopic follow up started on 2021 March 21 with Binospec (Fabricant et al., 2019) on the 6.5 m MMT telescope and the FLOYDS spectrograph (Brown et al., 2013) on the 2 m Faulkes Telescope North. We also followed up with the Kast spectrograph at Lick observatory and LRIS and DEIMOS at Keck observatories. The FLOYDS spectra were reduced following standard procedures using the floyds pipeline (Valenti et al., 2014a). The MMT data were triggered using PyMMT (Shrestha et al., 2023) and reduced using the Binospec pipeline (Kansky et al., 2019). The Kast spectra were reduced using standard IRAF/Pyraf (Science Software Branch at STScI, 2012) and python routines for bias/overscan subtractions and flat-fielding. Finally, LRIS and DEIMOS data were reduced using standard methods with the Pypelt data reduction pipeline (Prochaska et al., 2020). A summary of spectroscopic observations is given in Table 2.
| UT Date | MJD | Phase (days) | Wavelength range (Å) | Telescope/Instrument |
|---|---|---|---|---|
| 2021-03-20 | 59293.86 | 1.08 | 4020-7994 | LT/SPRAT |
| 2021-03-21 | 59294.06 | 1.28 | 3383-8174 | EKAR/AFOSC |
| 2021-03-21 | 59294.11 | 1.33 | 3827-9198 | MMT/Binospec |
| 2021-03-22 | 59295.23 | 2.45 | 3200-10000 | LCO-2m/FLOYDS |
| 2021-03-23 | 59296.15 | 3.37 | 3827-9198 | MMT/Binospec |
| 2021-03-26 | 59299.47 | 6.69 | 3200-10000 | LCO-2m/FLOYDS |
| 2021-03-28 | 59301.23 | 8.45 | 3200-10000 | LCO-2m/FLOYDS |
| 2021-04-01 | 59305.13 | 12.35 | 5688-7210 | MMT/Binospec |
| 2021-04-02 | 59306.32 | 13.54 | 3200-10000 | LCO-2m/FLOYDS |
| 2021-04-05 | 59309.16 | 16.38 | 3620-10720 | SHANE/KAST |
| 2021-04-08 | 59312.4 | 19.62 | 3200-10000 | LCO-2m/FLOYDS |
| 2021-04-14 | 59318.28 | 25.5 | 3622-10750 | SHANE/KAST |
| 2021-04-14 | 59318.42 | 25.64 | 3200-10000 | LCO-2m/FLOYDS |
| 2021-04-17 | 59321.21 | 28.43 | 5688-7210 | MMT/Binospec |
| 2021-04-18 | 59322.18 | 29.4 | 3632-10680 | SHANE/KAST |
| 2021-04-22 | 59326.32 | 33.54 | 3200-10000 | LCO-2m/FLOYDS |
| 2021-04-28 | 59332.32 | 39.54 | 3200-10000 | LCO-2m/FLOYDS |
| 2021-05-09 | 59343.32 | 50.54 | 3642-10690 | SHANE/KAST |
| 2021-05-15 | 59349.16 | 56.38 | 5207-7703 | MMT/Binospec |
| 2021-05-18 | 59352.28 | 59.5 | 3628-10752 | SHANE/KAST |
| 2021-05-28 | 59362.3 | 69.52 | 3200-10000 | LCO-2m/FLOYDS |
| 2021-06-05 | 59370.31 | 77.53 | 3626-10754 | SHANE/KAST |
| 2021-10-11 | 59496.61 | 203.83 | 4401-9126 | DEIMOS/Keck |
| 2021-11-03 | 59521.5 | 228.72 | 3624-10720 | SHANE/KAST |
| 2022-06-21 | 59695.34 | 402.56 | 5380-10311 | LRIS/Keck |
3 Reddening
For the Milky Way line of sight reddening of SN 2021gmj we use the dust map from Schlafly & Finkbeiner (2011). This map gives a reddening of mag. The medium-resolution MMT spectra taken on 2021 April 1 and 2021 April 17 show Na I D lines from the Milky Way and NGC 3310. Host Na I D lines, 5890 (D2) and 5896 (D1), in both medium-resolution spectra were measured giving equivalent width (EW) values of 0.08 Å and 0.19 Å on 2021 April 1 and 0.07 Å and 0.14 Å on 2021 April 17 for D1 and D2, respectively. Both epoch measurements are consistent within 25% of each other. Using equation 9 from Poznanski et al. (2012), we find mag. Another method for estimating the reddening uses the diffuse interstellar band absorption at 5780 Å. However, this feature is not seen in any spectrum of SN 2021gmj, which is consistent with the low reddening derived from Na I D lines (Phillips et al., 2013).
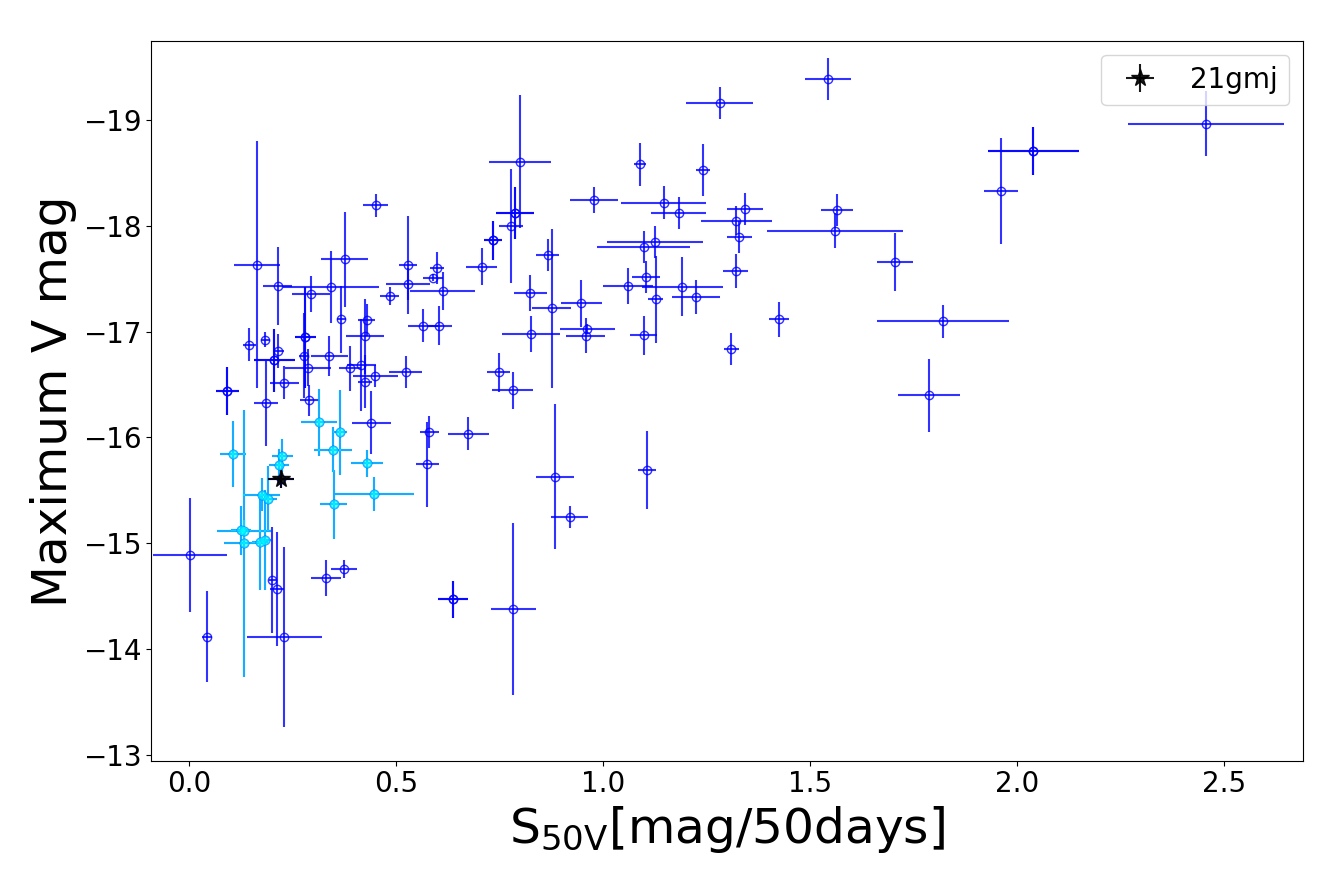
As a sanity check of our estimated reddening we compared SN 2021gmj colors to other SNe II. The color evolution of SNe II correlates with the slope of the -band light-curve (de Jaeger et al., 2018). For this reason we compare the color curve of SN 2021gmj to LLSNe II with similar band slope. To select the sample we used the Davis supernova database333http://dark.physics.ucdavis.edu/sndavis/transient and retrieved the measured V-band slope of the plateau, and the V-band maximum . In this two dimensional parameter space of (,) we want to select the SNe that are similar to SN 2021gmj. We calculated a distance taking into account the variance in each parameter. This distance (Chandra et al., 1936) between two vectors x (in this case x represents the - duple for SN 2021gmj) and y (vector for the comparison SN) is evaluated as:
| (1) |
Where is the standard deviation for the corresponding parameter. After measuring the distances between SN 2021gmj and all the SNe we selected the 16 nearest SNe. In Figure 3 we show the versus scatter plot with SN 2021gmj and the comparison sample highlighted. Out of this list of 16 we picked the closest 10 that had the required data to compare the B-V color. Additionally, we included SN 2006bp as it is an object that shows similar spectral features as SN 2021gmj (See Section 9.5). The resulting color curves can be seen in Figure 4. SN 2021gmj is the bluest in color evolution, consistent with the low reddening found from the equivalent width of the Na I D lines. Because of this, throughout this paper we adopt a total reddening of mag, as well as an extinction law with (Cardelli et al., 1989).

4 Host Properties
NGC 3310 is a starburst galaxy with a peculiar morphology, showing shell/bow structures and a prominent circumnuclear starburst ring. This galaxy has been extensively studied from X-ray to radio wavelengths. From these studies we know that NGC 3310 has been part of at least a single minor merger, which triggered a star formation burst that has lasted 10-100 Myr (Elmegreen et al., 2002). This merger enriched the NGC 3310 disk with low metallicity gas, causing the disk and circumnuclear region to have a metal abundance of 0.2-0.4 (Miralles-Caballero et al., 2014; Hägele et al., 2010; Wehner et al., 2006; Pastoriza et al., 1993).
NGC 3310 was observed as part of the PPAK Integral Field Spectroscopy Nearby Galaxies Survey (PINGS, Rosales-Ortega et al., 2010) and details about the observation and reduction is given in Miralles-Caballero et al. (2014). The three pointing mosaic has a spatial resolution of 1 arcsec squared per spaxel and the field of view fully covers the SN 2021gmj explosion site. A map of the H emission of NGC 3310 is shown in Figure 5. To study the properties of the SN 2021gmj explosion site, we follow the method presented in several previous works (e.g. Galbany et al., 2016, 2018). The key output of the analysis pipeline is a stellar continuum subtracted emission line spectrum of the SN region. The region has a physical size of on the 1 arcsec2 spaxel.
From the spectrum we can obtain key properties of the ionized gas surrounding the SN explosion site. In Table 3 we show the values obtained for the star formation rate density (), equivalent width of H (EW()), reddening as measured by the Balmer decrement, and three different oxygen abundance measurements from the N2, O3N2 and D16 calibrations. Both the SFR intensity and EW() show the starburst character of the host. With being in the 20% upper percentile of the PISCO sample (Galbany et al., 2018) and with the EW() measurement being the second highest of the whole sample. All of our measurements of the oxygen abundance points to 0.4-0.5 times the solar value, which are consistent with previous measurements (Pastoriza et al., 1993). Our measured value belongs to the lowest 30% of the PISCO sample. The reddening is higher than our measured value for SN 2021gmj. This may be explained by the larger region probed by a single spaxel at SN 2021gmj location, which may have in average a higher reddening than the direct line of sight towards SN 2021gmj.
| Property | value | unit | PISCO mean∗ |
|---|---|---|---|
| (SFR) | 0.065 0.001 | 0.013 | |
| E(B-V) | 0.20 0.02 | mag | – |
| EW(H) | 289.2 0.3 | Å | 37.4 |
| 12+ O/H (N2) | 8.5 0.1 | dex | – |
| 12+ O/H (O3N2) | 8.43 0.07 | dex | – |
| 12+ O/H (D16) | 8.40 0.07 | dex | 8.65 |
| (*): If published. |

5 Distance with the Expanding Photosphere Method
The distance to NGC 3310 has available measurements using calibrations of the Tully-Fisher (TF) relationship (de Vaucouleurs et al., 1981; Bottinelli et al., 1984; Giraud, 1985; Bottinelli et al., 1986; Tully & Fisher, 1988). The most recent TF distance has a value of 18.7 Mpc ( mag, Tully & Fisher, 1988). While the TF relationship works well for most spiral galaxies, the intrinsic scatter makes the distance to a single galaxy inaccurate (Czerny et al., 2018). Thus to better constrain the distance to NGC 3310 we use the EPM originally developed by Kirshner & Kwan (1974). The EPM is based on a similar method employed for pulsating variable stars from Baade (1926) and assumes that the photosphere is homologously expanding. We can obtain the distance from the relation
| (2) |
with the distance, the photospheric velocity, the angular size of the photosphere, and the explosion epoch. Similar to the methodology of previous work Hamuy et al. (2001); Leonard et al. (2003); Dessart & Hillier (2005a); Jones et al. (2009) , the photometry can be combined to write the residuals
| (3) |
which, after minimizing these residuals, aloud to simultaneously derive the color temperature () and angular size (). is the dilution factor, the synthetic magnitude obtained from a blackbody at temperature , the extinction, the observed magnitude, and the filter set. The corresponding errors for the magnitude and extinction are and , respectively. In this work we use the dilution factors from Jones et al. (2009).
For this work we use the filter set . To obtain magnitudes from our magnitudes we use the Lupton (2005) color transformations444https://www.sdss3.org/dr8/algorithms/sdssUBVRITransform.php#Lupton2005. The photospheric velocity is estimated by measuring the expansion velocity of Fe II . Later than approximately 50 days after explosion the relation between and becomes nonlinear (Jones et al., 2009), so we limit ourselves to epochs less than 50 days from explosion. SN 2021gmj spectroscopy has five epochs in this range where Fe II velocity was measured by fitting polynomials to the absorption profile of the Fe II feature. To obtain photometric measurements at each velocity epoch, we do a simple linear interpolation. We implemented a Markov-Chain Monte Carlo (MCMC) code using the python library emcee (Foreman-Mackey et al., 2013), that uses the residuals in equation (3) as the log-likelihood together with uniform priors on and . To estimate the optimal parameters of Equation (2) (i.e the distance and explosion epoch) we use our MCMC code with uniform priors on the explosion epoch and distance D. We use a wide prior for which covers 5 days before and 0.5 days after our initial guess: JD. Finally, we use a uniform prior between 0 and 100 Mpc in distance. We obtain a distance of Mpc and an explosion epoch consistent with our initially assumed value estimated in Section 2. This distance is consistent with the TF distances available in the literature. For the remainder of this paper we will adopt a distance of Mpc to SN2021gmj and therefore to NGC 3310.
6 Photometric Evolution
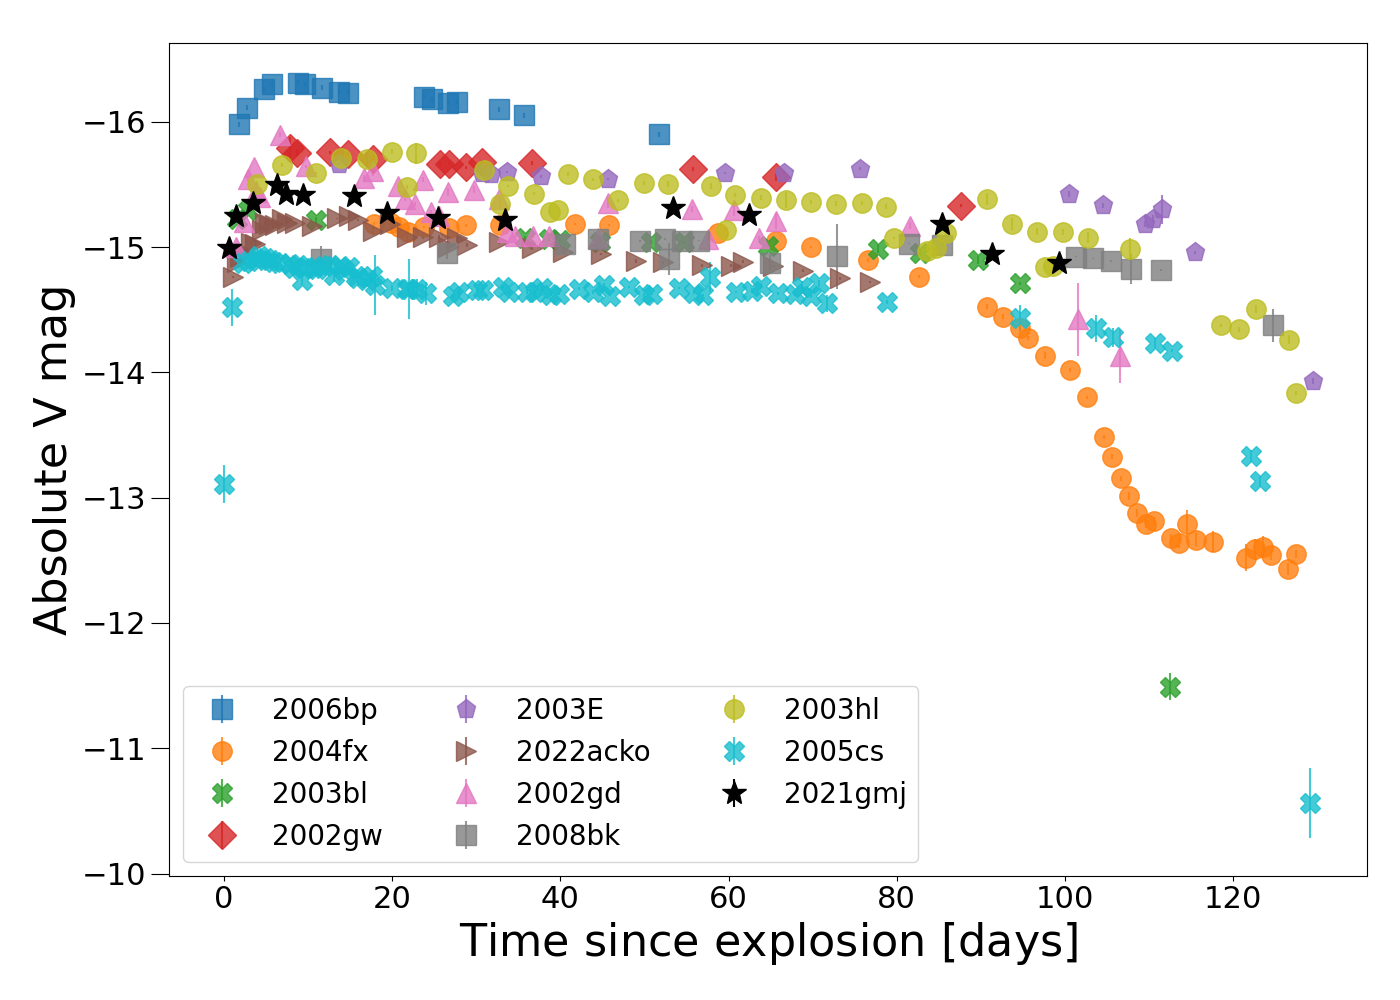
The full multiband light curve of SN 2021gmj are shown in Figure 2. The light curve evolution resembles that of other LL SNe II (Figure 3; Gall et al., 2015; Valenti et al., 2016). Our early detection and immediate high-cadence follow up observations capture the multiband light curve rise of 8.4 days reaching a maximum brightness of MV=15.45 mag. Following maximum, the light curve plateaus for about 100 days, with an average slope of 0.004 mag per 50 days in the V band. At the end of the plateau SN 2021gmj drops in brightness by 2 magnitudes in the optical bands. After the fall from plateau the light curve settles into the radioactive tail, with a roughly constant slope until our observations stopped around 400 days after explosion.
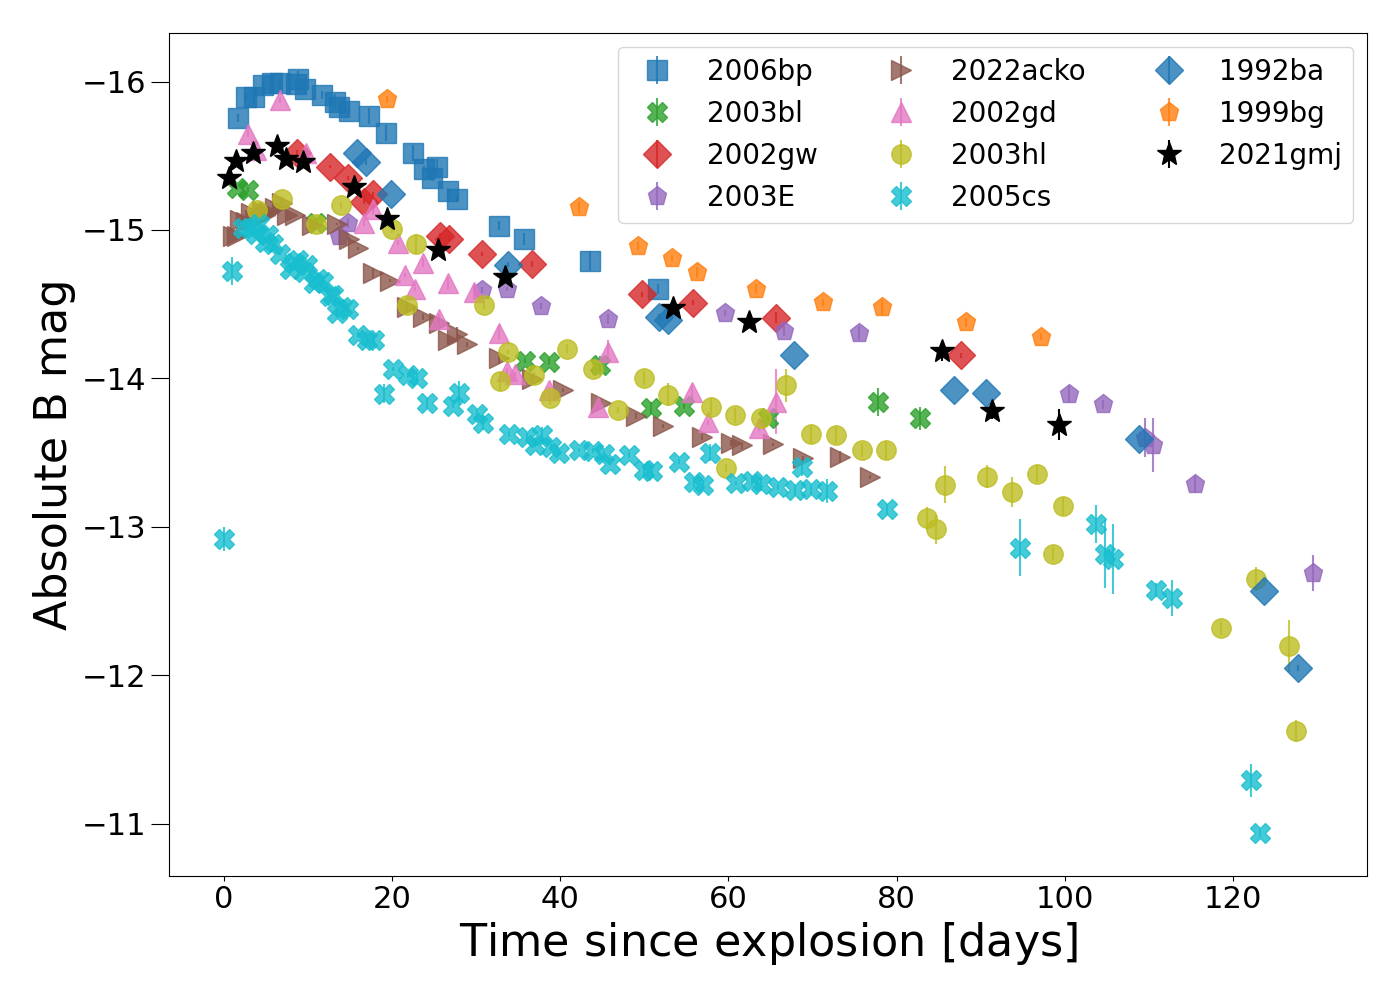
A comparison of the SN 2021gmj and -band light curves to other SNe II taken from our comparison sample is shown in Figure 6. The relatively bluer color of SN 2021gmj (see Figure 4) is explained by the filter brightness which is above the sample average after mid-plateau. The bluer color is also consistent with the weaker iron lines that we describe in Section 9. Blue colors have also been associated with interaction with CSM in bright SN II (Polshaw et al., 2016; Rodríguez et al., 2020).
6.1 Pseudo-bolometric light-curve
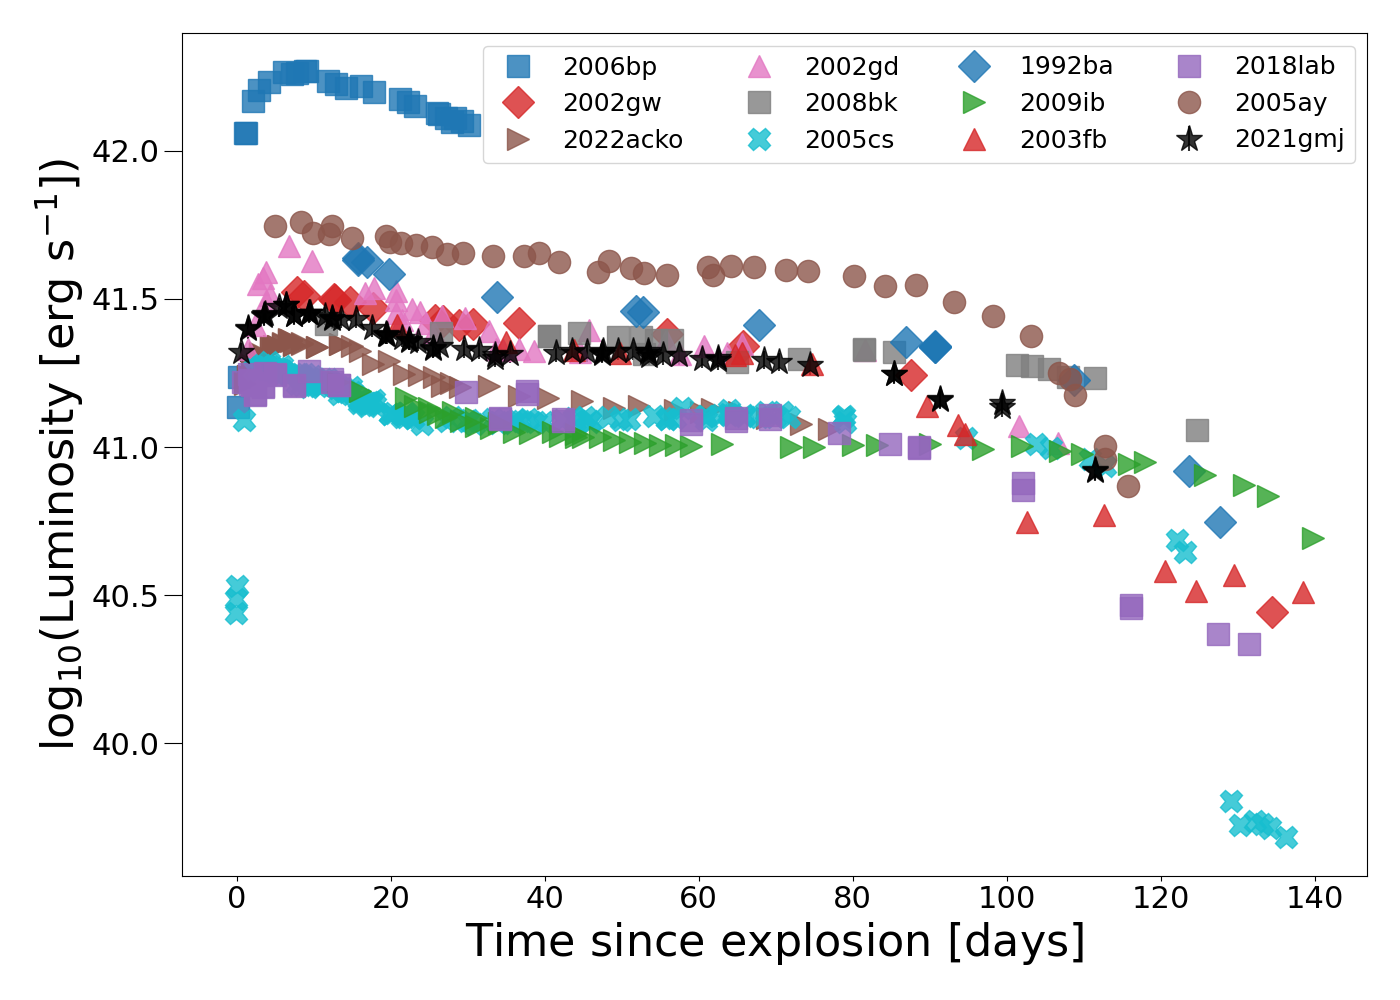
We constructed the BVri pseudo-bolometric light-curve for SN2021gmj through numerical integration of the spectral energy distribution and compare it to the BVri or BVRI pseudo-bolometric light curves of our comparison sample; see Figure 7. Despite the blue colors of SN 2021gmj, the bolometric luminosity is similar to the comparison sample in both plateau length and brightness, most closely matching SN2008bk, SN2002gw and SN2002gd.
7 Nickel mass
During the nebular phase, the light curve is powered by the radioactive decay of . We calculate the nickel mass of SN 2021gmj by constructing a pseudo-bolometric light curve from our Vri photometry 200-400 days past explosion (the B and g band observations were low S/N). We then, following Spiro et al. (2014), compare this integrated luminosity with the pseudo-bolometric luminosity of SN 1987A in the same bands and epoch. To obtain the sloan-filters photometry for SN 1987A we performed synthetic photometry using published optical spectra. With the pseudo-bolometric luminosity at each epoch, , we fit the following model to obtain the nickel mass ():
| (4) |
where is the time in days after explosion, 0.075 is the nickel mass of SN 1987A in solar mass units, and days, is the gamma ray trapping time scale for SN 1987A (Jerkstrand, 2011). This model assumes that the energy deposition of cobalt decay is diluted by the exponential factor (Clocchiatti & Wheeler, 1997). The two parameters, nickel mass () and trapping time scale (), of the model are fitted with an MCMC sampling. We use flat priors from 0 to 1 and from 0 to 1000 days for and , respectively. The MCMC chain gives the following means and errors, where the systematic error in is given by the error in distance modulus: and days as the most probable values. This nickel mass value is consistent with a low luminosity SN II (e.g. Valenti et al., 2016).
| Name | Explosion date | z | galactic E(B-V) | host E(B-V) | References | |||
|---|---|---|---|---|---|---|---|---|
| 1992ba | 2448889.00 8.00 | 0.00411 | 31.07 0.30 | 0.05 | 0.02 | 0.36 0.02 | -16.05 0.40 | 1,9,12,16 |
| 1999bg | 2451251.50 14.00 | - | 31.83 0.32 | 0.02 | 0.00 | 0.32 0.04 | -16.15 0.32 | 10 |
| 2002gd | 2452552.00 2.00 | 0.00895 | 32.90 0.21 | 0.06 | 0.00 | 0.35 0.05 | -15.89 0.21 | 9,10,12,16,17 |
| 2002gw | 2452560.00 5.00 | 0.01023 | 33.07 0.15 | 0.02 | 0.00 | 0.23 0.03 | -15.83 0.15 | 9,12,16,17 |
| 2003E | 2452635.00 7.00 | 0.01470 | 34.01 0.28 | 0.04 | 0.00 | 0.11 0.03 | -15.85 0.31 | 9,12 |
| 2003bl | 2452700.00 3.00 | 0.01432 | 34.07 0.30 | 0.02 | 0.00 | 0.19 0.02 | -15.42 0.31 | 9,12 |
| 2003fb | 2452777.00 6.00 | 0.01756 | 34.36 0.15 | 0.16 | 0.00 | 0.45 0.10 | -15.48 0.16 | 9,12 |
| 2003hl | 2452869.00 5.00 | 0.00818 | 32.16 0.10 | 0.06 | 0.00 | 0.43 0.04 | -15.76 0.13 | 9,10,12 |
| 2004fx | 2453304.00 4.00 | 0.00886 | 32.71 0.15 | 0.09 | 0.00 | 0.18 0.04 | -15.46 0.16 | 9 |
| 2005ay | 2453453.50 3.00 | 0.00270 | 31.15 0.40 | 0.02 | 0.08 | 0.19 0.03 | -16.32 0.40 | 2,10 |
| 2005cs | 2453549.50 1.00 | 0.00154 | 29.39 0.47 | 0.03 | 0.01 | 0.19 0.01 | -15.03 0.47 | 2,3,5,6,8,10,16 |
| 2006bp | 2453834.50 0.50 | 0.00351 | 31.42 0.45 | 0.03 | 0.40 | 0.53 0.02 | -17.63 0.46 | 4,5,8,16 |
| 2008bk | 2454543.40 6.00 | 0.00077 | 27.89 0.23 | 0.02 | 0.00 | 0.13 0.02 | -15.12 0.23 | 7,9,16 |
| 2009ib | 2455041.80 3.10 | 0.00435 | 30.32 0.45 | 0.03 | 0.13 | 0.17 0.02 | -15.01 0.45 | 11 |
| 2018lab | 2458481.40 1.00 | 0.00920 | 32.75 0.40 | 0.07 | 0.15 | 0.13 0.05 | -15.00 1.27 | 13,15 |
| 2022acko | 2459918.67 1.00 | 0.00526 | 31.39 0.33 | 0.03 | 0.03 | 0.35 0.03 | -15.40 0.33 | 14,15 |
Note. — Explosion dates and errors are taken from the listed references. References: (1):Hamuy (2001),(2):Tsvetkov et al. (2006), (3):Brown et al. (2007), (4):Quimby et al. (2007), (5):Dessart et al. (2008), (6):Pastorello et al. (2009), (7):Van Dyk et al. (2012), (8):Brown et al. (2014), (9):Anderson et al. (2014a), (10):Faran et al. (2014), (11):Takáts et al. (2015),(12):Galbany et al. (2016), (13):Pearson et al. (2023), (14):Bostroem et al. (2023), (15) Gaia Photometric Science Alerts, (16): Sternberg Astronomical Institute Supernova light-curve Catalogue: http://www.sai.msu.su/sn/sncat/, (17): VSNET: http://www.kusastro.kyoto-u.ac.jp/vsnet/index.html
8 Early light-curve modeling
8.1 Shock Cooling Models
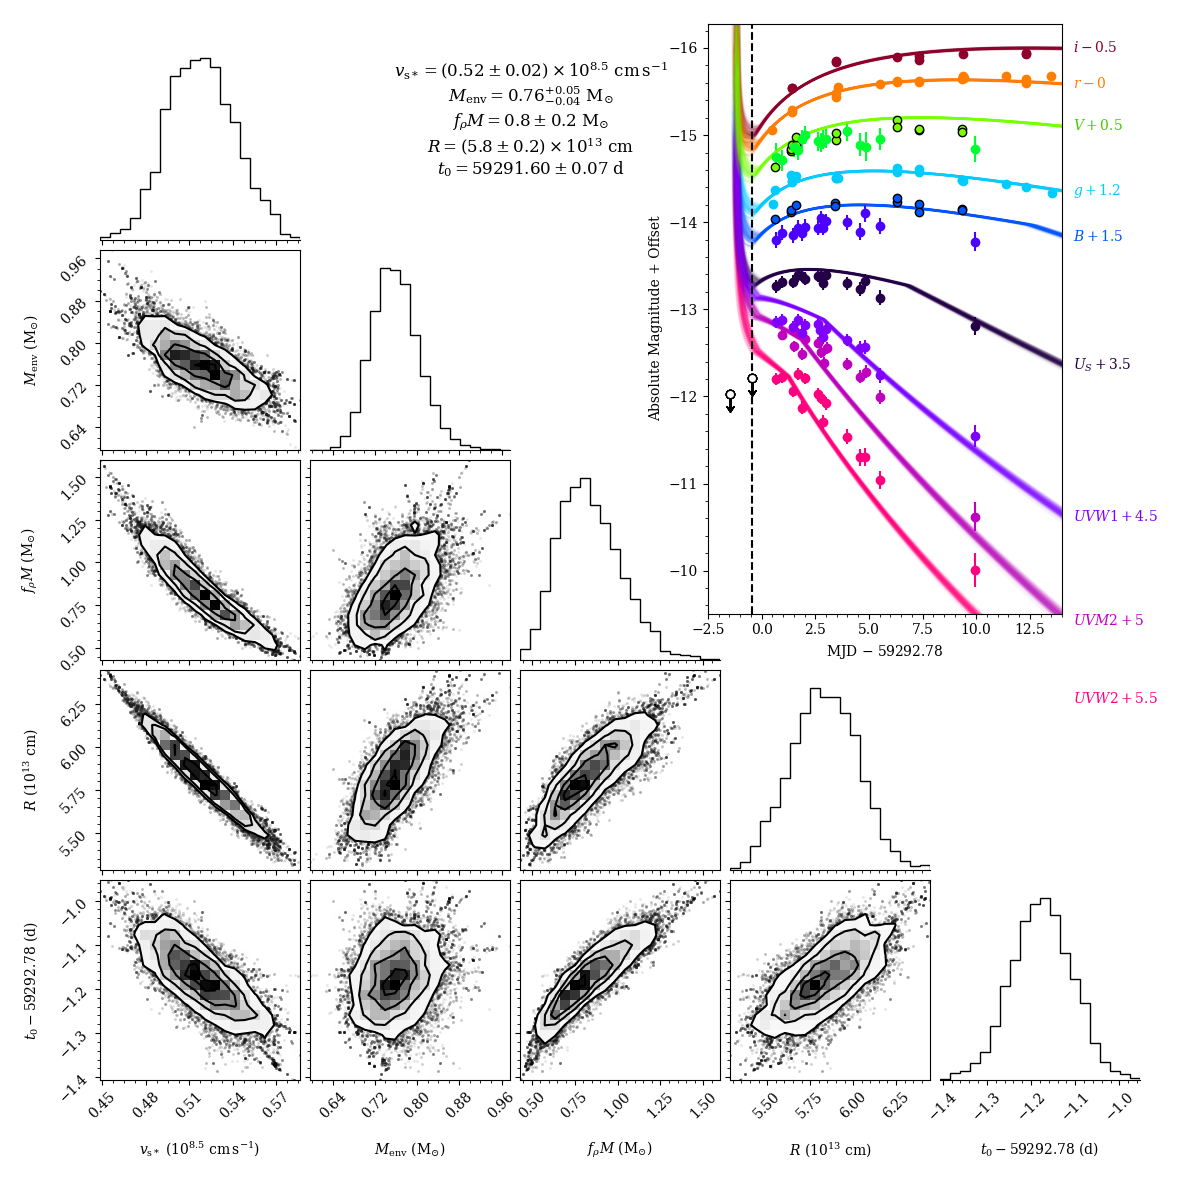
The shock-cooling models of Sapir & Waxman (2017) have been used to characterize the early light-curve properties of CC SNe (e.g. Hosseinzadeh et al., 2018; Andrews et al., 2019; Dong et al., 2021; Tartaglia et al., 2021; Shrestha et al., 2023; Hosseinzadeh et al., 2023). We follow the prescription of Hosseinzadeh et al. (2018), and use the MCMC routine implemented in the Light-Curve Fitting package (Hosseinzadeh & Gomez, 2020), to constrain the progenitor radius and to identify if shock cooling is the only energy source in the early light-curve evolution of SN 2021gmj.
We use our multiband UV+optical light curve up to 15 days post-explosion to fit for the model. The model assumes a uniform density core and a polytrope envelope suitable for a RSG. An MCMC routine is used to fit for the model parameters: the progenitor radius (R), a shock velocity scale (), the envelope mass (), the product of the total ejecta mass (M) times a constant of order unity (), hereafter “scaled ejecta mass” () and the time of explosion (). Flat priors are assumed for each parameter (see Hosseinzadeh et al. 2018 for a complete description of the codes and assumptions used) and in the case of the explosion epoch we take a flat prior -3.0 days to 0 days from discovery. The resulting posterior distributions and fits are shown in Figure 8.
The best fit radius of is consistent with typical RSG radii (Levesque et al., 2005). The model does not fit the UVOT bands satisfactorily. In particular the UV bands of the model underestimate the emission. This may be an indication that the early emission requires an extra source of energy (Hosseinzadeh et al., 2018; Dong et al., 2021; Pearson et al., 2023; Shrestha et al., 2023). Other sign of the struggle of the model to do a proper fit is seen in Figure 8, where we show how the model is inconsistent with our non-detections, by pushing the explosion epoch to lower values. This can be interpreted as the inability of the model to have a fast rise. This has also been interpreted as evidence of CSM interaction in previous work. In the next section we will find more evidence for the presence of material surrounding the progenitor of SN 2021gmj.
8.2 Hydrodynamic modeling of the light-curves with SNEC
To further constrain progenitor properties, and to understand if any contribution of the early light curve is coming from CSM interaction, we use the open source 1D hydrodynamic code: SuperNova Explosion Code (SNEC) (Morozova et al., 2015). SNEC takes as input a progenitor model (density, temperature, velocity, etc), an explosion energy E, a nickel mass and nickel mass outer boundary. Following Morozova et al. (2017), we fix the nickel mass boundary up to 5 as this weakly affects the light curve. We also fix the nickel mass to be as obtained in Section 7.
To convert bolometric properties of the model to broad-band photometry we assume a black-body spectral energy distribution. As the actual spectra of SNe show significant line-blanketing from metal lines, a black-body fit is not appropriate for short wavelengths. Due to this we exclude filters bluer than g. We also not include the band as it overlaps significantly with the and wavelength range. As done in Morozova et al. (2018); Dong et al. (2021), we use a two-step approach to fit our optical light curves. We use the solar metallicity progenitor models of Sukhbold et al. (2016) which were calculated with the stellar evolution code KEPLER (Weaver et al., 2017). We first constrain the explosion energy E and progenitor mass M by fitting the plateau between 27 and 112 days after explosion. These dates correspond to the end of the initial, s1 (Anderson et al., 2014a; Valenti et al., 2016), slope and the end of our data during the fall from plateau. We consider only RSG progenitors, using models with masses in the range 9-15 in steps of 0.5 and 17, 19 and 21 . Our grid of explosion energies ranges from 0.01 to 0.5 foe, with 20 points equally spaced, and we add 4 equally spaced points from 0.6 to 1.4 foe. We define the best fit E and M as the parameters which minimize the chi-square over all three bands considered at all epochs. The model with the lowest chi-square () has and foe.
After fixing E and M, we explore the influence of CSM by superimposing a steady wind to the original density profile. This wind extends from the progenitor radius up to a radius :
| (5) |
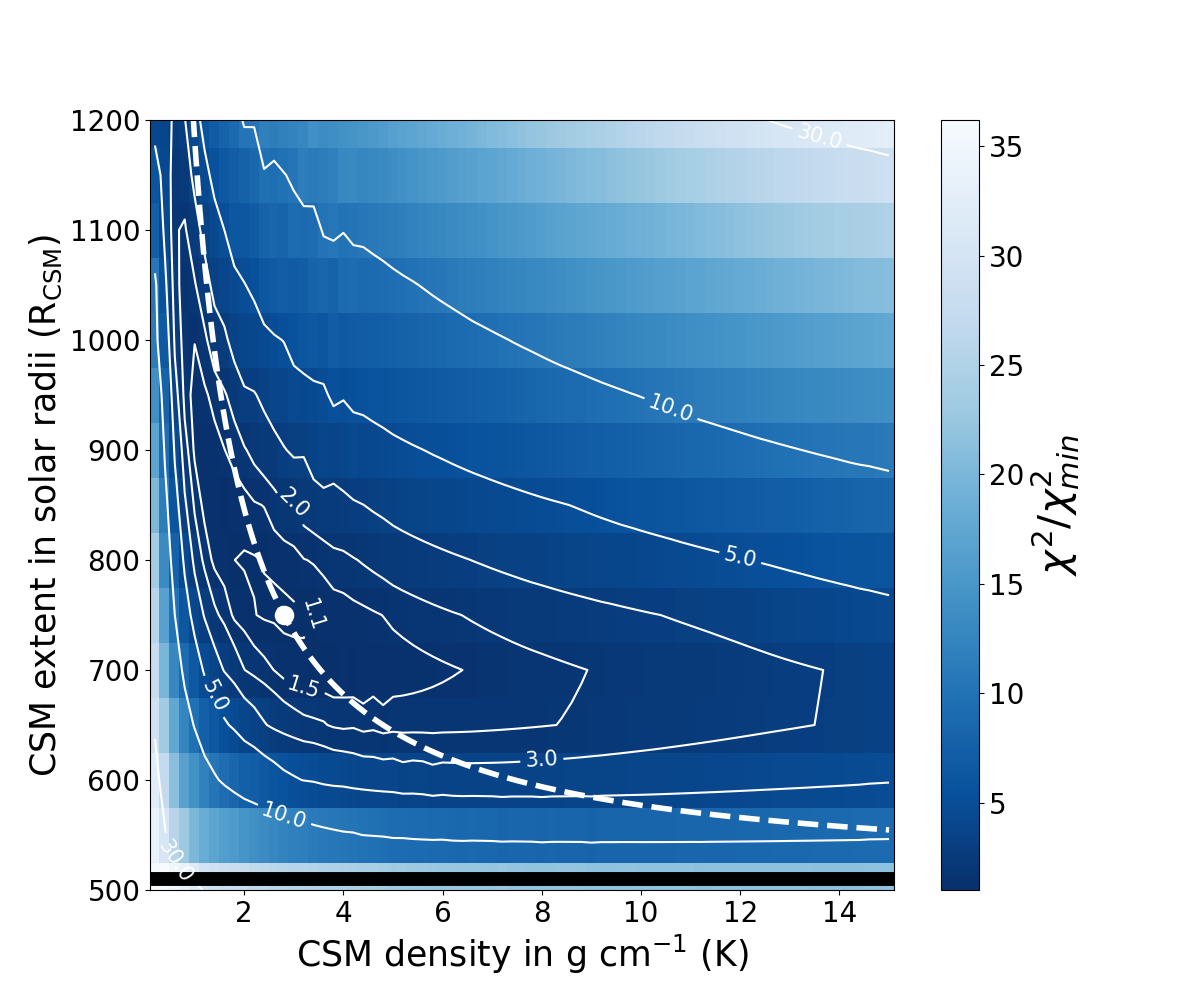
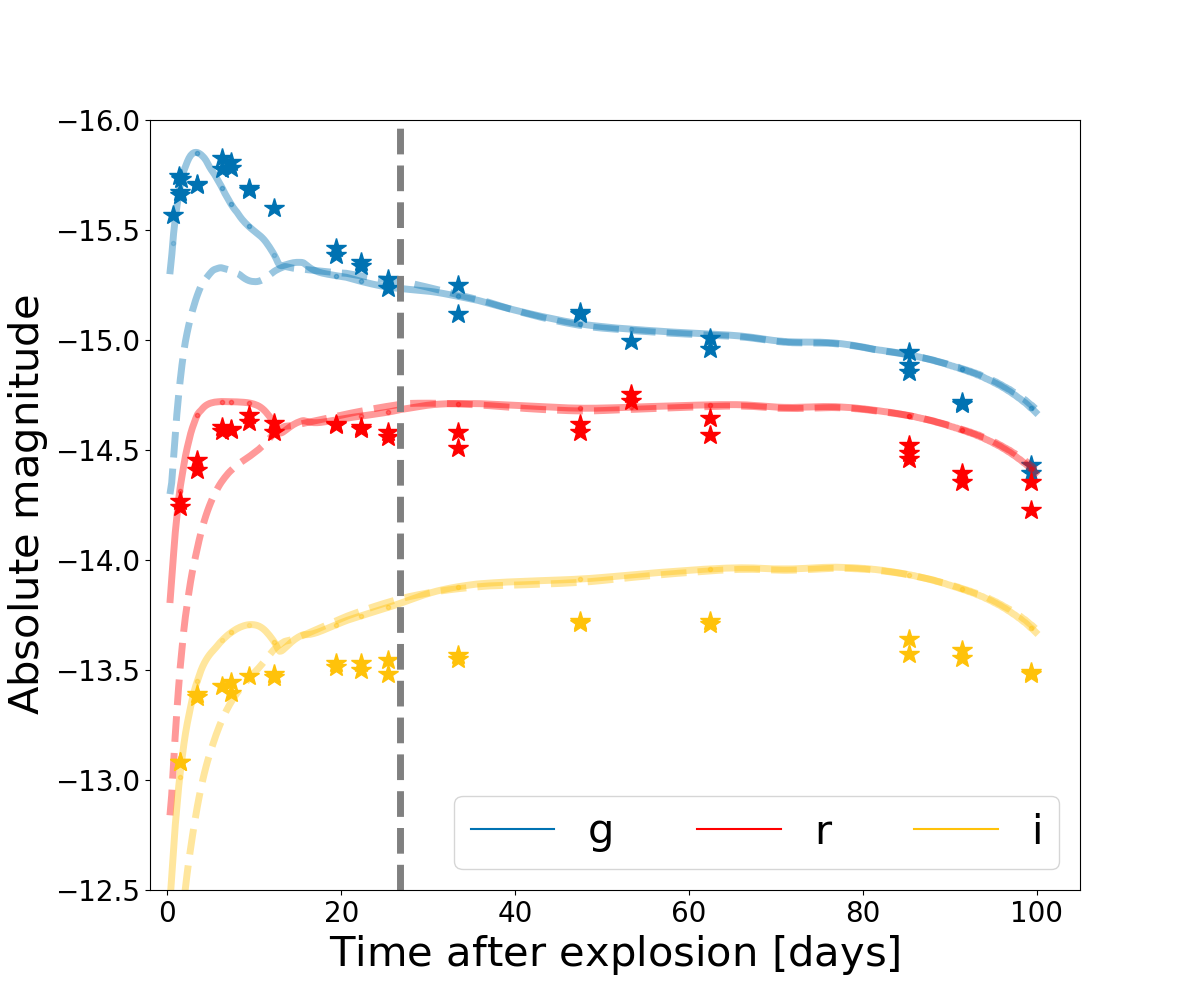
where K is the line density that can also be written as , where is the mass loss rate and is the velocity of the CSM. We run models with an outer CSM radius between 500 and 1200 R⊙ in steps of 50 R⊙ and density from 0.2 to 15 in steps of 0.2 . We again calculate the reduced chi-squared value for each model to obtain the best fit parameters, but this time we only compare the light curve between the explosion epoch and the end of the light-curve slope break ( phase) at 26.72 days. In Figure 9 we show the surface plot of the values in our R-K parameter space. Our best fit model has and R⊙ and there is a clear degeneracy between both parameters. This has been observed in previous work (e.g. Morozova et al., 2018) and indicated that the model more strongly constrains the total CSM mass, which is a product of K and in this simple model:
| (6) |
The total CSM mass of our best fit model is . This CSM mass is lower than those in the sample of Morozova et al. (2018) (without considering the lower limits), although it seems to follow the observed trends for a low mass and low energy explosion. Although the CSM mass is low, its importance for the early light curve is evident in Figure 10, where we show the light curves of the models with and without CSM. The fit in the g and r bands improve significantly due to the excess early emission coming from the ejecta-CSM interaction. However, the i-band model does not show a proper fit. This shows that although the hydrodynamic modeling that include CSM is an improvement, our simplified treatment of the model spectral energy distribution and our steady wind assumption for the mass loss maybe not be a good representation of the density profile of the inmediate vecinity of the progenitor of SN 2021gmj.
9 Spectroscopic Evolution
9.1 Overall evolution
The optical spectroscopic evolution of SN 2021gmj is shown in Figure 11. The earliest spectra shows a blue continuum with broad H emission and little absorption. These early spectra show no signs of prominent, narrow emission lines – sometimes referred to as ‘flash’ features – often seen in SNe II hours to a few days after explosion (e.g. Bruch et al., 2021). There is strong and broad emission around 4600 Å instead. Further analysis of this emission in the early spectra and implications are discussed in Section 9.5.
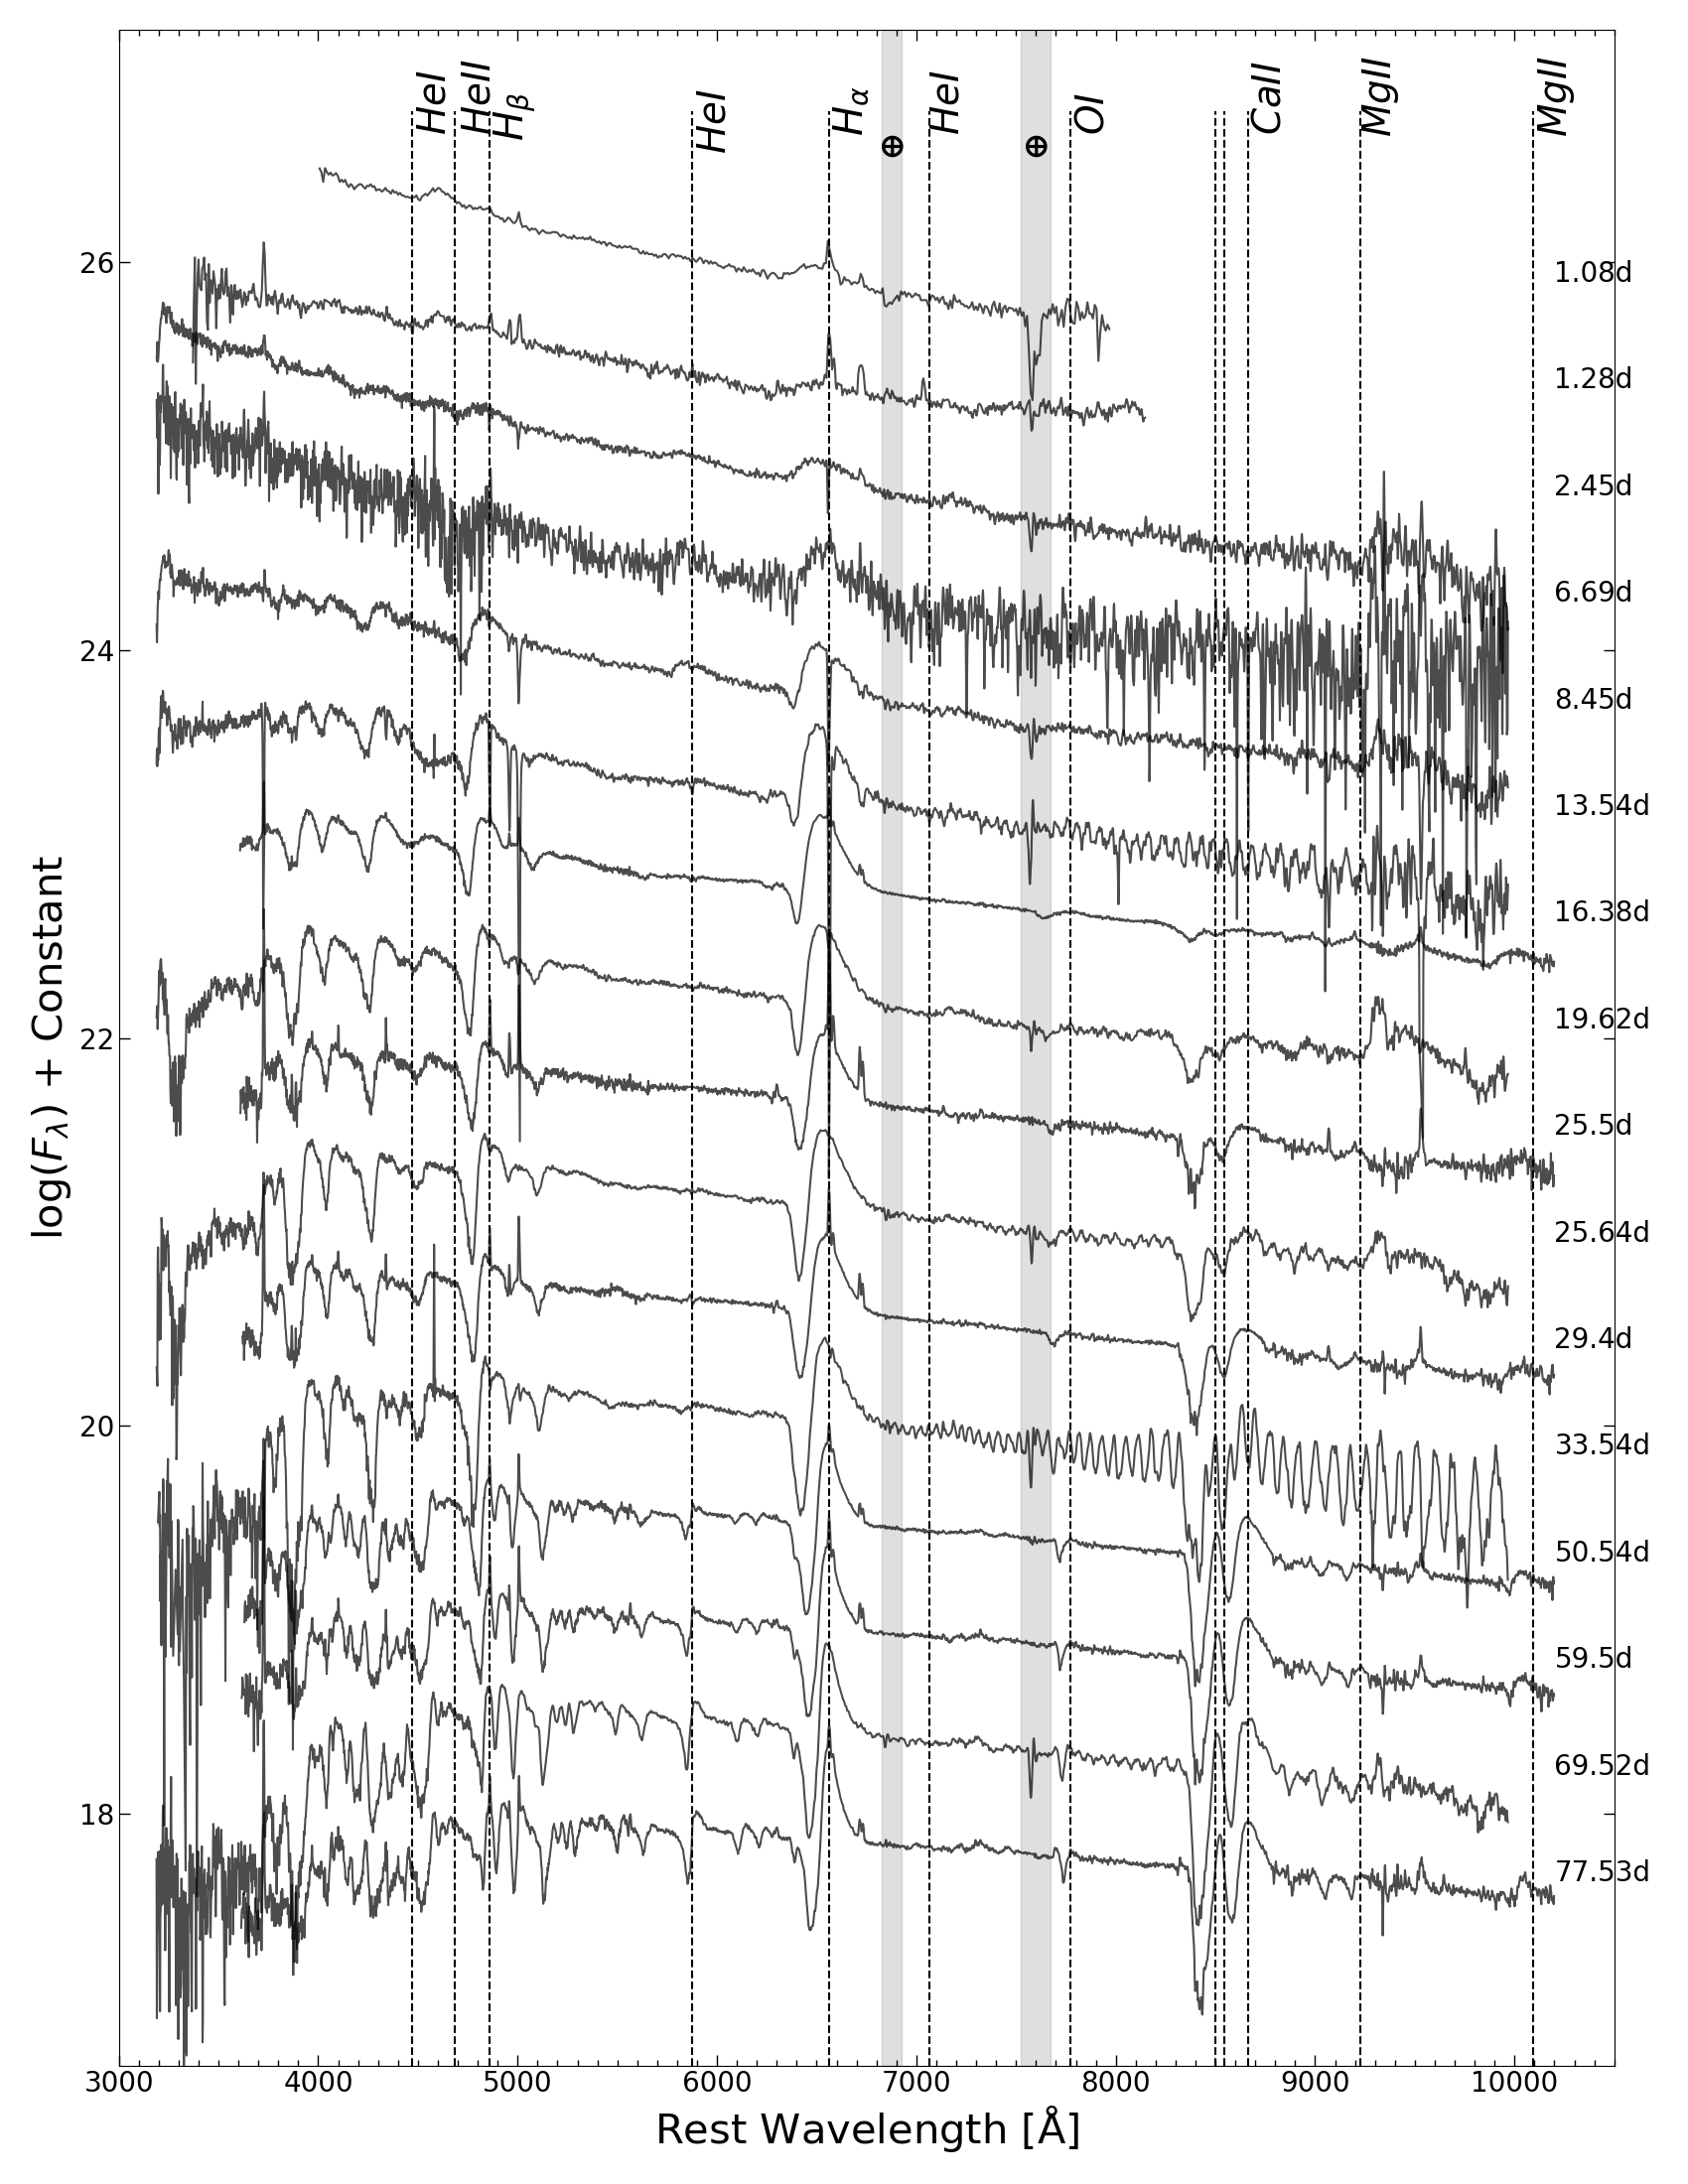
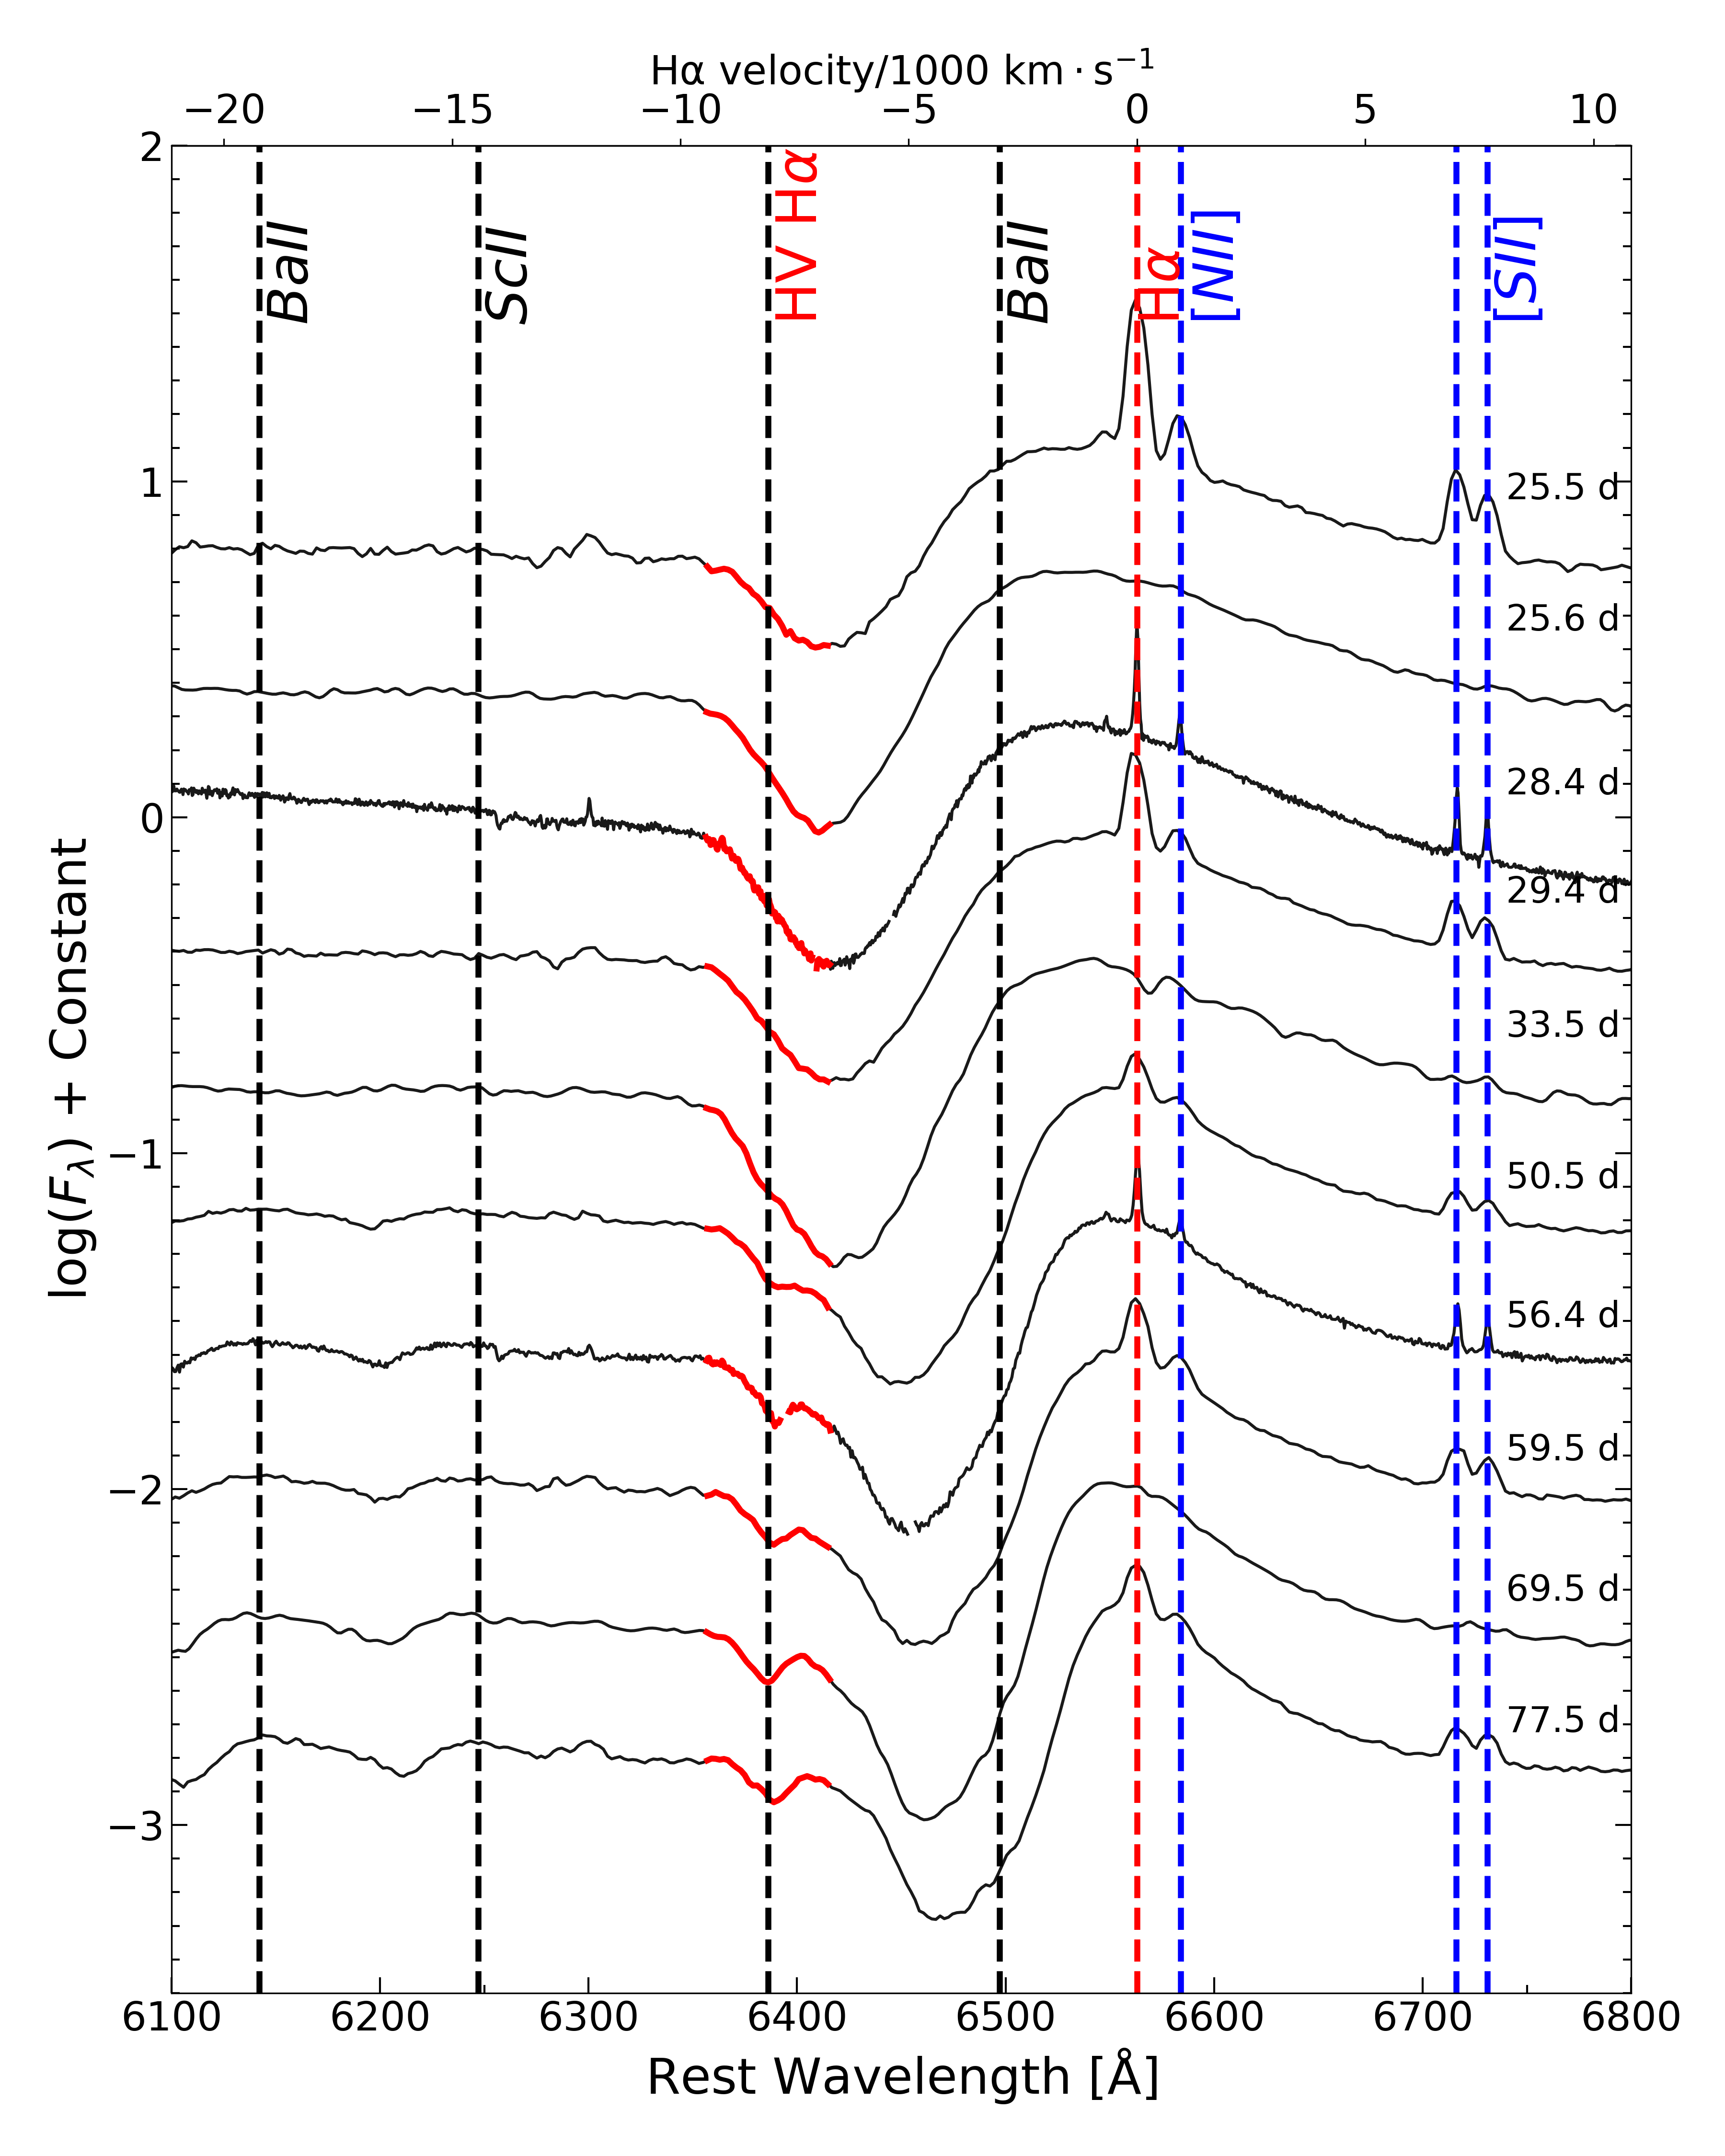
Over time the SN becomes redder and the P Cygni profiles of the hydrogen features become more prominent. Starting with the spectrum taken 13 days past explosion, Fe II is observed and can be used to trace the photosphere. Around 20 days past explosion, more Fe-group lines appear, namely Fe II , . At 20 days we also see the emergence of the Ca II NIR triplet around 8500 Å. In Figure 12, we show SN 2021gmj spectra in the region near H. Fifty days past explosion there is evidence of an absorption feature bluewards of H. At this phase, this feature is identified as high velocity H and is attributed to a dense shell that forms due to the interaction of CSM with the SNe ejecta (Chugai et al., 2007; Gutiérrez et al., 2014). With this interpretation we measure a velocity of for this feature.
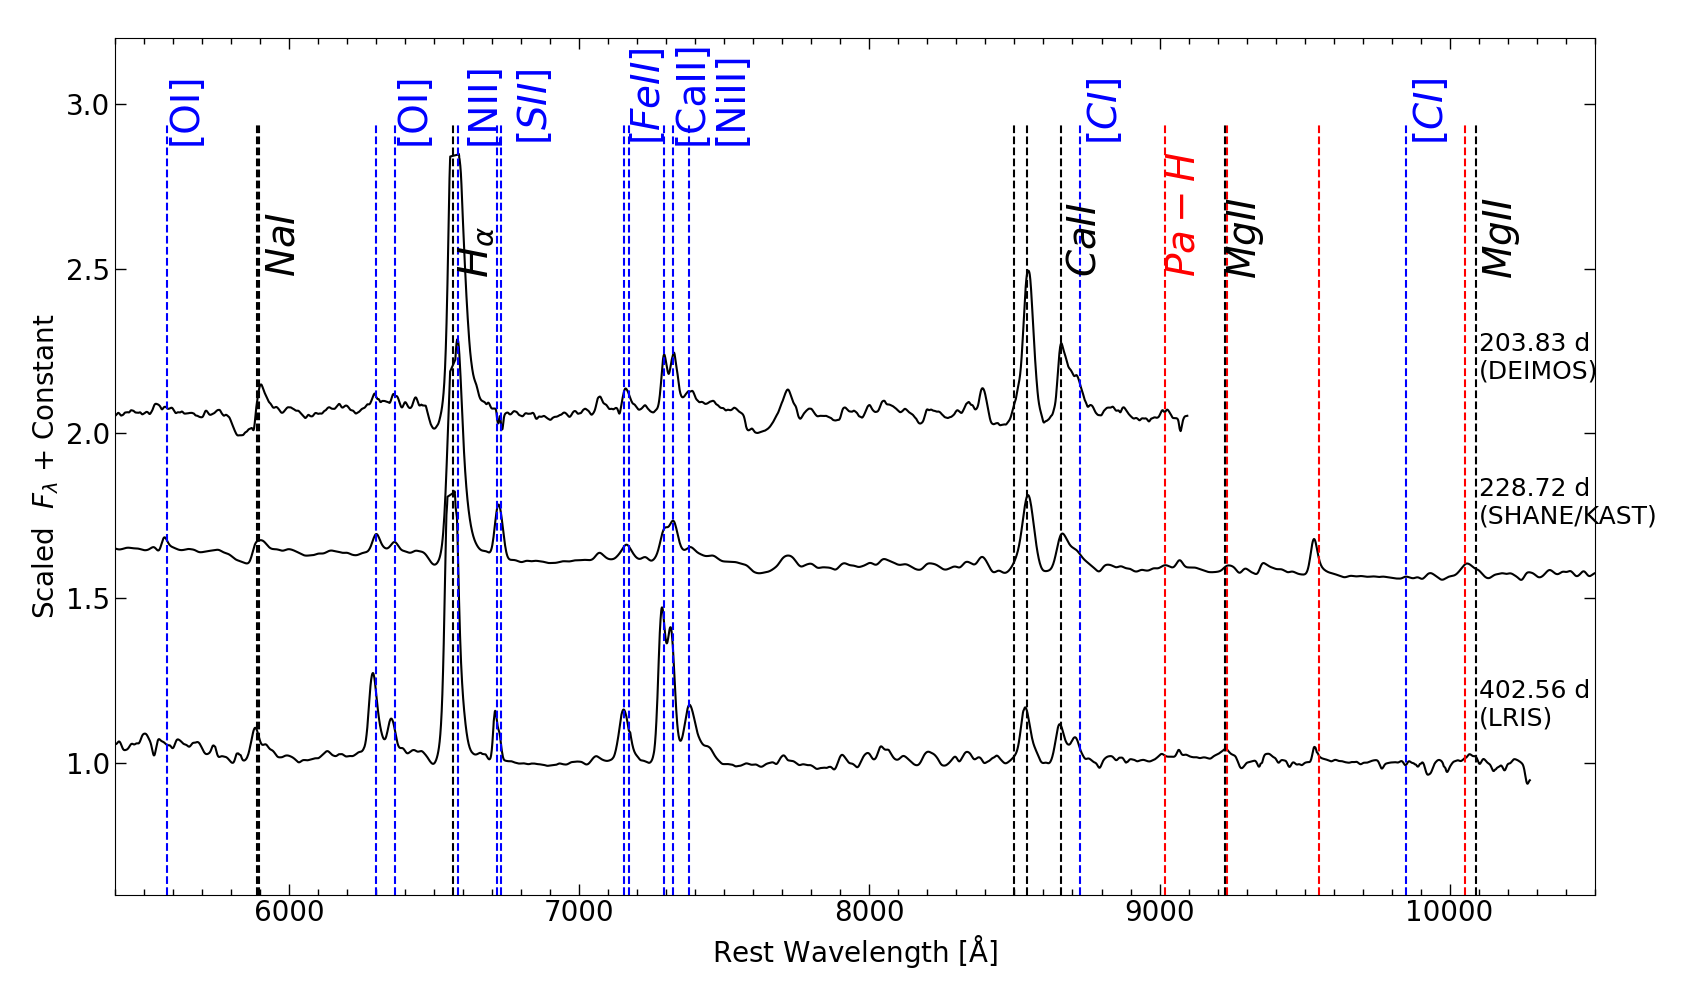
After the fall from plateau, we obtained three spectroscopic observations at 204, 229 and 402 days past explosion, which we show in Figure 13. They show a clear transition from a P-Cygni dominated spectrum to an emission line nebular spectrum where we can observe the growing strength of forbidden lines like [O I], [S II], [Fe II] and [Ca II]. The presence of nebular emission lines tells us that the ejecta has expanded to be optically thin. This marks the end of the photospheric phase of the SN. These emission lines will be used in Section 10 to constrain the progenitor mass and yields.
9.2 Metallicity of the SN
Anderson et al. (2014a) have shown that the equivalent width of the Fe II line can be used to constrain the metallicity of SNe II. In our spectra at 50 days we measured the Fe II line equivalent width, which has a value of -12 Å. This value is closest to the 0.4 measurement from the models used in Anderson et al. (2014a). This measurement is in agreement with the host oxygen abundance measurements of 0.4-0.5 times solar described in Section 4.
9.3 Comparison to other SN II
It is well established that expansion velocities are correlated with brightness for type II SNe in general (Hamuy, 2003; Kasen & Woosley, 2009). In particular, LL SNe II are expected to have low expansion velocities during the plateau, however there are counter-examples in the literature (Dastidar et al., 2019; Rodríguez et al., 2020). We now wish to establish a spectral comparison of SN 2021gmj with a range of type II SNe and see how well it fits to known correlations. Figure 14 shows the spectrum of SN 2021gmj at 16 days past explosion compared to other LL SNe II at similar phases: SN 2005cs (Pastorello et al., 2006) and SN 2010id (Gal-Yam et al., 2011a). The epoch of 16 days was chosen to compare to the other objects at a very similar phase when the H P-cygni profiles are well developed. We also include SN 2006bp (Quimby et al., 2007) as reference of a more luminous SN II with broader lines. The shallow and narrow absorption of H and H in the SN 2021gmj spectrum is most similar to SN 2010id. At this stage many lines like Na I D and the Ca II triplet have not developed yet, unlike the LL SN II 2005cs.
Figure 14 also shows the 50-day spectrum of SN 2021gmj compared to the same sample at similar phases. The line profiles are narrow, consistent with what is expected from a LL SNe II. Metal lines also appear relatively shallow, consistent with the sub-solar metalicity measurement. The lower velocity of the lines allow the triplet emission of Ca II in the red part of the spectrum to be visible. We also observe the appearance of Ba II and Sc II lines, which are common in the colder spectra of LL SNe II (Spiro et al., 2014; Pastorello et al., 2004). Although SN 2021gmj shows narrower lines compared to SN 2006bp, the absorption lines are not as deep as SN 2005cs and the Ba II line that distorts H in SN 2005cs is not visible. This suggests that SN 2021gmj has intermediate spectral characteristics between the more extremely underluminous end of LL SNe II and more common type SNe II.

9.4 Expansion velocities
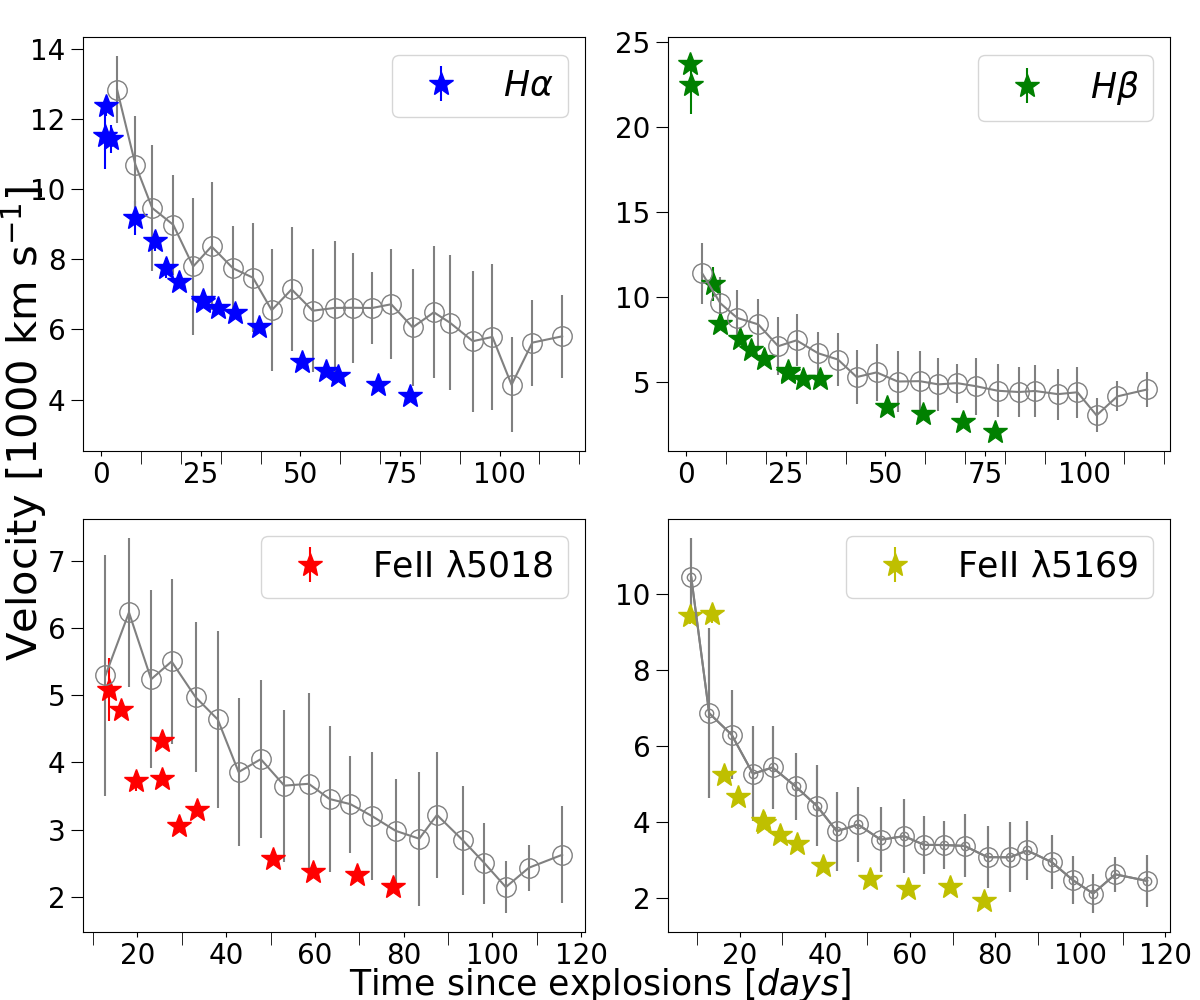
The expansion velocity evolution of SN 2021gmj is shown in Figure 15 along with the average velocity values for a sample of SNe II (Gutiérrez et al., 2017). At early times, 5-10 days past explosion, SN 2021gmj has H and H velocities of 8000-10,000 km s-1, slightly higher than normal for a LL SNe II (Pastorello et al., 2004; Spiro et al., 2014) and slightly lower than the average sample of Gutiérrez et al. (2017). The H expansion velocities of SN 2021gmj decline more rapidly than the average sample to 7000 km s-1 at 20 days past explosion, which is more consistent with what is seen in LL SNe II.
9.5 Early spectra and flash signatures
| Name | Explosion date | z | Reference |
|---|---|---|---|
| SN 2002gd | 2452553.0 (4.0) | 0.007 | Anderson et al. (2014a) |
| SN 2005cs | 2453549.5 (1.0) | 0.001 | Pastorello et al. (2006); Silverman et al. (2017) |
| SN 2006bp | 2453834.5 (∗) | 0.0035 | Quimby et al. (2007) |
| SN 2010id | 2455454.5 (2.0) | 0.017 | Gal-Yam et al. (2011b) |
| ASASSN-14jb | 2456946.6 (3) | 0.006 | Meza et al. (2019) |
| SN 2018lab | 2458481.40 (1.0) | 0.00920 | Pearson et al. (2023) |
Note. — Explosion dates and errors are taken from the listed references.(∗) No error on explosion epoch given in Quimby et al. (2007).
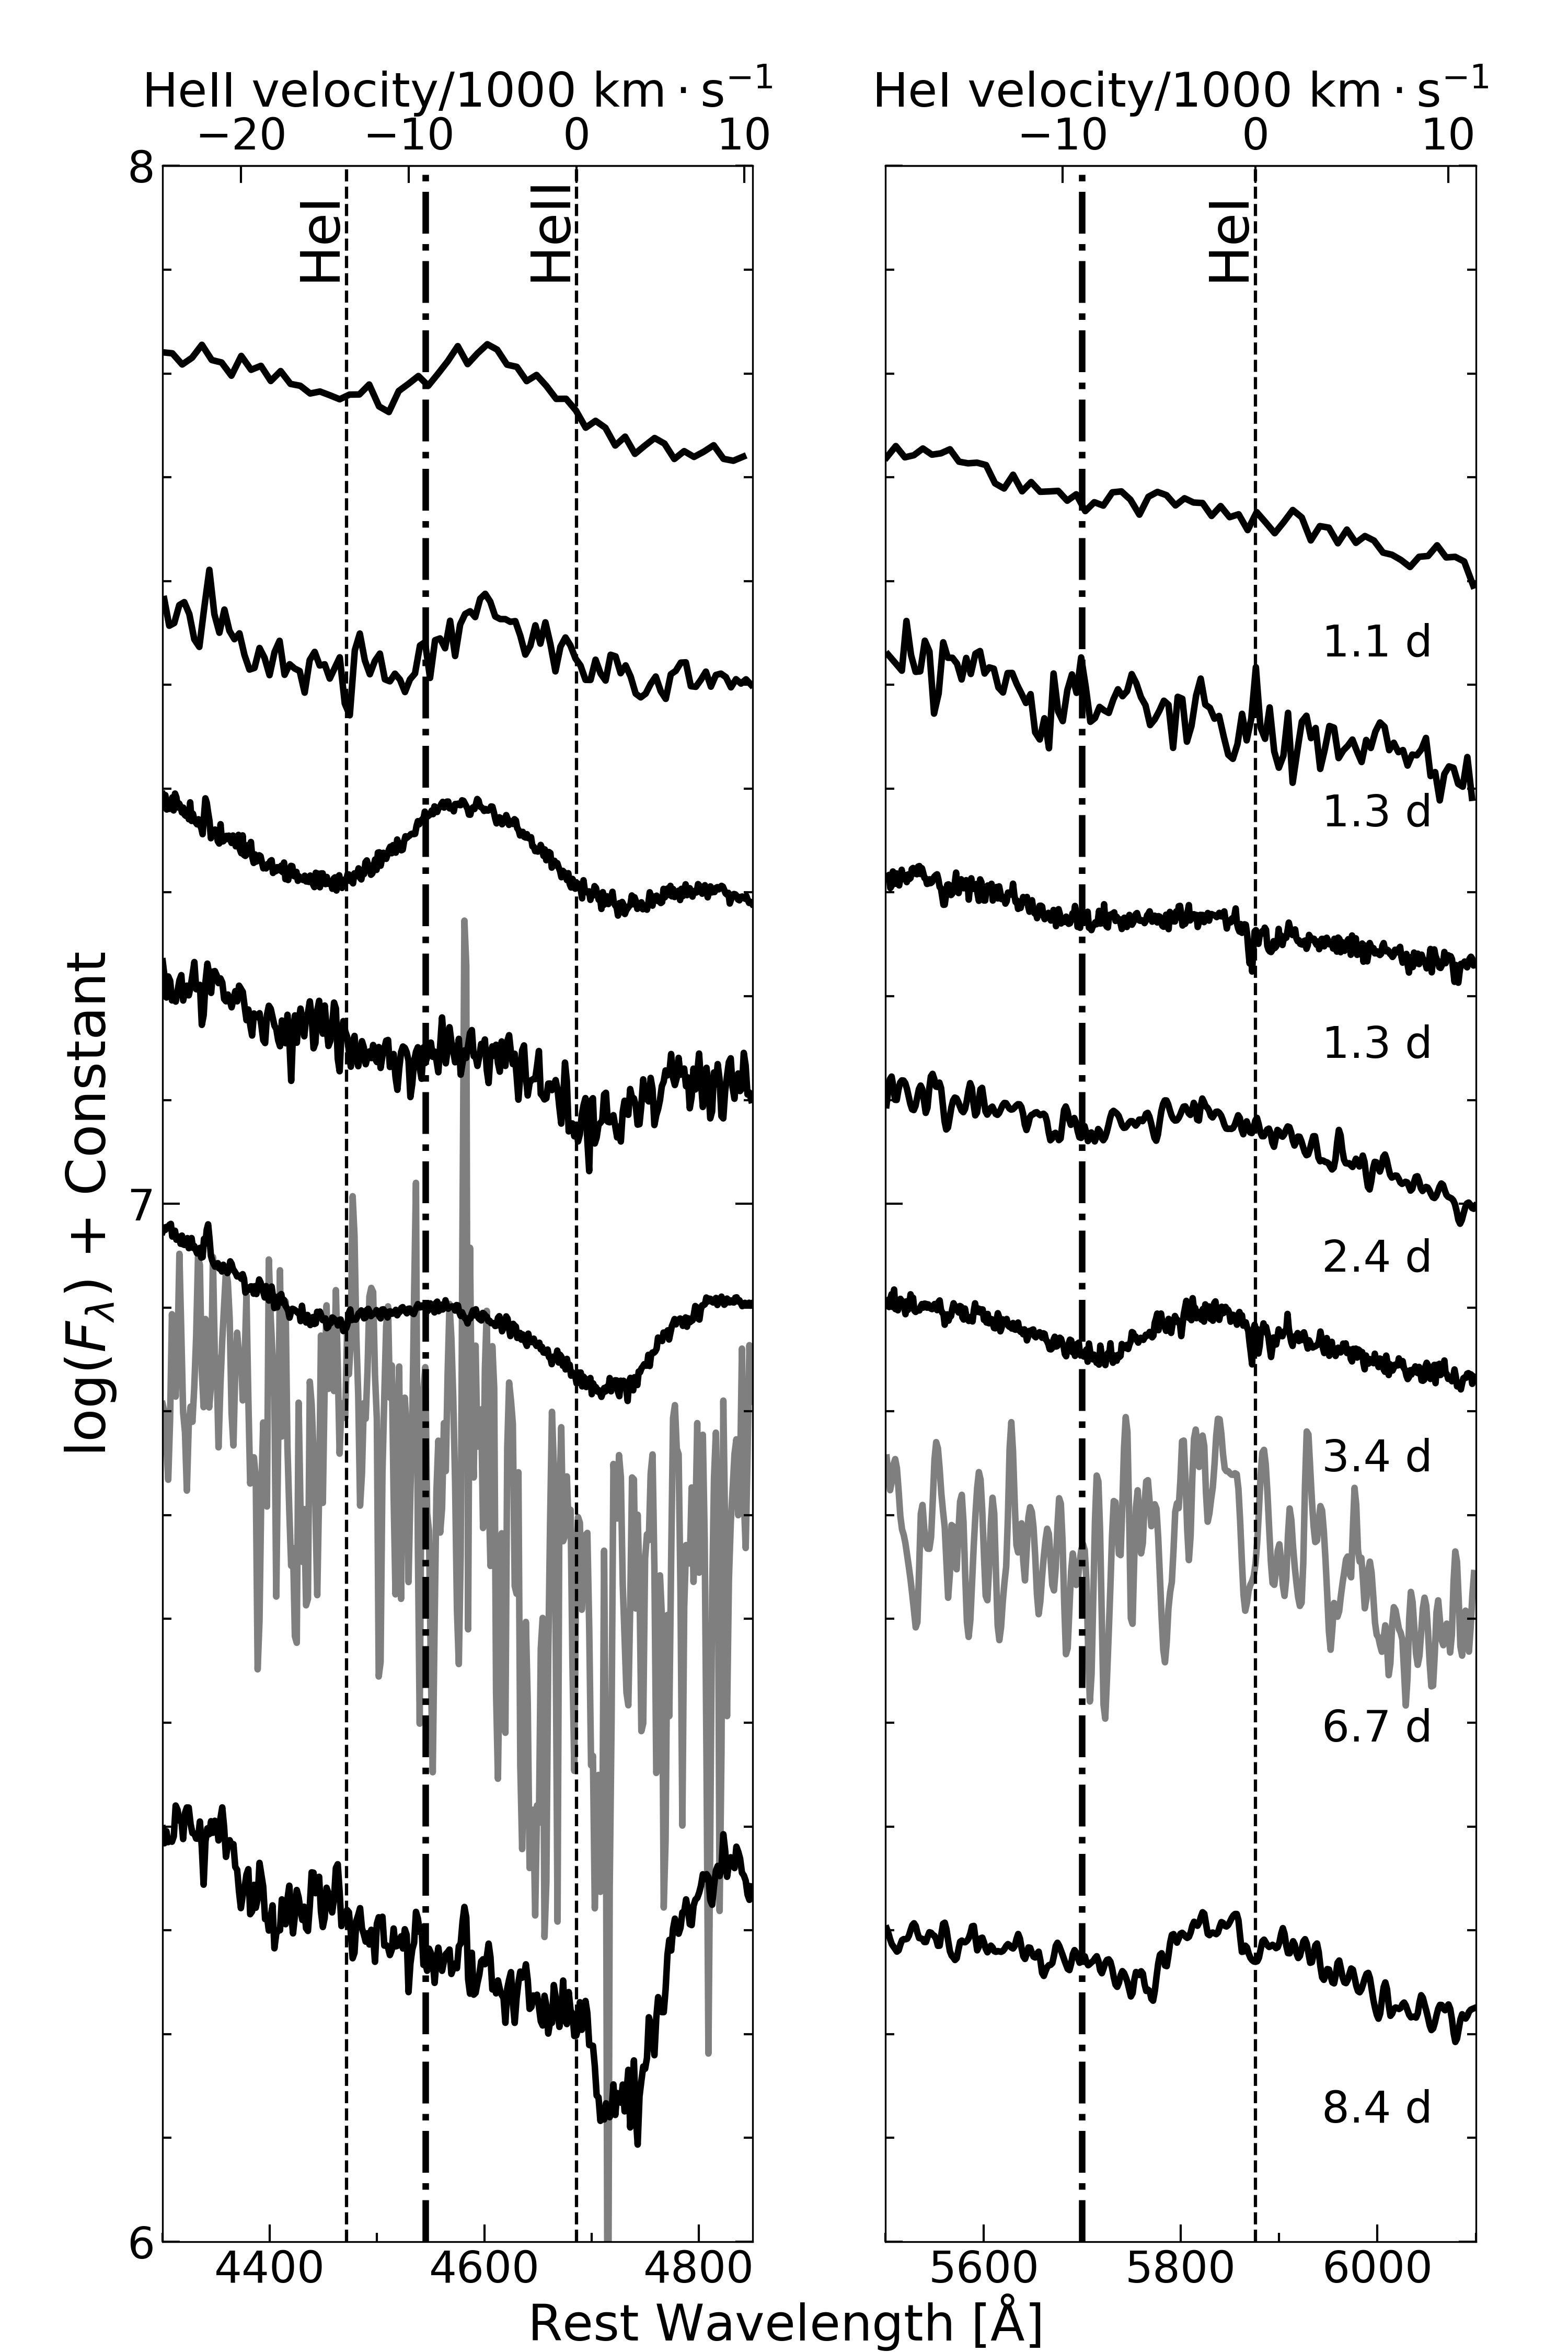
As discussed in Section 9 and shown in Figure 16, the early spectra of SN 2021gmj has a broad emission feature around 4600 Å. Similar features have been described as “ledge-shaped”, and may arise from a blend of high ionization lines (see e.g., Bruch et al., 2021). Past work has also analyzed this feature in other type SNe II. Quimby et al. (2007) suggest that the ledge could be due to either He II 4686 or a N II 4480, 4630 blend. If this emission was caused by N II, then N II 5490, 5680 should also be visible (Dessart & Hillier, 2005b); however, this line is not visible in our early spectra of SN 2021gmj. Similar to the argument with the N II line, one can look for transition lines of other elements which can be comparable in brightness at high temperatures. In the case of C and N this is challenging because there are strong nearby lines like H or He I555In the case of N V (in LTE conditions) one expects N IV emission near 4100 Å near eV. In the case of C III there’s a strong C IV line very close to 5800 Å at a temperature near eV. We do not observe any of these transitions..
As discussed in Quimby et al. (2007), as the ejecta cools and He recombines, the He II would become depopulated while He I would grow stronger. This is precisely what we see in SN 2021gmj, see Figure 16, suggesting that the early emission is due to blueshifted He II and that the ejecta is still highly ionized at these phases. If this feature is associated with He II, it has a velocity of as measured by fitting a gaussian and a linear continuum in the region. This value is not unreasonable compared to other SNe. In SNe II, P-Cygni emission maxima are expected to be blueshifted at early times by as much as 5000 (Anderson et al., 2014b; Dessart & Hillier, 2005b). However, the amount of blueshift is correlated with the slope of the V-band light curve at 30 days Anderson et al. (2014b), where they show the blueshift at 30d past explosion correlated with the light-curve slope in the V band plateau. There we see that flatter light curves have smaller blueshifts. This would imply a blueshift of for the peak of the P-Cygni profiles in the spectra of SN 2021gmj 30 days after explosion. This would extrapolate to early phases to a blueshift of . Indeed, looking at SN 2021gmj H, the emission seems to be blueshifted by no more than 3000 . Then, it seems unlikely that He II 4686 blueshift would be as high as 4000 in comparison.
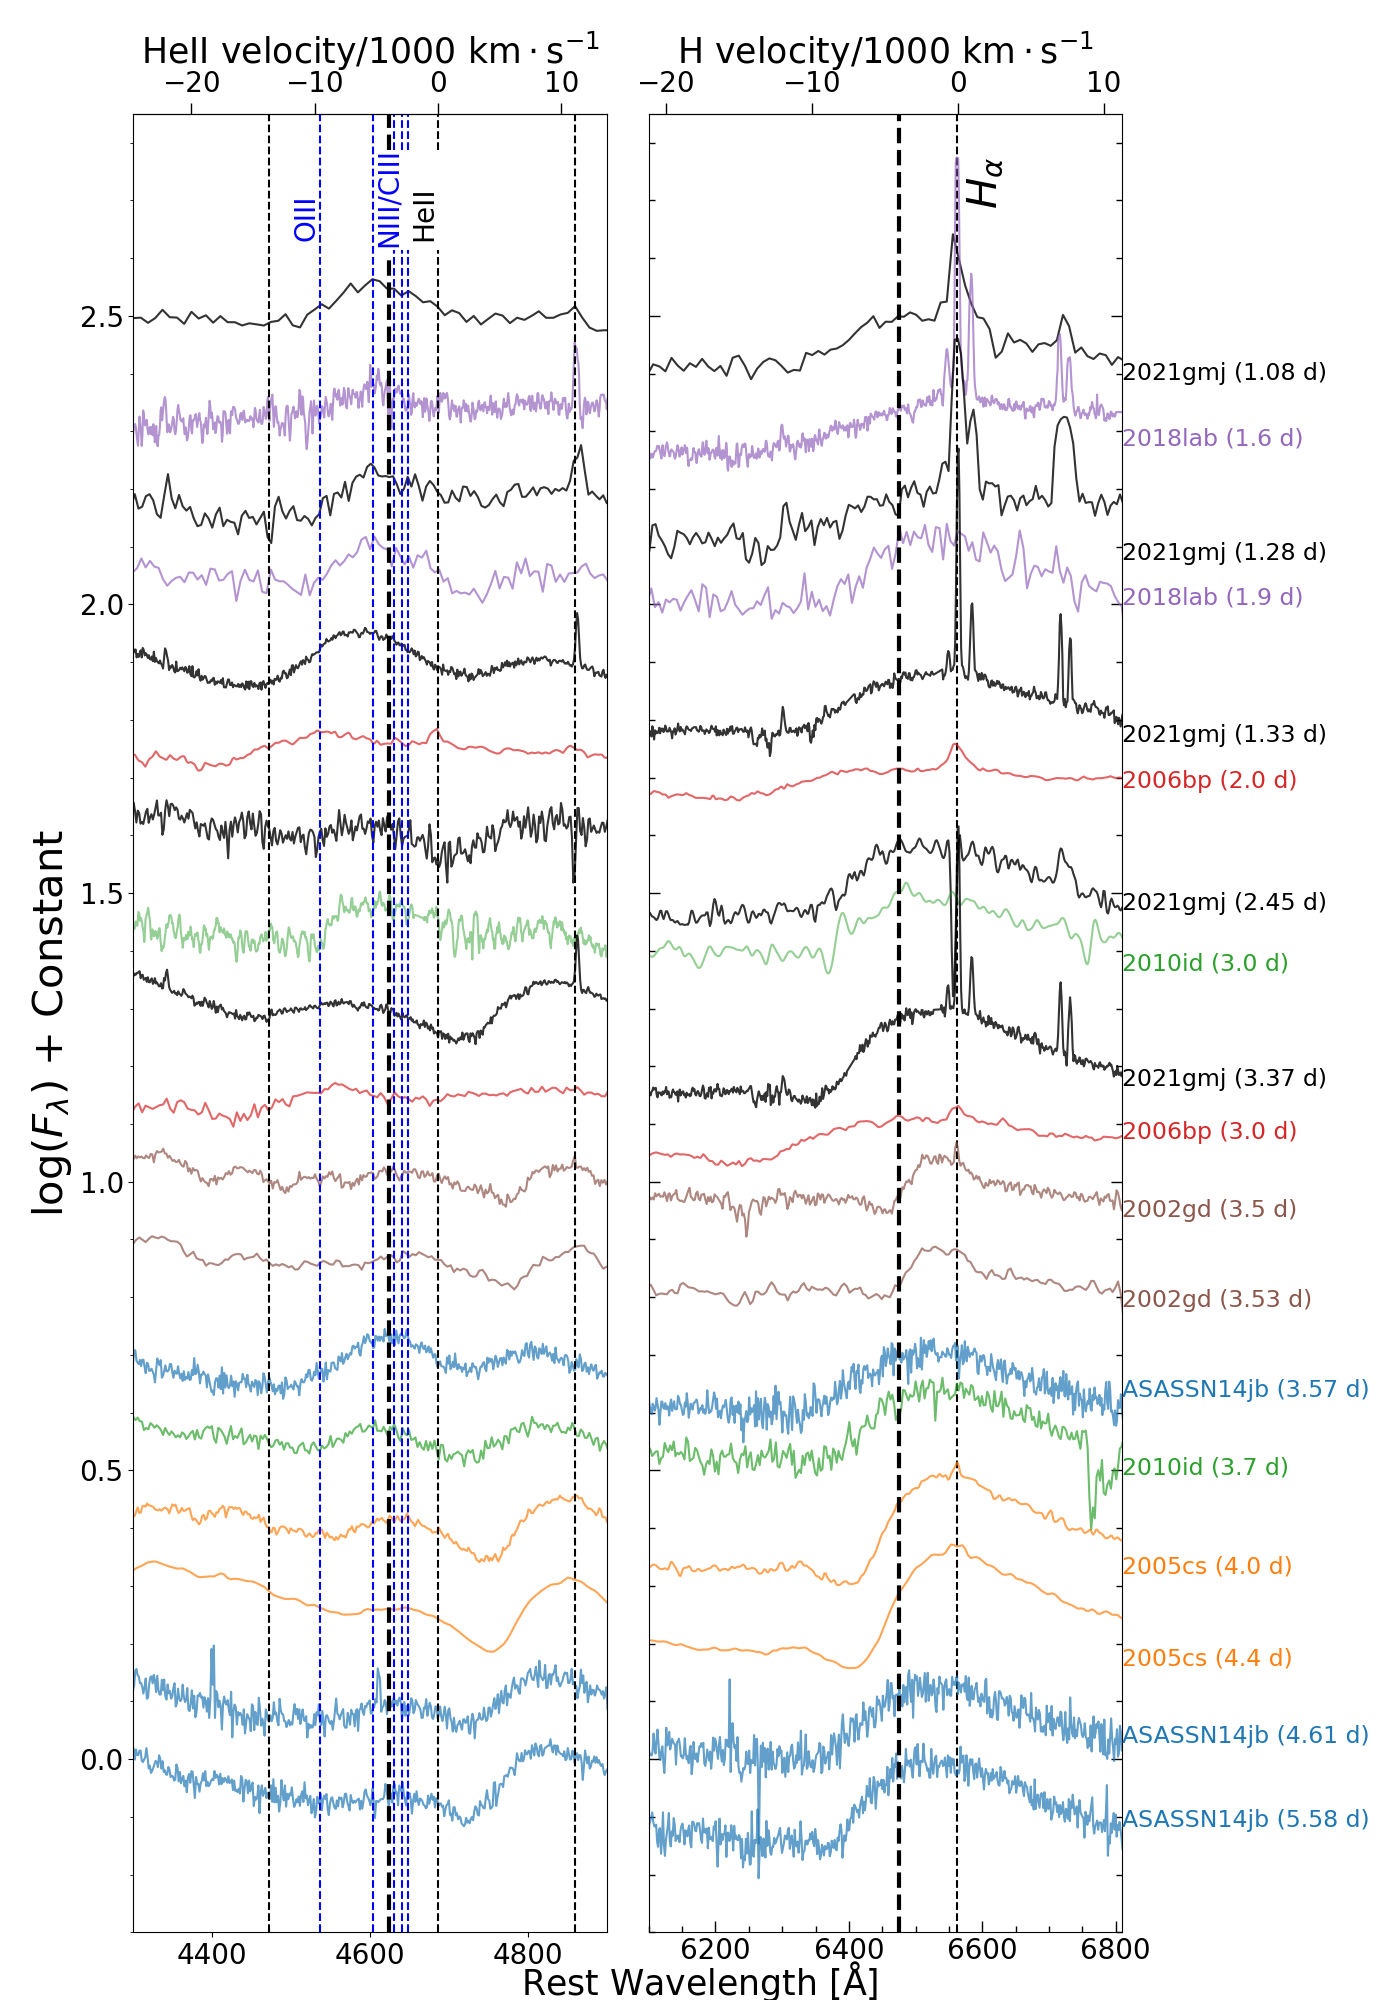
To place SN 2021gmj in context, we compare the early spectra with spectra from a sample of LL SNe II that show emission near He II (Figure 17). We also included the normal luminosity SN 2006bp, which was one of the first SN II with very early spectra showing flash features. Explosion epoch, redshift and references for this comparison sample can be found in Table 5. In the LL SNe II, the ledge feature peaks near the high ionization lines of C III, N III and possibly N V Å. SN 2006bp, however, is brighter and has broader features than the other LL SNe II, having the peak near O III lines. We observe that no supernova shows a feature with a peak near the rest frame of He II . A relevant observation is that the blueshift of the ledge feature, if we interpret it as He II , is inconsistent with the blueshift of H in all of the spectra shown. Despite their mis-matched velocities, this feature could still be interpreted as He II if there is an ionization stratification of the ejecta. If higher velocity material is at higher ionization than the rest of the slower ejecta, the ionized He II lines may be observed at higher velocity than the Balmer lines. We conclude that while the ledge feature seems common in LL SNe II (Pearson et al., 2023), we cannot definitively identify it’s origin.
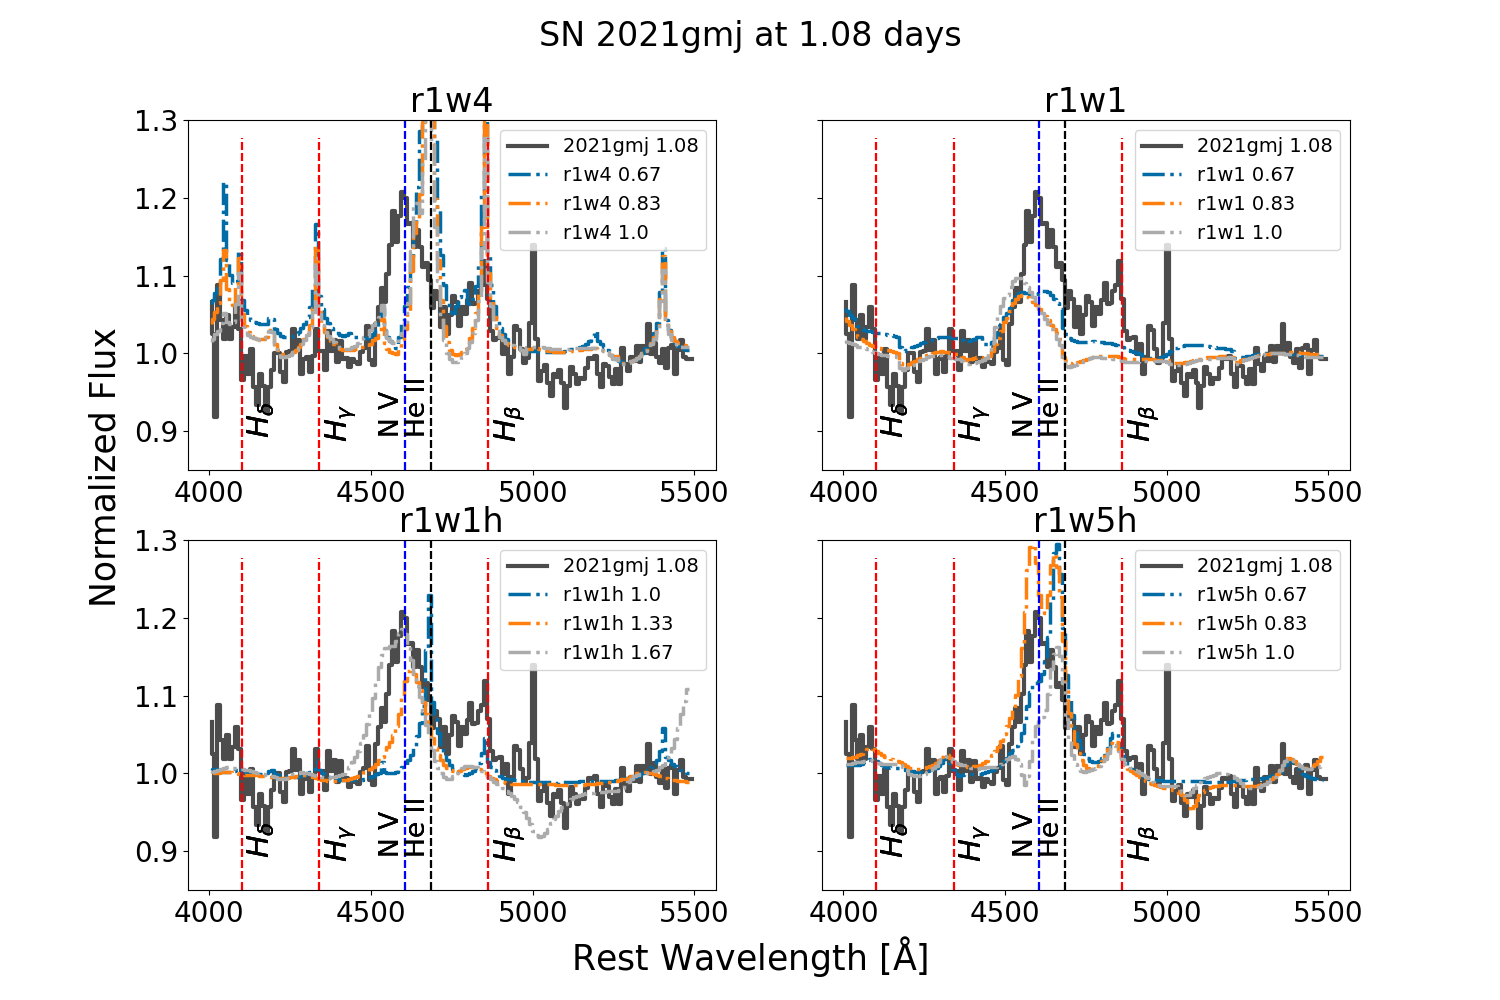
To further understand the origin of the early emission, we compare the first spectrum of SN 2021gmj to the model spectra from Dessart et al. (2017) (Figure 18). These models explode 15 RSG progenitors with different density structures, controlled by differing mass loss rates and atmospheric scale heights. The r1w1 and r2w1 models have progenitor radii of R⊙ and R⊙ respectively and a mass loss of for both. Model r1w1h has an extended atmospheric density scale height of up to a density of followed by a power law with exponent of 12 until it reaches the density profile of a wind at a radius of cm. Finally model r1w5h is similar to r1w1h but with a scale height of which then decreases to a wind of and finally to a wind of at a radius of cm. These two extended-envelope models, r1w1h and r1w5h, attempt to represent the complex extended-atmospheres observed in RSGs, which can have inflows/outflows and inhomogeneities up to a few stellar radii (Arroyo-Torres et al., 2015; Kervella et al., 2016; Humphreys & Jones, 2022; González-Torà et al., 2022; Goldberg et al., 2022). To do the comparison we first convolve the model spectra with a Gaussian with a width equal to instrumental resolution of the SN 2021gmj spectra, and binned the models to the observations resolution. We then fit a blackbody to the continuum of both the model and our observed spectra and normalize each spectrum. Like SN 2018lab (Pearson et al., 2023), SN 2021gmj is better fit by the extended atmosphere models (r1w1h and r1w5h). In the r1w1h and r1w5h models, the initially strong and narrrow He II and N V emission profiles blend together to create a broader profile centered around 4600 Å which is similar to the 4600 Å feature seen in SN 2021gmj.
Following Dessart et al. (2017), the broad diversity of the emission in early spectra can be explained by the origin of the broadening of these high ionization lines. If the line of a given element is formed in a slow wind of unshocked material the line profile is symmetric, driven by the incoherent electron scattering. Later, when the dense wind is swept up by the supernova ejecta, a dense shell forms that will have as a spectral profile line a Doppler broadened and blueshifted emission peak (Dessart et al., 2017). This scenario seems consistent with the early observations of LL SNe II. Therefore, although we cannot rule out the high velocity He II origin of this feature, the spectral evolution is consistent with a progenitor exploding into a higher density material.
10 Progenitor mass through nebular spectra analysis
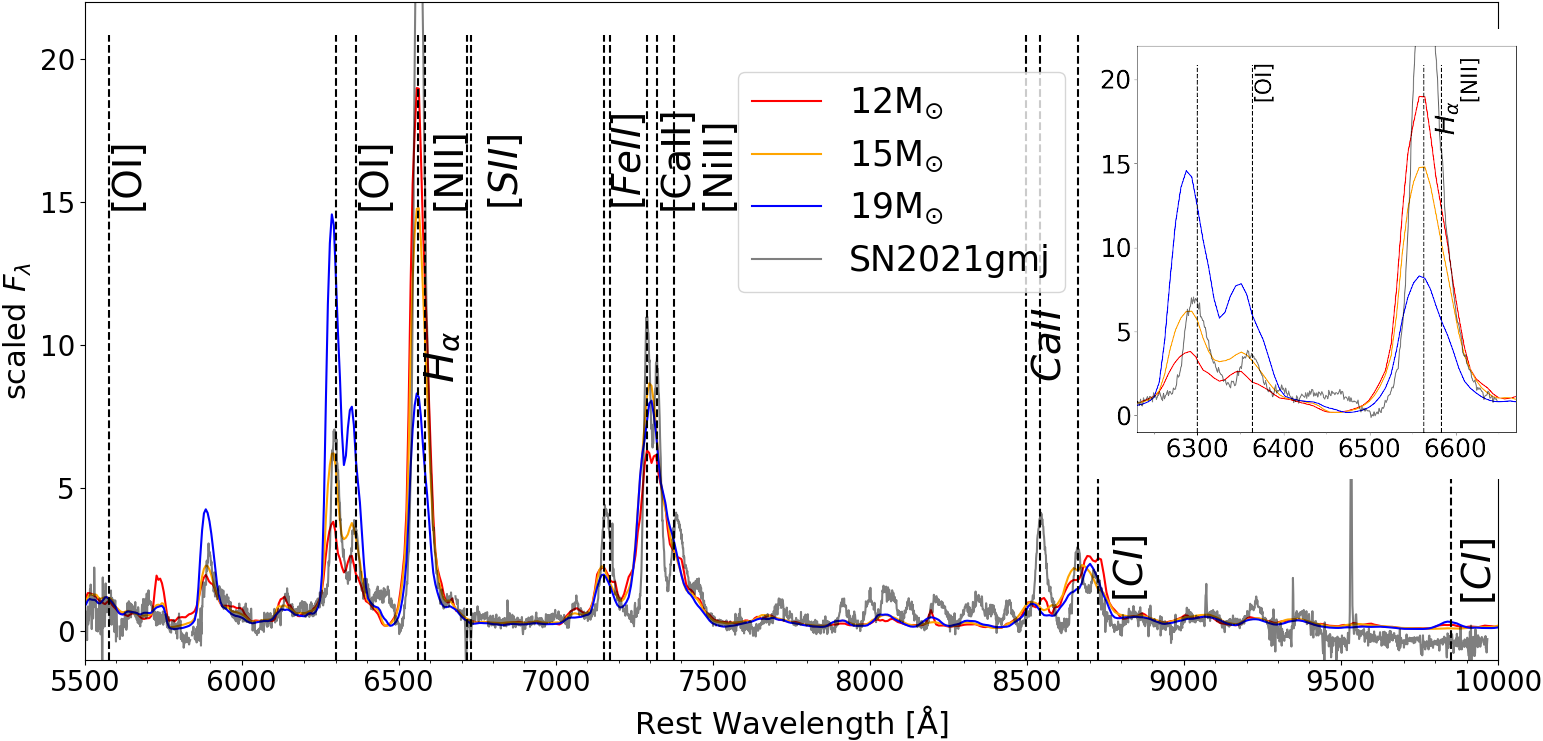
As the plateau phase ends, the photosphere recedes from the hydrogen-rich outer layers and we are able to observe emission from the core. This allows us to constrain the elemental composition of the inner layers of the ejecta and the progenitor mass. In particular, the emission from the forbidden lines of [O I] is a good probe of the oxygen mass in the ejecta and therefore to the main-sequence mass of the star (Woosley & Weaver, 1995). We use the nebular spectra models from Jerkstrand et al. (2012, J12 models from now on) to constrain the progenitor mass of SN 2021gmj. These models explode a 12, 15 and 19 progenitors with a piston, giving a total of 1.2 foe of kinetic energy, and fix the mass of the Fe/He zone to give a nickel mass of 0.062 .
In Figure 19, we compare our Keck/LRIS observation at days past explosion with the J12 models. To identify which model best characterizes the overall spectrum of SN 2021gmj, we normalize the model spectra to the total flux over the observed wavelength range of SN 2021gmj ( Å). This has the effect of aligning the continuum regions, allowing us to compare the observed and model spectra. Overall, the models have broader lines than SN 2021gmj. The width of the lines is related to the velocity of the inner layers, which correlates with the explosion energy. Additionally, the small line width allows us to distinguish the [Ni II] and [C I] emission clearly. We can therefore conclude that SN 2021gmj has a lower explosion energy than these models, which is consistent with our SNEC modeling.
Next we consider in detail the emission of specific lines and discuss the progenitor mass. As mentioned, the emission from [O I] is related to the progenitor mass. We measured the integrated flux from the [O I] doublet by fitting Gaussian profiles over a flat continuum for SN 2021gmj and the model spectra. The luminosity (or flux) is then normalized by the Cobalt decay power at 400 days to obtain the fraction of Oxygen luminosity relative to cobalt decay. This fraction is 0.22 for SN 2021gmj and is equivalent to the model of 12 within uncertainties ( assuming that the distance is the main source of statistical uncertainty).
Some authors prefer to measure the ratio of [O I] to [Ca II] as this can minimize the effects of extinction, distance, and cobalt decay, allowing a better comparison of supernovae to each other (Elmhamdi, 2011; Fang & Maeda, 2018; Kuncarayakti et al., 2015; Hiramatsu et al., 2021). We estimated the ratio for SN 2021gmj measuring the flux of [Ca II] doublet as we did with [O I]. In the case of [Ca II] we also included in our fit the neighboring lines [Fe II] and [Ni II] . We measured J12 model line ratios following the same procedure as well. The measured luminosity ratio [O I]/[Ca II] = 1/2 is equal to the value of the 12 model.
A relevant consideration when comparing SN2021gmj to these nebular models is the mismatch in nickel mass, where the model has a factor of 4.5 more nickel than SN 2021gmj itself. While the empirical scaling accounts for the difference in flux due to the differences in Ni mass, the increasing nickel mass in the models increases ionization and electron density, which can quench forbidden line emission. In particular, Ca and O forbidden lines can be relatively weaker for higher nickel mass values (Dessart & Hillier, 2020). We expect that our measurement using the ratio of these lines can alleviate at least partially this uncertainty.
In Dessart & Hillier (2020) they observe that [Ca II] can be a very efficient coolant, such that an increased Ca mass fraction on the oxygen shell will cause the [O I] emission to be quenched. This quenching would cause us to underestimate the progenitor mass. However, the mixing of O and Ca shells is expected to occur in higher progenitor masses ( ): as we find that the progenitor mass of SN 2021gmj is well below 17 , this is unlikely to affect our analysis.
Our analysis allows us to conclude that SN 2021gmj has a progenitor mass of 12 , nickel mass and explosion energy compatible with a less massive progenitor. This result is further supported by the hydrodynamic modeling of the light-curves, which gave a progenitor mass of and an explosion energy of foe.
11 Discussion
In Section 8, our light-curve modeling suggests the presence of CSM around the progenitor of SN 2021gmj. In this section we will analyse additional evidence supporting or disputing the presence of CSM interaction for SN 2021gmj.
There are two spectroscopic observations that may support the CSM scenario: The HV H in the plateau spectra and the early emission near 4600 Å. The HV H can be explained by the presence of a wind. As discussed in Chugai et al. (2007), either the unshocked wind or cold dense shell that forms in the ejecta/wind interaction will have an increased opacity in material at high velocities due to the X-ray emission originated in the reverse and forward shocks.
Coming back to the early emission, our analysis in Section 9.5 points to either the presence of high velocity He II and/or high ionization lines of C and N. Similar conclusions were obtained in other SNe II. The study of SN 2018fif (Soumagnac et al., 2020) showed very early, low-resolution, spectra with hints of emission of He II, N III-N V and C IV. Similarly, SN 2016bkv (Hosseinzadeh et al., 2018) showed distinct double-peak emission from C III/N III and He II up to 5 days after explosion. Finally we would like to mention SN 2021yja (Hosseinzadeh et al., 2022), which also showed a multi-component, ledge-like, feature. Although SN 2021yja was in the bright class of SN II, the progenitor mass constraint from pre-explosion imaging put an upper limit of 9 , which is closer to the progenitors mass of LL SNe II. As in the case of SN 2021gmj, both SN 2018lab and SN 2021yja early emission was most similar to the extended-atmosphere progenitor models from Dessart et al. (2017). This may be evidence that LL SNe II show spectral signatures of interaction in the very first days after explosion. The interaction may arise from the SN shock ramming through the low-density atmosphere of the RSG. After, the shock may encounter a wind of lower density which may extend the duration of the spectral signatures. The ejecta-atmosphere/CSM interaction may boost the peak-brightness and decelerate the ejecta, like in the case of SN 2021yja. Future studies of early interaction signatures would benefit from higher-resolution spectra, as the current resolution does not allow a definite answer on the origin of the 4600 Å line, being possible that we may be observing other element transitions besides ionized He.
Both the light-curve modeling and the extended star spectral models require a density of , just a fraction of 1.5 of the progenitor star radius away. If this mass is associated with a high-density wind originated from a sudden increase in mass loss very near in time to explosion (Quataert & Shiode, 2012; Smith & Arnett, 2014; Fuller, 2017; Kuriyama & Shigeyama, 2020) or if the material is just an extended atmosphere (e.g. Mcley & Soker, 2014; Soker, 2021) is something to study in future work.
12 Conclusions
We have presented photometric and spectral observations of the SN II SN 2021gmj. SN 2021gmj photometrically belongs to the class of LL SNe II, with a maximum band magnitude of mag. SN 2021gmj presents a decline of less than 0.01 mag per 100 days in the plateau and a plateau length of about 100 days. Both the photometric and spectral comparison show that SN 2021gmj is similar to a sample of LL SNe II, including expansion velocities and bolometric luminosity. SN 2021gmj synthesized a small amount of radioactive nickel mass which together with the low expansion velocities point to a moderate progenitor mass and explosion energy. This is confirmed through our analysis of the nebular emission lines, which point to line ratios consistent with the 12 progenitor model.
The early light-curve modeling favours the presence of CSM very close to the star, which translates to a small CSM mass in our simple steady wind assumptions. The SNEC best fit gives a CSM mass of over the progenitor of 10 exploded with a moderate energy of foe.
The low CSM mass agrees with the early spectral features, which do not show any narrow emission features with electron scattering wings. Instead, we observe the presence of a probable blend of high-ionization emission lines of C, N and high velocity He II. This indicates that the line formation region is partially or completely swept up by the fast moving ejecta so that the overall profile is similar to a broad and blueshifted P-cygni. This is further supported by the similarity of a spectroscopic emission feature around 4600 Å in SN 2021gmj to radiative hydrodynamic spectroscopic simulations of extended stars with CSM. The presence of this broad feature in several LL SNe II suggests that interaction signatures may be common in this class.
Although an abundance of photometric and spectroscopic evidence exists for the presences of compact and low density material surrounding the RSG progenitor of SN 2021gmj, further research is required to understand if LL SNe II with CSM signatures arise from extended RSG or from RSG that have an increase of mass loss in the final stages of stellar evolution.
Acknowlegdements
Time domain research by the University of Arizona team and D.J.S. is supported by NASA grant 80NSSC22K0167, NSF grants AST-1821987, 1813466, 1908972, 2108032, and 2308181, and by the Heising-Simons Foundation under grant #2020-1864. J.E.A. is supported by the international Gemini Observatory, a program of NSF’s NOIRLab, which is managed by the Association of Universities for Research in Astronomy (AURA) under a cooperative agreement with the National Science Foundation, on behalf of the Gemini partnership of Argentina, Brazil, Canada, Chile, the Republic of Korea, and the United States of America. Research by Y.D., N.M., and S.V. is supported by NSF grants AST-1813176 and AST-2008108. K.A.B. is supported by an LSSTC Catalyst Fellowship; this publication was thus made possible through the support of Grant 62192 from the John Templeton Foundation to LSSTC. The opinions expressed in this publication are those of the authors and do not necessarily reflect the views of LSSTC or the John Templeton Foundation.
L.G. acknowledges financial support from the Spanish Ministerio de Ciencia e Innovación (MCIN), the Agencia Estatal de Investigación (AEI) 10.13039/501100011033, and the European Social Fund (ESF) ”Investing in your future” under the 2019 Ramón y Cajal program RYC2019-027683-I and the PID2020-115253GA-I00 HOSTFLOWS project, from Centro Superior de Investigaciones Científicas (CSIC) under the PIE project 20215AT016, and the program Unidad de Excelencia María de Maeztu CEX2020-001058-M.
Some of the data presented herein were obtained at the W. M. Keck Observatory, which is operated as a scientific partnership among the California Institute of Technology, the University of California, and the National Aeronautics and Space Administration. The Observatory was made possible by the generous financial support of the W. M. Keck Foundation.
This work makes use of data from the Las Cumbres Observatory global telescope network. The las cumbres group is supported by NSF grants AST-1911151 and AST-1911225. This paper is based on observations made with the MuSCAT3 instrument, developed by the Astrobiology Center and under financial supports by JSPS KAKENHI (JP18H05439) and JST PRESTO (JPMJPR1775), at Faulkes Telescope North on Maui, HI, operated by the Las Cumbres Observatory.
Some observations reported here were obtained at the MMT Observatory, a joint facility of the University of Arizona and the Smithsonian Institution.
This work used the Weizmann Interactive Supernova Data Repository (WISeREP) (https://wiserep.weizmann.ac.il, Yaron & Gal-Yam, 2012).
This research has made use of the NASA/IPAC Extragalactic Database (NED), which is operated by the Jet Propulsion Laboratory, California Institute of Technology, under contract with NASA.
This work was performed in part at Aspen Center for Physics, which is supported by National Science Foundation grant PHY-2210452.
References
- Anderson et al. (2014a) Anderson, J. P., González-Gaitán, S., Hamuy, M., et al. 2014a, ApJ, 786, 67, doi: 10.1088/0004-637X/786/1/67
- Anderson et al. (2014b) Anderson, J. P., Dessart, L., Gutierrez, C. P., et al. 2014b, MNRAS, 441, 671, doi: 10.1093/mnras/stu610
- Andrews et al. (2019) Andrews, J. E., Sand, D. J., Valenti, S., et al. 2019, ApJ, 885, 43, doi: 10.3847/1538-4357/ab43e3
- Arroyo-Torres et al. (2015) Arroyo-Torres, B., Wittkowski, M., Chiavassa, A., et al. 2015, A&A, 575, A50, doi: 10.1051/0004-6361/201425212
- Astropy Collaboration et al. (2013) Astropy Collaboration, Robitaille, T. P., Tollerud, E. J., et al. 2013, A&A, 558, A33, doi: 10.1051/0004-6361/201322068
- Astropy Collaboration et al. (2018) Astropy Collaboration, Price-Whelan, A. M., Sipőcz, B. M., et al. 2018, AJ, 156, 123, doi: 10.3847/1538-3881/aabc4f
- Baade (1926) Baade, W. 1926, Astronomische Nachrichten, 228, 359, doi: 10.1002/asna.19262282003
- Becker (2015) Becker, A. 2015, HOTPANTS: High Order Transform of PSF ANd Template Subtraction. http://ascl.net/1504.004
- Bellm et al. (2019) Bellm, E. C., Kulkarni, S. R., Graham, M. J., et al. 2019, PASP, 131, 018002, doi: 10.1088/1538-3873/aaecbe
- Bostroem et al. (2023) Bostroem, K. A., Dessart, L., Hillier, D. J., et al. 2023, ApJ, 953, L18, doi: 10.3847/2041-8213/ace31c
- Bottinelli et al. (1984) Bottinelli, L., Gouguenheim, L., Paturel, G., & de Vaucouleurs, G. 1984, A&AS, 56, 381
- Bottinelli et al. (1986) Bottinelli, L., Gouguenheim, L., Paturel, G., & Teerikorpi, P. 1986, A&A, 156, 157
- Breeveld et al. (2011) Breeveld, A. A., Landsman, W., Holland, S. T., et al. 2011, in American Institute of Physics Conference Series, Vol. 1358, Gamma Ray Bursts 2010, ed. J. E. McEnery, J. L. Racusin, & N. Gehrels, 373–376
- Brown et al. (2014) Brown, P. J., Breeveld, A. A., Holland, S., Kuin, P., & Pritchard, T. 2014, Ap&SS, 354, 89, doi: 10.1007/s10509-014-2059-8
- Brown et al. (2007) Brown, P. J., Dessart, L., Holland, S. T., et al. 2007, ApJ, 659, 1488, doi: 10.1086/511968
- Brown et al. (2009) Brown, P. J., Holland, S. T., Immler, S., et al. 2009, AJ, 137, 4517, doi: 10.1088/0004-6256/137/5/4517
- Brown et al. (2011) Brown, T. M., Burleson, B., De Vera, J., et al. 2011, in American Astronomical Society Meeting Abstracts, Vol. 218, American Astronomical Society Meeting Abstracts #218, 132.02
- Brown et al. (2013) Brown, T. M., Baliber, N., Bianco, F. B., et al. 2013, PASP, 125, 1031, doi: 10.1086/673168
- Bruch et al. (2021) Bruch, R. J., Gal-Yam, A., Schulze, S., et al. 2021, ApJ, 912, 46, doi: 10.3847/1538-4357/abef05
- Cardelli et al. (1989) Cardelli, J. A., Clayton, G. C., & Mathis, J. S. 1989, ApJ, 345, 245, doi: 10.1086/167900
- Chandra et al. (1936) Chandra, M. P., et al. 1936in , 49–55
- Chugai et al. (2007) Chugai, N. N., Chevalier, R. A., & Utrobin, V. P. 2007, ApJ, 662, 1136, doi: 10.1086/518160
- Chugai & Utrobin (2000) Chugai, N. N., & Utrobin, V. P. 2000, A&A, 354, 557. https://arxiv.org/abs/astro-ph/9906190
- Ciroi et al. (2021) Ciroi, S., Pignata, G., Benetti, S., et al. 2021, Transient Name Server Classification Report, 2021-864, 1
- Clocchiatti & Wheeler (1997) Clocchiatti, A., & Wheeler, J. C. 1997, ApJ, 491, 375, doi: 10.1086/304961
- Czerny et al. (2018) Czerny, B., Beaton, R., Bejger, M., et al. 2018, Space Sci. Rev., 214, 32, doi: 10.1007/s11214-018-0466-9
- Dastidar et al. (2019) Dastidar, R., Misra, K., Valenti, S., et al. 2019, MNRAS, 490, 1605, doi: 10.1093/mnras/stz2703
- de Jaeger et al. (2018) de Jaeger, T., Anderson, J. P., Galbany, L., et al. 2018, MNRAS, 476, 4592, doi: 10.1093/mnras/sty508
- de Jaeger et al. (2019) de Jaeger, T., Zheng, W., Stahl, B. E., et al. 2019, MNRAS, 490, 2799, doi: 10.1093/mnras/stz2714
- de Mello et al. (1997) de Mello, D., Benetti, S., & Massone, G. 1997, IAU Circ., 6537, 1
- de Vaucouleurs et al. (1981) de Vaucouleurs, G., Peters, W. L., Bottinelli, L., Gouguenheim, L., & Paturel, G. 1981, ApJ, 248, 408, doi: 10.1086/159166
- Dessart & Hillier (2005a) Dessart, L., & Hillier, D. J. 2005a, A&A, 439, 671, doi: 10.1051/0004-6361:20053217
- Dessart & Hillier (2005b) —. 2005b, A&A, 439, 671, doi: 10.1051/0004-6361:20053217
- Dessart & Hillier (2020) —. 2020, A&A, 642, A33, doi: 10.1051/0004-6361/202038148
- Dessart et al. (2017) Dessart, L., Hillier, D. J., & Audit, E. 2017, A&A, 605, A83, doi: 10.1051/0004-6361/201730942
- Dessart et al. (2013) Dessart, L., Hillier, D. J., Waldman, R., & Livne, E. 2013, MNRAS, 433, 1745, doi: 10.1093/mnras/stt861
- Dessart et al. (2008) Dessart, L., Blondin, S., Brown, P. J., et al. 2008, ApJ, 675, 644, doi: 10.1086/526451
- Dong et al. (2021) Dong, Y., Valenti, S., Bostroem, K. A., et al. 2021, ApJ, 906, 56, doi: 10.3847/1538-4357/abc417
- Elmegreen et al. (2002) Elmegreen, D. M., Chromey, F. R., McGrath, E. J., & Ostenson, J. M. 2002, AJ, 123, 1381, doi: 10.1086/339029
- Elmhamdi (2011) Elmhamdi, A. 2011, Acta Astron., 61, 179. https://arxiv.org/abs/1109.2318
- Fabricant et al. (2019) Fabricant, D., Fata, R., Epps, H., et al. 2019, PASP, 131, 075004, doi: 10.1088/1538-3873/ab1d78
- Fang & Maeda (2018) Fang, Q., & Maeda, K. 2018, ApJ, 864, 47, doi: 10.3847/1538-4357/aad096
- Faran et al. (2014) Faran, T., Poznanski, D., Filippenko, A. V., et al. 2014, MNRAS, 442, 844, doi: 10.1093/mnras/stu955
- Foreman-Mackey (2016) Foreman-Mackey, D. 2016, The Journal of Open Source Software, 1, 24, doi: 10.21105/joss.00024
- Foreman-Mackey et al. (2013) Foreman-Mackey, D., Hogg, D. W., Lang, D., & Goodman, J. 2013, PASP, 125, 306, doi: 10.1086/670067
- Fuller (2017) Fuller, J. 2017, MNRAS, 470, 1642, doi: 10.1093/mnras/stx1314
- Gal-Yam et al. (2011a) Gal-Yam, A., Kasliwal, M. M., Arcavi, I., et al. 2011a, ApJ, 736, 159, doi: 10.1088/0004-637X/736/2/159
- Gal-Yam et al. (2011b) —. 2011b, ApJ, 736, 159, doi: 10.1088/0004-637X/736/2/159
- Gal-Yam et al. (2014) Gal-Yam, A., Arcavi, I., Ofek, E. O., et al. 2014, Nature, 509, 471, doi: 10.1038/nature13304
- Galbany et al. (2016) Galbany, L., Anderson, J. P., Rosales-Ortega, F. F., et al. 2016, MNRAS, 455, 4087, doi: 10.1093/mnras/stv2620
- Galbany et al. (2018) Galbany, L., Anderson, J. P., Sánchez, S. F., et al. 2018, ApJ, 855, 107, doi: 10.3847/1538-4357/aaaf20
- Gall et al. (2015) Gall, E. E. E., Polshaw, J., Kotak, R., et al. 2015, A&A, 582, A3, doi: 10.1051/0004-6361/201525868
- Garnavich & Ann (1994) Garnavich, P. M., & Ann, H. B. 1994, AJ, 108, 1002, doi: 10.1086/117130
- Gehrels et al. (2004) Gehrels, N., Chincarini, G., Giommi, P., et al. 2004, ApJ, 611, 1005, doi: 10.1086/422091
- Gilkis & Arcavi (2022) Gilkis, A., & Arcavi, I. 2022, MNRAS, 511, 691, doi: 10.1093/mnras/stac088
- Giraud (1985) Giraud, E. 1985, A&A, 153, 125
- Goldberg et al. (2022) Goldberg, J. A., Jiang, Y.-F., & Bildsten, L. 2022, ApJ, 933, 164, doi: 10.3847/1538-4357/ac75e3
- González-Torà et al. (2022) González-Torà, G., Wittkowski, M., Davies, B., Plez, B., & Kravchenko, K. 2022, arXiv e-prints, arXiv:2210.14940. https://arxiv.org/abs/2210.14940
- Graham et al. (2019) Graham, M. J., Kulkarni, S. R., Bellm, E. C., et al. 2019, PASP, 131, 078001, doi: 10.1088/1538-3873/ab006c
- Gutiérrez et al. (2014) Gutiérrez, C. P., Anderson, J. P., Hamuy, M., et al. 2014, ApJ, 786, L15, doi: 10.1088/2041-8205/786/2/L15
- Gutiérrez et al. (2017) —. 2017, ApJ, 850, 89, doi: 10.3847/1538-4357/aa8f52
- Hägele et al. (2010) Hägele, G. F., Díaz, Á. I., Cardaci, M. V., Terlevich, E., & Terlevich, R. 2010, MNRAS, 402, 1005, doi: 10.1111/j.1365-2966.2009.15934.x
- Hamuy (2003) Hamuy, M. 2003, ApJ, 582, 905, doi: 10.1086/344689
- Hamuy et al. (2001) Hamuy, M., Pinto, P. A., Maza, J., et al. 2001, ApJ, 558, 615, doi: 10.1086/322450
- Hamuy (2001) Hamuy, M. A. 2001, PhD thesis, University of Arizona
- Harris et al. (2020) Harris, C. R., Millman, K. J., van der Walt, S. J., et al. 2020, Nature, 585, 357, doi: 10.1038/s41586-020-2649-2
- Hillier & Dessart (2019) Hillier, D. J., & Dessart, L. 2019, A&A, 631, A8, doi: 10.1051/0004-6361/201935100
- Hiramatsu et al. (2021) Hiramatsu, D., Howell, D. A., Van Dyk, S. D., et al. 2021, Nature Astronomy, 5, 903, doi: 10.1038/s41550-021-01384-2
- Hosseinzadeh & Gomez (2020) Hosseinzadeh, G., & Gomez, S. 2020, Light Curve Fitting, v0.2.0, Zenodo, Zenodo, doi: 10.5281/zenodo.4312178
- Hosseinzadeh et al. (2018) Hosseinzadeh, G., Valenti, S., McCully, C., et al. 2018, ApJ, 861, 63, doi: 10.3847/1538-4357/aac5f6
- Hosseinzadeh et al. (2022) Hosseinzadeh, G., Kilpatrick, C. D., Dong, Y., et al. 2022, ApJ, 935, 31, doi: 10.3847/1538-4357/ac75f0
- Hosseinzadeh et al. (2023) Hosseinzadeh, G., Farah, J., Shrestha, M., et al. 2023, ApJ, 953, L16, doi: 10.3847/2041-8213/ace4c4
- Humphreys & Jones (2022) Humphreys, R. M., & Jones, T. J. 2022, AJ, 163, 103, doi: 10.3847/1538-3881/ac46ff
- Hunter (2007) Hunter, J. D. 2007, Computing in Science and Engineering, 9, 90, doi: 10.1109/MCSE.2007.55
- Jerkstrand (2011) Jerkstrand, A. 2011, PhD thesis, Stockholm University
- Jerkstrand et al. (2012) Jerkstrand, A., Fransson, C., Maguire, K., et al. 2012, A&A, 546, A28, doi: 10.1051/0004-6361/201219528
- Jones et al. (2009) Jones, M. I., Hamuy, M., Lira, P., et al. 2009, ApJ, 696, 1176, doi: 10.1088/0004-637X/696/2/1176
- Kansky et al. (2019) Kansky, J., Chilingarian, I., Fabricant, D., et al. 2019, PASP, 131, 075005, doi: 10.1088/1538-3873/ab1ceb
- Kasen & Woosley (2009) Kasen, D., & Woosley, S. E. 2009, ApJ, 703, 2205, doi: 10.1088/0004-637X/703/2/2205
- Kervella et al. (2016) Kervella, P., Lagadec, E., Montargès, M., et al. 2016, A&A, 585, A28, doi: 10.1051/0004-6361/201527134
- Khazov et al. (2016) Khazov, D., Yaron, O., Gal-Yam, A., et al. 2016, ApJ, 818, 3, doi: 10.3847/0004-637X/818/1/3
- Kirshner & Kwan (1974) Kirshner, R. P., & Kwan, J. 1974, ApJ, 193, 27, doi: 10.1086/153123
- Kuncarayakti et al. (2015) Kuncarayakti, H., Maeda, K., Bersten, M. C., et al. 2015, A&A, 579, A95, doi: 10.1051/0004-6361/201425604
- Kuriyama & Shigeyama (2020) Kuriyama, N., & Shigeyama, T. 2020, A&A, 635, A127, doi: 10.1051/0004-6361/201937226
- Leonard et al. (2000) Leonard, D. C., Filippenko, A. V., Barth, A. J., & Matheson, T. 2000, ApJ, 536, 239, doi: 10.1086/308910
- Leonard et al. (2003) Leonard, D. C., Kanbur, S. M., Ngeow, C. C., & Tanvir, N. R. 2003, ApJ, 594, 247, doi: 10.1086/376831
- Levesque et al. (2005) Levesque, E. M., Massey, P., Olsen, K. A. G., et al. 2005, ApJ, 628, 973, doi: 10.1086/430901
- Martinez & Bersten (2019) Martinez, L., & Bersten, M. C. 2019, A&A, 629, A124, doi: 10.1051/0004-6361/201834818
- Matheson et al. (2000) Matheson, T., Filippenko, A. V., Barth, A. J., et al. 2000, AJ, 120, 1487, doi: 10.1086/301518
- Mcley & Soker (2014) Mcley, L., & Soker, N. 2014, MNRAS, 445, 2492, doi: 10.1093/mnras/stu1952
- Meza et al. (2019) Meza, N., Prieto, J. L., Clocchiatti, A., et al. 2019, A&A, 629, A57, doi: 10.1051/0004-6361/201834972
- Miralles-Caballero et al. (2014) Miralles-Caballero, D., Díaz, A. I., Rosales-Ortega, F. F., Pérez-Montero, E., & Sánchez, S. F. 2014, MNRAS, 440, 2265, doi: 10.1093/mnras/stu435
- Moriya et al. (2016) Moriya, T. J., Pruzhinskaya, M. V., Ergon, M., & Blinnikov, S. I. 2016, MNRAS, 455, 423, doi: 10.1093/mnras/stv2336
- Morozova et al. (2015) Morozova, V., Piro, A. L., Renzo, M., et al. 2015, ApJ, 814, 63, doi: 10.1088/0004-637X/814/1/63
- Morozova et al. (2017) Morozova, V., Piro, A. L., & Valenti, S. 2017, ApJ, 838, 28, doi: 10.3847/1538-4357/aa6251
- Morozova et al. (2018) —. 2018, ApJ, 858, 15, doi: 10.3847/1538-4357/aab9a6
- Müller-Bravo et al. (2020) Müller-Bravo, T. E., Gutiérrez, C. P., Sullivan, M., et al. 2020, MNRAS, 497, 361, doi: 10.1093/mnras/staa1932
- Narita et al. (2020) Narita, N., Fukui, A., Yamamuro, T., et al. 2020, in Society of Photo-Optical Instrumentation Engineers (SPIE) Conference Series, Vol. 11447, Society of Photo-Optical Instrumentation Engineers (SPIE) Conference Series, 114475K
- Niemela et al. (1985) Niemela, V. S., Ruiz, M. T., & Phillips, M. M. 1985, ApJ, 289, 52, doi: 10.1086/162863
- Pastorello et al. (2004) Pastorello, A., Zampieri, L., Turatto, M., et al. 2004, MNRAS, 347, 74, doi: 10.1111/j.1365-2966.2004.07173.x
- Pastorello et al. (2006) Pastorello, A., Sauer, D., Taubenberger, S., et al. 2006, MNRAS, 370, 1752, doi: 10.1111/j.1365-2966.2006.10587.x
- Pastorello et al. (2009) Pastorello, A., Valenti, S., Zampieri, L., et al. 2009, MNRAS, 394, 2266, doi: 10.1111/j.1365-2966.2009.14505.x
- Pastoriza et al. (1993) Pastoriza, M. G., Dottori, H. A., Terlevich, E., Terlevich, R., & Diaz, A. I. 1993, MNRAS, 260, 177, doi: 10.1093/mnras/260.1.177
- Pearson et al. (2023) Pearson, J., Hosseinzadeh, G., Sand, D. J., et al. 2023, ApJ, 945, 107, doi: 10.3847/1538-4357/acb8a9
- Perley (2021) Perley, D. 2021, Transient Name Server Classification Report, 2021-849, 1
- Pessi et al. (2019) Pessi, P. J., Folatelli, G., Anderson, J. P., et al. 2019, MNRAS, 488, 4239, doi: 10.1093/mnras/stz1855
- Phillips et al. (2013) Phillips, M. M., Simon, J. D., Morrell, N., et al. 2013, ApJ, 779, 38, doi: 10.1088/0004-637X/779/1/38
- Polshaw et al. (2016) Polshaw, J., Kotak, R., Dessart, L., et al. 2016, A&A, 588, A1, doi: 10.1051/0004-6361/201527682
- Popov (1993) Popov, D. V. 1993, ApJ, 414, 712, doi: 10.1086/173117
- Poznanski et al. (2012) Poznanski, D., Prochaska, J. X., & Bloom, J. S. 2012, MNRAS, 426, 1465, doi: 10.1111/j.1365-2966.2012.21796.x
- Prochaska et al. (2020) Prochaska, J., Hennawi, J., Westfall, K., et al. 2020, The Journal of Open Source Software, 5, 2308, doi: 10.21105/joss.02308
- Quataert & Shiode (2012) Quataert, E., & Shiode, J. 2012, MNRAS, 423, L92, doi: 10.1111/j.1745-3933.2012.01264.x
- Quimby et al. (2007) Quimby, R. M., Wheeler, J. C., Höflich, P., et al. 2007, ApJ, 666, 1093, doi: 10.1086/520532
- Rodríguez et al. (2020) Rodríguez, Ó., Pignata, G., Anderson, J. P., et al. 2020, MNRAS, 494, 5882, doi: 10.1093/mnras/staa1133
- Rosales-Ortega et al. (2010) Rosales-Ortega, F. F., Kennicutt, R. C., Sánchez, S. F., et al. 2010, MNRAS, 405, 735, doi: 10.1111/j.1365-2966.2010.16498.x
- Rubin et al. (2016) Rubin, A., Gal-Yam, A., De Cia, A., et al. 2016, ApJ, 820, 33, doi: 10.3847/0004-637X/820/1/33
- Sanders et al. (2015) Sanders, N. E., Soderberg, A. M., Gezari, S., et al. 2015, ApJ, 799, 208, doi: 10.1088/0004-637X/799/2/208
- Sapir & Waxman (2017) Sapir, N., & Waxman, E. 2017, ApJ, 838, 130, doi: 10.3847/1538-4357/aa64df
- Schlafly & Finkbeiner (2011) Schlafly, E. F., & Finkbeiner, D. P. 2011, ApJ, 737, 103, doi: 10.1088/0004-637X/737/2/103
- Science Software Branch at STScI (2012) Science Software Branch at STScI. 2012, PyRAF: Python alternative for IRAF, Astrophysics Source Code Library, record ascl:1207.011. http://ascl.net/1207.011
- Shivvers et al. (2015) Shivvers, I., Groh, J. H., Mauerhan, J. C., et al. 2015, ApJ, 806, 213, doi: 10.1088/0004-637X/806/2/213
- Shrestha et al. (2023) Shrestha, M., Pearson, J., Wyatt, S., et al. 2023, arXiv e-prints, arXiv:2310.00162, doi: 10.48550/arXiv.2310.00162
- Silverman et al. (2017) Silverman, J. M., Pickett, S., Wheeler, J. C., et al. 2017, MNRAS, 467, 369, doi: 10.1093/mnras/stx058
- Smartt (2009) Smartt, S. J. 2009, ARA&A, 47, 63, doi: 10.1146/annurev-astro-082708-101737
- Smartt (2015) —. 2015, PASA, 32, e016, doi: 10.1017/pasa.2015.17
- Smith & Arnett (2014) Smith, N., & Arnett, W. D. 2014, ApJ, 785, 82, doi: 10.1088/0004-637X/785/2/82
- Soker (2021) Soker, N. 2021, ApJ, 906, 1, doi: 10.3847/1538-4357/abca8f
- Soumagnac et al. (2020) Soumagnac, M. T., Ganot, N., Irani, I., et al. 2020, ApJ, 902, 6, doi: 10.3847/1538-4357/abb247
- Spiro et al. (2014) Spiro, S., Pastorello, A., Pumo, M. L., et al. 2014, MNRAS, 439, 2873, doi: 10.1093/mnras/stu156
- Sravan et al. (2019) Sravan, N., Marchant, P., & Kalogera, V. 2019, ApJ, 885, 130, doi: 10.3847/1538-4357/ab4ad7
- Subrayan et al. (2023) Subrayan, B. M., Milisavljevic, D., Moriya, T. J., et al. 2023, ApJ, 945, 46, doi: 10.3847/1538-4357/aca80a
- Sukhbold et al. (2016) Sukhbold, T., Ertl, T., Woosley, S. E., Brown, J. M., & Janka, H. T. 2016, ApJ, 821, 38, doi: 10.3847/0004-637X/821/1/38
- Takáts et al. (2015) Takáts, K., Pignata, G., Pumo, M. L., et al. 2015, MNRAS, 450, 3137, doi: 10.1093/mnras/stv857
- Tartaglia et al. (2018) Tartaglia, L., Sand, D. J., Valenti, S., et al. 2018, ApJ, 853, 62, doi: 10.3847/1538-4357/aaa014
- Tartaglia et al. (2021) Tartaglia, L., Sand, D. J., Groh, J. H., et al. 2021, ApJ, 907, 52, doi: 10.3847/1538-4357/abca8a
- Tsvetkov et al. (2006) Tsvetkov, D. Y., Volnova, A. A., Shulga, A. P., et al. 2006, A&A, 460, 769, doi: 10.1051/0004-6361:20065704
- Tully & Fisher (1988) Tully, R. B., & Fisher, J. R. 1988, Catalog of Nearby Galaxies
- Turatto et al. (1998) Turatto, M., Mazzali, P. A., Young, T. R., et al. 1998, ApJ, 498, L129, doi: 10.1086/311324
- Valenti et al. (2014a) Valenti, S., Sand, D., Pastorello, A., et al. 2014a, MNRAS, 438, L101, doi: 10.1093/mnrasl/slt171
- Valenti et al. (2014b) —. 2014b, MNRAS, 438, L101, doi: 10.1093/mnrasl/slt171
- Valenti et al. (2016) Valenti, S., Howell, D. A., Stritzinger, M. D., et al. 2016, MNRAS, 459, 3939, doi: 10.1093/mnras/stw870
- Valenti et al. (2021) Valenti, S., Sand, D. J., Wyatt, S., et al. 2021, Transient Name Server Discovery Report, 2021-633, 1
- Van Dyk et al. (2012) Van Dyk, S. D., Davidge, T. J., Elias-Rosa, N., et al. 2012, AJ, 143, 19, doi: 10.1088/0004-6256/143/1/19
- Virtanen et al. (2020) Virtanen, P., Gommers, R., Oliphant, T. E., et al. 2020, Nature Methods, 17, 261, doi: 10.1038/s41592-019-0686-2
- Weaver et al. (2017) Weaver, T. A., Zimmerman, G. B., & Woosley, S. E. 2017, KEPLER: General purpose 1D multizone hydrodynamics code, Astrophysics Source Code Library, record ascl:1702.007. http://ascl.net/1702.007
- Wehner et al. (2006) Wehner, E. H., Gallagher, J. S., Papaderos, P., Fritze-von Alvensleben, U., & Westfall, K. B. 2006, MNRAS, 371, 1047, doi: 10.1111/j.1365-2966.2006.10757.x
- Woosley et al. (1994) Woosley, S. E., Eastman, R. G., Weaver, T. A., & Pinto, P. A. 1994, ApJ, 429, 300, doi: 10.1086/174319
- Woosley & Weaver (1995) Woosley, S. E., & Weaver, T. A. 1995, ApJS, 101, 181, doi: 10.1086/192237
- Yaron & Gal-Yam (2012) Yaron, O., & Gal-Yam, A. 2012, PASP, 124, 668, doi: 10.1086/666656
- Yaron et al. (2017) Yaron, O., Perley, D. A., Gal-Yam, A., et al. 2017, Nature Physics, 13, 510, doi: 10.1038/nphys4025
- Zampieri et al. (1998) Zampieri, L., Colpi, M., Shapiro, S. L., & Wasserman, I. 1998, ApJ, 505, 876, doi: 10.1086/306192
- Zimmerman et al. (2021) Zimmerman, E., Schulze, S., Johansson, J., et al. 2021, Transient Name Server AstroNote, 91, 1