Classification of circular polarization Stokes profiles in a sunspot using k-means clustering
Abstract
The magnetic and velocity fields in sunspots are highly structured on small spatial scales which are encoded in the Stokes profiles. The Stokes profiles are in turn, derived from a sequence of polarization modulations on the incoming light that are imaged using an analyser-detector combination. Our aim is to identify Stokes profiles in a sunspot which exhibit spectral characteristics that deviate from those associated with the Evershed flow and their corresponding spatial distribution. To that end, we employ the k-means clustering routine to classify Stokes spectra in the penumbra of a regular, unipolar sunspot, that also comprises a granular and a filamentary light bridge. We find that 75% of the penumbral region, corresponding to about 93500 pixels, is dominated by profiles comprising two, nearly anti-symmetric lobes, while 21% of the area is occupied by three-lobed profiles that are associated with the Evershed flow returning to the solar photosphere. The remaining 4% of the penumbral area is dominated by four groups/families of profiles - Group 1: three-lobed profiles in which both the rest and strong downflowing (sometimes supersonic) component have the same polarity as the host sunspot and seen exclusively in the filamentary light bridge. Group 2: single, red-lobed profiles occupying an area of about 2% located at the outer penumbra in discrete patches that possibly signify the downflowing leg of an -loop. Group 3: three-lobed or highly asymmetric profiles, in which the rest component and the strong downflowing component have an opposite polarity as the sunspot. These occupy about 1.4% of the penumbra’s area and are seen in conspicuous, elongated structures or isolated patches in the outer penumbra and at the penumbra-quiet Sun boundary. Group 4: three lobed-profiles, in which the rest component has the same polarity as the sunspot and a weaker, upflowing component with a polarity opposite that of the sunspot. These profiles are located close to the entrance of the filamentary light bridge and are found in only 0.12% of the penumbral area. These minority groups of profiles could be related to dynamic phenomena that could also affect the overlying chromosphere. The simplicity and speed of k-means can be utilized to identify such anomalous profiles in larger data sets to ascertain their temporal evolution and the physical processes responsible for these inhomogeneities.
keywords:
\KWDSun:sunspots, Sun:high resolution, Sun:photosphere , Technique:polarimetric1 Introduction
Sunspots have been extensively studied for more than four centuries firmly confirming their intricate connection to the solar activity cycle. The subsequent discovery of the Zeeman effect [83] aided in establishing the presence of magnetic fields in sunspots [22, 23] that heralded a paradigm shift in solar physics. Over the last 40 years, advancements in ground- and space-based spectro-polarimetric observations have enabled us to infer magnetic and velocity fields in sunspots with very high spatial and temporal resolution.
The inference of the photospheric magnetic field is done from the various polarization states of light which can be described in terms of the four Stokes parameters [I, Q, U, V; 73] and solving the radiative transfer equation under the assumption of local thermodynamic equilibrium. Stokes Q, and U describe the difference of linearly polarized light at 0∘ and 90∘, and 45∘ and 135∘, respectively. On the other hand, Stokes V is the difference of the right- and left-circular polarization states of light. Stokes I represents the total intensity of the incoming radiation. The four Stokes parameters can thus provide information of the thermal, magnetic, and kinematic conditions in the solar atmosphere where the observed spectral lines form. The extraction of the physical parameters from the Stokes profiles is currently done using spectral inversion codes [ICs; 72, 6, 14], which vary in complexity and approximations of the solar atmosphere. The simplest and fastest of ICs is based on the Milne-Eddington (ME) approximation which assumes that all physical parameters remain constant with height and the source function varies linearly with optical depth [77, 55, 33, 70]. Other ME-based ICs include the MILne–Eddington inversion of the pOlarized Spectra [MILOS; 50, 51], MERLIN [34], Very Fast Inversion of the Stokes Vector [VFISV; 10], and Stokes Profile INversion [SPIN; 82]. However, ME-based ICs cannot handle gradients along the line-of-sight that produce asymmetric Stokes profiles. Other ICs which can account for gradients along the line-of-sight as well as multiple components within the resolution element, include the Stokes inversion based on Response Functions [SIR; 59], MIcro Structured Magnetic Atmospheres [MISMA; 62], SIRGAUSS [5, 29], and SIRJUMP [employed in 41]. The main characteristics of the ICs mentioned above is that they consider local thermodynamic equilibrium (LTE), which is a valid approximation in the solar photosphere. They have been widely utilized to retrieve the atmospheric conditions in the solar photosphere where the Stokes profiles are highly asymmetric or anomalous as we shall see below.
In the absence of gradients in the magnetic field and line-of-sight (LOS) velocity, the Stokes V profile comprises two, anti-symmetric, equi-amplitude lobes which are generally seen in the sunspot umbra and a large part of the penumbra. However, the difference between the blue and red lobe amplitudes, or amplitude asymmetry, is typically non-zero and exhibits a sign change along the radial penumbral distance, wherein the blue lobe is larger (smaller) than the red lobe in the inner (outer) penumbra [67]. Furthermore, Stokes V profiles with a third, additional lobe having a polarity opposite that of the parent spot and strongly-red shifted are seen in many patches located in the mid- and outer- penumbra. Such profiles are associated with the Evershed flow [16] returning to the solar photosphere at supersonic speeds and have been observed in the visible [81] as well as infra-red [13]. Such profiles have been analysed using different atmospheric configurations in spectral ICs, either using two height-independent magnetic components within the resolution element [8, 1], or, gradients in the physical parameters along the line-of-sight [47, 7, 58]. The association of the returning downflows in sunspot penumbrae with overturning convection, as predicted by simulations [56], has been a topic of extensive research over more than two decades [68, 63, 19, 65, 27, 58, 20, 15, 18]. Detailed reviews on this topic are available in Schlichenmaier [66, and references therein] and Borrero & Ichimoto [9, and references therein].
Along with the supersonic penumbral downflows, the source of the Evershed flow can be traced to bright penumbral grains at the heads of filaments at the umbra-penumbra boundary [57, 20] which are associated with weak blue-shifts and comprise a weakly asymmetric blue lobe in the Stokes V profile [25, 20]. On the other hand, spectral profiles above sunspot light bridges (LBs) have been known to be asymmetric [71, 64, 30], indicating gradients along the LOS, as well as anomalous, wherein the Stokes V profiles comprise three lobes, with the third lobe having the same polarity as the sunspot and indicative of supersonic downflows [41]. The latter, in particular, are also seen at the umbra-penumbra boundary of sunspots [42]. The supersonic flows in LBs can also be blue- or red-shifted to near-supersonic speeds with a polarity opposite to that of the spot and comprise a small fraction of the resolution element [38].
With the spatial resolution of ground-based telescopes approaching, or becoming smaller than, the photon mean free path of about 100 km in the photosphere [28], one expects to encounter a variety of inhomogeneities in the physical parameters recovered from a sunspot. In the conventional setup of ICs, the merit function () between the observed and synthetic Stokes profiles is iteratively minimized using the Marquardt algorithm [54]. The iterations involve the modification of an initial depth-dependent model atmosphere supplied by the user which make up the elements of the propagation matrix in the radiative transfer equation (RTE). The elements of the propagation matrix comprise the absorption, emission, and birefringence phenomena which characterize the medium [12]. The synthetic profiles are then generated by numerically integrating the RTE for the wavelength range present in the observations. The iterative minimization of the is achieved by determining the perturbations of the guess model atmosphere such that the synthetic profiles match the observed ones. Under a linear approximation, the sensitivities of the Stokes profiles to perturbations of the physical parameters are called Response Functions [59] that are necessary to compute the partial derivatives of with respect to the model atmospheric parameters. In order to reduce the number of free parameters, the perturbations of the depth-dependent physical parameters are determined only at discrete points in optical depth called nodes. The number of nodes can be set independently for each physical parameter. Thus, the IC delivers a model atmosphere for the chosen set of nodes [4]. One should note that, the solution obtained by this method is not unique, and during the minimization iterative process a local minimum may be reached. As we have seen above, the number of nodes, which also represent the degrees of freedom, have to be specifically tailored for each type of inhomogeneous atmospheric stratification while also ensuring its physical realism and feasibility. Thus, an apriori knowledge of the spectral shape would assist in optimizing the set of nodes in an IC to adequately determine the atmospheric stratification.
In this article, we classify and analyze Stokes V profiles in a sunspot based on their shapes, similar to the strategy adopted by Viticchié & Sánchez Almeida [80] for quiet-Sun (QS) profiles. The aim of this study is to determine the fraction of profiles that deviate from the set of well known profiles in a sunspot, the number of families/groups of such profiles, their preferential spatial distribution, if any, and the atmospheric stratification associated with them. The rest of the paper is organized as follows, Sections 2 and 3 describes the observations used and the data analysis respectively. We present our results in Section 4 with Sections 5 and 6 reserved for Discussion and Conclusions, respectively.
2 Observations
The sunspot under study was the leading spot in NOAA active region (AR) 10953 that was observed by Hinode [32] on 2007 May 01 when the AR was at a heliocentric angle of 8∘. We use the spectropolarimeter [SP; 35, 24] of the 50-cm Solar Optical Telescope [SOT; 76] on board Hinode. After processing the data obtained on board, Hinode provides the four Stokes profiles of the Fe \Romannum1 lines at 630 nm with a spectral sampling of 21.55 mÅ, a step width of 015, a pixel size of 016 along the slit, and an exposure time of 4.8 s per slit position using the normal map mode from 10:46–12:25 UT. Out of the total SP field-of-view (FOV) of 150′′164′′ we selected a FOV of 67.5′′72′′ around the sunspot. The observations were corrected for dark current, flat field, thermal flexures, and instrumental polarization using routines included in the Solar-Soft package [36] to yield Level-1 data.
3 Data Analysis
3.1 Pre-processing
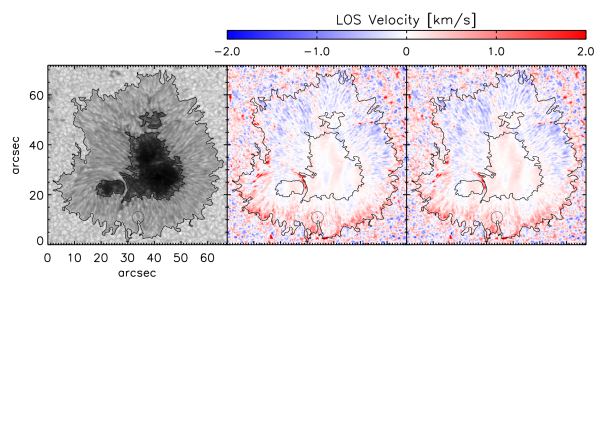
The Level-1 Stokes profiles were normalized by the QS continuum intensity as an average of all pixels where the polarization signal was less than three times the noise level. This also yielded the average QS profile which was used to calculate the reference wavelengths for the two Fe \Romannum1 lines separately. The 112-pixel wavelength window was then split into two, of 56 wavelength points each, and the corresponding profiles of the two lines were then inverted independently using the parallel version of the SIR code [74]. This was done so that the clustering was performed on the basis of the shape of both Fe \Romannum1 lines. We ran a single cycle of SIR with height-independent LOS velocity and the vector magnetic field, along with two nodes for temperature. Figure 1 shows the sunspot in continuum intensity as well as the LOS velocity derived from the inversions for the two Fe \Romannum1 lines. The resultant LOS velocity was then used to shift the Stokes V profile in wavelength from which the central 44 wavelength points were used. Finally, the shifted spectra of both Fe \Romannum1 lines were combined to yield 88 points in wavelength that were then normalized to the maximum unsigned value. The last two steps are similar to the method described in Viticchié & Sánchez Almeida [80]. The clustering is done for all pixels in the sunspot excluding only those in the three umbral cores, which resulted in the classification of 93458 pixels. The penumbral region includes a granular and filamentary LB located in the northern and southern part of the sunspot, respectively. We note that as the clustering scheme works exclusively on the shape of the Stokes profile, the effect of normalization by the individual maxima masks the actual amplitude of the spectra. The verification of the final output was done by inspecting the minor clusters (the ones with a small number of samples) and comparing their true amplitude to the common and dominant profiles present in the penumbra (Sect. 4.3).
3.2 k-means Clustering
In order to group the Stokes V profile based on their shapes, we use the k-means clustering technique [37, 17]111Technique first proposed by Lloyd in 1957. This method is widely used in machine learning, data mining etc. where data points are grouped into clusters. This is done by using a set of cluster centers at random from the data points and measuring the Euclidean distance of each data point from the cluster centers. The data point is assigned the index of that cluster center to which the distance is a minimum. When the indexing of all data points is completed, the new cluster centers are computed for each resulting cluster as the average of the samples (elements) in each cluster. The process of assigning a data point to a cluster center is complete when the centroids of each cluster along with the variance remain unchanged.
While k-means is quite simple to implement, the clustering result depends on the choice of the initial cluster centers as well as the number of clusters. In the classical approach, the clustering scheme is run several times with a different random initialization and the resulting variance and cluster center from each run are then analyzed. Since each sample or spectra is assigned an index based on its least distance from all the cluster centers, we computed the initial cluster centers in the following manner. The first cluster center corresponds to the profiles that is definitely a cluster class, namely nearly anti-symmetric Stokes V profiles. The choice of the above was done from the pixel where the corresponding Stokes V profile had the least area asymmetry. The second cluster center was determined as that profile which had a maximum distance to the first cluster center. Once the first and second initial cluster centers were determined, the same process was repeated for the remaining cluster centers, such that the distance of the next cluster center was the maximum of the total distance with the previous cluster centers while also ensuring that the data points corresponding to the previous cluster centers were excluded from the calculation. The rationale behind this approach is to start off with cluster centers that are spaced out from each other as far as possible.

Once all the initial cluster centers were determined, the actual clustering process was carried out by computing the distance of each () Stokes profile from the cluster center as,
| (1) |
and determining for which was a minimum. The index runs over the number of wavelength points, which in our case was , while the index varies from 1 to . The clustering algorithm was run for different number of clusters, ranging from to . At the end of each clustering run, i.e. when the variance had converged, the clusters were re-ordered according to the number of profiles in each cluster and indexed from 1 to , where 1 represents the most populous cluster, and the most scarce. The total time for performing the clustering was about 14 min on an iMac with a 3.1 GHz, 6-core, Intel i5 processor. For each clustering run, where was varied, we computed the sum of the standard deviation of those clusters which contained nearly anti-symmetric Stokes profiles weighted by the number of profiles in that cluster. This was done on the basis that a significant part of the penumbra is known to contain profiles that do not exhibit very strong asymmetries. The variation of the sum of the standard deviation with is shown in Fig. 2 where an exponential decaying function was used to determine the optimum choice of beyond which increasing the number of clusters did not yield any further change. The value of was chosen to be 25 using the elbow [75] of the curve which works best when the data set is clustered.
4 Results
4.1 Inter-cluster Variations
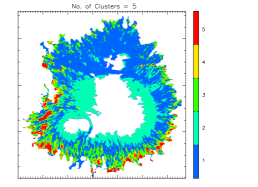
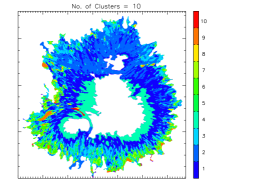
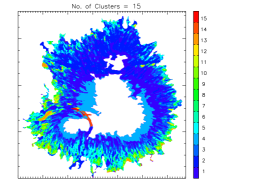
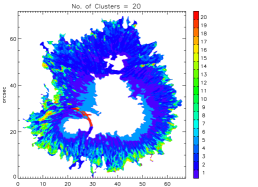
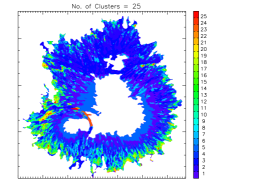
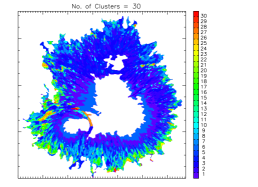
Figure 3 shows the variation in cluster populations as the number of clusters change. For low cluster numbers, i.e., when k , the bulk of the penumbral area is occupied by the first couple of clusters and the scarce clusters are confined to the outer regions of the penumbra. As k increases, we find the above trend persists, with the populous clusters beginning to segregate into various sub-clusters. In addition, the filamentary and small-scale structure, characteristic of the penumbra becomes more apparent when k . The middle panel in the bottom row of the figure indicates that individual clusters can also be identified with specific features, such as the southern filamentary LB with cluster no. 23, an elongated filament with cluster no. 20 (′′, ′′), and the two, nearly circular patches in the north-western section of the penumbra with cluster no. 24 (′′, ′′). The spatial distribution settles quite quickly between k and k , which was evident from Fig. 2. Increasing the number of clusters beyond 25 only serves to divide the clusters further within themselves and does not produce any significant change in the spatial distribution.
4.2 Spatial Distribution of Clusters for k
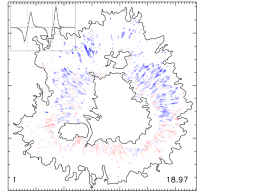
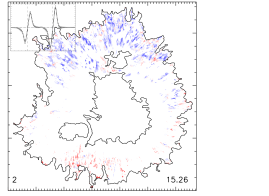
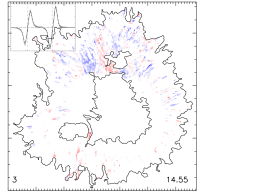
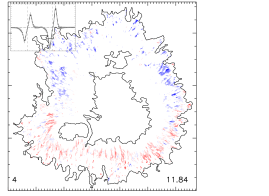
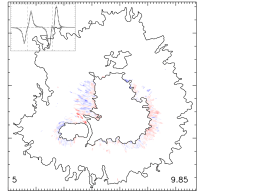
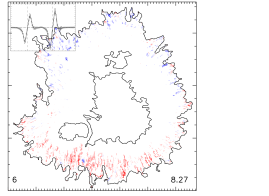
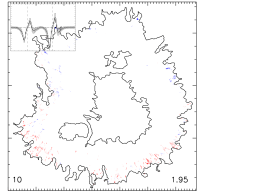
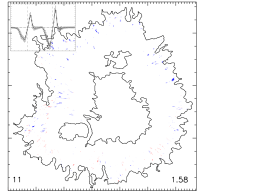
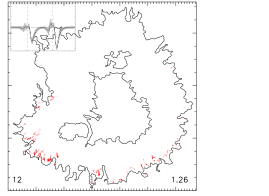
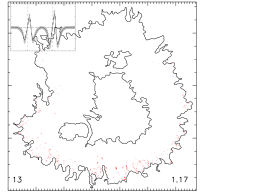
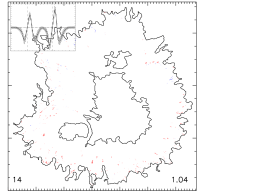
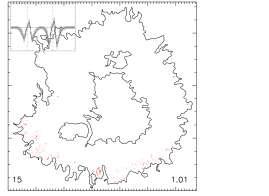
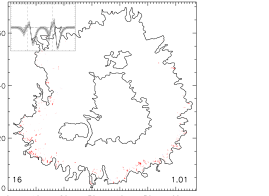
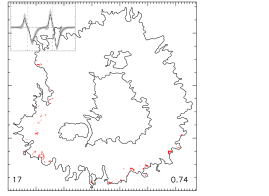
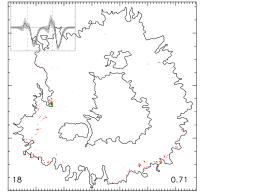
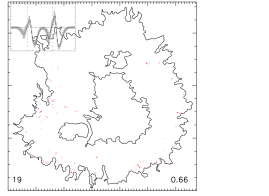
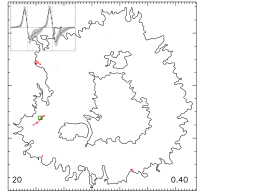
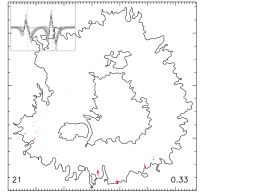
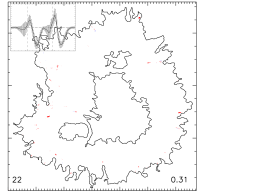
Figures 4–6 shows the spatial distribution of individual clusters in the penumbra, when using k , with the mean profile for each cluster displayed in the top left corner. Since the clustering was performed on the profiles after removing the velocities, the binary map for each cluster was used to depict the corresponding LOS velocity as shown in the background. It is to be noted that the LOS velocity shown in the figures was derived from inversions that used height-independent parameters, hence the values are only representative of the average velocity in the height forming region of the photospheric Fe \Romannum1 lines. Given the proximity of the sunspot to disc-centre we interpret the blue- and red-shifts as upflows and downflows, respectively.
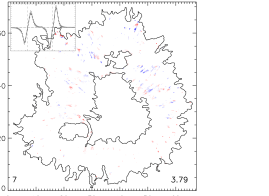
Clusters 1–5 and 7 (Fig. 4) cover nearly 74.3% of the penumbra and comprise nearly, anti-aymmetric Stokes profiles. The variation of profiles among these clusters originate from the amplitude ratio between the two Fe \Romannum1 lines as well as the separation between the blue and red lobes. These profiles are associated with both upflows and downflows with mean values ranging from 0.1 km s-1 to 0.3 km s-1 and 0.1 km s-1 to 0.2 km s-1, respectively. The maximum values of upflows and downflows, on the other hand, range from 0.7 km s-1 to 1.4 km s-1 and 0.8 km s-1 to 1.3 km s-1, respectively. While upflows dominate in terms of area for clusters 1, 2, and 3, with values of 65%, 67%, and 56%, respectively, the downflowing regions exceed the upflowing areas by about 10% for clusters 4, 5, and 7 with values of 55%, 54%, and 57%, respectively. Cluster 5, in particular, is solely confined to an annular region around the umbra-penumbra boundary, and mostly distributed over a line perpendicular to the sunspot line-of-symmetry (the line joining the spot center to the solar disc center). The average profile in cluster 5 is distinct from the other clusters in this group because the Stokes inversion at the zero crossing position in the Fe \Romannum1 line at 6302.5 Å is clearly visible, that arises from magneto-optical effects. The upflows and downflows in clusters 1 to 7 strongly bear the filamentary structure, the quintessential feature of the penumbra.
| No. | Area [%] | Upflows | Downflows | ||||
|---|---|---|---|---|---|---|---|
| Total | Upflows | Downflows | Mean | Max. | Mean | Max | |
| 1 | 18.97 | 64.61 | 35.39 | -0.21 | -1.41 | 0.12 | 0.87 |
| 2 | 15.26 | 67.20 | 32.80 | -0.23 | -1.00 | 0.20 | 1.07 |
| 3 | 14.55 | 56.08 | 43.92 | -0.16 | -1.00 | 0.14 | 1.27 |
| 4 | 11.84 | 45.08 | 54.92 | -0.29 | -1.17 | 0.22 | 1.09 |
| 5 | 9.85 | 45.52 | 54.48 | -0.10 | -0.67 | 0.09 | 0.82 |
| 6 | 8.27 | 32.88 | 67.12 | -0.25 | -1.16 | 0.30 | 1.15 |
| 7 | 3.79 | 42.55 | 57.45 | -0.18 | -1.04 | 0.18 | 1.31 |
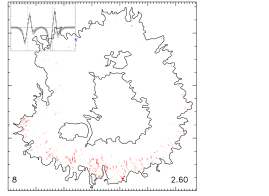
| 8 | 2.60 | 18.12 | 81.88 | -0.20 | -0.81 | 0.36 | 1.20 |
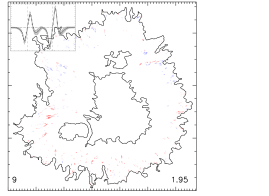
| 9 | 1.95 | 38.14 | 61.86 | -0.19 | -1.14 | 0.29 | 0.98 |
| 10 | 1.95 | 33.21 | 66.79 | -0.27 | -1.56 | 0.30 | 1.04 |
| 11 | 1.58 | 67.93 | 32.07 | -0.31 | -1.69 | 0.17 | 0.81 |
| 12 | 1.26 | 5.08 | 94.92 | -0.15 | -0.87 | 0.59 | 2.36 |
| 13 | 1.17 | 13.87 | 86.13 | -0.15 | -1.07 | 0.39 | 1.17 |
| 14 | 1.04 | 23.55 | 76.45 | -0.17 | -0.97 | 0.34 | 1.09 |
| 15 | 1.01 | 14.87 | 85.13 | -0.20 | -0.71 | 0.39 | 1.39 |
| 16 | 1.01 | 5.28 | 94.72 | -0.09 | -0.26 | 0.50 | 1.65 |
| 17 | 0.74 | 3.76 | 96.24 | -0.12 | -0.55 | 0.73 | 2.35 |
| 18 | 0.71 | 3.30 | 96.70 | -0.16 | -0.59 | 0.73 | 3.23 |
| 19 | 0.66 | 10.97 | 89.03 | -0.15 | -0.69 | 0.48 | 2.65 |
| 20 | 0.40 | 11.38 | 88.62 | -0.21 | -0.57 | 0.68 | 2.89 |
| 21 | 0.33 | 10.26 | 89.74 | -0.17 | -0.72 | 0.57 | 1.28 |
| 22 | 0.31 | 14.97 | 85.03 | -0.17 | -0.75 | 0.59 | 4.46 |
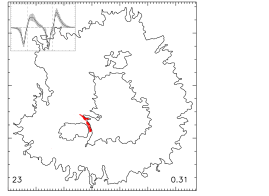
| 23 | 0.31 | 3.41 | 96.59 | -0.09 | -0.30 | 1.10 | 3.75 |
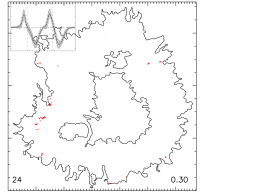
| 24 | 0.30 | 5.63 | 94.37 | -0.24 | -0.89 | 1.47 | 5.94 |
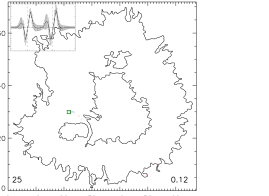
| 25 | 0.12 | 69.44 | 30.56 | -0.19 | -1.20 | 0.36 | 0.79 |
Cluster 11 (Fig. 5) consists of profiles with an extended blue lobe and is present in 1.6% of the penumbral area. As a result, this cluster comprises 68% upflows with a maximum value of 1.7 km s-1.
The next family of profiles consist of three, clear lobes, resembling Stokes with the third lobe having an opposite sign as the spot and on the red-side of the profile. This spectral feature is seen in clusters 8 to 19 (Figs. 5 and 6), excluding clusters 11, 12, 17, and 18 and account for 11% of the penumbral area. The velocities in these 8 clusters are predominantly downflows with upflows seen in clusters 9 and 10 and occupying 38% and 33% of the patch area. In addition, the downflows are confined to smaller patches or blobs while the filamentary structure is only apparent in cluster 8. The downflows in this family of clusters have maximum values exceeding 1 km s-1 and are as large as 2.7 km s-1 in cluster 19. Cluster 6 can also be regarded as a part of this family of profiles, as the mean profile exhibits a very weak, although discernible, third lobe of opposite polarity and is mostly confined to the outer penumbra. This cluster has an area of about 8% in the penumbra with downflows occupying 67% of it while the maximum upflows and downflows are about 1.2 km s-1. To this family of three lobed profiles, one can include clusters 21 and 22 (bottom row of the figure) with the exception that there is a large scatter associated with profiles occupying an area of 0.33% and 0.31% of the penumbral area. Cluster number 22, in particular has the second highest downflows reaching values of about 4.5 km s-1.
The remaining clusters account for about 4% of the penumbral area and consist of four prominent groups/families. Clusters 12 and 18 comprise predominantly of a red lobe, occupying 2% of the penumbral area and are seen mostly at the limb-ward side of the sunspot’s boundary. The downflows in the two clusters reach a maximum value of 2.4 km s-1 and 3.2 km s-1, respectively.
Cluster 23 (Fig. 6) is seen exclusively in the filamentary LB in the southern part of the sunspot, occupying an area of 0.3% of the penumbra with an extended red lobe but with the same sign as the spot. The downflows in the LB are about 3.8 km s-1.
Clusters 17 (Fig. 5) and 24 (Fig. 6) exhibit highly asymmetric profiles with two primary lobes but with a sign opposite that of the spot. These clusters appear in specific patches as downflows with values of 2.4 km s-1 and 5.9 km s-1, respectively and occupy 1% of the penumbral area. Cluster 20 can be considered a sub-category of clusters 17 and 24, as it shares the same sign of the lobes as the others but consists of a highly extended red-lobe. One of the locations of this cluster consists of a fairly conspicuous filamentary structure (′′, ′′) that is also spatially associated with the other two clusters in this family.
The final remaining cluster is number 25 (Fig. 6) that occupies about 0.12% of the penumbral area. The profiles in this cluster have an opposite sign to those seen in the second family of profiles (8–19) consisting of three lobes and associated with strong downflows. This cluster mostly exhibits weak upflows located close to the entrance of the southern filamentary LB. The above values are summarized in Table 1.
4.3 Stokes Spectra Associated with Select Clusters
We now look at the actual spectra from select clusters and compare them with the normal, anti-symmetric profile that dominates the penumbra. As mentioned earlier, this is to ascertain their amplitude since the clustering was performed after the profiles were normalized to their individual unsigned maxima. Figure 7 shows Stokes profiles from clusters 18, 20, and 25, with their location marked in Figs. 5 and 6 with a green square. The top panel shows that the Stokes profile in cluster 18 is primarily dominated by a single red lobe with an amplitude of about 4% and has a sign opposite to that of the sunspot in comparison to the stronger, anti-symmetric Stokes profile (dashed line).
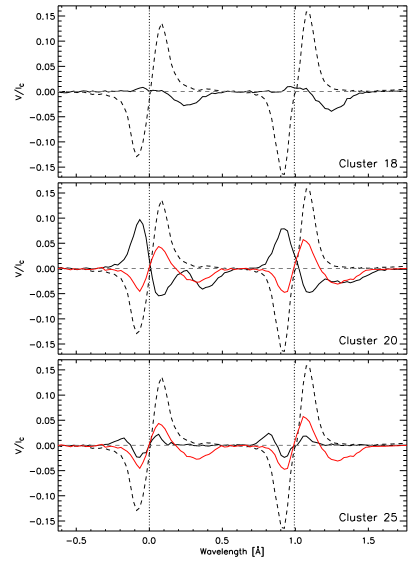
The middle panel shows the profile in the large elongated patch belonging to cluster 20, where the presence of 2 separate red lobes indicates strong, possibly supersonic downflows. The difference between these profiles versus those typically associated with the Evershed flow returning to the photosphere (red line) is that the slower or rest component also has a polarity opposite that of the sunspot as seen from the sign of the blue lobe. The strength of the strongly red-shifted lobes is about 4% and 3% in the two Fe \Romannum1 lines, respectively.
Finally, the bottom panel of the figure shows the profile associated with a patch exhibiting weak upflows seen in cluster 25 with an amplitude of about 2% and comprises three lobes. The rest component has the same polarity as the sunspot, but the third lobe associated with the weak upflow is of opposite polarity. Thus, these profiles are of opposite sign to that seen in the Evershed flow returning to the photosphere (red line), the velocities are mostly upflows, and considerably smaller in magnitude.
5 Summary and Discussion
The segregation of Stokes profiles using the k-means clustering method reveals that nearly three-quarters of the profiles in a penumbra of a regular, unipolar sunspot are nearly normal and anti-symmetric with two, well defined lobes. These profiles comprise both upflows and downflows with mean values of about 0.3 km s-1 and 0.2 km s-1, respectively. This set of profiles can be found in a total of six clusters when using k for the clustering. In comparison, such normal, anti-symmetric profiles only constitute about 7% of the area in the QS [80] while having an area five times larger than the penumbra. Thus, employing a ME approximation for the inversion of these profiles can be straightforward and simple.
The second dominant class of profiles in the penumbra comprise three lobes, similar to Stokes accounting for about 21% of the penumbral area and comprising 11 clusters. In the QS, such profiles occupy about 8% of the area [80]. These profiles dominantly show downflows which are associated with the Evershed flow returning to the photosphere, [81, 13, 8, 1, 47, 25, 58], wherein the rest component has the same polarity as the spot and the high-speed, downflowing component has the opposite polarity. Cluster 6 has a similar property to the above, although the third lobe is extremely weak, but nevertheless discernible.
The remaining penumbral region of about 4% is dominated by four categories of profiles. The first are the strong downflows, sometimes reaching supersonic values, seen entirely in the filamentary LB [41, 42] and in a single cluster. The polarity of both components is the same as the parent sunspot. However, we do not see similar profiles in the northern granular LB which would suggest that these anomalous profiles are not a consequence of overturning convection in the weakly magnetized LB. Moreover, the magnetic field strength of the rest and supersonic component is about 2.0 kG and 1.7 kG, respectively and nearly vertical in both cases. Louis et al. [41] had shown that if the Stokes profiles in the LB were fitted with discontinuities in the physical parameters, the high-speed downflows would occur in the deeper layers below . The high speed downflows could result from the gravitational acceleration of gas along vertical flux tubes or due to the iso- level associated with the Wilson depression sampling deeper layers where the plasma velocity would be higher. In addition, these supersonic downflows in LBs are known to be associated with long-lived jets/arc-like brightenings in the chromosphere, although the causal relation between the two is still an open question [39].
The second category comprises profiles with a dominant or single red lobe that cover about 1.4% of the penumbral area. Such profiles are also seen in the QS and account for about 11% of the area [80]. These single-lobed profiles are known to be associated with emerging loops [79] in the QS, with earlier studies focusing on the topology, dynamics [11, 45, 44, 46], and specific examples of emergence [26]. The emergence of magnetic flux in the QS [44, 52, 53, 21] or in sunspots [40, 43] plays a vital role in heating the overlying chromosphere depending on the pre-existing field configuration. These single-lobed profiles can also be associated with the submergence of magnetic flux in the QS as shown in Sainz Dalda et al. [61] using inversions and numerical simulations, where the fraction of such profiles in the QS was about 2%.
An inversion of these Stokes profiles was performed using height-dependent parameters, using three nodes for the magnetic field strength, inclination, and LOS velocity, while two nodes were provided for the azimuth. One finds that the field inclination is about at and changes to nearly at , while the LOS velocity is at rest at and increases to about 7 km s-1 at . While this configuration is consistent with one leg of the loop hosting downflows, a visual inspection of the profiles in the vicinity of the single, red-lobed profiles did not reveal any single, blue-lobed profile, nor was there any indication of the latter when using higher values of k . We suggest that instead of smooth gradients, employing discontinuities along the LOS would be a better alternative to reproduce such single-lobed profiles.
The third category of profiles comprises three lobes, however, both the rest and strongly red-shifted component have a polarity opposite that of the sunspot, unlike those associated with the Evershed flow returning to the photosphere. A two-component inversion of the Stokes profiles using height-independent parameters indicates that the component hosting supersonic downflows has a fill fraction of about 26%, while both the rest and high-speed components have similar field strengths and inclinations of about 1500 G and , (with respect to the vertical) respectively. However, a more likely scenario is that these components are stacked in height with the high-speed downflows located in the deeper layers. One possible explanation as to why the rest component in these types of profiles is also of opposite polarity as the sunspot could be the line-of-sight sampling a magnetized atmosphere with the field oriented in the opposite direction throughout as opposed to the returning EF where the neighboring, nearly vertical, intra-spine fields arch over the high-speed EF channels. This is supported by the spatial distribution and morphology of the pixels which harbor these profiles which are predominantly located in large, isolated and extended structures (cluster 20 in Fig. 6) while the EF downflows are seen in diffuse/smaller, but nearly ubiquitous patches or blobs in the outer limb-side penumbra (e.g. clusters 13–15 in Fig. 5).
The final category of profiles, while comprising three lobes, has the opposite sign as profiles exhibiting the Evershed flow returning to the photosphere. A two-component inversion similar to the category above show that the dominant component, having a fill fraction of about 86%, has the same polarity as the spot and is at rest, while the second component consists of upflows of about 1.5 km s-1 and has an opposite polarity as the sunspot. While both components are of opposite polarity, they are nevertheless highly inclined which explains the reduced amplitude of the Stokes signal. As these profiles are located close to the entrance of the filamentary LB, they could be magnetically connected to the large active region filament, seen in H, located outside the sunspot and extending towards the LB [48, 49, 69]. Intermittent, strong chromospheric brightenings were observed in localized patches on the filament channel as well as over the LB [49]. A similar scenario was found by Kleint & Sainz Dalda [31], where the 3-lobe Stokes V profiles were also identified in an umbral filament, which was also connected to magnetic structures outside of the sunspot through the overlying chromosphere. Those 3-lobe Stokes V profiles were also inverted considering two magnetic components.
Some, if not all, of the anomalous Stokes profiles described here are the photospheric manifestations of either dynamics or structures in the overlying chromosphere, although the possible causal relation between the two may be difficult to ascertain when the information on the magnetic fields and plasma motions is only available in the photosphere. Further investigations are needed to determine the physical mechanisms producing these small-scale inhomogeneities by combining observations with radiative magneto-hydrodynamic simulations. However, the speed and simplicity of k-means makes it a viable tool to identify such anomalous profiles and also track them in time, not only in the photosphere but in higher atmospheric layers as well. At present, k-means is widely employed in the IRIS Inversion based on Representative profiles Inverted by STiC [IRIS; 60]. A similar strategy could be implemented in the CAlcium Inversion based on a Spectral ARchive [CAISAR; 2, 3]
The clusters derived in this study are specific for a sunspot located close to disc center. As the EF can be perceived as hot upflows in the inner penumbra that turn into a nearly horizontal outflow and are embedded in a nearly vertical, static magnetic field, the LOS will sample different parts of this magnetic geometry as the heliocentric angle increases [67]. Thus, one would expect the number of profiles with strong asymmetries to increase as the viewing angle changes from disc center to the limb. Nevertheless, with k-means one can ascertain the nature and spatial distribution of the clusters as a function of heliocentric angle for spots that have a similar configuration as the one analyzed in this study.
We finally note that the clustering was carried out on the Stokes spectra without a correction for the spatially coupled polarized stray light due to Hinode SOT’s point spread function [78]. The above correction would render the weaker spectral anomalies more prominent that would alter the mean profile in the clusters as well as possibly introduce additional cluster families to the ones described above, but the minority clusters identified above would remain unaffected.
6 Conclusions
The usage of k-means as a tool to classify Stokes spectra in a regular sunspot is a quick and easy approach to identify different families of profiles and their spatial occurrences. In the regular sunspot, 75% and 21% of the penumbral area is occupied by normal, anti-symmetric profiles with two lobes and three-lobed profiles, respectively. The latter in particular is the well-known profile associated with the Evershed flow returning to the solar photosphere where the strong, downflowing component often has a polarity opposite to the sunspot. The remaining penumbral area of 4% is dominated by four groups/families wherein one of them comprises Stokes profiles with only one red lobe while the other three comprise three lobes with different polarity combinations of the two magnetic components present in the profile, making them distinct from those associated with the Evershed flow returning to the photosphere. Further investigations are needed to understand the physical mechanisms that produce such spectra in sunspots and their possible coupling to the overlying chromosphere.
Acknowledgments
Hinode is a Japanese mission developed and launched by ISAS/JAXA, collaborating with NAOJ as a domestic partner, NASA, and STFC (UK) as international partners. Scientific operation of the Hinode mission is conducted by the Hinode science team organized at ISAS/JAXA. This team mainly consists of scientists from institutes in the partner countries. Support for the post-launch operation is provided by JAXA and NAOJ (Japan), STFC (UK), NASA, ESA, and NSC (Norway). The SIR inversions were performed using the 100TF cluster Vikram-100 at Physical Research Laboratory, India. We thank the anonymous referees for reviewing our article and providing useful comments.
References
- Beck [2008] Beck, C. (2008). A 3D sunspot model derived from an inversion of spectropolarimetric observations and its implications for the penumbral heating. \aap, 480(3), 825–838. doi:10.1051/0004-6361:20078409. arXiv:0712.3168.
- Beck et al. [2015] Beck, C., Choudhary, D. P., Rezaei, R. et al. (2015). Fast Inversion of Solar Ca II Spectra. \apj, 798(2), 100. doi:10.1088/0004-637X/798/2/100. arXiv:1410.8451.
- Beck et al. [2019] Beck, C., Gosain, S., & Kiessner, C. (2019). Fast Inversion of Solar Ca II Spectra in Non-local Thermodynamic Equilibrium. \apj, 878(1), 60. doi:10.3847/1538-4357/ab1d4c. arXiv:1904.11843.
- Bellot Rubio [2003a] Bellot Rubio, L. R. (2003a). Inversion of Stokes Profiles with SIR. Freiburg: Kiepenheuer Institut für Sonnenphysik, (pp. 1--32).
- Bellot Rubio [2003b] Bellot Rubio, L. R. (2003b). The Fine Structure of the Penumbra: from Observations to Realistic Physical Models. In Trujillo-Bueno, J., & Sanchez Almeida, J. (Eds.) In J. Trujillo-Bueno, & J. Sanchez Almeida (Eds.), Solar Polarization, ASP Conf. Ser. 307 (p. 301).
- Bellot Rubio [2006] Bellot Rubio, L. R. (2006). Stokes Inversion Techniques: Recent Advances and New Challenges. In Casini, R., & Lites, B. W. (Eds.) In R. Casini, & B. W. Lites (Eds.), Solar Polarization 4, ASP Conf. Ser. 358 (p. 107). doi:10.48550/arXiv.astro-ph/0601483.
- Bellot Rubio [2010] Bellot Rubio, L. R. (2010). The Evershed Flow and the Brightness of the Penumbra. In In Magnetic Coupling between the Interior and Atmosphere of the Sun, Astrophysics and Space Science Proceedings 19 (p. 193). doi:10.1007/978-3-642-02859-5_15.
- Bellot Rubio et al. [2004] Bellot Rubio, L. R., Balthasar, H., & Collados, M. (2004). Two magnetic components in sunspot penumbrae. \aap, 427, 319--334. doi:10.1051/0004-6361:20041277.
- Borrero & Ichimoto [2011] Borrero, J. M., & Ichimoto, K. (2011). Magnetic Structure of Sunspots. Liv. Rev. Sol. Phys., 8(1), 4. doi:10.12942/lrsp-2011-4. arXiv:1109.4412.
- Borrero et al. [2011] Borrero, J. M., Tomczyk, S., Kubo, M. et al. (2011). VFISV: Very Fast Inversion of the Stokes Vector for the Helioseismic and Magnetic Imager. \solphys, 273(1), 267--293. doi:10.1007/s11207-010-9515-6. arXiv:0901.2702.
- Centeno et al. [2007] Centeno, R., Socas-Navarro, H., Lites, B. et al. (2007). Emergence of Small-Scale Magnetic Loops in the Quiet-Sun Internetwork. \apjl, 666(2), L137--L140. doi:10.1086/521726. arXiv:0708.0844.
- del Toro Iniesta [2007] del Toro Iniesta, J. C. (2007). Introduction to Spectropolarimetry.
- del Toro Iniesta et al. [2001] del Toro Iniesta, J. C., Bellot Rubio, L. R., & Collados, M. (2001). Cold, Supersonic Evershed Downflows in a Sunspot. \apjl, 549(1), L139--L142. doi:10.1086/319137.
- del Toro Iniesta & Ruiz Cobo [2016] del Toro Iniesta, J. C., & Ruiz Cobo, B. (2016). Inversion of the radiative transfer equation for polarized light. Living Reviews in Solar Physics, 13(1), 4. doi:10.1007/s41116-016-0005-2. arXiv:1610.10039.
- Esteban Pozuelo et al. [2015] Esteban Pozuelo, S., Bellot Rubio, L. R., & de la Cruz Rodríguez, J. (2015). Lateral Downflows in Sunspot Penumbral Filaments and their Temporal Evolution. \apj, 803(2), 93. doi:10.1088/0004-637X/803/2/93. arXiv:1502.02981.
- Evershed [1909] Evershed, J. (1909). Radial movement in sun-spots. \mnras, 69, 454. doi:10.1093/mnras/69.5.454.
- Forgy [1965] Forgy, E. W. (1965). Cluster analysis of multivariate data: efficiency versus interpretability of classifications. Biometrics, 21(3), 768--769.
- Franz et al. [2016] Franz, M., Collados, M., Bethge, C. et al. (2016). Magnetic fields of opposite polarity in sunspot penumbrae. \aap, 596, A4. doi:10.1051/0004-6361/201628407. arXiv:1608.00513.
- Franz & Schlichenmaier [2009] Franz, M., & Schlichenmaier, R. (2009). The velocity field of sunspot penumbrae. I. A global view. \aap, 508(3), 1453--1460. doi:10.1051/0004-6361/200913074. arXiv:0909.4744.
- Franz & Schlichenmaier [2013] Franz, M., & Schlichenmaier, R. (2013). The velocity field of sunspot penumbrae. II. Return flow and magnetic fields of opposite polarity. \aap, 550, A97. doi:10.1051/0004-6361/201220708. arXiv:1212.4732.
- Gošić et al. [2021] Gošić, M., De Pontieu, B., Bellot Rubio, L. R. et al. (2021). Emergence of Internetwork Magnetic Fields through the Solar Atmosphere. \apj, 911(1), 41. doi:10.3847/1538-4357/abe7e0. arXiv:2103.02213.
- Hale [1908] Hale, G. E. (1908). On the Probable Existence of a Magnetic Field in Sun-Spots. \apj, 28, 315. doi:10.1086/141602.
- Hale et al. [1919] Hale, G. E., Ellerman, F., Nicholson, S. B. et al. (1919). The Magnetic Polarity of Sun-Spots. \apj, 49, 153. doi:10.1086/142452.
- Ichimoto et al. [2008] Ichimoto, K., Lites, B., Elmore, D. et al. (2008). Polarization Calibration of the Solar Optical Telescope onboard Hinode. \solphys, 249(2), 233--261. doi:10.1007/s11207-008-9169-9.
- Ichimoto et al. [2007] Ichimoto, K., Shine, R. A., Lites, B. et al. (2007). Fine-Scale Structures of the Evershed Effect Observed by the Solar Optical Telescope aboard Hinode. \pasj, 59, S593. doi:10.1093/pasj/59.sp3.S593.
- Ishikawa et al. [2010] Ishikawa, R., Tsuneta, S., & Jurčák, J. (2010). Three-Dimensional View of Transient Horizontal Magnetic Fields in the Photosphere. \apj, 713(2), 1310--1321. doi:10.1088/0004-637X/713/2/1310. arXiv:1003.1376.
- Joshi et al. [2011] Joshi, J., Pietarila, A., Hirzberger, J. et al. (2011). Convective Nature of Sunspot Penumbral Filaments: Discovery of Downflows in the Deep Photosphere. \apjl, 734(1), L18. doi:10.1088/2041-8205/734/1/L18. arXiv:1105.1877.
- Judge et al. [2015] Judge, P. G., Kleint, L., Uitenbroek, H. et al. (2015). Photon Mean Free Paths, Scattering, and Ever-Increasing Telescope Resolution. \solphys, 290(3), 979--996. doi:10.1007/s11207-014-0643-2. arXiv:1409.7866.
- Jurcák et al. [2007] Jurcák, J., Bellot Rubio, L., Ichimoto, K. et al. (2007). The Analysis of Penumbral Fine Structure Using an Advanced Inversion Technique. \pasj, 59, S601. doi:10.1093/pasj/59.sp3.S601. arXiv:0707.1560.
- Jurčák et al. [2006] Jurčák, J., Martínez Pillet, V., & Sobotka, M. (2006). The magnetic canopy above light bridges. \aap, 453(3), 1079--1088. doi:10.1051/0004-6361:20054471.
- Kleint & Sainz Dalda [2013] Kleint, L., & Sainz Dalda, A. (2013). Unusual Filaments inside the Umbra. \apj, 770(1), 74. doi:10.1088/0004-637X/770/1/74. arXiv:1305.7263.
- Kosugi et al. [2007] Kosugi, T., Matsuzaki, K., Sakao, T. et al. (2007). The Hinode (Solar-B) Mission: An Overview. \solphys, 243(1), 3--17. doi:10.1007/s11207-007-9014-6.
- Landi Degl’Innocenti & Landi Degl’Innocenti [1972] Landi Degl’Innocenti, E., & Landi Degl’Innocenti, M. (1972). Quantum Theory of Line Formation in a Magnetic Field. \solphys, 27, 319. doi:10.1007/BF00153104.
- Lites et al. [2007] Lites, B., Casini, R., Garcia, J. et al. (2007). A suite of community tools for spectro-polarimetric analysis. \memsai, 78, 148.
- Lites et al. [2001] Lites, B. W., Elmore, D. F., & Streander, K. V. (2001). The Solar-B Spectro-Polarimeter. In Sigwarth, M. (Ed.) In M. Sigwarth (Ed.), Advanced Solar Polarimetry – Theory, Observation, and Instrumentation, ASP Conf. Ser. 236 (p. 33).
- Lites & Ichimoto [2013] Lites, B. W., & Ichimoto, K. (2013). The SP_PREP Data Preparation Package for the Hinode Spectro-Polarimeter. \solphys, 283(2), 601--629. doi:10.1007/s11207-012-0205-4.
- Lloyd [1982] Lloyd, S. P. (1982). Least squares quantization in PCM. IEEE Transactions on Information Theory, 28(2), 129--137. doi:0.1109/TIT.1982.1056489.
- Louis [2015] Louis, R. E. (2015). Small-scale magnetic and velocity inhomogeneities in a sunspot light bridge. Advances in Space Research, 56(10), 2305--2311. doi:10.1016/j.asr.2015.09.003. arXiv:1509.00761.
- Louis et al. [2008] Louis, R. E., Bayanna, A. R., Mathew, S. K. et al. (2008). Dynamics of Sunspot Light Bridges as Revealed by High-Resolution Images from Hinode. \solphys, 252(1), 43. doi:10.1007/s11207-008-9247-z.
- Louis et al. [2015] Louis, R. E., Bellot Rubio, L. R., de la Cruz Rodríguez, J. et al. (2015). Small-scale magnetic flux emergence in a sunspot light bridge. \aap, 584, A1. doi:10.1051/0004-6361/201526854. arXiv:1509.00741.
- Louis et al. [2009] Louis, R. E., Bellot Rubio, L. R., Mathew, S. K. et al. (2009). Supersonic Downflows in a Sunspot Light Bridge. \apjl, 704, L29--L33. doi:10.1088/0004-637X/704/1/L29. arXiv:0908.3465.
- Louis et al. [2011] Louis, R. E., Bellot Rubio, L. R., Mathew, S. K. et al. (2011). Supersonic Downflows at the Umbra-Penumbra Boundary of Sunspots. \apj, 727(1), 49. doi:10.1088/0004-637X/727/1/49. arXiv:1010.0519.
- Louis et al. [2021] Louis, R. E., Prasad, A., Beck, C. et al. (2021). Heating of the solar chromosphere in a sunspot light bridge by electric currents. \aap, 652, L4. doi:10.1051/0004-6361/202141456. arXiv:2107.12066.
- Martínez González & Bellot Rubio [2009] Martínez González, M. J., & Bellot Rubio, L. R. (2009). Emergence of Small-scale Magnetic Loops Through the Quiet Solar Atmosphere. \apj, 700(2), 1391--1403. doi:10.1088/0004-637X/700/2/1391. arXiv:0905.2691.
- Martínez González et al. [2007] Martínez González, M. J., Collados, M., Ruiz Cobo, B. et al. (2007). Low-lying magnetic loops in the solar internetwork. \aap, 469(3), L39--L42. doi:10.1051/0004-6361:20077505. arXiv:0705.1319.
- Martínez González et al. [2010] Martínez González, M. J., Manso Sainz, R., Asensio Ramos, A. et al. (2010). Small Magnetic Loops Connecting the Quiet Surface and the Hot Outer Atmosphere of the Sun. \apjl, 714(1), L94--L97. doi:10.1088/2041-8205/714/1/L94. arXiv:1003.1255.
- Mathew et al. [2003] Mathew, S. K., Lagg, A., Solanki, S. K. et al. (2003). Three dimensional structure of a regular sunspot from the inversion of IR Stokes profiles. \aap, 410, 695--710. doi:10.1051/0004-6361:20031282.
- Okamoto et al. [2008] Okamoto, T. J., Tsuneta, S., Lites, B. W. et al. (2008). Emergence of a Helical Flux Rope under an Active Region Prominence. \apjl, 673(2), L215. doi:10.1086/528792. arXiv:0801.1956.
- Okamoto et al. [2009] Okamoto, T. J., Tsuneta, S., Lites, B. W. et al. (2009). Prominence Formation Associated with an Emerging Helical Flux Rope. \apj, 697(1), 913--922. doi:10.1088/0004-637X/697/1/913. arXiv:0904.0007.
- Orozco Suárez et al. [2007a] Orozco Suárez, D., Bellot Rubio, L. R., & del Toro Iniesta, J. C. (2007a). Quiet-Sun Magnetic Fields from Space-borne Observations: Simulating Hinode’s Case. \apjl, 662(1), L31--L34. doi:10.1086/519279. arXiv:0705.0096.
- Orozco Suárez et al. [2007b] Orozco Suárez, D., Bellot Rubio, L. R., del Toro Iniesta, J. C. et al. (2007b). Quiet-Sun Internetwork Magnetic Fields from the Inversion of Hinode Measurements. \apjl, 670(1), L61--L64. doi:10.1086/524139. arXiv:0710.1405.
- Ortiz et al. [2014] Ortiz, A., Bellot Rubio, L. R., Hansteen, V. H. et al. (2014). Emergence of Granular-sized Magnetic Bubbles through the Solar Atmosphere. I. Spectropolarimetric Observations and Simulations. \apj, 781(2), 126. doi:10.1088/0004-637X/781/2/126. arXiv:1312.5735.
- Ortiz et al. [2016] Ortiz, A., Hansteen, V. H., Bellot Rubio, L. R. et al. (2016). Emergence of Granular-sized Magnetic Bubbles Through the Solar Atmosphere. III. The Path to the Transition Region. \apj, 825(2), 93. doi:10.3847/0004-637X/825/2/93. arXiv:1604.00302.
- Press et al. [1986] Press, W. H., Flannery, B. P., Teukolsky, S. A. et al. (1986). Numerical Recipes. Cambridge: Cambridge University Press.
- Rachkovsky [1962] Rachkovsky, D. N. (1962). Magnetic rotation effects in spectral lines. Izv. Krymsk. Astrofiz. Obs., 28, 259--270.
- Rempel et al. [2009] Rempel, M., Schüssler, M., Cameron, R. H. et al. (2009). Penumbral Structure and Outflows in Simulated Sunspots. Science, 325(5937), 171. doi:10.1126/science.1173798. arXiv:0907.2259.
- Rimmele & Marino [2006] Rimmele, T., & Marino, J. (2006). The Evershed Flow: Flow Geometry and Its Temporal Evolution. \apj, 646(1), 593--604. doi:10.1086/504794.
- Ruiz Cobo & Asensio Ramos [2013] Ruiz Cobo, B., & Asensio Ramos, A. (2013). Returning magnetic flux in sunspot penumbrae. \aap, 549, L4. doi:10.1051/0004-6361/201220373. arXiv:1211.6335.
- Ruiz Cobo & del Toro Iniesta [1992] Ruiz Cobo, B., & del Toro Iniesta, J. C. (1992). Inversion of Stokes Profiles. \apj, 398, 375. doi:10.1086/171862.
- Sainz Dalda et al. [2019] Sainz Dalda, A., de la Cruz Rodríguez, J., De Pontieu, B. et al. (2019). Recovering Thermodynamics from Spectral Profiles observed by IRIS: A Machine and Deep Learning Approach. \apjl, 875(2), L18. doi:10.3847/2041-8213/ab15d9. arXiv:1904.08390.
- Sainz Dalda et al. [2012] Sainz Dalda, A., Martínez-Sykora, J., Bellot Rubio, L. et al. (2012). Study of Single-lobed Circular Polarization Profiles in the Quiet Sun. \apj, 748(1), 38. doi:10.1088/0004-637X/748/1/38. arXiv:1202.0593.
- Sánchez Almeida [1997] Sánchez Almeida, J. (1997). Physical Properties of the Solar Magnetic Photosphere under the MISMA Hypothesis. I. Description of the Inversion Procedure. \apj, 491(2), 993--1008. doi:10.1086/304999.
- Sánchez Almeida et al. [2007] Sánchez Almeida, J., Márquez, I., Bonet, J. A. et al. (2007). The Evershed Effect Observed with 0.2’’ Angular Resolution. \apj, 658(2), 1357--1371. doi:10.1086/511254. arXiv:astro-ph/0611523.
- Sankarasubramanian & Rimmele [2002] Sankarasubramanian, K., & Rimmele, T. (2002). Bisector Analysis of Stokes Profiles: Effects Due to Gradients in the Physical Parameters. \apj, 576(2), 1048--1063. doi:10.1086/341885.
- Scharmer et al. [2011] Scharmer, G. B., Henriques, V. M. J., Kiselman, D. et al. (2011). Detection of Convective Downflows in a Sunspot Penumbra. Science, 333(6040), 316. doi:10.1126/science.1206429.
- Schlichenmaier [2009] Schlichenmaier, R. (2009). Sunspots: From Small-Scale Inhomogeneities Towards a Global Theory. \ssr, 144(1-4), 213--228. doi:10.1007/s11214-008-9465-6. arXiv:0811.2747.
- Schlichenmaier & Collados [2002] Schlichenmaier, R., & Collados, M. (2002). Spectropolarimetry in a sunspot penumbra. Spatial dependence of Stokes asymmetries in Fe I 1564.8 nm. \aap, 381, 668--682. doi:10.1051/0004-6361:20011459.
- Schlichenmaier & Schmidt [1999] Schlichenmaier, R., & Schmidt, W. (1999). Vertical mass flux in a sunspot penumbra. \aap, 349, L37--L40.
- Shimizu [2011] Shimizu, T. (2011). Long-term Evolution of Magnetic and Dynamical Properties in A Sunspot Light Bridge. \apj, 738(1), 83. doi:10.1088/0004-637X/738/1/83.
- Skumanich & Lites [1987] Skumanich, A., & Lites, B. W. (1987). Stokes Profile Analysis and Vector Magnetic Fields. I. Inversion of Photospheric Lines. \apj, 322, 473. doi:10.1086/165743.
- Sobotka et al. [1994] Sobotka, M., Bonet, J. A., & Vazquez, M. (1994). A High-Resolution Study of the Structure of Sunspot Light Bridges and Abnormal Granulation. \apj, 426, 404. doi:10.1086/174076.
- Socas-Navarro [2001] Socas-Navarro, H. (2001). Stokes Inversion Techniques: Recent Achievements and Future Horizons. In Sigwarth, M. (Ed.) In M. Sigwarth (Ed.), Advanced Solar Polarimetry – Theory, Observation, and Instrumentation, ASP Conf. Ser. 236 (p. 487).
- Stokes [1852] Stokes, G. G. (1852). On the Change of Refrangibility of Light. Philosophical Transactions of the Royal Society of London Series I, 142, 463--562.
- Thonhofer et al. [2015] Thonhofer, S., Bellot Rubio, L. R., Utz, D. et al. (2015). Parallelization of the SIR code for the investigation of small-scale features in the solar photosphere. In Nagendra, K. N., Bagnulo, S., Centeno, R. et al. (Eds.) In K. N. Nagendra, S. Bagnulo, R. Centeno, & M. Jesús Martínez González (Eds.), Polarimetry, 305 (pp. 251--256). doi:10.1017/S1743921315004858.
- Thorndike [1953] Thorndike, R. L. (1953). Who belongs in the family? Psychometrika 18, 4, 267–276.
- Tsuneta et al. [2008] Tsuneta, S., Ichimoto, K., Katsukawa, Y. et al. (2008). The Solar Optical Telescope for the Hinode Mission: An Overview. \solphys, 249(2), 167--196. doi:10.1007/s11207-008-9174-z. arXiv:0711.1715.
- Unno [1956] Unno, W. (1956). Line Formation of a Normal Zeeman Triplet. \pasj, 8, 108.
- van Noort [2012] van Noort, M. (2012). Spatially coupled inversion of spectro-polarimetric image data. I. Method and first results. \aap, 548, A5. doi:10.1051/0004-6361/201220220. arXiv:1210.4636.
- Viticchié [2012] Viticchié, B. (2012). On the Polarimetric Signature of Emerging Magnetic Loops in the Quiet Sun. \apjl, 747(2), L36. doi:10.1088/2041-8205/747/2/L36. arXiv:1201.6501.
- Viticchié & Sánchez Almeida [2011] Viticchié, B., & Sánchez Almeida, J. (2011). Asymmetries of the Stokes V profiles observed by HINODE SOT/SP in the quiet Sun. \aap, 530, A14. doi:10.1051/0004-6361/201016096. arXiv:1103.1987.
- Westendorp Plaza et al. [1997] Westendorp Plaza, C., del Toro Iniesta, J. C., Ruiz Cobo, B. et al. (1997). Evidence for a downward mass flux in the penumbral region of a sunspot. \nat, 389, 47. doi:10.1038/37933.
- Yadav et al. [2017] Yadav, R., Mathew, S. K., & Tiwary, A. R. (2017). SPIN: An Inversion Code for the Photospheric Spectral Line. \solphys, 292(8), 105. doi:10.1007/s11207-017-1131-2.
- Zeeman [1897] Zeeman, P. (1897). The Effect of Magnetisation on the Nature of Light Emitted by a Substance. \nat, 55(1424), 347. doi:10.1038/055347a0.