1Physical Research Laboratory, Ahmedabad 380009, India.
\affilTwo2IPAC, California Institute of Technology, MS 100-22, Pasadena, CA 91125, USA
\affilThree3Division of Physics, Mathematics, and Astronomy, California Institute of Technology, Pasadena, CA 91125, USA
\affilFour4STAR Institute, University of Liège, Allée du 6 Août 19c, 4000, Liège, Belgium
\affilFive5Physics Department, Auburn University, AL 368332, USA
Long-term spectroscopic monitoring of comet 46P/Wirtanen
Abstract
Jupiter Family Comets (JFCs), having orbital period less than 20 years, provide us with an opportunity to observe their activity and analyse the homogeneity in their coma composition over multiple apparitions. Comet 46P/Wirtanen with its exceptionally close approach to Earth during its 2018 apparition offered the possibility for a long-term spectroscopic observations. We used a 1.2 m telescope equipped with a low-resolution spectrograph to monitor the comet’s activity and compute the relative abundances in the coma, as a function of heliocentric distance. We report the production rates of four molecules CN, C2, C3 and NH2, and Af parameter, a proxy to the dust production, before and after perihelion. We found that 46P has a typical coma composition with almost constant abundance ratios with respect to CN across the epochs of observation. Comparing the coma composition of comet 46P during the current and previous apparitions, we conclude the comet has a highly homogeneous chemical composition in the nucleus with an enhancement in ammonia abundance compared to the average abundance in comets.
keywords:
comets:Individual—46P/Wirtanen—spectroscopy.aravind139@gmail.com
12.3456/s78910-011-012-3 \artcitid#### \volnum000 2023 \pgrange1– \lp1
1 Introduction
Comets are unpredictable Solar system bodies. The dynamical life of a comet is not a mere implication of its expected level of activity. Generally, Long-Period Comets (LPCs) show higher activity than Short Period Comets (SPCs). It is because the surface of the LPCs contains fresh material that has never been exposed or exposed very few times to Solar radiation compared to the processed surfaces of SPCs. In order to understand the overall activity of a comet during its apparition, extensive coverage along its orbit is necessary. This is important for SPCs to track the similarity/dissimilarity of their activities and relative abundance from previous apparitions. This could provide a great deal of information regarding the heterogeneity/homogeneity in the composition of the comet’s nucleus over time.
In this work, we discuss our long-term spectroscopic observations of 46P/Wirtanen (46P hereafter), belonging to the Jupiter Family (Levison & Duncan, 1997). 46P was the original target of the Rosetta mission after which it was changed to 67P/Churyumov–Gerasimenko due to certain delays in the launch (Schulz, 2005). 46P, being a JFC has been observed during its previous apparitions (eg., A’Hearn et al., 1995; Langland-Shula & Smith, 2011; Kidger, 2004; Combi et al., 2020; Lamy et al., 1998; Farnham & Schleicher, 1998; Fink et al., 1998; Schulz et al., 1998). However, the 2018 apparition presented the closest approach of the comet with Earth (0.068 AU) in the last four centuries. This enabled us to probe the very interior of the coma even with seeing limited observations. The comet exhibited significant activity despite a 1.05 AU perihelion distance, and the hyperactivity of the comet was reported by McKay et al. (2021) and Moulane et al. (2023). The exceptional passage of 46P also resulted in the detailed study of the comet in imaging, IR/UV/optical spectroscopy, polarisation etc (eg., Farnham et al., 2021; Noonan et al., 2021; Knight et al., 2021; Bauer et al., 2021; Protopapa et al., 2021; Rosenbush et al., 2021; Roth et al., 2021; Kelley et al., 2021; Zheltobryukhov et al., 2020; Moulane et al., 2023). Among the following sections, section 2 discusses the observation, data reduction, and analysis in detail, section 3 discusses the various computed results, and section 4 summarises the work in brief.
2 Observation and Analysis
The availability of time on a telescope facility and compatible instruments does not guarantee the possibility of long-term coverage of a comet. The orbital parameters and Earth’s orbital position play a major role in determining observability. The apparition of comet 46P in 2018 presented a prospect for long-term coverage in spectroscopy. As part of the long-term coverage, comet 46P was observed for 19 epochs spanning from 2018 October to 2019 February. The optical spectrograph LISA111https://www.shelyak.com/produit/pf0021vis-lisa-slit-vis mounted on the 1.2 m telescope at Mt. Abu was used for all our observations of 46P. The details of the instrument are given by Venkataramani et al. (2016). The instrument provides an effective wavelength range of 3800–7000 Å with a resolving power of 800 and a pixel scale of arcsec/pixel. A long slit, oriented in the North–South direction, 3.8 arcmin in length and 3.6 arcsec in width was used for the observation of both the comet and standard star in all the epochs. During every epoch, the standard star HD 74721 was observed for flux calibration. Tungsten lamp spectra, zero exposure frames and ArNe lamp spectra were obtained for flat fielding, bias subtraction and wavelength calibration respectively. Also, the solar analog star, HD 19445 (G2V), was observed during every epoch in order to remove the continuum from the comet spectrum.
| Heliocentric | Heliocentric | Geocentric | Distance scale | Phase | Exposure | |
| Date | Distance (rH) | velocity () | Distance () | at photo-centre | angle | Time |
| [UT] | [AU] | [km s-1] | [AU] | [Km pixel-1] | [∘] | [seconds] |
| 2018-10-05 | 1.38 | -13.53 | 0.44 | 212 | 25.66 | 3600 |
| 2018-11-21 | 1.09 | -6.07 | 0.16 | 79 | 46.65 | 1800 |
| 2018-11-28 | 1.07 | -4.19 | 0.13 | 62 | 46.03 | 1800 |
| 2018-11-29 | 1.07 | -3.90 | 0.13 | 61 | 45.61 | 1800 |
| 2018-11-30 | 1.07 | -3.62 | 0.12 | 58 | 45.09 | 900 |
| 2018-12-08 | 1.06 | -1.30 | 0.09 | 43 | 36.07 | 1200 |
| 2018-12-09 | 1.06 | -0.96 | 0.09 | 40 | 33.99 | 1200 |
| 2018-12-13 | 1.05 | 0.25 | 0.08 | 38 | 25.42 | 900 |
| 2018-12-14 | 1.06 | 0.55 | 0.08 | 37 | 23.31 | 900 |
| 2018-12-15 | 1.06 | 0.85 | 0.08 | 37 | 21.40 | 1200 |
| 2018-12-27 | 1.07 | 4.36 | 0.10 | 49 | 27.01 | 900 |
| 2018-12-28 | 1.08 | 4.64 | 0.11 | 51 | 28.13 | 900 |
| 2019-01-11 | 1.13 | 8.15 | 0.18 | 86 | 33.41 | 1200 |
| 2019-01-12 | 1.13 | 8.36 | 0.19 | 89 | 33.34 | 1800 |
| 2019-01-13 | 1.14 | 8.58 | 0.19 | 92 | 33.24 | 1800 |
| 2019-01-31 | 1.24 | 11.66 | 0.31 | 149 | 29.20 | 1200 |
| 2019-02-01 | 1.25 | 11.81 | 0.32 | 153 | 28.93 | 1200 |
| 2019-02-02 | 1.26 | 11.94 | 0.33 | 156 | 28.70 | 1200 |
| 2019-02-03 | 1.26 | 12.06 | 0.33 | 160 | 28.48 | 1200 |
| The horizontal line separates the pre and post perihelion epochs with perihelion passage on 2018-12-12. | ||||||
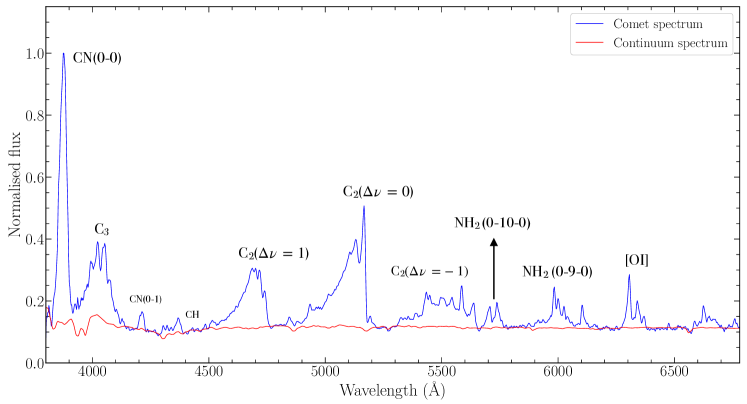
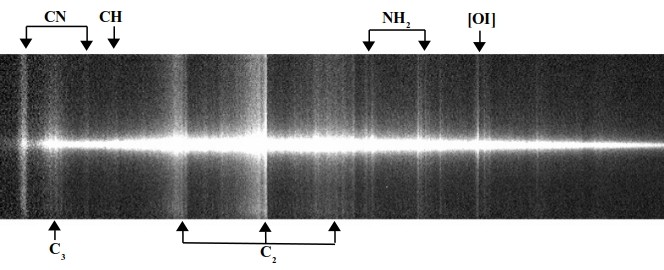
Figure 1 shows the raw 2D spectrum of the comet observed on 2018 December 13, with the detected emissions marked. The comet was observed using precise non-sidereal tracking available in the telescope control system. The NASA JPL HORIZONS222https://ssd.jpl.nasa.gov/horizons.cgi service was used to generate the ephemerides for the comet during all the observation epochs. Since comets are extended objects, a separate sky frame of similar exposure to that of the comet, about 1 degree away from the photocentre, was obtained on all epochs. The brief details of the orbital parameters of the comet at the time of observation are given in Table.1.
The spectrum corresponding to the observations carried out on the 19 distinct epochs was extracted using Python scripts. The spectrum of the standard star observed on the same day is used to establish a reference trace for the instrument’s spectrum. With necessary adjustments, this reference trace is applied to trace the comet’s spectrum along the dispersion axis and thus extract its spectrum along the spatial axis.
The IRAF apall task was employed for extracting the standard star spectrum as it allows for effective sky subtraction using regions on both sides of the target. Since similar narrow slit is used for both the comet and standard star observation, varying seeing conditions could result in the loss of flux from the standard star resulting in an overestimation in the flux of the comet while performing flux calibration. Hence, a slit correction factor, by making use of the Point Spread Function (PSF) along the slit length direction, as explained in Lee & Pak (2006), is introduced in order to cancel out this effect. Proper wavelength calibration and flux calibration were carried out using standard IRAF modules. Finally, prior to extracting the flux associated with each molecular emission and to mitigate the influence of the dust continuum, the underlying dust continuum is to be removed with the help of a solar analog spectrum. In this regard, initially, the calibrated solar analog spectrum is normalised and scaled to the comet continuum flux. A polynomial is fit to both the comet and solar analog spectrum for the continuum windows mentioned in Ivanova et al. (2021). The scaled solar analog star spectrum is multiplied by the ratio of these polynomials (to correct for the redder nature of the cometary dust) in order to obtain a continuum spectrum of the comet. This continuum spectrum is now subtracted from the original comet spectrum to obtain the pure emission spectrum. The final calibrated spectrum of comet 46P for the observation on 2018 December 13, with the different emissions marked and dust continuum overplotted, is as shown in Figure 2.
Strong emissions from CN, Å) and were observed on all epochs while emissions from NH2 became evident as the comet approached perihelion. Observations of the comet with the long slit in LISA were utilised to study the spatial variation in column density of various molecules (CN, C2, C3 and NH2) in order to compute the evolution of their production rates as a function of heliocentric distance. Out of the different NH2 bands, the NH2 (0-10-0) (see Figure 2) was chosen due to its minimal blending with different C2 bands. The production rate Q, in molecules per second, for each molecule, is estimated using Haser model (Haser, 1957), where minimum chi-square estimation between the observed column density and the theoretical column density computed using the equation mentioned in Langland-Shula & Smith (2011) is employed. While the Haser model is usually fitted for nucleocentric distances beyond 10,000 km, due to the close approach of 46P, the Haser model has been fitted for nucleocentric distances varying between 2000-10000 km. The uncertainties in the production rate is estimated to be the systematic error computed from the minimum chi-square fitting. The further details regarding the method used to the observed column density profile to compute the production rates has been detailed in Aravind et al. (2022) and Langland-Shula & Smith (2011).
The fluorescence efficiency (g, ergs/molecule/second) at 1 AU for the molecules and have been taken from A’Hearn et al. (1995). Even though a set of revised fluorescence efficiency for the NH2 emission bands have been reported in Kawakita & Watanabe (2002), we have adopted the fluorescence efficiency for the (0-10-0) band to be half of the value reported in Tegler & Wyckoff (1989), similar to what has been used in Fink et al. (1998) for the 1997 apparition of comet 46P and also in comet surveys reported by Fink Uwe & Hicks (1996) and Fink (2009). Fluorescence efficiency for all molecules was scaled to to determine the values at the corresponding heliocentric distance (). Meanwhile, Schleicher (2010) have tabulated the g-factor of CN for different heliocentric distances and velocities. A double interpolation was performed on the provided table to obtain the exact g values for the heliocentric distance and velocity at the time of observation. The scale lengths of the parent (lp) and daughter (ld) molecules for CN, C2 and C3 were taken from A’Hearn et al. (1995), while those for NH2 were taken from Cochran et al. (2012) and were scaled to .
A’Hearn et al. (1984) defined a parameter Af as a proxy to the dust production present in the comet. Hence, the characteristic Af profile of the comet in Blue Continuum (BC) and Green Continuum (GC) narrow band filters (Farnham et al., 2000) for various epochs can be used to study the variation in dust emission. In order to obtain the cometary flux within the band pass of the narrow band filters, the spectrum of the comet corresponding to each aperture is initially convolved with the transmission profile of the filter re-sampled to match the resolution of the instrument, which is later used to compute the magnitude and hence the Af. The computed Af is further corrected with a phase function S()333Composite Dust Phase Function for Comets: https://asteroid.lowell.edu/comet/dustphaseHM_table.txt, corresponding to the phase angle () at the time of observation, as defined in Schleicher & Bair (2011). This method to compute the phase angle corrected A(0)f in different narrow band filter bandwidths from spectroscopic observation has been further detailed in Aravind et al. (2022). The results obtained from these analyses for the comet 46P is discussed in the following section.
3 Discussion
| Date | rH | Log of the Production Rate (molecules per sec) | log[A(0)f] (cm) | |||||
| (UT) | (AU) | (AU) | CN | C2() | C3 | NH2 | BC | GC |
| 2018-10-05 | 1.38 | 0.44 | 24.54(0.06) | 24.62(0.08) | 23.56(0.24) | – | 1.75(0.32) | 1.72(0.36) |
| 2018-11-21 | 1.09 | 0.16 | 25.06(0.05) | 25.13(0.06) | 24.16(0.19) | – | 2.06(0.08) | 2.08(0.09) |
| 2018-11-28 | 1.07 | 0.13 | 25.22(0.03) | 25.24(0.02) | 24.37(0.07) | 25.47(0.04) | 2.21(0.08) | 2.18(0.10) |
| 2018-11-29 | 1.07 | 0.13 | 25.24(0.03) | 25.25(0.02) | 24.37(0.10) | 25.50(0.04) | 2.21(0.06) | 2.16(0.06) |
| 2018-11-30 | 1.07 | 0.12 | 25.22(0.03) | 25.22(0.02) | 24.36(0.01) | 25.53(0.04) | 2.22(0.07) | 2.17(0.10) |
| 2018-12-08 | 1.06 | 0.09 | 25.02(0.05) | 25.15(0.03) | 24.25(0.07) | 25.49(0.04) | 2.24(0.04) | 2.21(0.05) |
| 2018-12-09 | 1.06 | 0.09 | 25.06(0.04) | 25.16(0.02) | 24.25(0.07) | 25.50(0.03) | 2.20(0.02) | 2.25(0.02) |
| 2018-12-13 | 1.05 | 0.08 | 25.20(0.03) | 25.26(0.02) | 24.36(0.07) | 25.53(0.03) | 2.32(0.03) | 2.37(0.03) |
| 2018-12-14 | 1.06 | 0.08 | 25.20(0.03) | 25.27(0.02) | 24.48(0.06) | 25.60(0.03) | 2.31(0.03) | 2.36(0.02) |
| 2018-12-15 | 1.06 | 0.08 | 25.15(0.03) | 25.21(0.02) | 24.36(0.07) | 25.49(0.03) | 2.19(0.02) | 2.24(0.02) |
| 2018-12-27 | 1.07 | 0.10 | 25.19(0.04) | 25.19(0.04) | 24.40(0.07) | 25.42(0.03) | 2.15(0.04) | 2.23(0.04) |
| 2018-12-28 | 1.08 | 0.11 | 25.20(0.04) | 25.22(0.04) | 24.29(0.08) | 25.49(0.03) | 2.22(0.05) | 2.27(0.04) |
| 2019-01-11 | 1.13 | 0.18 | 24.90(0.05) | 25.06(0.03) | 23.97(0.08) | 25.22(0.03) | 1.95(0.13) | 2.03(0.12) |
| 2019-01-12 | 1.13 | 0.19 | 24.91(0.05) | 25.08(0.03) | 24.04(0.07) | 25.24(0.02) | 1.93(0.07) | 2.06(0.03) |
| 2019-01-13 | 1.14 | 0.19 | 24.95(0.05) | 25.04(0.04) | 24.07(0.08) | 25.25(0.03) | 1.98(0.09) | 2.09(0.07) |
| 2019-01-31 | 1.24 | 0.31 | 24.86(0.10) | 24.94(0.08) | 23.99(0.08) | 25.26(0.04) | 1.82(0.14) | 1.97(0.11) |
| 2019-02-01 | 1.25 | 0.32 | 24.88(0.11) | 24.94(0.11) | 23.94(0.09) | 25.25(0.05) | 1.85(0.34) | 1.97(0.32) |
| 2019-02-02 | 1.26 | 0.33 | 24.94(0.11) | 25.01(0.10) | 23.97(0.11) | 25.18(0.07) | 1.85(0.40) | 1.98(0.32) |
| 2019-02-03 | 1.26 | 0.33 | 24.81(0.13) | 24.82(0.12) | 23.97(0.12) | 25.22(0.05) | 1.75(0.21) | 1.81(0.16) |
| Values in the parenthesis represent the corresponding errors. | ||||||||
| The horizontal line separates the pre and post perihelion epochs with perihelion passage on 2018-12-12. | ||||||||
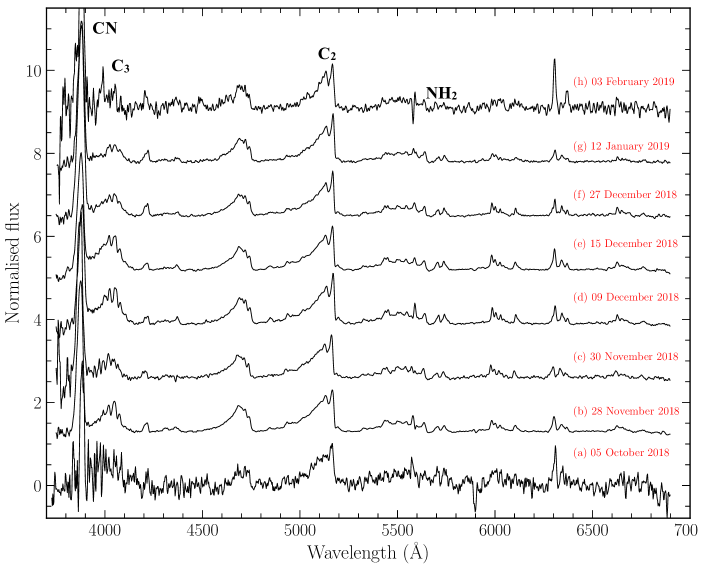
The latest apparition of 46P in 2018 presented a great opportunity to monitor various molecular emissions as the comet crossed perihelion. As the comet was approaching perihelion, the activity increased significantly resulting in the appearance of a large number of emission lines in the optical spectrum (see Figure 3). Detailed analysis of the evolution of individual emission lines can be performed to understand the comet composition in depth, which is beyond the scope of this work. The major emissions detected in the comet were the different bands of CN, C2, C3 and NH2.
As mentioned in A’Hearn et al. (1995), even though the production rate ratios or dust-to-gas ratio of a comet is not expected to vary significantly for minimal change in heliocentric distance, certain comets do exhibit such changes pointing to a possible heterogeneity in the composition of the comet’s nucleus (eg., Aravind et al., 2021). Hence, extensive coverage of a comet along its orbit provides enough details to understand its basic compositional characteristics. Comparison of its activity and relative abundances of various molecules with previous apparitions also helps us confirm the homogeneity/heterogeneity of the nucleus composition (eg., Schleicher, 2022). The close geocentric approach of the comet during the current apparition implies that we are always looking at the innermost part of the coma where there can be drastic changes in activity due to the presence of jets or outbursts (Farnham et al., 2021; Kelley et al., 2021). In such a scenario, imaging analysis would have an advantage over long-slit spectroscopy in investigating the outbursts and general production rate characteristics of the comet. The reason is imaging analysis would consider the emission arising from the total disk rather than a particular spatial axis, as in the case of long slit spectroscopy. Due to this disadvantage in spectroscopy, the presence of any localised jet or outburst varying from day to day at the location of the slit can affect the column density of the molecules and hence the computed production rates. This can be avoided to a larger extent by computing the column densities from the average flux obtained from both sides of the photocentre. However, while imaging is restricted to analysing only the emissions corresponding to the various filters available, spectroscopy is always advantageous in having a complete analysis of the different emissions occurring in the optical regime. Making use of this advantage, the NH2 (0-10-0) emission band, which is not very well studied due to the absence of an NH2 filter (NH narrow band filter is available as defined in Farnham et al. (2000)), has been analysed for the comet 46P. Analysing NH2 abundance, the major daughter product of NH3 (Shinnaka et al., 2016b, a; Tegler & Wyckoff, 1989), is a shortcut to extract information on the ammonia abundance in the comet’s nucleus.
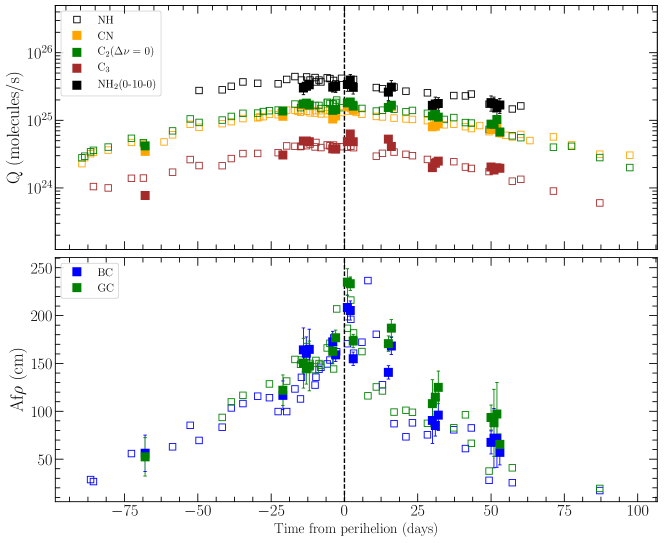
While Knight et al. (2021) and Moulane et al. (2023) have reported the extensive coverage of comet 46P through photometric observations, we report the computed production rates of CN, C2, C3, NH2, production rate ratios with respect to CN and the phase angle corrected A(0)f for two different continuum bands through long term spectroscopic observations. The upper panel of Figure 4 illustrates the variation in production rate of CN, C2(), C3, and NH2 (0-10-0) across perihelion (see Table 2 for corresponding values) along with a comparison with the production rates reported in Moulane et al. (2023). It is seen that there is a gradual increase in the production rate of all four molecules as the comet approaches perihelion, after which it begins to drop. We note that the observed trend in the production rates of CN, C2 and C3 reported in this work are similar to those reported in Moulane et al. (2023) with slight variations at certain epochs. At the same time, Kelley et al. (2021) and Farnham et al. (2021) have reported multiple outbursts and a strong presence of CN jets as the comet approached perihelion. While Moulane et al. (2023) report the rotation period of the nucleus to be around 9 hours, they also mention that the CN jets do not rotate with time. As previously mentioned, the comet’s unprecedented close approach led us to investigate the activity in the innermost coma, where the photochemistry is likely highly complex, particularly due to the presence of strong jets and inner coma activity influenced by outbursts. Such combined effects could strongly affect the flux measured within the slit as the comet approached perihelion, causing the computed production rates to be slightly different than those obtained using photometry.
Even though there are reports of various outbursts and rapid variation of outgassing in the inner coma close to perihelion (Roth et al., 2021), the activity for the molecules corresponding to these dates reported in this work and Moulane et al. (2023), confirms that the outburst has not significantly affected the observed trends in the production rates or rate ratios. It can be seen from the left upper panel of Figure 5 that the production rate ratio, Q(C2)/Q(CN), is nearly constant across the observational epochs with a very good agreement to the trend reported in Moulane et al. (2023), even though there was a slight difference in the production rates computed close to the perihelion. The computed abundance ratio, Q(C2)/Q(CN), classifies the comet to be of typical carbon composition, as defined in A’Hearn et al. (1995), similar to what has been reported in Knight et al. (2021). In the same way, the abundance ratio Q(C3)/Q(CN) (lower left panel in Figure 5) also lies in the region of comets with typical carbon composition, again with very good agreement to the ratio reported in Moulane et al. (2023).
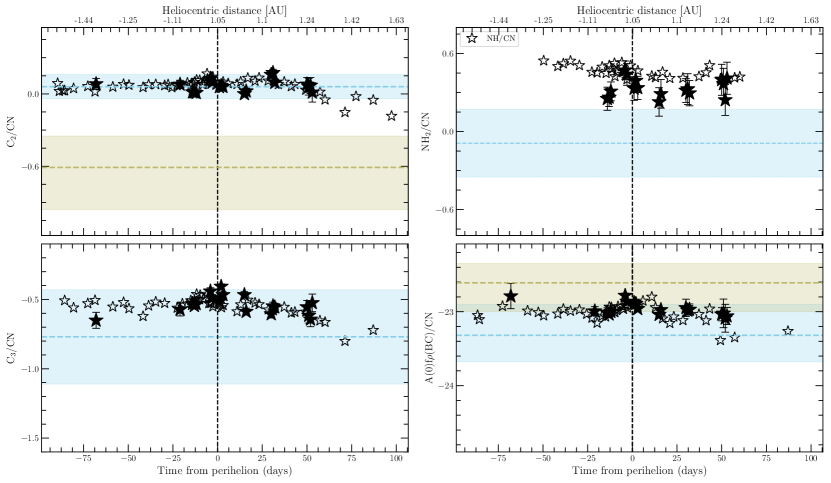
Interestingly, even though it has been widely stated that NH3 dissociates into NH2, which further dissociates into NH (eg., Cochran et al., 2012; Langland-Shula & Smith, 2011; Tegler et al., 1992; Wyckoff et al., 1988; Moulane et al., 2023), in the case of comet 46P, the computed production rates of both NH2 and NH are seen to be almost similar across perihelion (see Figure 4). Looking at the abundance ratios, comet 46P is seen to have an enhanced NH2 composition with respect to CN (in comparison to comets reported in Fink (2009) and Cochran et al. (2012)), which is also the same case with NH reported in Knight et al. (2021) and Moulane et al. (2023) (see upper right panel of Figure 5). In addition, NH2 being the direct daughter product of NH3 with maximum yield (Shinnaka et al., 2016a, b; Tegler & Wyckoff, 1989) implies that the coma of 46P has an enhanced composition in ammonia. It is also worth noting that Slanger & Black (1982), Krasnopolsky & Tkachuk (1991), and Rettig et al. (1992) had put forward a possibility of NH3 being a parent source of both NH2 and NH. Such a scenario would create differences in the observed trends of Q(NH2)/Q(CN) and Q(NH)/Q(CN). In support of this, even though the production rate ratio of other molecules with respect to CN reported in this work and Moulane et al. (2023) are highly comparable, the ratio Q(NH)/Q(CN) displays a higher abundance in comparison to the ratio Q(NH2)/Q(CN) pointing at a possibility of NH having parental species additional to NH2. Keeping in mind that these trends cannot be confirmed with the observation of only one comet and that these trends could be influenced by the adopted scale lengths and fluorescence efficiencies for NH and NH2, the possibility of both NH3 and NH2 being a parent source of NH cannot be ruled out.
The general dust activity in the comet along the orbit, inspected by analysing the variation in the A(0)f characteristic profile (radial profile of Af computed for increasing aperture size), corrected for phase angle, in the narrow band BC and GC filters, reveals a peak in the dust activity just one day after perihelion at a heliocentric distance of 1.05 AU, after which it drops significantly (see lower panel in Figure 4), similar to the dust activity reported by Knight et al. (2021), Rosenbush et al. (2021), and Moulane et al. (2023). Again, it can be seen that despite the general trend in A(0)f computed for both BC and GC filter bands (as given in Table 2) being in good agreement to those reported in Moulane et al. (2023), they are slightly on the higher side during certain epochs. As discussed before, this could be a direct effect of the activity in the slit being considered the activity in the entire coma. At the same time, the dust-to-gas ratio is not varying significantly for the observed range of heliocentric distance (see Figure 5) and is in very good agreement with the values reported in Moulane et al. (2023) (see lower right panel in Figure 5). In addition, the dust-to-gas ratio, (Af)/Q(CN), of comet 46P is observed to be normal (as defined by A’Hearn et al. (1995)), pointing to a gas-rich coma.
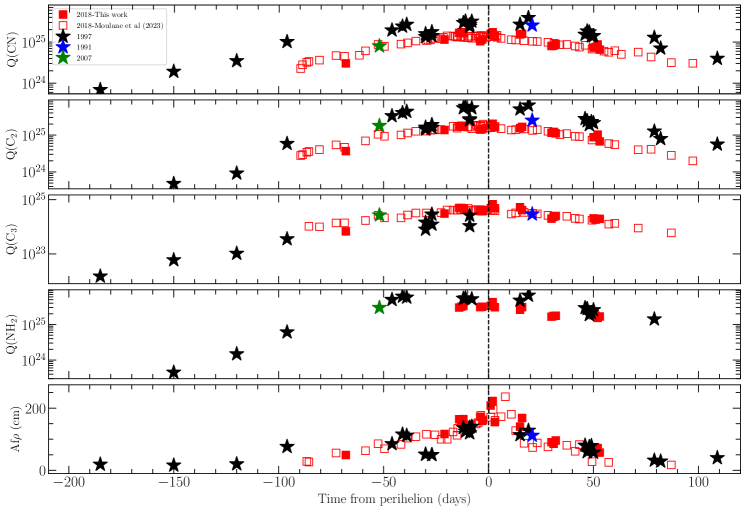
46P, being a short-period comet, has been observed via photometry and spectroscopy in its previous apparitions. In each of the previous apparitions, 1991, 1997, and 2007, where the comet was observed, 46P was reported to have a typical carbon-chain composition with a normal dust-to-gas ratio (A’Hearn et al., 1995; Farnham & Schleicher, 1998; Fink et al., 1998; Schulz et al., 1998; Lamy et al., 1998; Jockers et al., 1998; Kidger, 2004; Langland-Shula & Smith, 2011). Figure 6 displays the comparison of gas and dust activity reported in this work to those reported for the previous apparitions of the comet. Comparing the 2018 apparition with the comet’s 1997 apparition, covered extensively by Farnham & Schleicher (1998), Fink et al. (1998) and Schulz et al. (1998), it is clearly seen that the outgassing has not changed significantly even after four apparitions. Reports by Fink et al. (1998) during 46P’s 1997 apparition also indicate a higher NH2 abundance relative to CN, consistent with the findings in this study.
As mentioned in Moulane et al. (2023), the observed abundance for different molecules for the latest apparition is also seen to be in good agreement with those reported for previous apparitions in 1991 (Farnham & Schleicher, 1998; A’Hearn et al., 1995), 1997 (Farnham & Schleicher, 1998; Fink et al., 1998; Schulz et al., 1998) and 2007 (Langland-Shula & Smith, 2011). Even with 46P having had a hyperactivity during its historic close flyby with Earth in this apparition, the similarity of coma composition with the previous apparitions implies a highly homogenous composition of the comet’s nucleus. Additionally, the effects of domination by localised activity in the inner coma can be significant during such a close approach. Hence, further analysing the spectra of each individual epoch can reveal a great amount of detail regarding the variation in individual major and minor emissions from epoch to epoch during its hyperactivity.
4 Summary and Conclusion
In this work, we present the extensive spectroscopic observations of comet 46P/Wirtanen during its remarkable 2018 apparition, marked by an exceptionally close approach to Earth. The wide coverage in observational epochs helped us analyse the comet’s activity as it went around the Sun. Using the observations from the low-resolution optical spectrograph, LISA, we derived multiple parameters that characterize the comet’s activity and composition, including production rates, production rate ratios, A(0)f, and the dust-to-gas ratio. Spectroscopy also facilitated the study of production rates of the NH2 emission, a direct product of ammonia in the comet, which has lately not been very well studied due to the absence of dedicated filters. It has been observed that the production rates are more or less symmetric across perihelion while there is a clear asymmetry in the A(0)f. The different abundance ratios classify the comet as a typical carbon-chain composition with a normal dust-to-gas ratio and slightly enhanced ammonia abundance.
The similarity of the reported coma composition of 46P in the current apparition to those in the previous apparitions, including the enhanced ammonia abundance, points to the comet’s nucleus having a highly homogenous composition. Further dedicated studies focusing on the trends in the production of NH2 and NH are required to understand better the parent sources responsible for these emissions.
In conclusion, the primary motive of this work, to analyse the general trend in the comet’s activity as it crossed perihelion, helps us visualise the consistency of out-gassing in the comet across different apparitions. This study additionally furnishes evidence supporting the credibility of spectroscopic observations in analysing comets’ activity trends. The results demonstrate a high level of agreement with photometric observations, even in the case of Comet 46P, which had an unprecedented close approach and exhibited hyperactivity.
In addition, taking into account that the minor species not discussed in this paper are also very significantly detected during many epochs of observations, the spectrum corresponding to each epoch can be further utilised along with fluorescence models to analyse the variation in these emissions (major and minor) from one epoch to another to understand better the photo-chemistry occurring in the coma of the comet 46P at different heliocentric distances. This collective knowledge can be effective in planning observations for the further detailed study of comet 46P during its future apparitions.
Acknowledgements
We acknowledge the local staff at the Mount Abu Observatory for their help that made these observations possible. Work at the Physical Research Laboratory is supported by the Department of Space, Govt. of India.
Emmanuel Jehin is a FNRS Senior Research Associate. TRAPPIST is a project funded by the Belgian Fonds (National) de la Recherche Scientifique (F.R.S.-FNRS) under grant T.0120.21.
This work is a result of the bilateral Belgo-Indian projects on Precision Astronomical Spectroscopy for Stellar and Solar system bodies, BIPASS, funded by the Belgian Federal Science Policy Office (BELSPO, Govt. of Belgium; BL/33/IN22_BIPASS) and the International Division, Department of Science and Technology, (DST, Govt. of India; DST/INT/BELG/P-01/2021 (G)).
References
- A’Hearn et al. (1995) A’Hearn, M. F., Millis, R. C., Schleicher, D. O., Osip, D. J., & Birch, P. V. 1995, Icarus, 118, 223
- A’Hearn et al. (1984) A’Hearn, M. F., Schleicher, D. G., Millis, R. L., Feldman, P. D., & Thompson, D. T. 1984, AJ, 89, 579
- Aravind et al. (2021) Aravind, K., Ganesh, S., Venkataramani, K., et al. 2021, MNRAS , 502, 3491
- Aravind et al. (2022) Aravind, K., Halder, P., Ganesh, S., et al. 2022, Icarus, 383, 115042
- Bauer et al. (2021) Bauer, J. M., Gicquel, A., Kramer, E., & Meech, K. J. 2021, PSJ, 2, 34
- Cochran et al. (2012) Cochran, A. L., Barker, E. S., & Gray, C. L. 2012, Icarus , 218, 144
- Combi et al. (2020) Combi, M. R., Mäkinen, T., Bertaux, J. L., et al. 2020, PSJ, 1, 72
- Farnham et al. (2021) Farnham, T. L., Knight, M. M., Schleicher, D. G., et al. 2021, PSJ, 2, 7
- Farnham & Schleicher (1998) Farnham, T. L. & Schleicher, D. G. 1998, A&A , 335, L50
- Farnham et al. (2000) Farnham, T. L., Schleicher, D. G., & A’Hearn, M. F. 2000, Icarus , 147, 180
- Fink (2009) Fink, U. 2009, Icarus , 201, 311
- Fink et al. (1998) Fink, U., Hicks, M. D., Fevig, R. A., & Collins, J. 1998, A&A , 335, L37
- Fink Uwe & Hicks (1996) Fink Uwe & Hicks, M. D. 1996, ApJ, 459, 729
- Haser (1957) Haser, L. 1957, Bulletin de la Societe Royale des Sciences de Liege, 43, 740
- Ivanova et al. (2021) Ivanova, O., Luk’yanyk, I., Tomko, D., & Moiseev, A. 2021, MNRAS , 507, 5376
- Jockers et al. (1998) Jockers, K., Credner, T., & Bonev, T. 1998, A&A , 335, L56
- Kawakita & Watanabe (2002) Kawakita, H. & Watanabe, J.-i. 2002, ApJ , 572, L177
- Kelley et al. (2021) Kelley, M. S. P., Farnham, T. L., Li, J.-Y., et al. 2021, PSJ, 2, 131
- Kidger (2004) Kidger, M. R. 2004, A&A , 420, 389
- Knight et al. (2021) Knight, M. M., Schleicher, D. G., & Farnham, T. L. 2021, PSJ, 2, 104
- Krasnopolsky & Tkachuk (1991) Krasnopolsky, V. A. & Tkachuk, A. Y. 1991, AJ, 101, 1915
- Lamy et al. (1998) Lamy, P. L., Toth, I., Jorda, L., Weaver, H. A., & A’Hearn, M. 1998, A&A , 335, L25
- Langland-Shula & Smith (2011) Langland-Shula, L. E. & Smith, G. H. 2011, Icarus , 213, 280
- Lee & Pak (2006) Lee, S. & Pak, S. 2006, Journal of Korean Astronomical Society, 39, 151
- Levison & Duncan (1997) Levison, H. F. & Duncan, M. J. 1997, Icarus , 127, 13
- McKay et al. (2021) McKay, A. J., DiSanti, M. A., Cochran, A. L., et al. 2021, PSJ, 2, 21
- Moulane et al. (2023) Moulane, Y., Jehin, E., Manfroid, J., et al. 2023, A&A , 670, A159
- Noonan et al. (2021) Noonan, J. W., Harris, W. M., Bromley, S., et al. 2021, PSJ, 2, 8
- Protopapa et al. (2021) Protopapa, S., Kelley, M. S. P., Woodward, C. E., & Yang, B. 2021, PSJ, 2, 176
- Rettig et al. (1992) Rettig, T. W., Tegler, S. C., Wyckoff, S., et al. 1992, in Asteroids, Comets, Meteors 1991, ed. A. W. Harris & E. Bowell, 505
- Rosenbush et al. (2021) Rosenbush, V., Kiselev, N., Husárik, M., et al. 2021, MNRAS , 503, 4297
- Roth et al. (2021) Roth, N. X., Milam, S. N., Cordiner, M. A., et al. 2021, PSJ, 2, 55
- Schleicher (2010) Schleicher, D. G. 2010, AJ, 140, 973
- Schleicher (2022) —. 2022, PSJ, 3, 143
- Schleicher & Bair (2011) Schleicher, D. G. & Bair, A. N. 2011, AJ, 141, 177
- Schulz (2005) Schulz, R. 2005, Highlights of Astronomy, 13, 743
- Schulz et al. (1998) Schulz, R., Arpigny, C., Manfroid, J., et al. 1998, A&A , 335, L46
- Shinnaka et al. (2016a) Shinnaka, Y., Kawakita, H., Jehin, E., et al. 2016a, MNRAS , 462, S124
- Shinnaka et al. (2016b) —. 2016b, MNRAS , 462, S195
- Slanger & Black (1982) Slanger, T. G. & Black, G. 1982, J. Chem. Phys., 77, 2432
- Tegler & Wyckoff (1989) Tegler, S. & Wyckoff, S. 1989, ApJ, 343, 445
- Tegler et al. (1992) Tegler, S. C., Burke, L. F., Wyckoff, S., et al. 1992, ApJ, 384, 292
- Venkataramani et al. (2016) Venkataramani, K., Ghetiya, S., Ganesh, S., et al. 2016, MNRAS , 463, 2137
- Wyckoff et al. (1988) Wyckoff, S., Tegler, S., Wehinger, P. A., Spinrad, H., & Belton, M. J. S. 1988, ApJ, 325, 927
- Zheltobryukhov et al. (2020) Zheltobryukhov, M., Zubko, E., Chornaya, E., et al. 2020, MNRAS , 498, 1814