Absorption of Millimeter-band CO and CN in the Early Universe: Molecular Clouds in Radio Galaxy B2 0902+34 at Redshift 3.4
Abstract
Using the Karl G. Jansky Very Large Array (VLA), we have detected absorption lines due to carbon-monoxide, CO(=01), and the cyano radical, CN(=01), associated with radio galaxy B2 0902+34 at redshift = 3.4. The detection of millimeter-band absorption observed 1.5 Gyr after the Big Bang facilitates studying molecular clouds down to gas masses inaccessible to emission-line observations. The CO absorption in B2 0902+34 has a peak optical depth of 8.6 and consists of two components, one of which has the same redshift as previously detected 21-cm absorption of neutral hydrogen (H I) gas. Each CO component traces an integrated H2 column density of 3 1020 cm-2. CN absorption is detected for both CO components, as well as for a blueshifted component not detected in CO, with CO/CN line ratios ranging from 0.4 to 2.4. We discuss the scenario that the absorption components originate from collections of small and dense molecular clouds that are embedded in a region with more diffuse gas and high turbulence, possibly within the influence of the central Active Galactic Nucleus or starburst region. The degree of reddening in B2 0902+34, with a rest-frame color 4.2, is lower than the very red colors ( 6) found among other known redshifted CO absorption systems at 1. Nevertheless, when including also the many non-detections from the literature, a potential correlation between the absorption-line strength and color is evident, giving weight to the argument that the red colors of CO absorbers are due to a high dust content.
1 Introduction
Radio synchrotron jets emanating from active black holes are sources of bright continuum emission, which can act as background candles that facilitate the search for spectral lines in absorption at cm and mm wavelengths. As a result, radio absorption lines have provided a diagnostic for studing neutral and molecular gas clouds along our line-of-sight towards radio sources (see reviews by Combes 2008 and Morganti & Oosterloo 2018).
Studies of molecular absorbers at low and intermediate redshifts provided insight into the raw materials that fuels early star formation and active galactic nuclear (AGN) activity (e.g., Gerin et al., 1997; Wiklind & Combes, 1999; Wiklind et al., 2018; Allison et al., 2019; Maccagni et al., 2018; Combes et al., 2019; Rose et al., 2019, 2023; Morganti et al., 2023). In addition, they have been used to study extra-galactic chemistry (e.g., Combes & Wiklind, 1997; Muller et al., 2011, 2014), time-variability in the background radio source (e.g., Muller et al., 2023), the temperature of the Cosmic Microwave Background (e.g., Muller et al., 2013; Riechers et al., 2022), and potential space-time variations of fundamental constants (e.g., Carilli et al., 2000; Curran et al., 2011a; Muller et al., 2021). When extended to higher redshifts, such studies could provide critical new insights into physical processes that govern cosmology and galaxy evolution in the Early Universe. Moreover, the strength of the absorption signal scales with the flux of the background radio continuum, and not directly with luminosity distance. This means that absorption lines have the potential to trace molecular clouds in the Early Universe down to gas masses that cannot be detected with emission-line observations, considering that even the most detailed high- emission-line studies only resolve molecular clumps containing millions to billions of solar masses of cold gas (see, e.g., Hodge et al., 2012; Dessauges-Zavadsky et al., 2023).
To date, molecular hydrogen absorption has been detected in over 30 damped Ly systems at high redshifts (e.g., Levshakov & Varshalovich, 1985; Balashev et al., 2014; Noterdaeme et al., 2015; Ranjan et al., 2018; Balashev & Noterdaeme, 2018). However, in the millimeter regime, when it comes to lines-of-sight against discrete and typically strong background continuum sources, redshifted molecular absorption is rare: until now, CO had only been detected along six sight-lines at , all of which were at (Wiklind & Combes, 1995, 1996b, 1997, 1998; Wiklind et al., 2018; Allison et al., 2019).111Apart from this, the highest redshift detection is absorption by H2O at against the CMB background with the Atacama Large Millimeter/submillimeter Array (ALMA, Riechers et al. 2022). This is despite extensive millimeter-band searches, both targeted (Wiklind & Combes, 1995, 1996a; Drinkwater et al., 1996; Murphy et al., 2003; Curran et al., 2008; Curran et al., 2011b) and untargeted (Kanekar et al., 2014; Klitsch et al., 2019).222The work by Klitsch et al. (2019) is based on ALMA calibration data from Oteo et al. (2016). A new study by Combes & Gupta (2024) reports the detection of three new CO absorbers, two at and one at .333Combes & Gupta (2024) also report the detection of an HNC absorber at . The latter is an intervening absorber tentatively detected at , near the redshift of H I absorption detected by Kanekar et al. (2007).
Here we present the detection of molecular absorption associated with the high-redshift radio galaxy B2 0902+34 at = 3.396. B2 0902+34 was one of the first galaxies discovered in the Early Universe, thanks to its bright radio continuum, which served as a beacon for tracing the faint host galaxy (Lilly, 1988; Eisenhardt & Dickinson, 1992). It was suggested that this is a proto-galaxy undergoing its first episode of star formation (Eales et al., 1993; Pentericci et al., 1999). X-ray observations revealed that it contains a heavily obscured AGN (Fabian et al., 2002). Carilli (1995) described the radio/optical structure of this galaxy as “bizarre”, with a bright northern radio lobe that shows a sharp (90∘) bend and a flat-spectrum radio core located in a “valley” between two optical peaks. Recent 144 MHz imaging of the radio source with the Low Frequency Array (LOFAR) suggests that the complex radio structure is either the result of different episodes of AGN activity, or, more likely, due to interactions between the radio source and the surrounding halo gas (Cordun et al., 2023). B2 0902+34 is surrounded by a rich circumgalactic medium (CGM) in the form of a giant Ly nebula (Reuland et al., 2003), and is thought to be a collapsing protogiant elliptical (Adams et al., 2009). Searches for molecular gas using CO(4-3) emission were done only using single-dish telescopes, which set limits of M 5 1010 M⊙ (Evans et al., 1996; van Ojik et al., 1997). B2 0902+34 is exceptional in that it is one of the very few 2 radio sources that has been observed to have an associated H I absorption line (Curran et al. 2008; see also Uson et al. 1991, Briggs et al. 1993, Cody & Braun 2003, and Chandra et al. 2004). Here we show that B2 0902+34 also has molecular absorption lines corresponding to carbon monoxide, CO(=01), and the cyano radical, CN(=01). At = 3.396, it is the highest redshift CO absorber known to date.
Throughout this paper, we assume the following cosmological parameters: H0 = 71 km s-1 Mpc-1, = 0.27, and = 0.73 (Wright, 2006). The corresponding angular scale is 7.3′′ per arcsec.
2 Data
The observations of B2 0902+34 were performed with NSF’s Karl G. Jansky Very Large Array (VLA) in D-configuration under project 21A-059 during 21 March 8 May 2021. The total on-source time was 18.7 hours. We used a continuous bandwidth coverage of 1 GHz, consisting of 16 overlapping sub-bands of 128 MHz with 1 MHz channels, centred around the redshifted CO(=01) line at 26.2 GHz ( = 115.2712 GHz). We observed the primary calibrator source J09027+3902 located at 6.5∘ distance from B2 0902+34 every 5 min to calibrate the complex gains and bandpass. 3C 286 and 3C 147 were used for absolute flux calibration.
The data were processed using the Common Astronomy Software Applications (CASA; CASA Team et al. 2022), using version 6.4.3-27 during the calibration and 6.5.2-26 for the imaging. After a standard manual calibration, we self-calibrated the data using the unresolved radio continuum source of B2 0902+34 to further correct the complex gains. We then imaged the radio continuum using the line-free channels and applying a natural weighting scheme, which resulted in a synthesized beam of 3.9′′ 3.5′′ (PA -12.1∘). We also performed a deconvolution to clean the signal of the radio continuum. The radio continuum is unresolved and peaks at 22.1 1.1 mJy beam-1.
For the line data, artifacts appeared at the level of a few per cent, which is smaller than the assumed 5 uncertainty in the flux calibration of the VLA data. These artifacts are likely related to small variations in the point-spread function (PSF) across the large fractional bandwidth of the data or inaccuracies in the relative calibration between the 16 sub-bands, combined with the limited spectral dynamic range reached by our observations (1 in a few 100). These artifacts scale with the brightness of the continuum emission. As a result, they become noticeable against the peak of the radio continuum as small (mJy-level) amplitude ‘jumps’ along the bandpass. To mitigate this effect to a level that it does not affect the line data, we created a continuum-free (,)-data set prior to imaging the line data. For this, we used the continuum model that was derived during the deconvolution process of the continuum imaging, which we converted into model visibilities by applying a Fourier transform with the CASA task ‘ft’. These model visibilities were then subtracted from the (,)-data with the CASA task ‘uvsub’. Any residual continuum emission was subsequently subtracted in the (,)-domain using a linear fit to the line-free channels with CASA task ‘uvcontsub’. Our CO(=01) absorption was well captured in a single sub-band, in a region of the spectrum that did not suffer from any of the artifacts that appeared prior to the continuum subtraction. This allowed us to verify that our continuum subtraction did not negatively affect the absorption signal (see Appendix A).
After subtracting the continuum, we imaged the line data using a natural weighting scheme and native 11.9 km s-1 channels, while cleaning the line signal in each channel until an absolute value for the threshold of 0.35 mJy beam-1 was reached. The root-mean-square (rms) noise of this image cube is = 0.05 mJy beam-1 channel-1.
2.1 HST
We also obtained an image with the Hubble Space Telescope (HST) Wide Field Camera 3 (WFC3) in the F105W filter (project ID: 17268, PI Emonts). The observations were executed on 9 October 2023, and the total on-source integration time was 37 min. The F105W filter is devoid of emission lines at the redshift of B2 0902+34 and traces the stellar continuum at 300 nm in the rest-frame. We obtained the F105W image from the Multimission Archive at the Space Telescope Science Institute (MAST): https://doi.org/10.17909/cy88-7e89 (catalog 10.17909/cy88-7e89). A detailed analysis of the HST imaging will be postponed to a future paper.
3 Results
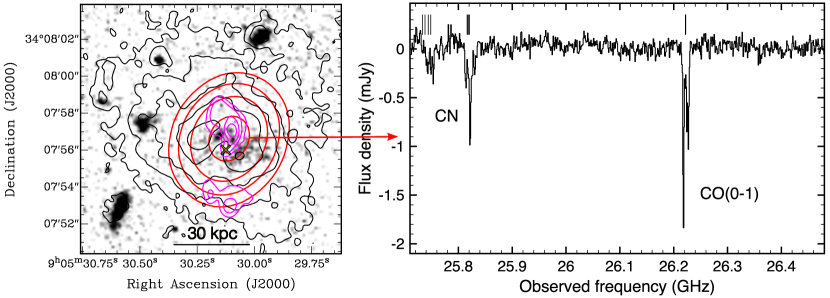
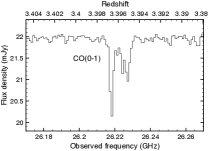
Figure 1 shows the absorption spectrum taken against the radio continuum of B2 0902+34, where the lines of CO(=01), CN(=01) =3/2-1/2, and CN(=01) =1/2-1/2 are clearly evident. While the background continuum source has a total extent of 5′′ (Carilli, 1995), the nucleus and brightest part of the northern lobe are unresolved in our D-configuration observations, while the faint southern radio lobe is not detected in our 26 GHz data. The peak flux-density of this unresolved background continuum is 22.1 1.1 mJy beam-1.444The uncertainty is based on an assumed 5 uncertainty in the absolute flux calibration.
The HST WFC3/F105W image in Fig. 1 (left) shows faint stellar light across a region of 30 kpc, similar to the low surface-brightness emission seen by Pentericci et al. (1999) in a bluer F622W ( 180 nm) image taken with the Wide Field and Planetary Camera 2 (WFPC2). This optical emission is faintest at the location of the radio core, which could hint to the presence of large amounts of dust (see also Pentericci et al., 1999). However, the astrometry remains somewhat ambiguous, because all the radio maps relied on self-calibration, which leaves inherent astrometric errors (e.g., Pearson & Readhead, 1984). A detailed discussion of the HST data will be given in a future paper.
3.1 CO(=01) absorption
Figure 2 shows in detail the CO(=01) absorption, which consists of two components (Table 1). We place the systemic redshift in the middle between the two components, namely = 3.3960 0.0008. The uncertainty reflects the difference in redshift of the two CO components.
The deep, narrow CO component has a redshift of = 3.3966 0.0001, which is in agreement with the redshift of = 3.3967 0.0002 derived from H I 21-cm absorption of neutral hydrogen gas that was previously detected with the Giant Meterwave Radio Telescope (GMRT; Chandra et al. 2004), as well as earlier detections with the VLA (Uson et al., 1991), the Arecibo telescope (Briggs et al., 1993), and the Westerbork Synthesis Radio Telescope (WSRT; Cody & Braun 2003). This CO component has a FWHMCO 26 km s-1, which is a factor three narrower than the FWHM of the H I absorber (Chandra et al., 2004). The optical depth of the narrow CO component is 8.6. Our observed optical depth is based on the unresolved background continuum at 26 GHz. Unless the absorption covers the background radio-continuum source uniformly, resolving the radio continuum at higher spatial resolution would decrease the flux density of the background continuum against which the absorption occurs. This is why our estimate of the observed optical depth is a lower limit to the true optical depth .
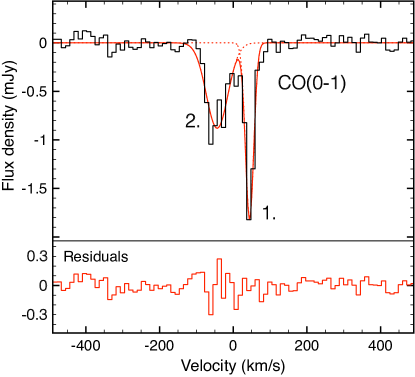
A broader CO(=01) component is centered on a velocity of -88 km s-1 blueward of the narrow line, with FWHMCO 69 km s-1 and %. This CO component has no obvious counterpart in the H I 21-cm absorption spectra.
3.2 CN(=01) absorption
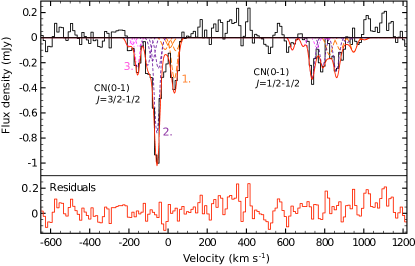
CN(=01) consists of nine hyperfine lines in the VLA band, divided into two groups: the CN(=01) =3/2-1/2 group has the highest integrated brightness and consists of five lines, one of which is too faint to be detected above the noise in our data. The fainter CN(=01) =1/2-1/2 group consists of four lines. As shown in Fig. 3, three components, representing three different absorbers, are required to obtain a good fit to the CN spectra. The fitting was performed with an unconstrained Gaussian fit to the brightest (hereafter “main”) hyperfine line for each of the three components of the stronger CN(=01) =3/2-1/2 multiplet, while at the same time representing the other hyperfine lines with additional Gaussians that had their center, width, and intensity constrained to the main line as per atomic physics (Osterbrock, 1989). The exact same solutions were applied to the hyperfine lines of the weaker CN(=01) =1/2-1/2 multiplet, again constraining the center, width, and intensity based on atomic physics. Therefore, the fully constrained fit to the weaker CN(=01) =1/2-1/2 multiplet merely serves to assure that our model accurately represents both CN multiplets (see Fig. 3 for details).
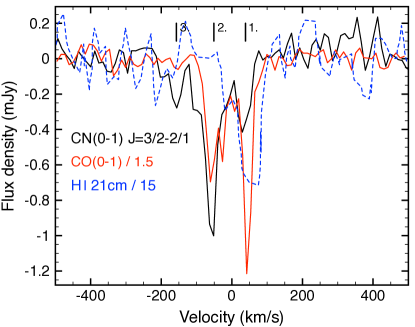
The redshifts of components 1 and 2 are consistent to within one channel with the redshifts of the two CO(=01) absorbers (Fig. 4). We therefore assume that the CN and CO absorptions originate from the same gas reservoir. Component 3 of CN is the weakest of the three and has no counterpart in CO(=01) at the detection limit of our data.
| Line | Comp. | CO/CN¶ | ||||||
|---|---|---|---|---|---|---|---|---|
| (km s-1) | (km s-1) | (mJy) | (km s-1) | |||||
| CO(=01) | 1 | 3.39660.0001 | 446 | 266 | -1.820.12 | 0.0860.007 | 2.980.73 | |
| 2 | 3.39530.0001 | -446 | 698 | -0.880.07 | 0.0410.004 | 2.360.36 | ||
| CN(=01) | 1 | 3.39650.0001 | 327 | 3510 | -0.330.07 | 0.0150.003 | 1.240.45 | 2.4 |
| 2 | 3.39520.0001 | -576 | 327 | -0.760.08 | 0.0350.004 | 2.320.58 | 1.0 | |
| 3 | 3.39380.0001 | -15710 | 2610 | -0.230.07 | 0.0100.003 | 0.660.33 | 0.4 |
Note. — Uncertainties include uncertainties in the fitting, as well as half the width of a channel (for and ) and a 5 uncertainty in absolute flux calibration (for ). Uncertainties are added in quadrature, and propagated for and .
∗ Velocity is with respect to = 3.3960 (v = 0 km s-1).
† is the full width at half the maximum intensity.
‡ The observed optical depth, , is estimated using = -ln(). Because the background continuum is unresolved, represents the lower limit to the true optical depth, .
The observed integrated optical depth, , for CN reflects the combined value of all the hyperfine lines of the CN(=01) = 3/2-1/2 group. Following atomic physics, the integrated optical depth of the model fit to the 1/2-1/2 group was constrained to be a factor 0.61 lower than that of the 3/2-1/2 group. The contribution of the 1/2-1/2 group is not included in the above estimate of , to facility easy comparison with results from the literature.
The CO/CN line ratio is defined as the ratio of the integrated optical depths, /.
4 Discussion
4.1 Physical properties of the molecular gas
The detection of both CO(=01) and CN(=01) in absorption allows us to derive physical properties of the absorbing gas. The ground-transition CO(=01) is the most reliable tracer for the overall molecular gas content across the full range of densities, independent of the excitation properties of the gas (e.g., Bolatto et al., 2013). Contrary, CN(=01) traces moderately dense (104 cm-3) molecular gas (Brooke et al., 2014; Shirley, 2015).
4.1.1 Column densities
To derive CO column densities, we follow Allison et al. (2019):555See also Wilson et al. (2013), Wiklind & Combes (1995), Mangum & Shirley (2015), and Rose et al. (2019)
| (1) |
where is the CO(=01) rest frequency, the statistical weight for the upper ( = 1) energy level, = 7.67108 s-1 the Einstein A-coefficient (see Chandra et al., 1996), the partition function assuming a single excitation temperature , the energy of the lower ( = 0) level, and the optical depth integrated over the width of the absorption profile (from Table 1). The variables and are the Planck and Boltzmann constants, respectively. For CO, the rigid-rotor approximation allows us to use = 2+1, and also approximate () /B (for ) and / () (see Allison et al., 2019). Here, =2.766 K is the rotational constant for CO. Furthermore, we assume 15 K (e.g., Wilson et al., 1997). Higher values than the lower limit of 15 K are expected if the molecular gas is located in star-forming regions or the vicinity of the AGN. The above parameters imply CO column densities of 2.4 1016 cm-2 for the deep, narrow component, and 3.1 1016 cm-2 for the broader CO component. We do not take into consideration potential line-dimming as a result of the increased temperature of the Cosmic Microwave Background radiation at = 3.4 (da Cunha et al., 2013; Zhang et al., 2016). This provides an additional reason for considering to be a lower limit.
If we assume a CO/H2 abundance of 1 10-4 that was found for molecular clouds in our Milky Way Galaxy (Frerking et al., 1982), then each component has a total H2 column density of roughly 31020 cm-2.
4.1.2 CN abundance
The formation of CN occurs through several routes that take place simultaneously in molecular clouds, especially at the transition boundary from H I to H2 in regions illuminated by ultra-violet (UV) radiation. These routes include photo-dissociation of HCN (HCN + CN + H), collisions with hydrogen atoms in high-density regions (HCN + H CN + H2), dissociative recombination (HCN+ + e- CN + H), and chemistry in photo-dissociation regions (PDRs) at an extinction of AV 2 mag (N + C2 CN + C, and N + CH CN + H) (e.g., Sternberg & Dalgarno, 1995). This means that the CN abundance is enhanced in the outer regions of molecular clouds exposed to UV radiation fields in PDRs (e.g., Fuente et al., 1995; Aalto et al., 2002; Boger & Sternberg, 2005), or in regions where the X-ray ionization rates are high (e.g., Meijerink et al., 2007; Lepp & Dalgarno, 1996).
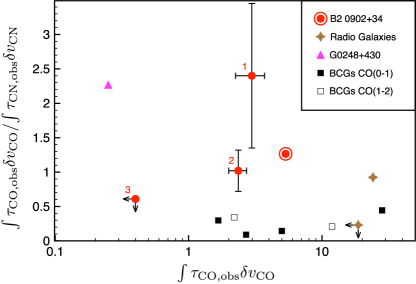
The observed ratios of the velocity-integrated optical depths of the CO(=01) and CN(=01) =3/2-1/2 lines, or / (hereafter CO/CN), are CO/CN 2.4 for component 1, CO/CN 1.0 for component 2, and CO/CN 0.4 for component 3, with the latter assuming a CO(=01) non-detection of 3 across FWHMCO FWHMCN = 26 km s-1 (see Table 1). As can be seen in Fig. 5, the CO/CN value for component 1 is comparable to the absorption-line value from a tidal tail in merger system G0248+430, which is illuminated by a background quasar (Combes et al., 2019). The CO/CN value for component 2 is similar to the value found in the low- radio galaxy 4C 31.04 (Morganti et al., 2023, see also Murthy et al. in prep.). Component 3 has a CO/CN limit comparable to the limit found for radio galaxy 4C 52.37 (Morganti et al., 2023). Given that B2 0902+34 is thought to be a collapsing protogiant elliptical (Adams et al., 2009), we also compare the CO/CN absorption values with those of a small sample of low- Brightest Cluster Galaxies (BCGs) studied by Rose et al. (2019). These low- BCGs have CO/CN ratios in agreement with the limit that we derive for component 3 in B2 0902+34, but lower than those of the main components 1 and 2.
When we compare our absorption results to emission-line studies, our CO/CN values are low compared to emission-line ratios found in nearby galaxies (Wilson, 2018) and luminous infra-red galaxies (LIRGs; Aalto et al., 2002), which typically have CO/CN 10. However, our absorption results are comparable to emission-line ratios found in the molecular outflow of Mrk 231 (Cicone et al., 2020), the circum-nuclear disk of the active galaxy NGC 1068 (García-Burillo et al., 2010), and the 2.56 Cloverleaf quasar (Riechers et al., 2007). This suggests that the CN abundance is likely enhanced by a UV or X-ray radiation field, and may thus originate close to the central AGN region, which is designated as region ‘N’ by Carilli (1995). In Mrk 231, the outflow component shows roughly 4 lower CO/CN ratios than gas in the center of the host galaxy (Cicone et al., 2020). For absorption detections, any outflow would be aligned in front of the radio source, and thus be blueshifted. In this respect, it is interesting that the most blueshifted component in B2 0902+34 also has the lowest CO/CN value. However, regarding all the above, we note that a one-on-one comparison between emission- and absorption-line studies may be limited by density and beam-filling effects. Moreover, the CN abundance is very sensitive to the fraction of mechanical energy in photon-dominated regions (Kazandjian et al., 2015).
Alternatively, Morganti et al. (2023) discuss that CN can be enhanced relative to CO in low-density, irradiated molecular shocks (Godard et al., 2019; Lehmann et al., 2022), or diffuse molecular gas with a high velocity dispersion (Wakelam et al., 2015). The CO/CN values that we find in B2 0902+34 resemble those found in the low- radio galaxies 4C 31.04 and 4C 52.37 by Morganti et al. (2023) (Fig. 5). This could be consistent with the scenario that the radio source interacts with the surrounding gaseous medium (Cordun et al., 2023, see Sect. 1).
In future work we will further address the nature of the CN absorption, by studying the location of the absorption components, and targeting other dense molecular gas tracers, such as HCN and HCO+.
4.1.3 Cloudy gas reservoir
The properties of the molecular gas reservoirs that cause the absorption features along the line-of-sight towards the radio continuum depend on whether the gas is part of the inter-stellar medium (ISM) close to the AGN, the ISM further out in the host galaxy, or the large-scale CGM. We will address this with future observations at higher spatial resolution, which will resolve the background continuum and therefore identify the location of the absorption components. For the moment, we will follow the assumption made in Sect. 4.1.2 that the molecular gas is part of the ISM, possibly near the AGN. We also follow Guszejnov et al. (2020), who show that the properties of molecular clouds (mass, velocity dispersion, and volume density) do not significantly change from redshift 4 to 0. The discussion in this Section will focus on the two strongest absorption components that are detected in CO(=01).
The estimated H2 column densities traced by these two strong absorption components are 31020 cm-2 (Section 4.1.1). Average volume densities of molecular clouds have been found to vary from roughly 1 - 1000 cm-3 (e.g., Smith et al., 2000; Heiner et al., 2008; Benincasa et al., 2013; Schneider et al., 2022), with densities reaching 104-5 cm-3 at the threshold for star formation (e.g., Lada et al., 2010; Benincasa et al., 2013; Baade et al., 2023). If a single molecular cloud along the line-of-sight towards the background radio continuum causes an absorption component, and we assume a traditional estimate of the volume density of 150 cm-3 (Scoville & Solomon, 1975), then the diameter of this cloud would be 0.7 pc, with a lower limit to the mass of M 1 . It is likely that local volume densities are higher and the cloud diameter smaller, because we detect the absorption components also in CN, which has an effective density of order 104 cm-2 (Shirley, 2015). This is a very simplistic view, given that molecular clouds are complex systems, with often highly structured, filamentary, or even fractal characteristics (e.g., Elmegreen & Falgarone, 1996; Combes, 1998; Goldsmith et al., 2008; Men’shchikov et al., 2010; Heyer & Dame, 2015; Schisano et al., 2020; Wong et al., 2022; Fahrion & De Marchi, 2023; Li et al., 2023). Nevertheless, it serves to illustrate that the absorption in B2 0902+34 likely originates from small (pc) clouds rather than giant (10-100 pc) molecular cloud complexes.
A single cloud likely has a velocity dispersion () of order a few km s-1 (Solomon et al., 1987; Benincasa et al., 2013; Miville-Deschênes et al., 2017; Spilker et al., 2022). This is significantly smaller than the FWHM 2669 km s-1 ( 1129 km s-1) of the absorption components that we detect in B2 0902+34 (Table 1). This suggests that the absorption components may be caused by regions with many small clouds or cloud fragments (‘cloudlets’; Gittins et al. 2003), where the overall kinematics are dominated by the velocity dispersion between the clouds. It is likely that the molecular clouds or cloudlets are optically thick, in which case their covering fraction of the background continuum is much less than 1. The crossing time of a cloud with a velocity of a few tens of km s-1 and a size 1 pc is short, 105 years. This means that the clouds are likely short-lived.
The absorption components that we detect in B2 0902+34 differ in CN abundance compared to CO (Fig. 5). This could mean that the molecular gas structures are not uniform across the regions, and that perhaps high-density clouds or cloudlets are dispersed and mixed with lower density molecular gas. This could represent a “cloudy region”, with many small and short-lived clumps covering a region that is highly turbulent. In such a region, cooling and dissipation would allow for the formation and growth of molecular clouds (e.g., Li & Bryan, 2014a; Kanjilal et al., 2021), or the shattering of dense cold clouds could create a reservoir of diffuse and warmer molecular gas (e.g., Appleton et al., 2023).
The fact that absorption component 1 has approximately the same redshift as the previously detected H I absorber (Fig. 4) suggests that the neutral gas likely also originates from the same region. However, the factor three difference in line width between the deep CO absorption and the H I absorption (Fig. 4) suggests that the cool neutral gas is even more turbulent than the ensemble of cold gas clouds. Again, this would suggest a region where dense, molecular gas clouds are embedded in a larger reservoir of more diffuse gas.
In the presence of a powerful radio source, such a region could have properties as predicted by precipitation models of many small cloudlets distributed throughout a larger reservoir of gas, where the formation and destruction of molecular clouds is regulated through feedback (e.g., Sharma et al., 2010, 2012; Li & Bryan, 2014b; Voit et al., 2015).
4.2 Comparison to previous CO absorption studies
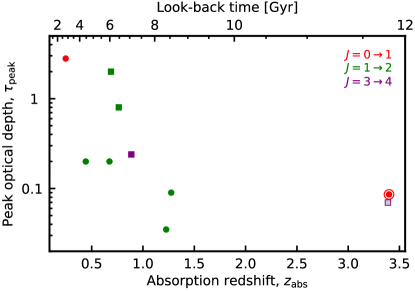
Table 2 gives an overview of the ten CO absorbers detected at 0.1 (see Sect. 1). As shown in Fig. 6, the CO absorption in 0902+34 is the highest redshift example yet detected, possibly by a large margin. It is comparable in redshift only to the tentative detection of intervening CO(=34) absorption towards 0201+113, and its look-back time of almost 12 Gyr is at least 3 Gyr earlier than the other known CO absorbers.
As discussed in Sect. 1, there has been a lack of CO absorbers against bright radio-continuum sources at high and intermediate redshifts, despite dedicated searches. The high redshift of B2 0902+34 allows detection by the VLA, which has a high sensitivity in comparison with the mm-band telescopes used previously. However, the integrated signal of the CO absorption in B2 0902+34 is detected at a level of 45 after 18.7h of on-source integration time. This means that the absorption signal would be detectable with the VLA at a 5 level after only 14 min on-source exposure time, which is similar to the sensitivity of previous searches for CO absorption in radio sources at 1 (e.g., Curran et al., 2011b). We therefore do not expect that the high sensitivity of our VLA observations introduced a bias or prevents a fair comparison with previous CO absorption studies in terms of detectability of the signal.
4.2.1 Reddening versus absorption strength
| Source | Type | Trans. | Ref. | |||||
|---|---|---|---|---|---|---|---|---|
| 0132–097 | 0.7634 | I | 75.6 | W18 | 19.8 | 12.07 | 7.73 | |
| (0201+113 | 3.3872 | I | 6.3 | C23 | 18.66 | 15.16 | 3.50) | |
| 0218+35 | 0.6885 | I | 20.3 | W95 | 20.25 | — | — | |
| 0902+34 | 3.398 | A | 5.35 | this | 21.80 | 17.61 | 4.19 | |
| 1200+045 | 1.2128 | A | 3.1 | C23 | 18.74 | 14.67 | 4.07 | |
| 1245–19 | 1.2661 | A | 7.2 | C23 | – | 16.55 | – | |
| 1413+135 | 0.2467 | A | 3.6 | W97 | 21.01 | 14.02 | 6.99 | |
| 1504+37 | 0.6734 | A | 12.2 | W96 | 21.44 | 14.66 | 6.78 | |
| 1740–517 | 0.4423 | A | 4.8 | A19 | 21.31 | 14.70 | 6.61 | |
| 1830–211 | 0.8853 | I | 1.8 | W98 | 22.98 | — | — |
Curran et al. (2006) noted that the sight-lines of damped Lyman- absorption (DLA) systems, which have molecular fractions , appeared to be much less reddened, with optical–near-infrared colors of , than the millimetre-band absorbers, which have and . That is, the millimetre-band detections occur along much redder and optically fainter sight-lines, suggesting dustier, more molecular-rich gas. Thus, targeting sight-lines towards sources that are sufficiently unobscured in the optical band, which can yield a reliable redshift to which to tune the millimeter receivers, will lead to a bias against the detection of the cold, obscuring gas traced in the millimeter band (see also Zwaan & Prochaska, 2006). In fact, all but one of the previous CO absorption detections were follow-up observations of targets that had previously been detected in H I 21-cm absorption (Uson et al., 1991; Carilli et al., 1992, 1998; Chengalur et al., 1999; Kanekar & Briggs, 2003a; Kanekar et al., 2003b; Allison et al., 2019),666The exception is PKS 1830–211, which was found through a 14 GHz wide spectral scan of the 3-mm band (Wiklind & Combes, 1996b). which is also correlated with the color (Curran et al., 2019).
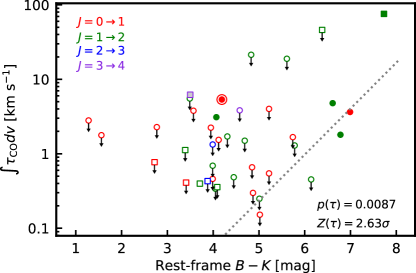
To test whether the absorption-line strength is consistent with the degree of reddening for 0902+34 and the other previous millimeter-band detections, Fig. 7 shows the distribution of integrated optical depth and rest-frame color for the known detections of CO absorption at 0.1. The colors were obtained following the procedure described in Appendix B and are listed for the detections in Table 2. Included in Fig. 7 are the upper limits from the unsuccessful searches for redshifted CO absorption, as summarized in Curran et al. (2011b), with the addition of those in Combes & Gupta (2024).
For the CO detections, there are only seven sources with the colors available. One of these is the intervening CO absorber towards PKS 0201+113 (purple-gray square at = 3.5, = 6.3 in Fig. 7), which was detected at a tentative 3 level (Combes & Gupta, 2024). Furthermore, this absorber occurs in a damped Ly absorption system with a low molecular fraction (; Srianand et al. 2012)777As would be expected from its low metalicity of [Z/H] (Curran et al., 2004). and so it is very anomalous. We therefore exclude 0201+113 from our statistics. The remaining six CO absorbers do not show evidence of a correlation. However, when adding the limits of the non-detections, via the Astronomy SURVival Analysis (asurv) package (Isobe et al., 1986), a generalised non-parametric Kendall-tau test gives a probability of of the distribution occurring by chance, which is significant at , assuming Gaussian statistics (see Table 3 of Appendix C). For this, the linear fit, including the limits, gives
| (2) |
Most of the published limits are in associated systems. Although four of the detected systems occur in absorbers intervening a more distant continuum source, the colour is only available for two of those, including 0201+113 (Table 2). The other intervening absorber is 0132–097, which constitutes an “end point” that drives the correlation, with the largest absorption strength and degree of reddening (the green square at = 7.7, = 76 in Fig. 7). Removing also this intervening system gives a significance of .
Figure 7 shows that B2 0902+34 appears to be an outlier, being much less reddened ( 4.2) than would be expected based on the linear fit. This is also the case for the CO absorber towards 1200+045 at = 1.2 (Combes & Gupta, 2024). However, the color of 0902+34 is quite uncertain (see Appendix A).888Removing B2 0902+34, in addition to 0201+113, increases the significance of the correlation to (see Table 3 of Appendix C). Also, the different CO transitions shown in Fig. 7 likely trace molecular gas with different excitation conditions, which may introduce a scatter. Nevertheless, as more data are added, it would be interesting to see if the above fit, or any in Table 3 (Appendix C), provides a useful diagnostic in predicting the CO absorption-line strength from the sight-line color, as can be expected if both properties depend on the galaxy’s dust content.
5 Conclusions
We presented a multi-component molecular absorption system in the radio galaxy B2 0902+34 at = 3.4, detected in CO(=01) and CN(=01). This system was previously detected also in H I 21-cm absorption of neutral gas. Summarizing the main results:
-
•
B2 0902+34 is the highest redshift galaxy in which absorption of neutral and molecular gas has been detected.
-
•
The CO(=01) absorption consists of two components, each tracing an H2 column density of 31020 cm-2. Combined with the large FHWM of the CO components (26 and 69 km s-1), we discuss the scenario that the absorption likely originates from a collection of small (pc-scale) molecular clouds that are distributed across a region with also diffuse gas and high turbulence among the clouds.
-
•
The CN(=01) absorption consists of three components, with CO/CN ratios of integrated optical depth ranging from 0.4 2.4. This suggests that the molecular clouds are dense ( 104 cm-2) and likely irradiated by UV or X-ray emission, possibly near the central AGN or starburst.
-
•
Compared to other distant CO absorbers and the large number of CO non-detections in the literature, we find indications at the 2.6 level for a correlation between the absorption line strength and the rest-frame color, with . If confirmed, this could indicate that detectable CO absorption is more prevalent among galaxies with a higher dust content. Despite this, B2 0902+34 shows less red colors than the CO absorption systems at z 1.
As a result of our VLA observations, the discovery of this multi-phase absorber, 1.5 Gyr after the Big Bang, opens a window for studying the neutral and molecular gas on small scales in distant galaxies during the era of the Square Kilometre Array (SKA; Lazio 2009) and Next-Generation Very Large Array (ngVLA; Murphy 2018).
Appendix A CO spectrum prior to continuum subtraction
Sect. 2 described why and how the radio continuum was subtracted in the (,)-domain prior to imaging the line data. Figure 8 shows the CO(=01) absorption on top of the continuum in the image cube that was made prior to continuum subtraction. This illustrates that the continuum subtraction had no adverse effect on the absorption signal.
Appendix B Sight line colors to CO absorbers
In order to test whether the absorption line strength of km s-1 is consistent with the degree of reddening (Sect. 4.2.1), for B2 0902+34 and the other previous detections and non-detections, we used the same method as Curran & Moss (2019), where we scraped the photometry from the NASA/IPAC Extragalactic Database (NED), the Wide-Field Infrared Survey Explorer (WISE, Wright et al. 2010) and the Two Micron All Sky Survey (2MASS, Skrutskie et al. 2006).
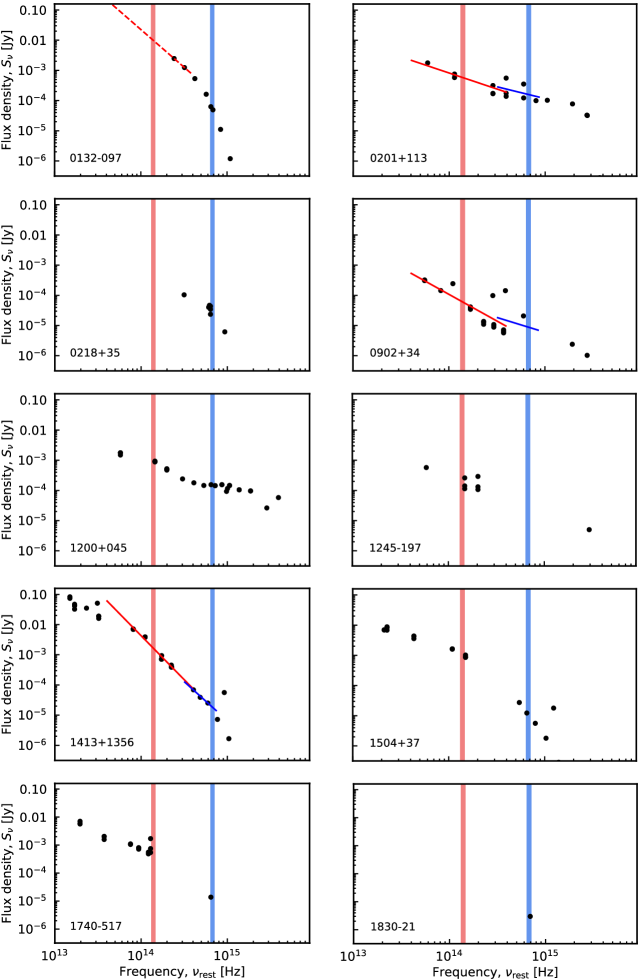
Figure 9 shows the broadband photometry from NED, WISE, and 2MASS of all known CO absorbers at 0.1. Given the large redshift of B2 0902+34, we shifted the SEDs back into the rest-frame. Following the same method as Curran (2021), if the frequency of the photometric point fell within of the central frequency of the band, the flux measurement was added with multiple values being averaged. If no photometry for that band was available, this was obtained by a power law fit to the neighbouring photometric points. Results of the color analysis of the CO absorbers are summarized in Table 2 and further details are provided in Sect. 4.2.1.
Appendix C Statistics on correlation between absorption strength and colors
Table 3 gives an overview of the statistics of the CO absorption strength versus rest-frame color for both the detections (Table 2) and non-detections (Curran et al., 2011b; Combes & Gupta, 2024). This follows the analysis shown in Appendix B and the equation
| (C1) |
where is the gradient and is the intercept of the linear fit. See Table 3 for more details.
| whole sample | |||||
| Detections | 7 | 0.881 | 0.10 | 0.81 | |
| All | 40 | 0.050 | 0.48 | ||
| Associated only | 31 | 0.098 | 0.35 | ||
| excluding 0201+113 | |||||
| Detections | 6 | 0.573 | 0.16 | ||
| All | 39 | 0.009 | 0.62 | ||
| Associated only | 31 | 0.098 | 0.35 | ||
| excluding 0201+113 and 0902+34 | |||||
| Detections | 5 | 0.327 | 0.23 | ||
| All | 38 | 0.004 | 0.73 | ||
| Associated only | 30 | 0.033 | 0.47 | ||
References
- Aalto et al. (2002) Aalto, S., Polatidis, A. G., Hüttemeister, S., et al. 2002, A&A, 381, 783. doi:10.1051/0004-6361:20011514
- Adams et al. (2009) Adams, J. J., Hill, G. J., & MacQueen, P. J. 2009, ApJ, 694, 314. doi:10.1088/0004-637X/694/1/314
- Allison et al. (2019) Allison, J. R., Mahony, E. K., Moss, V. A., et al. 2019, MNRAS, 482, 2934. doi:10.1093/mnras/sty2852
- Appleton et al. (2023) Appleton, P. N., Guillard, P., Emonts, B., et al. 2023, arXiv:2301.02928. doi:10.48550/arXiv.2301.02928
- Baade et al. (2023) Baade, J. C., Kong, S., Bieging, J. H., et al. 2023, arXiv:2311.03304. doi:10.48550/arXiv.2311.03304
- Balashev et al. (2014) Balashev S. A., Klimenko V. V., Ivanchik A. V., Varshalovich D. A., Petitjean P., Noterdaeme P., 2014, MNRAS, 440, 225
- Balashev & Noterdaeme (2018) Balashev, S. A. & Noterdaeme, P. 2018, MNRAS, 478, L7. doi:10.1093/mnrasl/sly067
- Benincasa et al. (2013) Benincasa, S. M., Tasker, E. J., Pudritz, R. E., et al. 2013, ApJ, 776, 23. doi:10.1088/0004-637X/776/1/23
- Boger & Sternberg (2005) Boger, G. I. & Sternberg, A. 2005, ApJ, 632, 302. doi:10.1086/432864
- Bolatto et al. (2013) Bolatto, A. D., Wolfire, M., & Leroy, A. K. 2013, ARA&A, 51, 207. doi:10.1146/annurev-astro-082812-140944
- Briggs et al. (1993) Briggs, F. H., Sorar, E., & Taramopoulos, A. 1993, ApJ, 415, L99. doi:10.1086/187042
- Brooke et al. (2014) Brooke, J. S. A., Ram, R. S., Western, C. M., et al. 2014, ApJS, 210, 23. doi:10.1088/0067-0049/210/2/23
- Carilli et al. (1992) Carilli, C. L., Perlman, E. S., & Stocke, J. T. 1992, ApJ, 400, L13. doi:10.1086/186637
- Carilli (1995) Carilli, C. L. 1995, A&A, 298, 77
- Carilli et al. (1998) Carilli, C. L., Menten, K. M., Reid, M. J., et al. 1998, ApJ, 494, 175. doi:10.1086/305191
- Carilli et al. (2000) Carilli, C. L., Menten, K. M., Stocke, J. T., et al. 2000, Phys. Rev. Lett., 85, 5511. doi:10.1103/PhysRevLett.85.5511
- CASA Team et al. (2022) CASA Team, Bean, B., Bhatnagar, S., et al. 2022, PASP, 134, 114501. doi:10.1088/1538-3873/ac9642
- Chandra et al. (1996) Chandra, S., Maheshwari, V. U., & Sharma, A. K. 1996, A&AS, 117, 557
- Chandra et al. (2004) Chandra, P., Swarup, G., Kulkarni, V. K., et al. 2004, Journal of Astrophysics and Astronomy, 25, 57. doi:10.1007/BF02702288
- Chengalur et al. (1999) Chengalur, J. N., de Bruyn, A. G., & Narasimha, D. 1999, A&A, 343, L79. doi:10.48550/arXiv.astro-ph/9904055
- Cicone et al. (2020) Cicone, C., Maiolino, R., Aalto, S., et al. 2020, A&A, 633, A163. doi:10.1051/0004-6361/201936800
- Cody & Braun (2003) Cody, A. M. & Braun, R. 2003, A&A, 400, 871. doi:10.1051/0004-6361:20030082
- Combes & Wiklind (1997) Combes, F. & Wiklind, T. 1997, ApJ, 486, L79. doi:10.1086/310849
- Combes (1998) Combes, F. 1998, Celestial Mechanics and Dynamical Astronomy, 72, 91. doi:10.1023/A:1008370831608
- Combes (2008) Combes, F. 2008, Ap&SS, 313, 321. doi:10.1007/s10509-007-9632-3
- Combes et al. (2019) Combes, F., Gupta, N., Jozsa, G. I. G., et al. 2019, A&A, 623, A133. doi:10.1051/0004-6361/201935057
- Combes & Gupta (2024) Combes, F. & Gupta, N. 2024, AA, in press. (arXiv:2310.17204).
- Cordun et al. (2023) Cordun, C. M., Timmerman, R., Miley, G. K., et al. 2023, arXiv:2306.00071. doi:10.48550/arXiv.2306.00071
- Curran et al. (2004) Curran, S. J., Webb, J. K., Murphy, M. T., et al. 2004, MNRAS, 351, L24. doi:10.1111/j.1365-2966.2004.07958.x
- Curran et al. (2006) Curran S. J., Whiting M. T., Murphy M. T., Webb J. K., Longmore S. N., Pihlström Y. M., Athreya R., Blake C., 2006, MNRAS, 371, 431
- Curran et al. (2007) Curran S. J., Darling J. K., Bolatto A. D., Whiting M. T., Bignell C., Webb J. K., 2007, MNRAS, 382, L11
- Curran et al. (2008) Curran S. J., Whiting M. T., Wiklind T., Webb J. K., Murphy M. T., Purcell C. R., 2008, MNRAS, 391, 765
- Curran et al. (2011a) Curran, S. J., Tanna, A., Koch, F. E., et al. 2011a, A&A, 533, A55. doi:10.1051/0004-6361/201117457
- Curran et al. (2011b) Curran, S. J., Whiting, M. T., Combes, F., et al. 2011b, MNRAS, 416, 2143. doi:10.1111/j.1365-2966.2011.19193.x
- Curran & Moss (2019) Curran S. J., Moss J. P., 2019, A&A, 629, A56
- Curran et al. (2019) Curran S. J., Hunstead R. W., Johnston H. M., Whiting M. T., Sadler E. M., Allison J. R., Athreya R., 2019, MNRAS, 484, 1182
- Curran (2021) Curran, S. J. 2021, MNRAS, 508, 1165. doi:10.1093/mnras/stab2639
- da Cunha et al. (2013) da Cunha, E., Groves, B., Walter, F., et al. 2013, ApJ, 766, 13. doi:10.1088/0004-637X/766/1/13
- Dessauges-Zavadsky et al. (2023) Dessauges-Zavadsky, M., Richard, J., Combes, F., et al. 2023, MNRAS, 519, 6222. doi:10.1093/mnras/stad113
- Drinkwater et al. (1996) Drinkwater M. J., Combes F., Wiklind T., 1996, A&A, 312, 771
- Eales et al. (1993) Eales, S., Rawlings, S., Puxley, P., et al. 1993, Nature, 363, 140. doi:10.1038/363140a0
- Eisenhardt & Dickinson (1992) Eisenhardt, P. & Dickinson, M. 1992, ApJ, 399, L47. doi:10.1086/186603
- Elmegreen & Falgarone (1996) Elmegreen, B. G. & Falgarone, E. 1996, ApJ, 471, 816. doi:10.1086/178009
- Evans et al. (1996) Evans, A. S., Sanders, D. B., Mazzarella, J. M., et al. 1996, ApJ, 457, 658. doi:10.1086/176761
- Fabian et al. (2002) Fabian, A. C., Crawford, C. S., & Iwasawa, K. 2002, MNRAS, 331, L57. doi:10.1046/j.1365-8711.2002.05452.x
- Fahrion & De Marchi (2023) Fahrion, K. & De Marchi, G. 2023, arXiv:2311.06336. doi:10.48550/arXiv.2311.06336
- Frerking et al. (1982) Frerking, M. A., Langer, W. D., & Wilson, R. W. 1982, ApJ, 262, 590. doi:10.1086/160451
- Fuente et al. (1995) Fuente, A., Martin-Pintado, J., & Gaume, R. 1995, ApJ, 442, L33. doi:10.1086/187809
- García-Burillo et al. (2010) García-Burillo, S., Usero, A., Fuente, A., et al. 2010, A&A, 519, A2. doi:10.1051/0004-6361/201014539
- Gerin et al. (1997) Gerin, M., Phillips, T. G., Benford, D. J., et al. 1997, ApJ, 488, L31. doi:10.1086/310910
- Gittins et al. (2003) Gittins, D. M., Clarke, C. J., & Bate, M. R. 2003, MNRAS, 340, 841. doi:10.1046/j.1365-8711.2003.06339.x
- Godard et al. (2019) Godard, B., Pineau des Forêts, G., Lesaffre, P., et al. 2019, A&A, 622, A100. doi:10.1051/0004-6361/201834248
- Goldsmith et al. (2008) Goldsmith, P. F., Heyer, M., Narayanan, G., et al. 2008, ApJ, 680, 428. doi:10.1086/587166
- Guszejnov et al. (2020) Guszejnov, D., Grudić, M. Y., Offner, S. S. R., et al. 2020, MNRAS, 492, 488. doi:10.1093/mnras/stz3527
- Heiner et al. (2008) Heiner, J. S., Allen, R. J., Emonts, B. H. C., et al. 2008, ApJ, 673, 798. doi:10.1086/524131
- Heyer & Dame (2015) Heyer, M. & Dame, T. M. 2015, ARA&A, 53, 583. doi:10.1146/annurev-astro-082214-122324
- Hodge et al. (2012) Hodge, J. A., Carilli, C. L., Walter, F., et al. 2012, ApJ, 760, 11. doi:10.1088/0004-637X/760/1/11
- Isobe et al. (1986) Isobe T., Feigelson E., Nelson P., 1986, ApJ, 306, 490
- Kanekar & Briggs (2003a) Kanekar, N. & Briggs, F. H. 2003a, A&A, 412, L29. doi:10.1051/0004-6361:20031676
- Kanekar et al. (2003b) Kanekar, N., Chengalur, J. N., de Bruyn, A. G., et al. 2003b, MNRAS, 345, L7. doi:10.1046/j.1365-8711.2003.07077.x
- Kanekar et al. (2007) Kanekar, N., Chengalur, J. N., & Lane, W. M. 2007, MNRAS, 375, 1528. doi:10.1111/j.1365-2966.2007.11430.x
- Kanekar et al. (2014) Kanekar, N., Gupta, A., Carilli, C. L., et al. 2014, ApJ, 782, 56. doi:10.1088/0004-637X/782/1/56
- Kanjilal et al. (2021) Kanjilal, V., Dutta, A., & Sharma, P. 2021, MNRAS, 501, 1143. doi:10.1093/mnras/staa3610
- Kazandjian et al. (2015) Kazandjian, M. V., Meijerink, R., Pelupessy, I., et al. 2015, A&A, 574, A127. doi:10.1051/0004-6361/201322805
- Klitsch et al. (2019) Klitsch, A., Péroux, C., Zwaan, M. A., et al. 2019, MNRAS, 490, 1220. doi:10.1093/mnras/stz2660
- Lada et al. (2010) Lada, C. J., Lombardi, M., & Alves, J. F. 2010, ApJ, 724, 687. doi:10.1088/0004-637X/724/1/687
- Lazio (2009) Lazio, J. 2009, Panoramic Radio Astronomy: Wide-field 1-2 GHz Research on Galaxy Evolution, 58. doi:10.22323/1.089.0058
- Lehmann et al. (2022) Lehmann, A., Godard, B., Pineau des Forêts, G., et al. 2022, A&A, 658, A165. doi:10.1051/0004-6361/202141487
- Lepp & Dalgarno (1996) Lepp, S. & Dalgarno, A. 1996, A&A, 306, L21
- Levshakov & Varshalovich (1985) Levshakov S. A., Varshalovich D. A., 1985, MNRAS, 212, 517
- Li & Bryan (2014a) Li, Y. & Bryan, G. L. 2014a, ApJ, 789, 153. doi:10.1088/0004-637X/789/2/153
- Li & Bryan (2014b) Li, Y. & Bryan, G. L. 2014b, ApJ, 789, 54. doi:10.1088/0004-637X/789/1/54
- Li et al. (2023) Li, X.-M., Zhang, G.-Y., Men’shchikov, A., et al. 2023, A&A, 674, A225. doi:10.1051/0004-6361/202345846
- Lilly (1988) Lilly, S. J. 1988, ApJ, 333, 161. doi:10.1086/166732
- Maccagni et al. (2018) Maccagni, F. M., Morganti, R., Oosterloo, T. A., et al. 2018, A&A, 614, A42. doi:10.1051/0004-6361/201732269
- Mangum & Shirley (2015) Mangum, J. G. & Shirley, Y. L. 2015, PASP, 127, 266. doi:10.1086/680323
- Meijerink et al. (2007) Meijerink, R., Spaans, M., & Israel, F. P. 2007, A&A, 461, 793. doi:10.1051/0004-6361:20066130
- Men’shchikov et al. (2010) Men’shchikov, A., André, P., Didelon, P., et al. 2010, A&A, 518, L103. doi:10.1051/0004-6361/201014668
- Miville-Deschênes et al. (2017) Miville-Deschênes, M.-A., Murray, N., & Lee, E. J. 2017, ApJ, 834, 57. doi:10.3847/1538-4357/834/1/57
- Morganti & Oosterloo (2018) Morganti, R. & Oosterloo, T. 2018, A&A Rev., 26, 4. doi:10.1007/s00159-018-0109-x
- Morganti et al. (2023) Morganti, R., Murthy, S., Guillard, P., et al. 2023, Galaxies, 11, 24. doi:10.3390/galaxies11010024
- Muller et al. (2011) Muller, S., Beelen, A., Guélin, M., et al. 2011, A&A, 535, A103. doi:10.1051/0004-6361/201117096
- Muller et al. (2013) Muller, S., Beelen, A., Black, J. H., et al. 2013, A&A, 551, A109. doi:10.1051/0004-6361/201220613
- Muller et al. (2014) Muller, S., Combes, F., Guélin, M., et al. 2014, A&A, 566, A112. doi:10.1051/0004-6361/201423646
- Muller et al. (2021) Muller, S., Ubachs, W., Menten, K. M., et al. 2021, A&A, 652, A5. doi:10.1051/0004-6361/202140531
- Muller et al. (2023) Muller, S., Martí-Vidal, I., Combes, F., et al. 2023, A&A, 674, A101. doi:10.1051/0004-6361/202245768
- Murphy et al. (2003) Murphy M. T., Curran S. J., Webb J. K., 2003, MNRAS, 342, 830
- Murphy (2018) Murphy, E. 2018, Science with a Next Generation Very Large Array, 517
- Noterdaeme et al. (2015) Noterdaeme P., Srianand R., Rahmani H., Petitjean P., Pâris I., Ledoux C., Gupta N., López S., 2015, A&A, 577, A24
- Osterbrock (1989) Osterbrock, D. E. 1989, Astrophysics of Gaseous Nebulae and Active Galactic Nuclei, by Donald E. Osterbrock. Published by University Science Books, ISBN 0-935702-22-9, 408pp, 1989.
- Oteo et al. (2016) Oteo, I., Zwaan, M. A., Ivison, R. J., et al. 2016, ApJ, 822, 36. doi:10.3847/0004-637X/822/1/36
- Pearson & Readhead (1984) Pearson, T. J. & Readhead, A. C. S. 1984, ARA&A, 22, 97. doi:10.1146/annurev.aa.22.090184.000525
- Pentericci et al. (1999) Pentericci, L., Röttgering, H. J. A., Miley, G. K., et al. 1999, A&A, 341, 329. doi:10.48550/arXiv.astro-ph/9809056
- Ranjan et al. (2018) Ranjan, A., Noterdaeme, P., Krogager, J.-K., et al. 2018, A&A, 618, A184. doi:10.1051/0004-6361/201833446
- Reuland et al. (2003) Reuland, M., van Breugel, W., Röttgering, H., et al. 2003, ApJ, 592, 755. doi:10.1086/375619
- Riechers et al. (2007) Riechers, D. A., Walter, F., Cox, P., et al. 2007, ApJ, 666, 778. doi:10.1086/520335
- Riechers et al. (2022) Riechers, D. A., Weiss, A., Walter, F., et al. 2022, Nature, 602, 58. doi:10.1038/s41586-021-04294-5
- Rose et al. (2019) Rose, T., Edge, A. C., Combes, F., et al. 2019, MNRAS, 485, 229. doi:10.1093/mnras/stz406
- Rose et al. (2023) Rose, T., McNamara, B. R., Combes, F., et al. 2023, MNRAS, 518, 878. doi:10.1093/mnras/stac3194
- Schisano et al. (2020) Schisano, E., Molinari, S., Elia, D., et al. 2020, MNRAS, 492, 5420. doi:10.1093/mnras/stz3466
- Schneider et al. (2022) Schneider, N., Ossenkopf-Okada, V., Clarke, S., et al. 2022, A&A, 666, A165. doi:10.1051/0004-6361/202039610
- Scoville & Solomon (1975) Scoville, N. Z. & Solomon, P. M. 1975, ApJ, 199, L105. doi:10.1086/181859
- Sharma et al. (2010) Sharma, P., Parrish, I. J., & Quataert, E. 2010, ApJ, 720, 652. doi:10.1088/0004-637X/720/1/652
- Sharma et al. (2012) Sharma, P., McCourt, M., Quataert, E., et al. 2012, MNRAS, 420, 3174. doi:10.1111/j.1365-2966.2011.20246.x
- Shirley (2015) Shirley, Y. L. 2015, PASP, 127, 299. doi:10.1086/680342
- Skrutskie et al. (2006) Skrutskie M. F. et al., 2006, AJ, 131, 1163
- Smith et al. (2000) Smith, D. A., Allen, R. J., Bohlin, R. C., et al. 2000, ApJ, 538, 608. doi:10.1086/309172
- Solomon et al. (1987) Solomon, P. M., Rivolo, A. R., Barrett, J., et al. 1987, ApJ, 319, 730. doi:10.1086/165493
- Spilker et al. (2022) Spilker, A., Kainulainen, J., & Orkisz, J. 2022, A&A, 667, A110. doi:10.1051/0004-6361/202244392
- Srianand et al. (2012) Srianand, R., Gupta, N., Petitjean, P., et al. 2012, MNRAS, 421, 651. doi:10.1111/j.1365-2966.2011.20342.x
- Sternberg & Dalgarno (1995) Sternberg, A. & Dalgarno, A. 1995, ApJS, 99, 565. doi:10.1086/192198
- Uson et al. (1991) Uson, J. M., Bagri, D. S., & Cornwell, T. J. 1991, Phys. Rev. Lett., 67, 3328. doi:10.1103/PhysRevLett.67.3328
- van Ojik et al. (1997) van Ojik, R., Roettgering, H. J. A., van der Werf, P. P., et al. 1997, A&A, 321, 389. doi:10.48550/arXiv.astro-ph/9610170
- Voit et al. (2015) Voit, G. M., Donahue, M., Bryan, G. L., et al. 2015, Nature, 519, 203. doi:10.1038/nature14167
- Wakelam et al. (2015) Wakelam, V., Loison, J.-C., Herbst, E., et al. 2015, ApJS, 217, 20. doi:10.1088/0067-0049/217/2/20
- Wiklind & Combes (1995) Wiklind, T. & Combes, F. 1995, A&A, 299, 382
- Wiklind & Combes (1996a) Wiklind T., Combes F., 1996a, A&A, 315, 86
- Wiklind & Combes (1996b) Wiklind T., Combes F., 1996b, Nat, 379, 139
- Wiklind & Combes (1997) Wiklind T., Combes F., 1997, A&A, 328, 48
- Wiklind & Combes (1998) Wiklind T., Combes F., 1998, ApJ, 500, 129
- Wiklind & Combes (1999) Wiklind, T. & Combes, F. 1999, Highly Redshifted Radio Lines, 156, 202. doi:10.48550/arXiv.astro-ph/9712139
- Wiklind et al. (2018) Wiklind, T., Combes, F., & Kanekar, N. 2018, ApJ, 864, 73. doi:10.3847/1538-4357/aad4ac
- Wilson et al. (1997) Wilson, C. D., Walker, C. E., & Thornley, M. D. 1997, ApJ, 483, 210. doi:10.1086/304216
- Wilson et al. (2013) Wilson, T. L., Rohlfs, K., & Hüttemeister, S. 2013, Tools of Radio Astronomy, by Wilson, Thomas L.; Rohlfs, Kristen; Huttemeister, Susanne, 2013. Berlin: Springer Berlin Heidelberg. OCLC: 922907410. ISBN: 3-642-39950-9.. doi:10.1007/978-3-642-39950-3
- Wilson (2018) Wilson, C. D. 2018, MNRAS, 477, 2926. doi:10.1093/mnras/sty845
- Wong et al. (2022) Wong, T., Oudshoorn, L., Sofovich, E., et al. 2022, ApJ, 932, 47. doi:10.3847/1538-4357/ac723a
- Wright (2006) Wright, E. L. 2006, PASP, 118, 1711
- Wright et al. (2010) Wright E. L. et al., 2010, AJ, 140, 1868
- Zhang et al. (2016) Zhang, Z.-Y., Papadopoulos, P. P., Ivison, R. J., et al. 2016, Royal Society Open Science, 3, 160025. doi:10.1098/rsos.160025
- Zwaan & Prochaska (2006) Zwaan M. A., Prochaska J. X., 2006, ApJ, 643, 675