Is there really a Citation Age Bias in NLP?
Abstract
Citations are a key ingredient of scientific research to relate a paper to others published in the community. Recently, it has been noted that there is a citation age bias in the Natural Language Processing (NLP) community, one of the currently fastest growing AI subfields, in that the mean age of the bibliography of NLP papers has become ever younger in the last few years, leading to ‘citation amnesia’ in which older knowledge is increasingly forgotten. In this work, we put such claims into perspective by analyzing the bibliography of 300k papers across 15 different scientific fields submitted to the popular preprint server Arxiv in the time period from 2013 to 2022. We find that all AI subfields (in particular: cs.AI, cs.CL, cs.CV, cs.LG) have similar trends of citation amnesia, in which the age of the bibliography has roughly halved in the last 10 years (from above 12 in 2013 to below 7 in 2022), on average. Rather than diagnosing this as a citation age bias in the NLP community, we believe this pattern is an artefact of the dynamics of these research fields, in which new knowledge is produced in ever shorter time intervals.
1 Introduction
Biases in citations of scientific papers are ubiquitous. For example, researchers may disproportionately cite (1) papers that support their own claims (Gøtzsche, 2022), (2) papers that have authors with the same gender (Lerman et al., 2022), (3) their own papers (Seeber et al., 2019), or (4) papers of close peers (Fister Jr et al., 2016). Recently, another citation bias has come under investigation, namely, ‘citation amnesia’, according to which authors tend to be biased in terms of newer paper, ‘forgetting’ the older knowledge accumulated in a scientific field (Singh et al., 2023; Bollmann and Elliott, 2020). Citation amnesia has been discussed especially for the field of natural language processing (NLP), one of the currently most dynamics subfields of artificial intelligence (AI) (Eger et al., 2023; Zhang et al., 2023). For example, Singh et al. (2023) find that more than 60% of all citations in NLP papers are from the 5 years preceding a publication and the trend has become considerably worse since 2014; allegedly, current NLP papers are at an “all-time low” of citation age diversity.
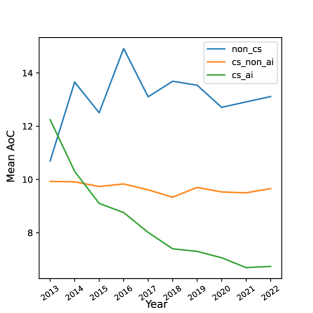
In this paper, we take a broader perspective, and examine the age of citations, over time, across different (quantitative) scientific fields. In particular, we examine how the age of the bibliography has developed in the last ten years (from 2013 to 2022) in the science subfields of computer science, physics, mathematics, economics, electrical engineering, quantitative finance, quantitative biology, and statistics. To do so, we leverage arXiv, an extremely popular pre-print server for science, which offers a comparative collection of volumes of papers. We aggregate our different subfields into three classes: (i) AI related papers as a subset of computer science (CS), (2) non-AI CS papers and (3) non-CS papers. We find distinctive trends for the three classes. Non-CS papers have an increasing trend (on average) of citation age in their bibliography: this is expected if we assume that papers reference other papers to a large degree uniformly across time (in which case the average age of citations will increase as science progresses, as there are older papers to cite each year). CS non-AI papers have a flat trend, i.e., the age of the bibliography has stayed constant across the 10 year period. In contrast, CS AI papers have a strongly decreasing trend, i.e., the age of citations drastically reduces over the ten year period and roughly satisfies an exponential decay: e.g., the average age of citations reduces from 12 years in 2013 to below 7 in 2022. This holds true for all four AI subfields we examine: NLP, Computer Vision (CV), Machine Learning and AI proper. Our findings question the previous assessment of ‘citation amnesia in NLP’: instead, it suggests that the (most) dynamic subfields of AI are particularly susceptible to citation age decay and this may especially be a function of the dynamicity of the field. This makes sense: if a field is very dynamic, new knowledge becomes available quickly, and past knowledge becomes outdated quickly and cited less frequently. Thus, we believe that the citation amnesia property is a trait exhibited by all very dynamic scientific fields and the fact that citation age patterns have changed in NLP is a property of the changing state of the NLP community (Jurgens et al., 2018; Beese et al., 2023; Schopf et al., 2023).
2 Related work
Scientometrics studies quantitative characteristics of science. Citations are one of its core concerns.
For instance, Rungta et al. (2022) show that there is a lack of geographic diversity in NLP papers. Similarly, Zhang et al. (2023) find a dominance of US industry in most heavily cited AI arXiv papers and an underrepresentation of Europe. Wahle et al. (2023) show that NLP papers recently tend to disproportionately cite papers within the community itself
Mohammad (2020) study gender gap in NLP research. Other popular aspects of citations investigated in previous work are citation polarity (e.g., is a paper positively or negatively cited) (Abu-Jbara et al., 2013; Catalini et al., 2015) and citation intent classification (Cohan et al., 2019). Besides classification, generation for science has recently become popular, including review generation (Yuan et al., 2022), automatic title generation (Mishra et al., 2021; Chen and Eger, 2022) and generation of high-quality scientific vector graphics (Belouadi et al., 2023).
The papers most closely related to ours are Bollmann and Elliott (2020) and Singh et al. (2023). Bollmann and Elliott (2020) look at a 10 year period (2010-2019) and find that more recent papers, published between 2017 and 2019 have a younger bibliography, compared to papers published earlier in the decade. Singh et al. (2023) confirm this trend, looking at a larger time frame of publications, encompassing 70k+ papers, showing that NLP papers had an increasingly aging bibliography in the period from 1990 to 2014, but the trend reversed then,111Somewhat unsurprisingly, 2014 is intuitively the time that the deep learning revolution has gained traction in NLP following papers such as word2vec (Mikolov et al., 2013). and provide additional analyses. In contrast, Verstak et al. (2014) show with the digital age, older papers also allow to be found more easily, increasing the chance that they will be cited. Parolo et al. (2015) point out that the impact of a paper follows a pattern, which increases a year after it is published, reaches its peaks and decreases exponentially. Mukherjee et al. (2017) study an interesting relation of a paper’s bibliography to its future success: apparently successful papers have low mean but high variance in their bibliography’s age distribution.
Our own work connects to the above named as follows: our critical insight is that the age distribution of a bibliography may depend on (1) time and (2) the scientific field considered. Only by setting NLP in relation to other fields can we analyze extents of biases in citation distributions. To do so, we analyze the age distribution of 300k papers submitted to Arxiv in the last 10 years (2013-2022), spread out across 15 different scientific fields. Looking at arxiv is justified because arxiv has become an extremely popular preprint server for science since its dawn in the early 1990s222See https://info.arxiv.org/help/stats/2021_by_area/index.html. that hosts several of the most influential science papers (Eger et al., 2023; Zhang et al., 2023; Clement et al., 2019; Eger et al., 2018) made available at much faster turnaround times than in traditional conferences or journals.
3 Dataset
We describe the source from which we extract our dataset333https://drive.google.com/drive/u/0/folders/1k0GOvi9-m5Hrs4EO6O6iuskJOV7Oq5cl and the steps we perform to construct our dataset, which we make available at https://github.com/nguyenviethoa95/citationAge.
Data Source
We create our dataset leveraging arXiv and Semantic Scholar. arXiv444https://arXiv.org/ is an extremely popular open access pre-print server focusing on ‘hard sciences’ like mathematics, physics and computer science, along with other quantitative disciplines such as biology and economics. It currently hosts more than two million articles in eight subject areas. Semantic Scholar555https://www.semanticscholar.org/ is a free and open access database developed by the Allen Institute for Artificial Intelligence. It employs machine learning technology to index scientific literature, extract the metadata from the paper content, and perform further analysis on the metadata. As of January 2023, the number of records in Semantic Scholar is more than 200 million, which includes 40 million papers from computer science disciplines.
Subcategory Selection
For computational reasons, we do not focus on the whole of arXiv but only on manageable subsets. arXiv papers are sorted into eight main categories: computer science, economics, electrical engineering, math, physics, quantitative biology, quantitative finance and statistics.666See https://arXiv.org/category_taxonomy. Each category is further divided into sub-categories, e.g., cs.CL stands for computation & language (NLP) within the computer science main category. For each of the main categories, we choose the subcategories containing the highest number of papers, see the appendix. An exception is the main category of computer science, which is our focus. In particular, along with cs.CL, we also choose seven other sub-categories from CS. We distinguish (1) cs-non-ai from (2) cs-ai papers. The latter contain papers submitted to AI related fields (Computer Vision, AI, NLP, Machine Learning), the former contains papers submitted to non-AI related fields (such as data structures and algorithms).
| Category | Subcat. | Description | Full-name | Number | Total |
|---|---|---|---|---|---|
| cs-non-ai | cs.CR | Computer Science | Cryptography and Security | ||
| cs.IT | Computer Science | Information Theory | |||
| cs.NI | Computer Science | Networking and Internet Architecture | |||
| cs.DS | Computer Science | Data Structures and Algorithms | |||
| cs-ai | cs.AI | Computer Science | Artificial Intelligence | ||
| cs.CV | Computer Science | Computer Vision and Pattern Recognition | |||
| cs.LG | Computer Science | Machine Learning | |||
| cs.CL | Computer Science | Computation and Language | |||
| non-cs | math.AP | Mathematics | Analysis of PDEs | ||
| econ.GN | Economics | General Economics Economics | |||
| eess.SP | Electrical Engineering | Signal Processing | |||
| hep-ph | Physics | High Energy Physics - Phenomenology | |||
| q-bio.PE | Quantitative Biology | Populations and Evolution | |||
| q-fin.ST | Quantitative Finance | Statistical Finance | |||
| stat.ME | Statistics | Methodology |
Data Collection
We collect papers within the period of 10 years between January 2013 and December 2022. Thereby, we make use of the arXiv dataset hosted by kaggle777https://www.kaggle.com/datasets/Cornell-University/arXiv, which offers an easier way to access metadata of the actual corpus. The metadata consists of relevant attributes of a scholarly paper such as title, authors, categories, abstract, and date of publication. However, the reference papers from the bibliography are not listed in this metadata.
Thus, we extract the list of references from Semantic Scholar. In particular, we use the arXiv ID to query the Semantic Scholar API888https://www.semanticscholar.org/product/api, search for the paper and retrieve the list of reference papers in the bibliography. Importantly, each paper can be assigned to multiple categories, however, we only use the primary category to sort papers into our dataset.
Data statistics
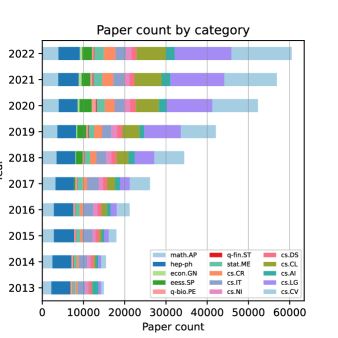
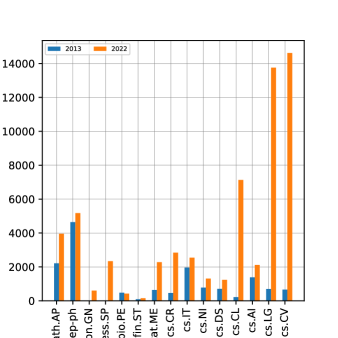
Our final dataset comprises 8 main categories with 15 sub-categories of scientific papers along with their metadata and their corresponding list of references in the period from January 2013 until December 2022. Our dataset is summarized in Table 1. We notice that computer science, mathematics, and physics attract the largest number of paper submissions by far. Also, the total number of CS AI submissions (139k) is more than double the non-AI related CS submissions (60k), as shown in Table 1. In 2022, the number of CS AI papers (37,626) is considerably more than the number of non-AI CS papers (6,752) and non CS papers (19,297) combined, see Figure 1 and Tables 4 and 5. The same is not true for earlier time periods, e.g., in 2013, there were only CS AI submissions but CS non-AI submissions and non-CS submissions. This indicates that AI has been growing most strongly in our data. Figure 2 demonstrates the difference in the development of research output in our dataset by plotting the numbers of papers submitted to arXiv in 2013 and 2022. We observe that the most fast growing fields are indeed computer science fields with AI focus. Among the AI related field, cs.CL (Computer Linguistics) has the highest growth rate of almost 32-times (219 submissions in 2013 to above 7k submissions in 2023), followed by cs.CV (Computer Vision) at 22-times and cs.LG (Machine Learning) at 20-times, see Figure 2 and Tables 4 and 5. We note that econ.GN and eess.SP have very low support for the years 2013 to 2017, making statistics on them more unreliable.
4 Analysis
| year | cs.CR | cs.IT | cs.NI | cs.DS | cs.AI | cs.CL | cs.CV | cs.LG |
|---|---|---|---|---|---|---|---|---|
| 2013 | 9.71 | 9.7 | 7.33 | 12.95 | 17.61 | 10.9 | 9.54 | 10.91 |
| 2014 | 9.37 | 9.83 | 7.27 | 13.15 | 12.21 | 9.94 | 9.09 | 9.95 |
| 2015 | 8.85 | 9.85 | 6.87 | 13.36 | 10.82 | 8.52 | 7.73 | 9.32 |
| 2016 | 9.11 | 9.81 | 7.14 | 13.25 | 9.91 | 7.68 | 8.67 | 8.76 |
| 2017 | 8.31 | 9.77 | 6.97 | 13.37 | 9.36 | 7.43 | 6.8 | 8.44 |
| 2018 | 7.88 | 9.18 | 6.74 | 13.52 | 8.72 | 6.78 | 6.1 | 7.96 |
| 2019 | 7.88 | 9.82 | 6.76 | 14.33 | 8.74 | 6.59 | 6.02 | 7.83 |
| 2020 | 7.39 | 9.5 | 6.85 | 14.37 | 8.31 | 6.3 | 5.94 | 7.68 |
| 2021 | 7.47 | 9.76 | 6.66 | 14.08 | 7.33 | 6.13 | 5.82 | 7.46 |
| 2022 | 7.59 | 10.01 | 6.77 | 14.23 | 7.24 | 6.15 | 5.93 | 7.61 |
| year | q-bio.PE | q-fin.ST | stat.ME | hep-ph | math.AP | econ.GN | eess.SP |
|---|---|---|---|---|---|---|---|
| 2013 | 13.98 | 13.29 | 13.26 | 10.34 | 14.93 | 0 | 9.03 |
| 2014 | 13.28 | 13.36 | 13.43 | 10.96 | 15.21 | 13.2 | 16.12 |
| 2015 | 14.6 | 13 | 13.64 | 11.19 | 15.09 | 14.47 | 5.53 |
| 2016 | 15.01 | 14.59 | 13.68 | 11.56 | 15.33 | 23.27 | 10.96 |
| 2017 | 14.62 | 15.41 | 14.09 | 12.25 | 15.74 | 10 | 9.59 |
| 2018 | 14.79 | 14.09 | 14.54 | 12.05 | 16.05 | 14.98 | 9.28 |
| 2019 | 15.17 | 14.26 | 14.73 | 12.41 | 16.29 | 13.43 | 8.45 |
| 2020 | 11.68 | 12.62 | 14.3 | 13.08 | 16.48 | 12.62 | 8.12 |
| 2021 | 12.81 | 12.59 | 14.4 | 13.14 | 16.5 | 12.59 | 8.33 |
| 2022 | 14.61 | 11.71 | 14.68 | 13.66 | 17.17 | 11.71 | 8.22 |
In this section, we use the dataset constructed in Section 3 to perform different temporal analyses on the references of scientific papers. In particular, we focus on investing how the gap between a cited paper and the original papers has changed over a decade from 2013 to 2022.
4.1 Metrics
To examine the change in the trends of referencing of old papers, we use the metrics described below. Our notation is inspired by Singh et al. (2023).
Age of Citation
The age AoC of a citation in a paper can be defined as the difference between the year of publication (YoP) of both:
Using this, we calculate the mean age of the references of a paper as:
Finally, when we have papers published in a year , we calculate the average over all papers to obtain the mean citation age in year :
Percentage of old citations
We calculate the percentage of old citations as the percentage of the ‘old’ (published at least years before the citing paper) references in a paper:
where is the set of references whose publication age is years older than that of the citing paper . From this formula, we can again compute the mean percentage of old papers over any given year with papers, as follows:
4.2 Mean and median age of citations
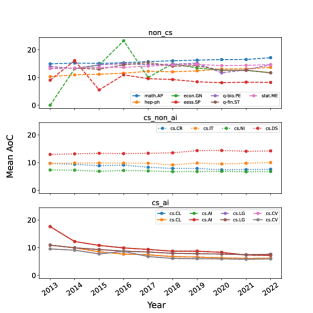
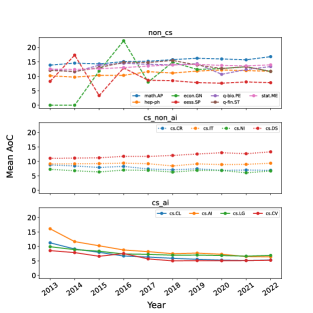
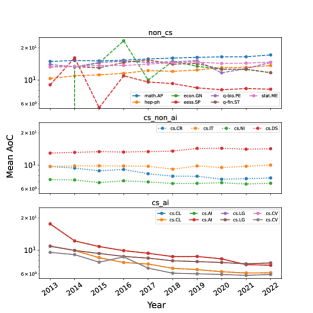
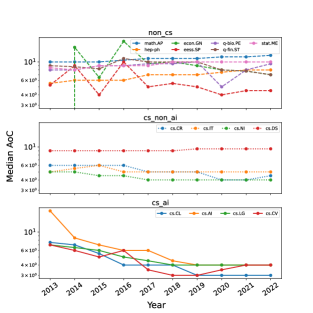
To examine the change in the age of cited papers over the different fields, we calculate the mean age of the papers by year and plot this in Figure 3 and Tables 2 and 3. There is a large discrepancy between the mean age of citations across different categories.
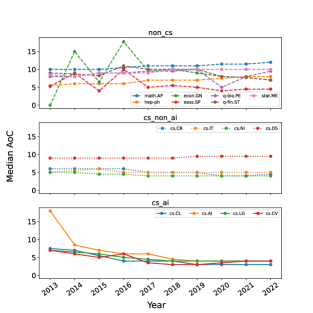
For example, cs.CL (NLP) has decreased from in 2013 to in 2022 — a decrease of 44%. The other AI related fields show similar decreases: cs.AI has decreased by 59% from in 2013 to in 2022, cs.CV by 38% from to and cs.LG by 30% from to . The average decrease of mean age of citations for CS AI categories between 2013 and 2022 is 43%. The average yearly rate of decrease in CS AI categories is 6%;999By this, we mean the average over the ratios where , for . in other words, the age of citations in a typical CS AI paper decreases by 6% on average from year to year, in the indicated time frame. In contrast, the four non-AI CS fields in our collection have a maximum decrease of 22% (cs.CR) and two out of four fields have even a small increase (cs.IT and cs.NI) of up to 10%. The average decrease of mean age of citations between 2013 and 2022 for CS non-AI categories is 4%; the average yearly rate of decrease is 0.5%. Concerning the non-CS fields, 4 out of 7 show an increase in citation age between 2013 and 2022 (q-bio.PE, stat.ME, math.AP, hep-ph). The average decrease of mean age of citations for non-CS categories between 2013 and 2022 is -4% (i.e., an increase of 4%) and the average yearly rate of decrease is -3%. Similarly, Figure 3 depicts the median age of citations — the median is less affected by outliers. We observe the same pattern as for the mean, indicating that outliers do not influence our results. In fact, the Pearson correlation between CS categories is 93% (median vs. mean) and it is 88% for non CS categories. The decreases in CS AI categories are more extreme: on average, the yearly rate of decrease in AoC is 8%, while it is 1% for CS non-AI categories. For non-CS categories, it is -4%.
Figure 4 shows the bibliography age dynamics from 2013 to 2022 averaged over CS AI, CS non-AI and non-CS papers.
4.3 Percentage of old citations
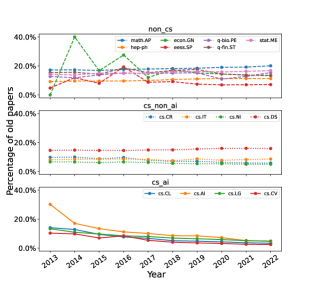
The percentage of old papers follows a similar trend across our three high-level categories: cs-ai fields have decreased by 75% on average between 2013 and 2022 in terms of the proportion of old citations; cs-non-ai fields have decreased by 33% and non-cs fields have decreased by -7%. The Pearson correlation between CS categories is 88% (mean AOC vs. PoOC) and that of non-CS categories is 72%. For example, cs.CL had 14% of all citations as old citations in 2013, but below 4% in 2022. cs.AI is again the most extreme: it decreases from 30% in 2013 to below 5% in 2022. Details can be found in Tables 8 and 9.
4.4 Mean citation age of influential papers
In addition, we investigate how the age of the influential references cited in a paper has changed over our time period. A citation is considered “highly influential” if it has major impact on the citing paper. The identification of these “highly influential” papers is done based on machine learning algorithms developed by Semantic Scholar, which uses multiple criteria for calculation. The major criterion is the number of times the citation occurs in the full text and the surrounding text around the citation. Here, we calculate the mean of old citations within the “highly influential” citations. Figure 6 plots the temporal change of the age difference between the influential citations within a publication and the publication itself.
Firstly, the mean AoC of influential citations is typically lower than the normal mean AoC in all fields and subcategories over the years. For example, cs.CV has and , while its influential mean AoC are and , which are lower than the normal mean AoC of the same year. On average, the influential citations are 0.8 years younger than the average citations. This makes intuitively sense: the references that really influence a given paper are more recent. Secondly, the temporal changes of the mean AoC of influential citations of all fields is similar to the changes of mean AoC of all citations. For example, the mean age of citations in CS AI categories has decreased by 46% on average between 2013 and 2022 (it is worth pointing out that the decrease has slowed down, however, in recent years), the CS non-AI categories have largely remained unchanged (decrease of 2%), and the non-CS categories have decreased by -6.5%. Details can be found in Tables 10 and 11 in the appendix.
5 Discussion
Our results — regarding the mean and median age of (influential) citations as well as the percentage of old citations — in the previous section all point in the same direction: the age of the bibligraphy in the CS AI subfields we examined has considerably decreased over the years we considered. In this respect, the AI subfields behave very differently from non-CS and non-AI fields.
We illustrate the differences between the fields we consider in Figure 7. There, we plot the yearly average citation increases (negative numbers denote decreases) vs. the median yearly submission increases of each field; the latter is an indicator of the dynamicity of the field. We normalize all numbers to to ensure comparability using . CS AI fields have clearly distinct patterns: they have high decreases in yearly average age of citations and high yearly increases of submission numbers to arxiv. The more established CS fields are less dynamic: their submission numbers grow slowly or even decrease over the decade considered and, simultaneously, their bibliography age is also relatively stable over the time period. Non-CS fields typically have positive yearly average age of citation increases and most strongly decreasing submission numbers (e.g., hep-ph and math.AP have largely stagnated in the last few years or slightly decreased); an exception are eess.SP and econ.GN. We note, however, that (1) these two subfields have comparatively low numbers of submissions, making statistics less reliable, and (2) it may not have been common (e.g.) in economics to submit papers to arxiv before 2018, so increases in submissions may actually not reflect the dynamicity of the field but behavioral changes in that community.
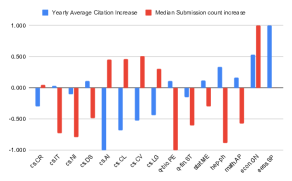
From this broader perspective, it is unclear whether there is a citation age bias specifically in NLP. Our results indicate that NLP is simply another field like other AI fields which are all characterized by high dynamicity, i.e., many newly incoming researchers (and submissions) and quickly changing state-of-the-art solutions.101010A case in point is the area of evaluation metrics in NLP, which has been dominated by models developed in the early 2000s (Papineni et al., 2002; Lin, 2004) for a long time, but has then been quickly superseded by a much higher-quality class of metrics since the late 2010s (Zhao et al., 2019; Zhang et al., 2020; Rei et al., 2020; Sellam et al., 2020; Chen and Eger, 2023) whose high citation rates document the community’s fast & wide-scale adoption in recent years. In such an environment, the observed changes in the age of the bibliography may simply be a ‘natural’ response.
6 Concluding remarks
We examined the age of the bibliography across 15 different scientific fields in a dataset of papers submitted to Arxiv in the time period from 2013 to 2022. We found that the dynamic AI fields are all affected by a decreasing age of bibliography over the considered time period, while more established fields do not show the same trend. We believe that this trend is very natural: for example, according to https://aclweb.org/aclwiki/Conference_acceptance_rates, the submission rates to the main ACL conference(s) have increased five-fold between 2013 and 2022, from 664 submitted papers to 3378 papers. Thus, from the viewpoint of 2013 the year 2022 can be perceived of encompassing “5 years”. If we take this increase in submissions and money invested into account,111111See https://www.goldmansachs.com/intelligence/pages/ai-investment-forecast-to-approach-200-billion-globally-by-2025.html, especially from the big US AI companies (Zhang et al., 2023), it is clear that the age of citations must become younger. While we expect that 2023 has seen additional rejuventation of the bibliography, mainly due to ChatGPT and the LLM revolution (Bubeck et al., 2023; Leiter et al., 2023), our numbers and graphs appear to imply that this trend of decreasing age of citations may soon reach a bottom: for example, there is only a marginal difference in the mean age of citations in the four AI fields we considered between 2020, 2021, and 2022 — such a pattern is expected in exponential decays, in which the rate of decrease is proportional to the current value.
We thus want to express a word of caution in interpreting statistical trends as bias (that pertain to particular communities), a tendency that may be fueled by the NLP community’s increasing self-absorbedness and in-group bias (Wahle et al., 2023).
Future work should look at the age of citations in more scientific disciplines, published in varying outlets, and across larger time frames. Future work should also develop statistical models of the age of citations in a paper’s bibliography to determine statistical bias, defined as the deviation from the expected value.
Limitations
We (and others) obtain citation information from SemanticScholar, but we observe that this engine — like other engines — is error-prone. For a quality check, we manually verify a random subset of our dataset and compare the reference list of data from SemanticScholar to the manually annotated references. We identify some of the common error made by SemanticScholar as follows. (a) Missing reference: the reference in the paper is missing from the list provided by SemanticScholar. (b) Wrongly assigned reference: The reference listed by SemanticScholar does not match with the reference listed in the full-text. Moreover, we notice that the errors do not occur equally in all types of publications. For instance, publications from large international conferences and journals seemingly may not suffer as much. Additionally, older publications also seem to suffer more heavily. This may be due to the SemanticScholar parsing algorithm, which may be trained on tuned on particular data. Other limitations relate to the Kaggle arxiv snapshot which may not contain all arxiv papers.
We believe, however, that our results are trustworthy, because individual errors tend to cancel out on an aggregate level, which we exclusively report in our work. Furthermore, even medium-size subsets of data are often sufficient to report accurate aggregate statistics.
Acknowledgements
The NLLG group is supported by the BMBF grant Metrics4NLG as well as the DFG Heisenberg grant EG 375/5–1.
References
- Abu-Jbara et al. (2013) Amjad Abu-Jbara, Jefferson Ezra, and Dragomir Radev. 2013. Purpose and polarity of citation: Towards NLP-based bibliometrics. In Proceedings of the 2013 Conference of the North American Chapter of the Association for Computational Linguistics: Human Language Technologies, pages 596–606, Atlanta, Georgia. Association for Computational Linguistics.
- Beese et al. (2023) Dominik Beese, Begüm Altunbaş, Görkem Güzeler, and Steffen Eger. 2023. Did AI get more negative recently? Royal Society Open Science, 10(3):221159.
- Belouadi et al. (2023) Jonas Belouadi, Anne Lauscher, and Steffen Eger. 2023. Automatikz: Text-guided synthesis of scientific vector graphics with tikz. ArXiv, abs/2310.00367.
- Bollmann and Elliott (2020) Marcel Bollmann and Desmond Elliott. 2020. On forgetting to cite older papers: An analysis of the ACL Anthology. In Proceedings of the 58th Annual Meeting of the Association for Computational Linguistics, pages 7819–7827, Online. Association for Computational Linguistics.
- Bubeck et al. (2023) Sébastien Bubeck, Varun Chandrasekaran, Ronen Eldan, John A. Gehrke, Eric Horvitz, Ece Kamar, Peter Lee, Yin Tat Lee, Yuan-Fang Li, Scott M. Lundberg, Harsha Nori, Hamid Palangi, Marco Tulio Ribeiro, and Yi Zhang. 2023. Sparks of artificial general intelligence: Early experiments with gpt-4. ArXiv, abs/2303.12712.
- Catalini et al. (2015) Christian Catalini, Nicola Lacetera, and Alexander Oettl. 2015. The incidence and role of negative citations in science. Proceedings of the National Academy of Sciences, 112(45):13823–13826.
- Chen and Eger (2022) Yanran Chen and Steffen Eger. 2022. Transformers go for the lols: Generating (humourous) titles from scientific abstracts end-to-end. ArXiv, abs/2212.10522.
- Chen and Eger (2023) Yanran Chen and Steffen Eger. 2023. MENLI: Robust evaluation metrics from natural language inference. Transactions of the Association for Computational Linguistics, 11:804–825.
- Clement et al. (2019) Colin B. Clement, Matthew Bierbaum, Kevin P. O’Keeffe, and Alexander A. Alemi. 2019. On the use of arxiv as a dataset. ArXiv, abs/1905.00075.
- Cohan et al. (2019) Arman Cohan, Waleed Ammar, Madeleine van Zuylen, and Field Cady. 2019. Structural scaffolds for citation intent classification in scientific publications. In Proceedings of the 2019 Conference of the North American Chapter of the Association for Computational Linguistics: Human Language Technologies, Volume 1 (Long and Short Papers), pages 3586–3596, Minneapolis, Minnesota. Association for Computational Linguistics.
- Eger et al. (2023) Steffen Eger, Christoph Leiter, Jonas Belouadi, Ran Zhang, Aida Kostikova, Daniil Larionov, Yanran Chen, and Vivian Fresen. 2023. Nllg quarterly arxiv report 06/23: What are the most influential current ai papers? ArXiv, abs/2308.04889.
- Eger et al. (2018) Steffen Eger, Chao Li, Florian Netzer, and Iryna Gurevych. 2018. Predicting research trends from arxiv. ArXiv, abs/1903.02831.
- Fister Jr et al. (2016) Iztok Fister Jr, Iztok Fister, and Matjaž Perc. 2016. Toward the discovery of citation cartels in citation networks. Frontiers in Physics, 4:49.
- Gøtzsche (2022) Peter C Gøtzsche. 2022. Citation bias: questionable research practice or scientific misconduct? Journal of the Royal Society of Medicine, 115(1):31–35. PMID: 35105192.
- Jurgens et al. (2018) David Jurgens, Srijan Kumar, Raine Hoover, Dan McFarland, and Dan Jurafsky. 2018. Measuring the evolution of a scientific field through citation frames. Transactions of the Association for Computational Linguistics, 6:391–406.
- Leiter et al. (2023) Christoph Leiter, Ran Zhang, Yanran Chen, Jonas Belouadi, Daniil Larionov, Vivian Fresen, and Steffen Eger. 2023. Chatgpt: A meta-analysis after 2.5 months. ArXiv, abs/2302.13795.
- Lerman et al. (2022) Kristina Lerman, Yulin Yu, Fred Morstatter, and Jay Pujara. 2022. Gendered citation patterns among the scientific elite. Proceedings of the National Academy of Sciences, 119(40):e2206070119.
- Lin (2004) Chin-Yew Lin. 2004. ROUGE: A package for automatic evaluation of summaries. In Text Summarization Branches Out, pages 74–81, Barcelona, Spain. Association for Computational Linguistics.
- Mikolov et al. (2013) Tomas Mikolov, Ilya Sutskever, Kai Chen, Greg S Corrado, and Jeff Dean. 2013. Distributed representations of words and phrases and their compositionality. In Advances in Neural Information Processing Systems, volume 26. Curran Associates, Inc.
- Mishra et al. (2021) Prakhar Mishra, Chaitali Diwan, Srinath Srinivasa, and Gopalakrishnan Srinivasaraghavan. 2021. Automatic title generation for text with pre-trained transformer language model. 2021 IEEE 15th International Conference on Semantic Computing (ICSC), pages 17–24.
- Mohammad (2020) Saif M. Mohammad. 2020. Gender gap in natural language processing research: Disparities in authorship and citations. In Proceedings of the 58th Annual Meeting of the Association for Computational Linguistics, pages 7860–7870, Online. Association for Computational Linguistics.
- Mukherjee et al. (2017) Satyam Mukherjee, Daniel M. Romero, Ben Jones, and Brian Uzzi. 2017. The nearly universal link between the age of past knowledge and tomorrow’s breakthroughs in science and technology: The hotspot. Science Advances, 3(4):e1601315.
- Papineni et al. (2002) Kishore Papineni, Salim Roukos, Todd Ward, and Wei-Jing Zhu. 2002. Bleu: a method for automatic evaluation of machine translation. In Proceedings of the 40th Annual Meeting of the Association for Computational Linguistics, pages 311–318, Philadelphia, Pennsylvania, USA. Association for Computational Linguistics.
- Parolo et al. (2015) Pietro Della Briotta Parolo, Raj Kumar Pan, Rumi Ghosh, Bernardo A. Huberman, Kimmo Kaski, and Santo Fortunato. 2015. Attention decay in science. Journal of Informetrics, 9(4):734–745.
- Rei et al. (2020) Ricardo Rei, Craig Stewart, Ana C Farinha, and Alon Lavie. 2020. COMET: A neural framework for MT evaluation. In Proceedings of the 2020 Conference on Empirical Methods in Natural Language Processing (EMNLP), pages 2685–2702, Online. Association for Computational Linguistics.
- Rungta et al. (2022) Mukund Rungta, Janvijay Singh, Saif M. Mohammad, and Diyi Yang. 2022. Geographic citation gaps in NLP research. In Proceedings of the 2022 Conference on Empirical Methods in Natural Language Processing, pages 1371–1383, Abu Dhabi, United Arab Emirates. Association for Computational Linguistics.
- Schopf et al. (2023) Tim Schopf, Karim Arabi, and Florian Matthes. 2023. Exploring the landscape of natural language processing research. In Proceedings of the 14th International Conference on Recent Advances in Natural Language Processing, pages 1034–1045, Varna, Bulgaria. INCOMA Ltd., Shoumen, Bulgaria.
- Seeber et al. (2019) Marco Seeber, Mattia Cattaneo, Michele Meoli, and Paolo Malighetti. 2019. Self-citations as strategic response to the use of metrics for career decisions. Research Policy, 48(2):478–491.
- Sellam et al. (2020) Thibault Sellam, Dipanjan Das, and Ankur Parikh. 2020. BLEURT: Learning robust metrics for text generation. In Proceedings of the 58th Annual Meeting of the Association for Computational Linguistics, pages 7881–7892, Online. Association for Computational Linguistics.
- Singh et al. (2023) Janvijay Singh, Mukund Rungta, Diyi Yang, and Saif Mohammad. 2023. Forgotten knowledge: Examining the citational amnesia in NLP. In Proceedings of the 61st Annual Meeting of the Association for Computational Linguistics (Volume 1: Long Papers), pages 6192–6208, Toronto, Canada. Association for Computational Linguistics.
- Verstak et al. (2014) Alex Verstak, Anurag Acharya, Helder Suzuki, Sean Henderson, Mikhail Iakhiaev, Cliff Chiung-Yu Lin, and Namit Shetty. 2014. On the shoulders of giants: The growing impact of older articles. CoRR, abs/1411.0275.
- Wahle et al. (2023) Jan Philip Wahle, Terry Ruas, Mohamed Abdalla, Bela Gipp, and Saif Mohammad. 2023. We are who we cite: Bridges of influence between natural language processing and other academic fields. In Proceedings of the 2023 Conference on Empirical Methods in Natural Language Processing, pages 12896–12913, Singapore. Association for Computational Linguistics.
- Yuan et al. (2022) Weizhe Yuan, Pengfei Liu, and Graham Neubig. 2022. Can we automate scientific reviewing? J. Artif. Int. Res., 75.
- Zhang et al. (2023) Ran Zhang, Aida Kostikova, Christoph Leiter, Jonas Belouadi, Daniil Larionov, Yanran Chen, Vivian Fresen, and Steffen Eger. 2023. Nllg quarterly arxiv report 09/23: What are the most influential current ai papers?
- Zhang et al. (2020) Tianyi Zhang, Varsha Kishore*, Felix Wu*, Kilian Q. Weinberger, and Yoav Artzi. 2020. Bertscore: Evaluating text generation with bert. In International Conference on Learning Representations.
- Zhao et al. (2019) Wei Zhao, Maxime Peyrard, Fei Liu, Yang Gao, Christian M. Meyer, and Steffen Eger. 2019. MoverScore: Text generation evaluating with contextualized embeddings and earth mover distance. In Proceedings of the 2019 Conference on Empirical Methods in Natural Language Processing and the 9th International Joint Conference on Natural Language Processing (EMNLP-IJCNLP), pages 563–578, Hong Kong, China. Association for Computational Linguistics.
Mathematics math.KT: 2357, math.HO: 2730, math.GN: 3041, math.GM: 3517, math.CT: 3722, math.SP: 4442, math.SG: 4545, math.MG: 5774, math.OA: 7677, math.AC: 7896, math.AT: 8375, math.QA: 8639, math.LO: 9016, math.CV: 9917, math.RA: 10173, math.GR: 13281, math.ST: 13682, math.RT: 14256, math.CA: 14420, math.GT: 14804, math.FA: 18708, math.DS: 21177, math.NA: 25910, math.DG: 27471, math.OC: 28331, math.NT: 30311, math-ph: 30693, math.AG: 33929, math.PR: 36838, math.CO: 42004, math.AP: 45244
Physics nlin.CG: 492, physics.atm-clus: 1194, physics.pop-ph: 1284, physics.space-ph: 2070, nlin.AO: 2575, physics.ed-ph: 2880, physics.hist-ph: 2982, physics.data-an: 3168, physics.ao-ph: 3229, physics.geo-ph: 3551, nlin.PS: 4156, physics.med-ph: 4190, physics.class-ph: 4580, nlin.SI: 4929, physics.acc-ph: 5883, physics.bio-ph: 5910, nlin.CD: 6334, cond-mat.other: 6667, physics.comp-ph: 7298, physics.app-ph: 8754, physics.gen-ph: 8809, physics.plasm-ph: 10456, physics.chem-ph: 10638, cond-mat.dis-nn: 11174, nucl-ex: 11274, cond-mat: 11357, physics.soc-ph: 11630, physics.atom-ph: 11784, cond-mat.quant-gas: 13037, physics.ins-det: 13492, astro-ph.IM: 16781, physics.flu-dyn: 17354, hep-lat: 17449, astro-ph.EP: 20736, hep-ex: 22250, cond-mat.soft: 26552, physics.optics: 26949, cond-mat.supr-con: 30384, nucl-th: 32395, astro-ph.HE: 36665, astro-ph.CO: 38030, cond-mat.stat-mech: 39292, astro-ph.SR: 40994, astro-ph.GA: 43058, cond-mat.str-el: 45949, cond-mat.mtrl-sci: 56895, cond-mat.mes-hall: 60482, astro-ph: 94246, quant-ph: 102221, hep-th: 102314, hep-ph: 128484
Economics econ.TH: 1377, econ.EM: 2112, econ.GN: 2638
Quantitative Biology q-bio.SC: 651, q-bio.OT: 777, q-bio.CB: 911, q-bio.TO: 1077, q-bio.GN: 1667, q-bio.MN: 2128, q-bio.BM: 2629, q-bio.QM: 4439, q-bio.NC: 5529, q-bio.PE: 6849
Quantitative Finance q-fin.EC: 384, q-fin.TR: 976, q-fin.PM: 1049, q-fin.CP: 1090, q-fin.RM: 1150, q-fin.PR: 1169, q-fin.MF: 1390, q-fin.GN: 1470, q-fin.ST: 1828
Statistics stat.OT: 600, stat.CO: 3419, stat.AP: 8462, stat.ML: 15435, stat.ME: 17378
Computer Sciences cs.GL: 106, cs.OS: 442, cs.MS: 980, cs.PF: 1040, cs.NA: 1083, cs.SC: 1170, cs.ET: 1857, cs.MM: 1939, cs.OH: 2002, cs.GR: 2179, cs.MA: 2280, cs.AR: 2531, cs.FL: 2693,cs.DL: 3165, cs.CE: 3271, cs.CG: 3943,cs.DM: 4408, cs.PL: 4479, cs.CC: 4786, cs.SY: 5130, cs.SD: 5397, cs.DB: 5487, cs.NE: 6011, cs.GT: 6678, cs.IR: 8590, cs.HC: 8696,cs.CY: 8947, cs.SI: 9236, cs.LO: 9690, cs.SE: 11333, cs.DC: 11981, cs.DS: 14338, cs.NI: 14662, cs.AI: 18871, cs.CR: 19266, cs.RO: 19594,cs.IT: 33285, cs.CL: 40190, cs.LG: 72867, cs.CV: 81633
Electrical Engineering and Systems Science eess.AS: 5250, eess.SY: 11174, eess.IV: 12161, eess.SP: 13722
| year | cs.CR | cs.IT | cs.NI | cs.DS | cs.AI | cs.CL | cs.CV | cs.LG |
|---|---|---|---|---|---|---|---|---|
| 2013 | ||||||||
| 2014 | ||||||||
| 2015 | ||||||||
| 2016 | ||||||||
| 2017 | ||||||||
| 2018 | ||||||||
| 2019 | ||||||||
| 2020 | ||||||||
| 2021 | ||||||||
| 2022 |
| year | q-bio.PE | q-fin.ST | stat.ME | hep-ph | math.AP | econ.GN | eess.SP |
|---|---|---|---|---|---|---|---|
| 2013 | |||||||
| 2014 | |||||||
| 2015 | |||||||
| 2016 | |||||||
| 2017 | |||||||
| 2018 | |||||||
| 2019 | |||||||
| 2020 | |||||||
| 2021 | |||||||
| 2022 |
| year | cs.CR | cs.IT | cs.NI | cs.DS | cs.AI | cs.CL | cs.CV | cs.LG |
|---|---|---|---|---|---|---|---|---|
| 2013 | 6 | 5 | 5 | 9 | 18 | 7.5 | 7 | 7 |
| 2014 | 6 | 5.5 | 5 | 9 | 8.5 | 7 | 6 | 6.5 |
| 2015 | 6 | 6 | 4.5 | 9 | 7 | 5.5 | 5 | 6 |
| 2016 | 6 | 5 | 4.5 | 9 | 6 | 4 | 6 | 6 |
| 2017 | 5 | 5 | 4 | 9 | 6 | 4 | 3.5 | 5 |
| 2018 | 5 | 5 | 4 | 9 | 4.5 | 4 | 3 | 4.5 |
| 2019 | 5 | 5 | 4 | 9.5 | 4 | 3 | 3 | 4 |
| 2020 | 4 | 5 | 4 | 9.5 | 4 | 3 | 3.5 | 4 |
| 2021 | 4 | 5 | 4 | 9.5 | 4 | 3 | 4 | 4 |
| 2022 | 4.5 | 5 | 4 | 9.5 | 4 | 3 | 4 | 4 |
| year | q-bio.PE | q-fin.ST | stat.ME | hep-ph | math.AP | econ.GN | eess.SP |
|---|---|---|---|---|---|---|---|
| 2013 | 8 | 9 | 8.5 | 5.5 | 10 | 0 | 5.25 |
| 2014 | 8 | 8.75 | 8 | 6 | 10 | 15 | 9 |
| 2015 | 9 | 8.25 | 9 | 6 | 10 | 6.5 | 4 |
| 2016 | 9 | 11 | 9 | 6 | 10.5 | 17.75 | 10 |
| 2017 | 9.5 | 10 | 9 | 7 | 11 | 9.5 | 5 |
| 2018 | 9.5 | 10 | 10 | 7 | 11 | 10 | 5.5 |
| 2019 | 10 | 10 | 10 | 7 | 11 | 9 | 5 |
| 2020 | 5 | 8 | 10 | 7.5 | 11.5 | 8 | 5 |
| 2021 | 8 | 7.75 | 10 | 8 | 11.5 | 7.75 | 4.5 |
| 2022 | 9.5 | 7 | 10 | 8 | 12 | 7 | 4.5 |
| year | cs.CR | cs.IT | cs.NI | cs.DS | cs.AI | cs.CL | cs.CV | cs.LG |
|---|---|---|---|---|---|---|---|---|
| 2013 | 9.8% | 8.09% | 6.63% | 14.59% | 30.15% | 14.04% | 10.34% | 13.36% |
| 2014 | 9.97% | 8.52% | 6.59% | 14.78% | 17.07% | 12.87% | 9.81% | 10.93% |
| 2015 | 8.78% | 8.5% | 6.16% | 14.56% | 13.43% | 9.48% | 9.81% | 9.72% |
| 2016 | 9.67% | 8.63% | 6.61% | 14.5% | 11.2% | 9.48% | 8.46% | 8.45% |
| 2017 | 7.70% | 8.28% | 6.26% | 14.87% | 10.09% | 8.03% | 5.39% | 6.77% |
| 2018 | 7.05% | 7.5% | 5.59% | 14.91% | 8.57% | 5.11% | 4.07% | 6.91% |
| 2019 | 7.05% | 8.71% | 5.38% | 15.52% | 8.46% | 4.78% | 3.57% | 6.45% |
| 2020 | 6.33% | 7.76% | 5.36% | 15.97% | 7.23% | 4.31% | 3.22% | 5.9% |
| 2021 | 5.9% | 8.26% | 5.01% | 16% | 5.19% | 3.67% | 2.63% | 5.12% |
| 2022 | 5.83% | 8.61% | 5.01% | 3.67% | 4.59% | 3.36% | 2.48% | 4.86% |
| year | q-bio.PE | q-fin.ST | stat.ME | hep-ph | math.AP | econ.GN | eess.SP |
|---|---|---|---|---|---|---|---|
| 2013 | 12.79% | 15.32% | 14.16% | 9.18% | 17.21% | 0% | 4.78% |
| 2014 | 11.81% | 15.64% | 13.8% | 9.6% | 17.32% | 40% | 11.95% |
| 2015 | 13.83% | 14.32% | 15.07% | 9.55% | 16.9% | 16.74% | 8% |
| 2016 | 15.18% | 18.64% | 14.83% | 9.64% | 17.59% | 27.57% | 19.35% |
| 2017 | 14.77% | 15.35% | 14.9% | 9.95% | 17.86% | 12.05% | 8.77% |
| 2018 | 15.11% | 16.88% | 16.07% | 10.64% | 18.18% | 17.37% | 9.2% |
| 2019 | 15.29% | 17.62% | 16.15% | 11.07% | 18.42% | 15.21% | 7.43% |
| 2020 | 10.92% | 14.45% | 15.86% | 11.3% | 19.04% | 14.45% | 6.95% |
| 2021 | 12.84% | 13.72% | 16.29% | 11.23% | 19.22% | 13.72% | 7.04% |
| 2022 | 15.39% | 13.37% | 16.78% | 11.27% | 20.11% | 13.37% | 7.14% |
| year | cs.CR | cs.IT | cs.NI | cs.DS | cs.AI | cs.CL | cs.CV | cs.LG |
|---|---|---|---|---|---|---|---|---|
| 2013 | 8.77 | 9.14 | 7.25 | 11.06 | 16.11 | 11.25 | 8.56 | 9.9 |
| 2014 | 8.41 | 9.14 | 6.77 | 11.13 | 11.67 | 9.12 | 7.87 | 8.9 |
| 2015 | 7.9 | 9.22 | 6.33 | 11.22 | 10.23 | 7.96 | 6.59 | 8.35 |
| 2016 | 8.26 | 9.4 | 7 | 11.75 | 8.77 | 6.7 | 7.55 | 7.39 |
| 2017 | 7.37 | 9.18 | 6.9 | 11.75 | 8.2 | 6.32 | 5.69 | 7.27 |
| 2018 | 7.07 | 8.42 | 6.29 | 12.04 | 7.49 | 5.9 | 5.01 | 6.97 |
| 2019 | 7.43 | 9.13 | 6.9 | 12.54 | 7.69 | 5.55 | 5.01 | 7.01 |
| 2020 | 6.9 | 9.13 | 6.85 | 12.99 | 7.29 | 5.27 | 5.05 | 6.86 |
| 2021 | 7 | 8.96 | 6.05 | 12.65 | 6.5 | 5.14 | 5.1 | 6.63 |
| 2022 | 6.9 | 9.36 | 6.67 | 13.3 | 6.4 | 5.29 | 5.1 | 6.89 |
| year | q-bio.PE | q-fin.ST | stat.ME | hep-ph | math.AP | econ.GN | eess.SP |
|---|---|---|---|---|---|---|---|
| 2013 | 12.48 | 12.03 | 12.49 | 10.18 | 13.86 | 0 | 8.25 |
| 2014 | 11.52 | 11.65 | 12.35 | 9.71 | 14.56 | 0 | 17.33 |
| 2015 | 13.84 | 13.01 | 12.63 | 10.32 | 14.27 | 11.83 | 3.33 |
| 2016 | 14.5 | 14.84 | 13.01 | 10.32 | 15.09 | 22.29 | 12.9 |
| 2017 | 14.14 | 14.76 | 13.52 | 11.61 | 15.19 | 8 | 8.61 |
| 2018 | 13.95 | 15.49 | 13.52 | 11.12 | 15.77 | 14.88 | 8.48 |
| 2019 | 14.36 | 13.89 | 14.12 | 11.8 | 16.23 | 12.37 | 7.81 |
| 2020 | 10.69 | 12.68 | 13.76 | 12.17 | 16 | 12.68 | 7.61 |
| 2021 | 12.33 | 13.3 | 13.61 | 11.97 | 15.69 | 13.3 | 8.05 |
| 2022 | 13.37 | 11.67 | 13.95 | 11.73 | 16.8 | 11.67 | 7.78 |