Dynamic Multi Color Switching using Ultrathin Vanadium Oxide on Aluminium based Asymmetric Fabry-Pérot Resonant Structure
Abstract
Vanadium dioxide () exhibits strong infrared optical switching due to its insulator-metal phase-transition property. However, in the visible wavelengths, it’s intrinsic optical switching is quite low. Current research explores solutions like multilayering, intricate structural patterning, high thermal budget processes and costly metals for improved color switching. Nonetheless, the color gamut coverage with these methodologies remains notably limited. This work overcomes these limitations and demonstrates dynamic multi-colour switching covering a large color gamut using a simple, unpatterned, ultrathin ( , where wavelength is taken as 575 nm at the center of visible spectrum) asymmetric Fabry-Pérot structure of on Aluminium (Al). We use the transfer matrix method to design the structure for maximum visible reflectance switching. films are synthesized using a simple, low thermal budget atmospheric oxidation of Vanadium (V). With varying oxidation durations, different colors of the oxidized samples are observed. Consistent and reversible color-switching is observed visibly and in reflectance measurements with the change in temperature from low (RT 30∘C) to high (HT 100∘C) or vice versa due to the phase transition property of the layer in the structure. Compared to the existing studies, this work shows a significant change in chromaticities and covers a large color gamut when plotted on the CIE chromaticity diagram. This work has potential applications in the fields of display, thermochromic structures, and visible camouflage.
Unknown University] Department of Electrical Engineering, Indian Institute of Technology Kanpur, Kanpur, 208016, U.P., India
1 Introduction
Dynamic/active color switching has received extensive research attention for its applications in smart glasses 1, 2, optical filters 3, 4, and display technology 5. Typically, active color switching has been achieved by liquid crystals, nanoscale plasmonic devices, and phase-change/phase-transition materials (PCM/PTM) 6. is one such PTM, which changes its crystal structure from monoclinic to rutile as it switches from insulating to metallic state at 7. This reversible transition can be induced electrically 8, thermally 9, optically 10, or through strain 11.
has shown significant optical switching in the infrared region () for different substrates like sapphire 12, 13, glass 14, ITO 14, silicon 15, etc. However, its optical switching is very low in the visible region ( 400 to 750 nm) of the electromagnetic spectrum 16, 17, 18. Various studies report subduing this limitation using multilayering, nanoscale patterning, doping, etc 19. For example in the simulation study by Song et al. 20, the multilayer structure of Ag nanoparticles, a thin layer of , and a thick Ag back mirror is reported for the dynamic color display. They predicted various colors like cyan, green, magenta, pink, blue, and aquamarine. Similarly, simulation work by K Wilson et al. 21 shows multiple color changes by planar thin film stacks. Shu et al. 22 proposed a structure having Ag nanodisks on thin film; different colors were predicted by tuning the spatial periodicity and diameter of the Ag nanodisks. An experimental study by Liwei Zhou et al. 23 uses Au nanoparticles & sandwiched structure () to demonstrate change in optical response for smart windows application. Sungjun In et al. 24 demonstrated the thermochromic behavior with self-organized gold network- (SGN-) hybrid film (). The deposited gold film is annealed to undergo a change in morphology to form SGN-Au. These changes cause morphological strain and changes in grain sizes in the layer. Depending on the thickness of and Au, multiple colors like aquamarine, yellow, cyan, purple, light-violet, magenta, etc., were reported. Similarly, Zhao J. et al. 25 report vivid structural colors with temperature generated by multilayer Ag//Al structure on rigid and flexible substrates. The thickness of and Ag layers was changed to control the color hue, saturation and brightness of the structure.
Most of the existing studies use multilayer structures, nano-scale features, or costly metals like Ag and Au in various forms to achieve better visible color switching with . However, opting for these approaches significantly adds to the process cost and complexity. In some cases, precise control of process parameters and high thermal budget annealings are involved, adding further limitations to these approaches. In this work, we design and fabricate a uniform /Al/sapphire structure for active color switching. Deposited Vanadium (V) thin film is oxidized in atmospheric conditions to synthesize thin films. Various colors are noticed during the oxidation process, and depending on the sample’s oxidation duration, different extent of color switching is obtained. Raman and reflectance measurements are used for the sample characterization. Samples containing are found to exhibit strong and reversible color switching as a function of temperature. Table 1 provides a synopsis of the comparison between this work and the aforementioned studies; the specifics of this work are presented in the following text.
2 Design and simulation
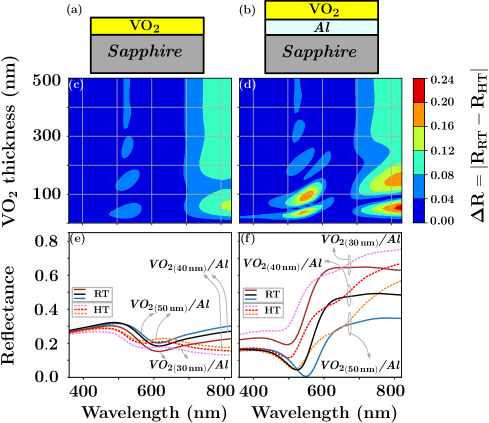
Standalone suffers from low optical switching in the visible region. To overcome this, we propose having Al as a back reflector, eliminating the transmission loss. The reflected signals from the Al top surface would lead to constructive and destructive interference effects. To find the optimum thickness of Al, the transfer matrix method (TMM) simulations are performed. Python TMM library is used for the simulations 28. The results show zero transmission loss after 50 nm of Al thickness; further details can be found in the supplementary material. We analyze the reflectance in the insulating and metallic phase of with varying thicknesses for the /Sapphire (S) and /Al/Sapphire (S) structures using the TMM. As mentioned earlier, is in the insulating phase at room temperature (RT) and transitions to the metallic phase at high temperature (HT) beyond . These phases have different refractive indices 27. The absolute difference between insulating and metallic phase reflectance (Reflectance switching ) is used to quantify the extent of optical switching. The two simulated structures, /S and /Al/S are shown in Fig. 1 (a) and 1 (b), respectively. Fig. 1 (c) and 1 (d) show the contour plots of the with respect to the wavelength and varying thicknesses of for the structures shown in Fig. 1(a) and 1 (b), respectively.
On comparing the results, it can be observed that /Al/S shows enhanced optical switching for smaller thickness ( 200 nm) than /S; the results also show two hotspots of near 95 nm and 40 nm of . This is due to Fabry–Pérot resonances or interference effects similar to those observed in conventional ultrathin dielectric-metal structures 25, 26. /Al/S behaves as an asymmetric Fabry-Pérot cavity leading to the two major hotspots around 500 to 600 nm wavelength range. In order to examine the potential for a color change, the reflectance spectral shift for different thicknesses of at RT and HT is analysed. Fig. 1 (e) and 1 (f) show the calculated reflectance spectra for 30 nm, 40 nm, and 50 nm of thickness for the structures illustrated in 1 (a) and 1 (b), respectively. Compared to /S, /Al/S shows a significant shift in the spectral position of the reflectance minima with changes in temperature and thicknesses of . A substantial change in color or chromaticity could be observed for /Al/S due to these spectral shifts. As the observed strength of reflectance change is similar for the two hotspot points, we have chosen 40 nm of for our experiments due to the lower thickness advantage.
3 Experimental Details
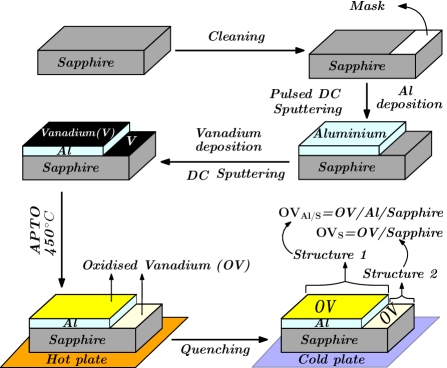
The process flow followed to fabricate the samples is shown in Fig. 2. First, the substrate (c-plane Sapphire) is cleaned with acetone and isopropyl alcohol in order to prepare for the depositions. For Al deposition, pulsed DC magnetron sputtering is utilized. Prior to deposition, a small mask was placed on the substrate to prevent the deposition of Al in that area. The sputtering power is kept at 30 W. Al films are deposited from a 2-inch diameter Al target for 30 minutes to achieve Al thickness of 50 nm. After unloading the sample, the mask is removed. Following that, thin metallic V films are deposited on Al and sapphire at room temperature by DC magnetron sputtering. A 4-inch diameter V target of 99.95% purity is used. The DC power is maintained at 90 W. The timing of the deposition is adjusted to achieve a V thickness of 20 nm (which will result in a film of 40 nm thickness after oxidation 29).
To oxidize the samples, atmospheric pressure thermal oxidation (APTO) 30 is used which involves oxidation of V in open atmosphere. The samples are placed one by one on a hot plate maintained at 450∘C for different oxidation times. After the desired oxidation duration (), they are quickly cooled to room temperature using a cold plate. Nine samples (labeled ) are prepared with varying ranging from 6 seconds to 5 minutes, and as a result, the structure of (oxidised vanadium (OV)/Al/sapphire) and (OV/sapphire) is achieved on the same sample for each oxidation duration. For structural characterization of the samples, Raman spectroscopy is performed using an excitation laser of wavelength 532 nm (Acton research corporation spectra pro 2500i). Visible optical reflectance is measured using Filmmetrics F20 spectrometer.
4 Results and Discussion
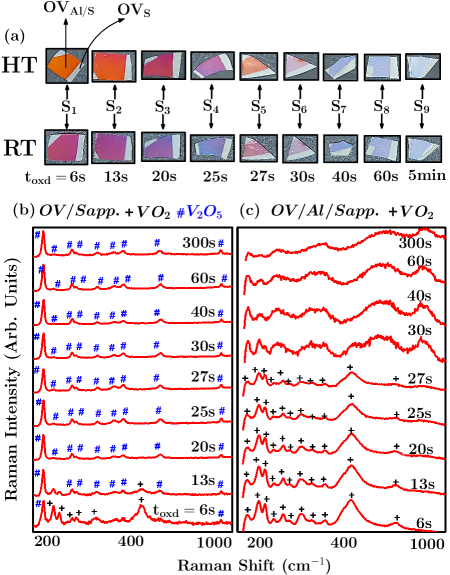
After fabrication, the effect of temperature on the color of the fabricated samples is analyzed. Camera images are taken while each sample is kept on the heating stage, initially maintained at RT ( 30∘C) and subsequently at HT ( 100∘C). Figure 3 (a) shows the RT and HT optical images for all the fabricated samples. The colored part of the samples corresponds to the structure, and the rectangular, silver-whitish part is .
The samples are cycled multiple times between RT and HT, and the observed colors are found to be consistent and reversible. From Fig. 3 (a), it can be seen that the area does not show any color change with temperature. However, for the , the 6 s to 27 s oxidation duration () samples () show significantly different colors at the two temperatures. The samples with of 30 s to 5 minutes () show no color change with temperature. The reversible color-switching videos of the 6 s and 27 s samples (between RT and HT) are included as supplementary material.
To understand the observed color-changing behavior, the samples are characterized using Raman and reflectance measurements. Fig. 3 (b) and 3 (c) show the Raman characterization results for the and structures, respectively. For (Fig. 3 (b)), the Raman peaks are observed for and (: 6 s and 13 s), and for higher Raman peaks are detected. This behaviour is consistent with existing studies where the oxidized samples of V/Sapphire report formation followed by formation 30, 32. For (Fig. 3 (c)), is present in samples to (: 6-27 s); from (: 30 s) onwards, no precise peaks of vanadium oxides are observed till 5 minutes of oxidation. The presence of the underneath Al layer might account for the variation in oxidation behaviour between the two structures. Comparing Fig. 3 (b) and 3 (c), it is evident that the rate of oxidation is slower in the samples than in . The wide peaks for samples - (: 30 s - 5 minutes) in could be attributed to the presence of amorphous vanadium oxides () 31, 33, 34. By correlating the observed Raman spectra with the corresponding sample’s optical images, it can be concluded that, for , only the -containing samples show color switching; others in which is present do not show visible color changes. In the case of , the inherently low optical switching for /sapphire and the presence of could be the reasons for no perceivable difference in visible color with temperature.
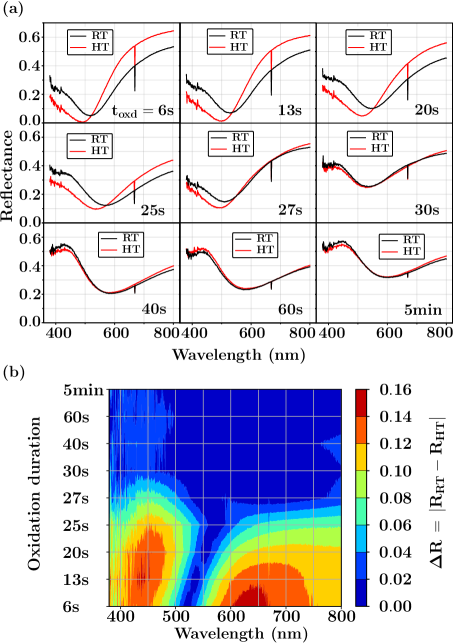
Next, the reflectance measurement is performed on the samples for the two temperatures RT and HT. Fig. 4 (a) shows the measured spectra in the visible region for all the samples. Samples - (: 6-27 s) that contain show a significant change in reflectance for the two temperatures. However, negligible change in reflectance is observed for -containing samples - (: 30 s to 5 min.). As discussed, the broad peaks and dip in the reflectance spectra arise due to the Fabry-Pérot resonances or interference effects in ultrathin film for dielectric-metal structures 25, 26. From Fig. 4 (a), it can be inferred that for samples - (: 6-27 s), the change in color with varying and temperature is brought about by the spectral shift in reflectance minima. This gradual shift in reflectance with varying might be accredited to the partial oxidation of V 35, while the spectral shift with temperature is caused by the phase transition in . The sharp drop around 669 nm in the measured reflectance spectra for all the samples (Fig. 4 (a)) could be due to characteristic spectrum line of the Deuterium lamp present in the Filmmetrics F20 spectrometer. The for different wavelengths with varying is calculated from measured reflectance of Fig. 4 (a) and plotted in Fig. 4 (b) using the “contourf” function in Python. This function uses linear interpolation to get points around label. For -containing samples - ( = 6 s to 27 s), the trend shows a decrease in as increases. Samples - ( = 30 s to 5 min.) exhibit a minimal change in , primarily due to the presence of amorphous vanadium oxide. As can be seen from Fig. 4 (b), a region of minima for exists in the wavelength range of 500 to 600 nm, which occurs as the measured reflectance curves at RT and HT cross each other. Compared to this, the calculated in Fig. 1 (d) shows a region of maxima for the abovementioned wavelength range. This contrasting behavior could be attributed to the substantial difference in the complex refractive index of resulting from different synthesis methods 27, 36.
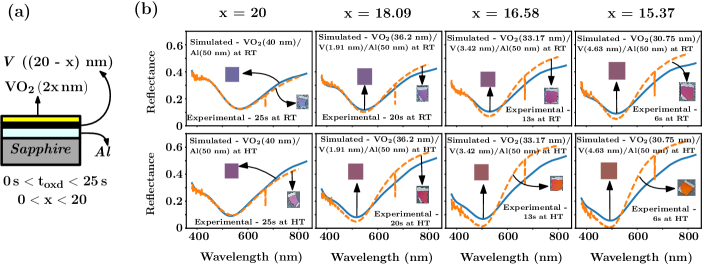
To explain the observed color variation among the - samples exhibiting similar Raman spectra, the different cases are modeled as (2x nm)/V ((20 - x) nm)/Al (50 nm)/Sapphire structure for x [0,20], due to partial oxidation of V 35, as shown in Fig. 5 (a). The modeled reflectance and the calculated colors are compared against the experimental data. The refractive indices of V and (at RT and HT ) are extracted from the unoxidized sample (20 nm V/ 50 nm Al/ Sapphire) and = 25 s sample (40 nm /50 nm Al/ Sapphire) respective reflectance spectra. The details of the extraction of the refractive indices are included in the supplementary material. Results for the reflectance and color match are shown in Fig. 5 (b). A good fit with all the measured spectra/observed colors is obtained, supporting the partial oxidation assumption. The slight mismatch in the modelled/measured reflectance spectra could be due to the evolution in refractive index with , as the refractive indices depend on various other parameters, such as surface roughness, vertical gradients in microstructure, non-stoichiometry, and film thickness 27, 37, 38. Extraction of indices from the sample (assuming it to be completely oxidized (x = 20)) does not give a good fit to the RT and HT reflectance spectra for all the color-changing samples, possibly due to nucleation of the amorphous phase in this sample.
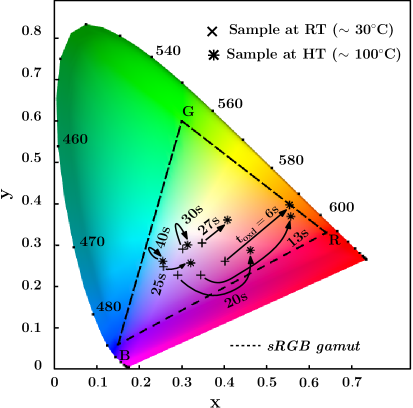
The samples are mapped on the CIE 1931-xy chromaticity diagram, as shown in Fig. 6 (details of the procedure for mapping the reflectance spectra to the chromaticity diagram are included in the supplementary material). This graphical representation indicates the chromaticity coverage of the samples, also called the color gamut. Standard RGB space (sRGB) 39 is highlighted along with samples for relative comparison. The arrows shown in the figure are directed from RT to HT chromaticity points. As can be observed, samples - show a significant change in chromaticity due to the phase transition; for , very little change in chromaticity is observed. No perceptible change in colour is observed for samples -; hence among these, only is highlighted on the graph. The RT and HT chromaticity points for show complete overlap. The experimental samples cover a large color gamut. Many more colors may be observed with suitable tuning in process parameters like the deposition process and oxidation temperature as they directly affect the phase transition.
As illustrated in Table 1, this study holds an advantage over previous studies owing to its simple two-layer uniform structure, obviating the need for nano-scale patterning. Compared to Au or Ag, the use of Al reduces the cost. In addition, the thermal budget of the fabrication process is relatively low compared to alternative approaches. However, a limitation of this work lies in the need for precise control of the oxidation time. Controlling such brief can be challenging; one potential alternative is to lower the oxidation temperature to achieve longer without significantly compromising the film quality 40. Even though the amorphous vanadium oxide on Al does not show significant color change, its presence and the slower V oxidation rate on Al are worth exploring further through a comprehensive material characterization.
5 Conclusion
This work demonstrates strong dynamic color switching with /Al/sapphire ultrathin ( ) asymmetric Fabry-Pérot-type thermochromic structure. Consistent and reversible color changes are observed with the change in temperature from low (30∘C) to high (100∘C) or vice versa. Multiple colours are observed for various oxidation durations. The oxidized samples show a significant change in chromaticity with the phase change of , thereby covering a wide color gamut. Compared to other works in a similar area, the structure considered in this work is simple, uniform, and does not require complex patterning. This work can significantly contribute to the design of simple and reversible dynamic/active color structures. This work covers the red and blue-violet regions, however green color region is not covered well. Effectively reproducing all three primary colors could potentially lead to its application in the fields of display and visible camouflage.
Supplementary Material
See the supplementary material for the details of Aluminium thickness optimisation, extraction of refractive indices of V, (RT) and (HT), calculation of x and y color gamut parameters from the reflectance spectra. Additionally, the reversible color-switching videos of the and samples along with their RGB variation during the color transition of sample (between RT and HT) is also included.
6 Acknowledgments
This project was supported by Science and Engineering Research Board, India via Imprint Grant No. IMP/2018/000404 and Core Research Grant No. CRG/2022/005421.
Conflict of Interest
The authors declare no competing financial interest.
References
- Wang et al. 2016 Wang, Y.; Runnerstrom, E. L.; Milliron, D. J. Switchable Materials for Smart Windows. Annual Review of Chemical and Biomolecular Engineering 2016, 7, 283–304, PMID: 27023660
- Ke et al. 2016 Ke, Y.; Balin, I.; Wang, N.; Lu, Q.; Tok, A. I. Y.; White, T. J.; Magdassi, S.; Abdulhalim, I.; Long, Y. Two-dimensional SiO2/VO2 photonic crystals with statically visible and dynamically infrared modulated for smart window deployment. ACS applied materials & interfaces 2016, 8, 33112–33120
- Kepic et al. 2021 Kepic, P.; Ligmajer, F.; Hrton, M.; Ren, H.; Menezes, L. d. S.; Maier, S. A.; Sikola, T. Optically tunable Mie resonance VO2 nanoantennas for metasurfaces in the visible. ACS Photonics 2021, 8, 1048–1057
- He et al. 2020 He, Q.; Youngblood, N.; Cheng, Z.; Miao, X.; Bhaskaran, H. Dynamically tunable transmissive color filters using ultra-thin phase change materials. Optics Express 2020, 28, 39841–39849
- Duan et al. 2017 Duan, X.; Kamin, S.; Liu, N. Dynamic plasmonic colour display. Nature communications 2017, 8, 14606
- Garshasbi and Santamouris 2019 Garshasbi, S.; Santamouris, M. Using advanced thermochromic technologies in the built environment: Recent development and potential to decrease the energy consumption and fight urban overheating. Solar Energy Materials and Solar Cells 2019, 191, 21–32
- Chain 1991 Chain, E. E. Optical properties of vanadium dioxide and vanadium pentoxide thin films. Applied optics 1991, 30, 2782–2787
- Wu et al. 2011 Wu, B.; Zimmers, A.; Aubin, H.; Ghosh, R.; Liu, Y.; Lopez, R. Electric-field-driven phase transition in vanadium dioxide. Physical Review B 2011, 84, 241410
- Kawakubo and Nakagawa 1964 Kawakubo, T.; Nakagawa, T. Phase transition in VO2. Journal of the Physical Society of Japan 1964, 19, 517–519
- Liu et al. 2012 Liu, M.; Hwang, H. Y.; Tao, H.; Strikwerda, A. C.; Fan, K.; Keiser, G. R.; Sternbach, A. J.; West, K. G.; Kittiwatanakul, S.; Lu, J.; others Terahertz-field-induced insulator-to-metal transition in vanadium dioxide metamaterial. Nature 2012, 487, 345–348
- Cao et al. 2009 Cao, J.; Ertekin, E.; Srinivasan, V.; Fan, W.; Huang, S.; Zheng, H.; Yim, J.; Khanal, D.; Ogletree, D.; Grossman, J.; others Strain engineering and one-dimensional organization of metal–insulator domains in single-crystal vanadium dioxide beams. Nature nanotechnology 2009, 4, 732–737
- De Natale et al. 1989 De Natale, J. F.; Hood, P.; Harker, A. B. Formation and characterization of grain-oriented VO2 thin films. Journal of Applied Physics 1989, 66, 5844–5850
- Jin et al. 1997 Jin, P.; Yoshimura, K.; Tanemura, S. Dependence of microstructure and thermochromism on substrate temperature for sputter-deposited VO 2 epitaxial films. Journal of Vacuum Science & Technology A: Vacuum, Surfaces, and Films 1997, 15, 1113–1117
- Ashok et al. 2020 Ashok, P.; Chauhan, Y. S.; Verma, A. High infrared reflectance modulation in VO2 films synthesized on glass and ITO coated glass substrates using atmospheric oxidation of vanadium. Optical Materials 2020, 110, 110438
- Saitzek et al. 2008 Saitzek, S.; Guinneton, F.; Guirleo, G.; Sauques, L.; Aguir, K.; Gavarri, J.-R. VO2 thin films deposited on silicon substrates from V2O5 target: limits in optical switching properties and modeling. Thin Solid Films 2008, 516, 891–897
- Graf et al. 2017 Graf, D.; Schlafer, J.; Garbe, S.; Klein, A.; Mathur, S. Interdependence of structure, morphology, and phase transitions in CVD grown VO2 and V2O3 nanostructures. Chemistry of Materials 2017, 29, 5877–5885
- Zhang et al. 2010 Zhang, Z.; Gao, Y.; Chen, Z.; Du, J.; Cao, C.; Kang, L.; Luo, H. Thermochromic VO2 thin films: solution-based processing, improved optical properties, and lowered phase transformation temperature. Langmuir 2010, 26, 10738–10744
- Liu et al. 2017 Liu, M.; Su, B.; Kaneti, Y. V.; Chen, Z.; Tang, Y.; Yuan, Y.; Gao, Y.; Jiang, L.; Jiang, X.; Yu, A. Dual-phase transformation: Spontaneous self-template surface-patterning strategy for ultra-transparent VO2 solar modulating coatings. ACS nano 2017, 11, 407–415
- Khaled and Berardi 2021 Khaled, K.; Berardi, U. Current and future coating technologies for architectural glazing applications. Energy and Buildings 2021, 244, 111022
- Song et al. 2018 Song, S.; Ma, X.; Pu, M.; Li, X.; Guo, Y.; Gao, P.; Luo, X. Tailoring active color rendering and multiband photodetection in a vanadium-dioxide-based metamaterial absorber. Photonics Research 2018, 6, 492–497
- Wilson et al. 2018 Wilson, K.; Marocico, C.; Bradley, A. Dynamic structural colour using vanadium dioxide thin films. Journal of Physics D: Applied Physics 2018, 51, 255101
- Shu et al. 2018 Shu, F.-Z.; Yu, F.-F.; Peng, R.-W.; Zhu, Y.-Y.; Xiong, B.; Fan, R.-H.; Wang, Z.-H.; Liu, Y.; Wang, M. Dynamic plasmonic color generation based on phase transition of vanadium dioxide. Advanced Optical Materials 2018, 6, 1700939
- Zhou et al. 2018 Zhou, L.; Hu, M.; Song, X.; Li, P.; Qiang, X.; Liang, J. Modified color for VO2/Au/VO2 sandwich structure-based smart windows. Applied Physics A 2018, 124, 1–6
- In et al. 2020 In, S.; Cho, J.; Park, J.; Kim, S. Y.; Kim, H.-T.; Noh, T. W.; Park, N. Self-Organized Gold Network–Vanadium Dioxide Hybrid Film for Dynamic Modulation of Visible-to-Near-Infrared Light. Advanced Photonics Research 2020, 1, 2000050
- Zhao et al. 2021 Zhao, J.; Zhou, Y.; Huo, Y.; Gao, B.; Ma, Y.; Yu, Y. Flexible dynamic structural color based on an ultrathin asymmetric Fabry-Perot cavity with phase-change material for temperature perception. Optics Express 2021, 29, 23273–23281
- Kats et al. 2013 Kats, M. A.; Blanchard, R.; Genevet, P.; Capasso, F. Nanometre optical coatings based on strong interference effects in highly absorbing media. Nature materials 2013, 12, 20–24
- Wan et al. 2019 Wan, C.; Zhang, Z.; Woolf, D.; Hessel, C. M.; Rensberg, J.; Hensley, J. M.; Xiao, Y.; Shahsafi, A.; Salman, J.; Richter, S.; others On the optical properties of thin-film vanadium dioxide from the visible to the far infrared. Annalen der Physik 2019, 531, 1900188
- Bbyrnes 2020 Bbyrnes, S. Python TMM package. https://pypi.org/project/tmm/, 2020
- Gurvitch et al. 2007 Gurvitch, M.; Luryi, S.; Polyakov, A.; Shabalov, A.; Dudley, M.; Wang, G.; Ge, S.; Yakovlev, V. VO 2 films with strong semiconductor to metal phase transition prepared by the precursor oxidation process. Journal of Applied Physics 2007, 102, 033504
- Ashok et al. 2020 Ashok, P.; Chauhan, Y. S.; Verma, A. Vanadium dioxide thin films synthesized using low thermal budget atmospheric oxidation. Thin Solid Films 2020, 706, 138003
- Shvets et al. 2019 Shvets, P.; Dikaya, O.; Maksimova, K.; Goikhman, A. A review of Raman spectroscopy of vanadium oxides. Journal of Raman spectroscopy 2019, 50, 1226–1244
- Rampelberg et al. 2015 Rampelberg, G.; De Schutter, B.; Devulder, W.; Martens, K.; Radu, I.; Detavernier, C. In situ X-ray diffraction study of the controlled oxidation and reduction in the V–O system for the synthesis of VO 2 and V 2 O 3 thin films. Journal of Materials Chemistry C 2015, 3, 11357–11365
- Allabergenov et al. 2021 Allabergenov, B.; Yun, S.; Cho, H.-S.; Lyu, H.-K.; Choi, B. Control of Polymorphic Properties of Multivalent Vanadium Oxide Thin Films. ACS Applied Electronic Materials 2021, 3, 1142–1150
- Shvets et al. 2021 Shvets, P.; Maksimova, K.; Goikhman, A. Correlation between Raman spectra and oxygen content in amorphous vanadium oxides. Physica B: Condensed Matter 2021, 613, 412995
- Ashok et al. 2022 Ashok, P.; Chauhan, Y. S.; Verma, A. Multi spectral switchable infra-red reflectance resonances in highly subwavelength partially oxidized vanadium thin films. Optical Materials 2022, 132, 112854
- Barimah et al. 2022 Barimah, E. K.; Boontan, A.; Steenson, D. P.; Jose, G. Infrared optical properties modulation of VO2 thin film fabricated by ultrafast pulsed laser deposition for thermochromic smart window applications. Scientific Reports 2022, 12, 11421
- Motyka et al. 2012 Motyka, M.; Gauntt, B.; Horn, M.; Dickey, E.; Podraza, N. Microstructural evolution of thin film vanadium oxide prepared by pulsed-direct current magnetron sputtering. Journal of Applied Physics 2012, 112
- Cueff et al. 2020 Cueff, S.; John, J.; Zhang, Z.; Parra, J.; Sun, J.; Orobtchouk, R.; Ramanathan, S.; Sanchis, P. VO2 nanophotonics. APL Photonics 2020, 5
- Süsstrunk et al. 1999 Süsstrunk, S.; Buckley, R.; Swen, S. Standard RGB color spaces. Color and imaging conference. 1999; pp 127–134
- Ashok et al. 2023 Ashok, P.; Chauhan, Y. S.; Verma, A. Low temperature synthesis of VO2 and hysteresis free VOx thin films with high temperature coefficient of resistance for bolometer applications. Thin Solid Films 2023, 781, 139975
| Thermochromic Structure | Advantages | Limitations | Ref. | ||||
|---|---|---|---|---|---|---|---|
| Ag(nano-particle)/insulator//Ag |
|
|
20 | ||||
| ITO//ITO/Ag/Si |
|
Only simulations study. | 21 | ||||
| Ag(nanodisk)///substrate |
|
|
22 | ||||
| /Au(nanoparticles)/ |
|
|
23 | ||||
| /Au(Self - organized particles) |
|
|
24 | ||||
| Ag//Al |
|
|
25 | ||||
| This work (/Al) |
|
|