Formation of the Methyl Cation by Photochemistry in a Protoplanetary Disk
Olivier Berné1,
Marie-Aline Martin-Drumel2,
Ilane Schroetter1,
Javier R. Goicoechea3,
Ugo Jacovella2,
Bérenger Gans2,
Emmanuel Dartois2,
Laurent Coudert2,
Edwin Bergin4,
Felipe Alarcon4,
Jan Cami5,6,7,
Evelyne Roueff8,
John H. Black9,
Oskar Asvany10,
Emilie Habart11,
Els Peeters5,6,7,
Amelie Canin1,
Boris Trahin11,
Christine Joblin1,
Stephan Schlemmer10,
Sven Thorwirth10,
Jose Cernicharo3,
Maryvonne Gerin8,
Alexander Tielens12,13,
Marion Zannese11,
Alain Abergel11,
Jeronimo Bernard-Salas14,15,
Christiaan Boersma16,
Emeric Bron8,
Ryan Chown5,6,
Sara Cuadrado3,
Daniel Dicken11,
Meriem Elyajouri11,
Asunción Fuente17,
Karl D. Gordon18,
Lina Issa1,
Olga Kannavou11,
Baria Khan5,
Ozan Lacinbala27,
David Languignon8,
Romane Le Gal19,20,
Alexandros Maragkoudakis16,
Raphael Meshaka8,
Yoko Okada10,
Takashi Onaka21,22,
Sofia Pasquini5,
Marc W. Pound13,
Massimo Robberto18,
Markus Röllig23,24,
Bethany Schefter5,
Thiébaut Schirmer11,25,
Ameek Sidhu5,6,
Benoit Tabone11,
Dries Van De Putte18,
Sílvia Vicente26,
Mark G. Wolfire13.
1Institut de Recherche en Astrophysique et Planétologie, Université de Toulouse, CNRS, CNES, UPS, 9 Av. du colonel Roche, 31028 Toulouse Cedex 04, France
2Université Paris-Saclay, CNRS, Institut des Sciences Moléculaires d’Orsay, 91405 Orsay, France
3Instituto de Física Fundamental (CSIC). Calle Serrano 121-123, 28006, Madrid, Spain.
4Department of Astronomy, University of Michigan, 1085 South University Avenue, Ann Arbor, MI 48109, USA
5Department of Physics & Astronomy, The University of Western Ontario, London ON N6A 3K7, Canada
6Institute for Earth and Space Exploration, The University of Western Ontario, London ON N6A 3K7, Canada
7Carl Sagan Center, SETI Institute, 339 Bernardo Avenue, Suite 200, Mountain View, CA 94043, USA
8LERMA, Observatoire de Paris, PSL University, Sorbonne Université, CNRS, 5 place Janssen, 92190, Meudon Cedex, France.
9Department of Space, Earth, and Environment, Chalmers University of Technology, Onsala Space Observatory, 43992 Onsala, Sweden.
10I. Physikalisches Institut, Universität zu Köln, Zülpicher Str. 77, 50937 Köln, Germany
11Institut d’Astrophysique Spatiale, Université Paris-Saclay, CNRS, Bâtiment 121, 91405 Orsay Cedex, France
12Leiden Observatory, Leiden University, P.O. Box 9513, 2300 RA Leiden, The Netherlands
13Astronomy Department, University of Maryland, College Park, MD 20742, USA
14ACRI-ST, Centre d’Etudes et de Recherche de Grasse (CERGA), 10 Av. Nicolas Copernic, F-06130 Grasse, France
15INCLASS Common Laboratory., 10 Av. Nicolas Copernic, 06130 Grasse, France
16 NASA Ames Research Center, MS 245-6, Moffett Field, CA 94035-1000, USA
17Observatorio Astronómico Nacional (OAN,IGN), Alfonso XII, 3, E-28014 Madrid, Spain
18Space Telescope Science Institute, 3700 San Martin Drive, Baltimore, MD 21218, USA
19Institut de Planétologie et d’Astrophysique de Grenoble (IPAG), Université Grenoble Alpes, CNRS, F-38000 Grenoble, France
20Institut de Radioastronomie Millimétrique (IRAM), 300 Rue de la Piscine, F-38406 Saint-Martin d’Hères, France
21Department of Physics, Faculty of Science and Engineering, Meisei University, 2-1-1 Hodokubo, Hino, Tokyo 191-8506, Japan
22Department of Astronomy, Graduate School of Science, The University of Tokyo, 7-3-1 Bunkyo-ku, Tokyo 113-0033, Japan
23 Physikalischer Verein - Gesellschaft für Bildung und Wissenschaft, Robert-Mayer-Str. 2, 60325 Frankfurt, Germany
24 Goethe-Universität, Physikalisches Institut, Frankfurt am Main, Germany
25Department of Space, Earth and Environment, Chalmers University of Technology, Onsala Space Observatory, SE-439 92 Onsala, Sweden
26Instituto de Astrofísica e Ciências do Espaço, Tapada da Ajuda, Edifício Leste, 2 ∘ Piso, P-1349-018 Lisboa, Portugal
27 KU Leuven Quantum Solid State Physics (QSP) Celestijnenlaan 200d - box 2414 3001 Leuven
Forty years ago it was proposed that gas phase organic chemistry in the interstellar medium was initiated by the methyl cation \chCH3+ (?, ?, ?), but hitherto it has not been observed outside the Solar System (?, ?). Alternative routes involving processes on grain surfaces have been invoked (?, ?). Here we report JWST observations of \chCH3+ in a protoplanetary disk in the Orion star forming region. We find that gas-phase organic chemistry is activated by UV irradiation.
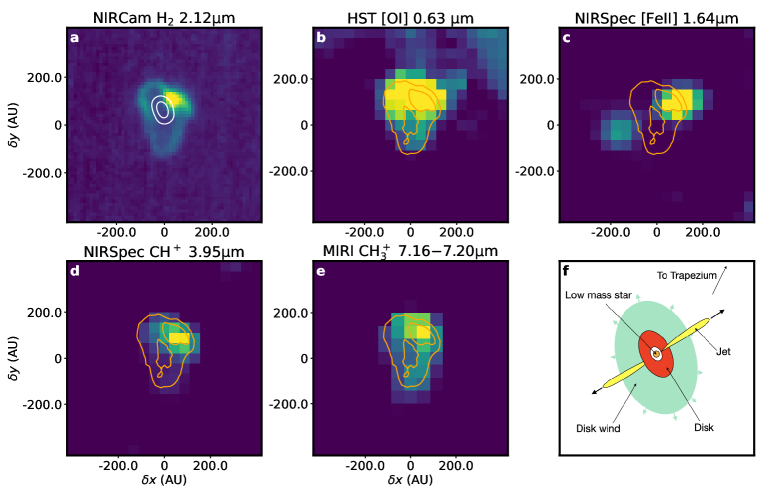
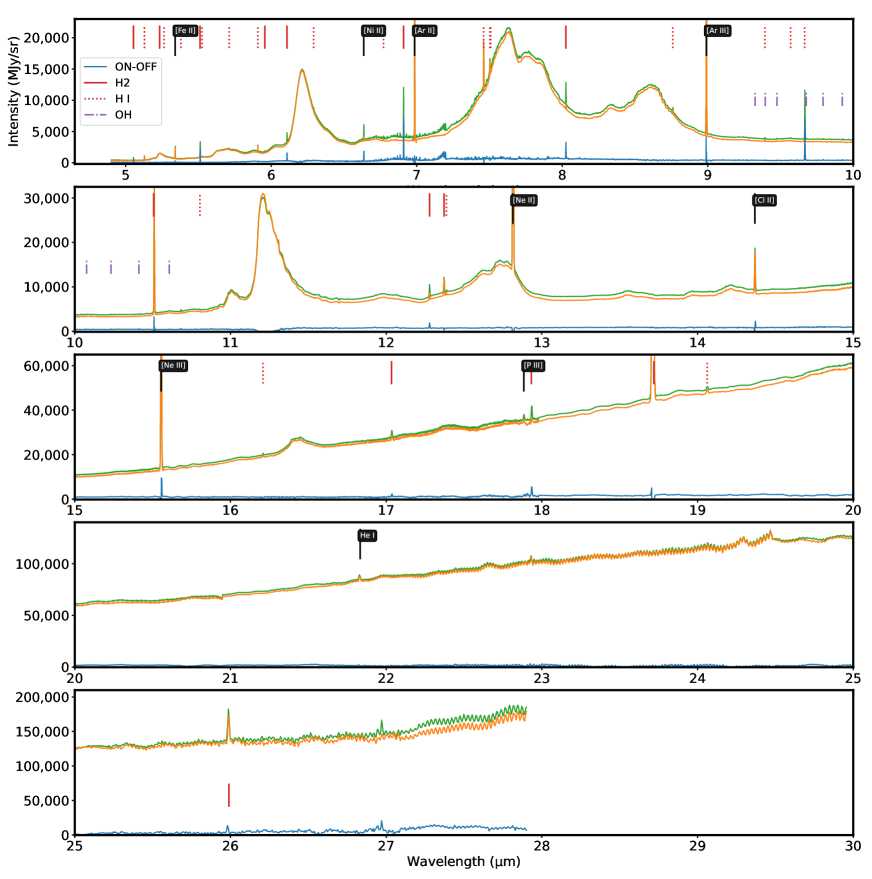
As part of the PDRs4All Early Release Science program on the JWST111pdrs4all.org (?), we have obtained observations of the protoplanetary disk d203-506 (?). This object is situated in the Orion Bar, at about 0.25 pc from the massive, strongly UV emitting Trapezium stars which are at 414 pc from Earth (?), inside the Orion Nebula. The disk is about 100 au in radius, and has an estimated mass of (Berné et al. in prep.). The central star of d203-506 has a estimated mass of (Berné et al. in prep.), typical for stars of the Orion Nebula Cluster (?). This star is obscured by the flared disk that is seen nearly edge-on (?). Fig. 1 shows integrated intensity images of the d203-506 disk (see Methods for details on JWST data reduction). This includes the emission of vibrationally and rotationally excited H2 and CH+, and fine-structure emission of Oxygen ([OI]) and ionized iron ([FeII]). The molecular emission arises from a hot (K) and dense ( cm-3) wind that is produced by photoevaporation from the disk due to irradiation by far-UV photons (FUV; 6 13.6 eV) from the Trapezium stars (Berné et al. in prep.). The [FeII] image shows the emission associated with a collimated jet. Some of the wind emission is co-spatial with this jet, but overall the wind is more extended and creates a “halo” around the disk.
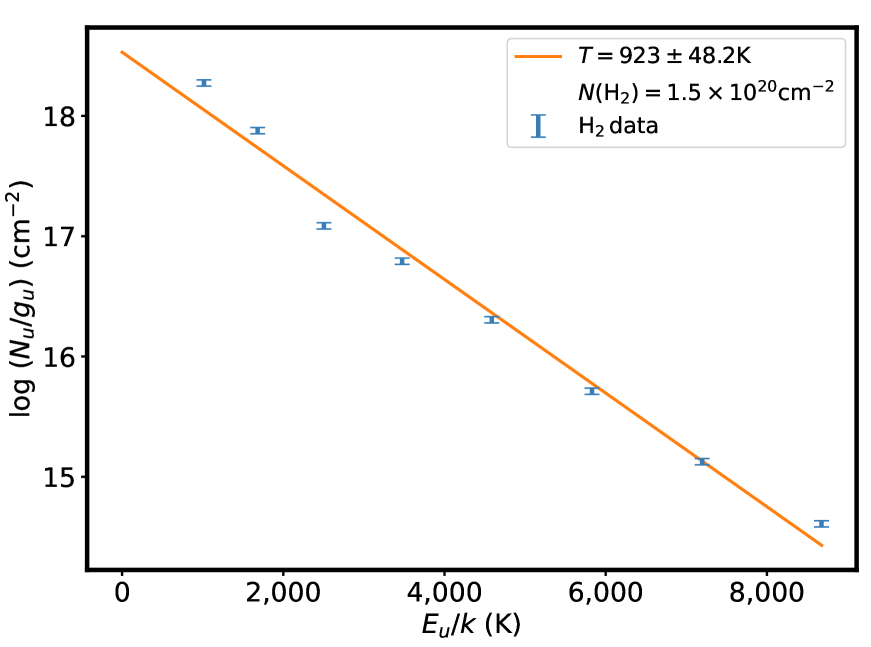
The mid infrared spectrum of d203-506 was obtained using the MIRI-MRS spectrometer onboard JWST (see Methods for details) and is shown in Fig. 2. In the spectrum, we detect pure rotational lines of H2 [0-0 S(1) to 0-0 S(8)] from which we derive an excitation temperature K (Methods). The straight line observed in the excitation diagram derived from these lines (Extended Data Fig. 3) indicates that the excitation temperature of H2 is close to the gas kinetic temperature, and thus confirms the presence of hot molecular gas in the wind of d203-506.
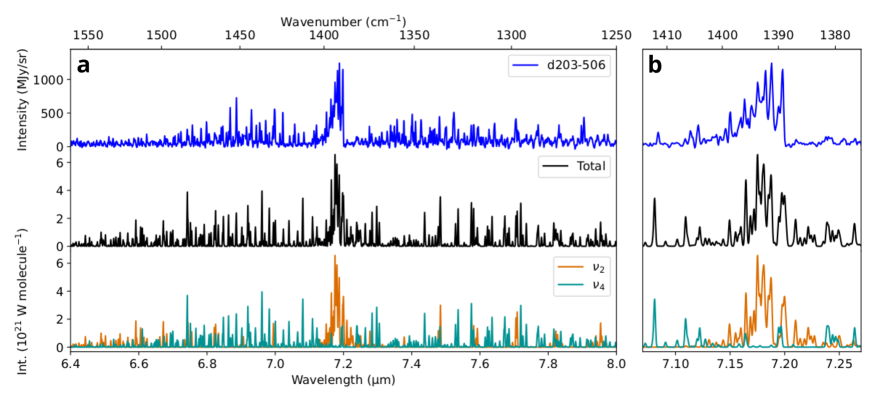
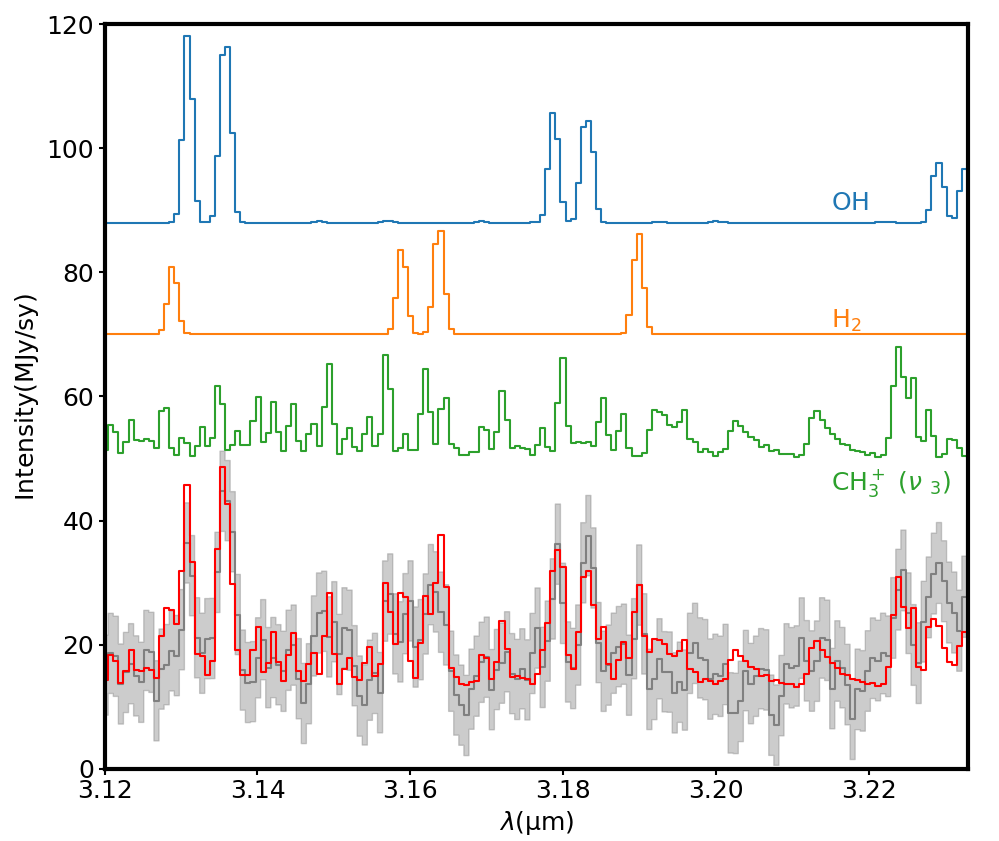
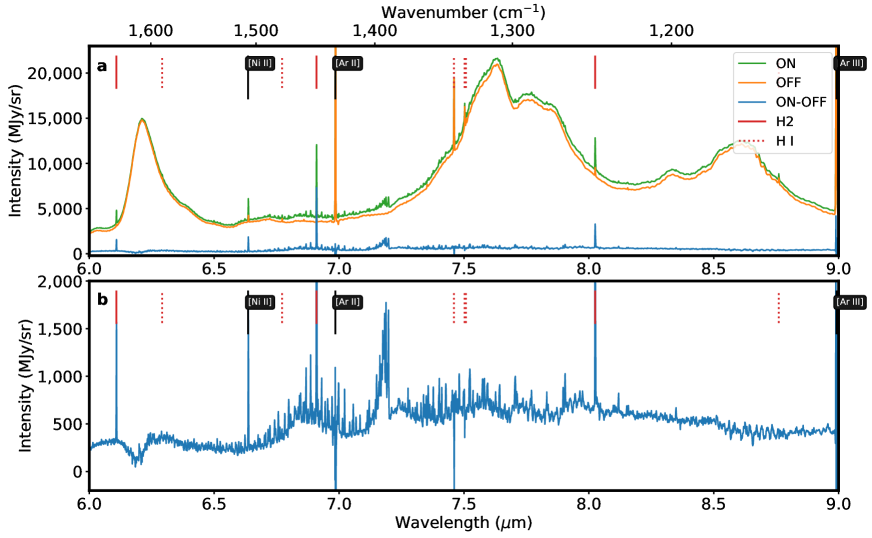
In addition to identified H2 and H i emission lines (see Methods), a strong residual emission consisting in a series of lines in the 6.5–8.0 µm range is observed (Fig. 2). This emission, as seen in the lower middle panel of Fig. 1, is spatially resolved and only present in d203-506. It is co-spatial with \chH_2 and CH+ emission, with the best spatial correlation observed with the 2.12 µm line of vibrationally excited H2 (see Fig. 1). We conclude that the observed features in Fig. 2 are an astrophysical signal associated with emission from the wind of the d203-506 protoplanetary disk. We note however, that given that the angular resolution of MIRI is at the limit to resolve the structures in d203-506, we cannot fully exclude an emission contribution from the jet.
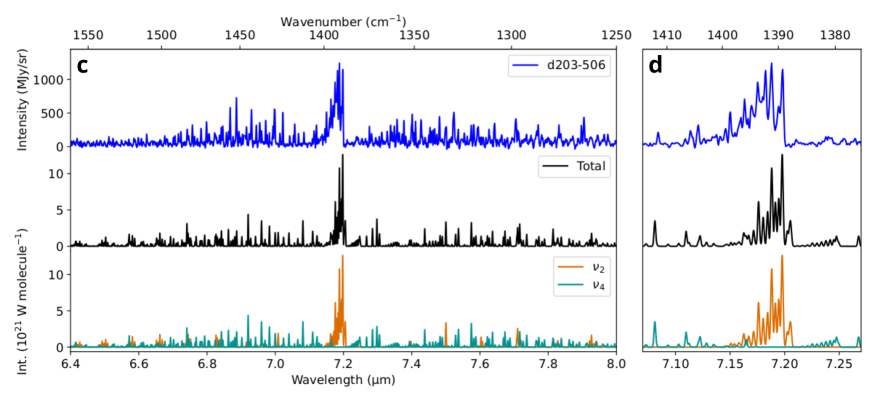
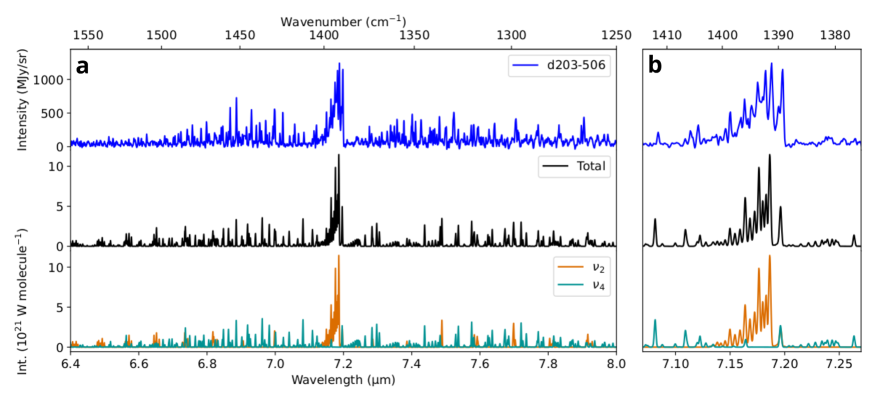
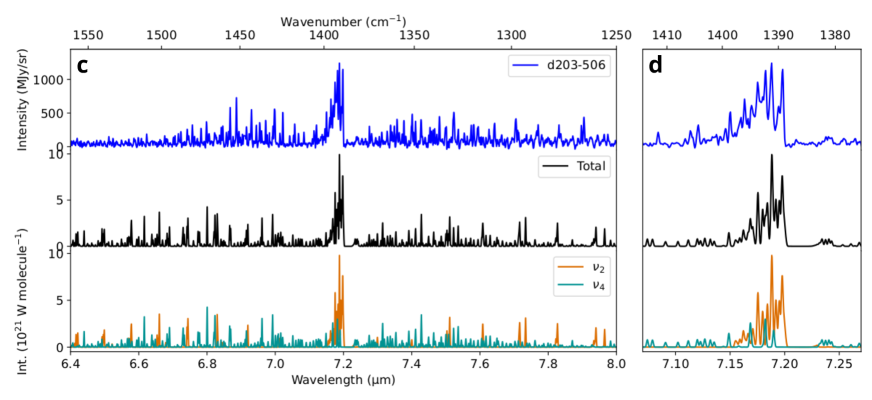
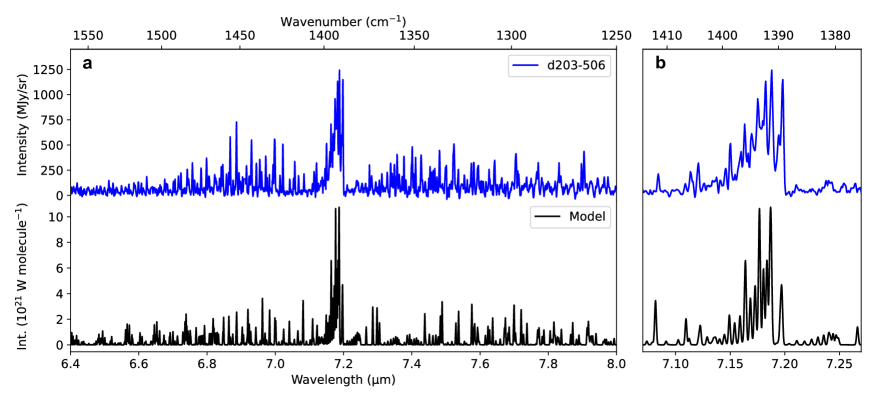
The 7 µm band visible in Fig. 2 is composed of a succession of narrow features corresponding to ro-vibrational transitions of a molecular carrier. Such insight into the detailed structure of the band is enabled by the unprecedented high spectral resolution and high sensitivity provided by JWST in that spectral region. The presence of these resolved structures, and their spectral span, is compatible with a light molecular carrier. The wavelength coincidence between the observed emission features around 7 µm (Fig. 2) and the (out-of-plane bending, “umbrella” motion) and (in-plane bending) bands of \chCH3+ (?) is striking. Besides \chCH3+, not a single match has been found for a molecule that would possess its shortest wavelength emission signature at 7 µm (see details in the Supplementary information). Recent laboratory work on the low temperature vibrational spectroscopy of \chCH3+ (?) finds the vibrational bands match the observed wavelengths. Two additional spectroscopic analyses further strengthen the \chCH3+ assignment. First, the intensity pattern of successive emission lines (Fig. 3) is characteristic of the spin statistics of a molecular carrier suggesting three equivalent non-zero-spin atoms (e.g., hydrogen atoms), as expected for CH. Second, the observed emission spectrum can be satisfactorily simulated (see Fig. 3) using sets of spectroscopic constants taking values within the range of what is expected from available calculations (Refs. (?, ?) and this work, see Table LABEL:table:fit_results) and laboratory measurements (?). A detailed description of the spectroscopic analysis procedure is given in the Methods. Quantum number assignments to the ro-vibrational transitions in this spectral range will require both additional theoretical input (notably investigating the Coriolis interaction between the two bands (?)) and laboratory measurements, in particular at even higher resolution and ideally at cold temperature to reduce the spectral density. The higher energy band of CH, situated near 3 µm, has been measured at high resolution in the laboratory (?). Some of the expected lines from the band in this spectral range are tentatively detected with NIRSpec in d203-506 (see Supplementary Information and Extended Data Fig. 6). In summary, by spectroscopic standards, \chCH3+ is the best candidate to explain the 7 µm spectral band observed towards the d203-506 protoplanetary disk.
| Parameter | Unit | |||||
|---|---|---|---|---|---|---|
| Prediction | Model | Prediction | Model | |||
| cm-1 | 1372–1412a | 1391 | 1373–1393b | 1375 | ||
| µm | 7.289–7.082 | 7.133 | 7.283–7.179 | 7.273 | ||
| cm-1 | 9.06–9.49c | 9.37 | 9.48–9.52c | 9.50 | ||
| cm-1 | 4.61–4.66c | 4.66 | 4.55–4.65c | 4.57 | ||
a 1 confidence interval from the experimental values of Ref. (?) (1402 10 cm-1) and Ref. (?) (1387 15 cm-1).
b 1 confidence interval from the experimental value of Ref. (?) (1383 10 cm-1)
c from Refs. (?, ?) and this work, and scaled to the ground state parameters of Ref. (?), see Table 3
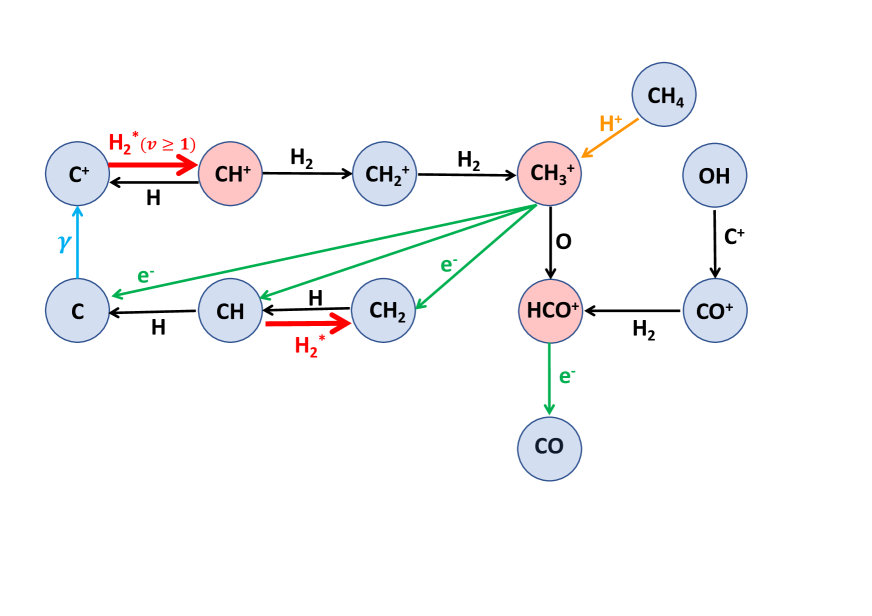
The presence of CH in d203-506 raises the question of its origin. Carbon chemistry in these environments typically starts by the radiative association \chC+ + H2 -¿ CH2+ + , which is a very slow process. The alternative bimolecular reaction \chC+ + H2 ( = 0) -¿ CH+ + H [1], is endothermic by / = 4300 K (?, ?), and thus very slow in cold (K) interstellar gas where /. However, strong external FUV radiation fields combined with high gas densities as found in protoplanetary disks open new routes for chemistry. The irradiated gas reaches high temperatures (near 1000 K, (?)) and a significant fraction of the H2 molecules are radiatively pumped through fluoresence to vibrationally excited states (?), H (0). This suprathermal excitation overcomes the endothermicity of reaction [1], allowing H to react with C+, leading to the formation of abundant CH+ (?, ?, ?). Subsequent fast and exothermic hydrogen abstraction reactions CH+ CH CH then efficiently lead to CH. In the Methods section, we quantitatively assess these processes using models, and show that for a wide range of acceptable parameters, CH is formed efficiently in FUV irradiated environments. The formed CH reacts very slowly with H2 (through radiative association) and is mainly destroyed by dissociative recombination with electrons, leading to CH2, CH, and C in comparable amounts (?). CH can also be destroyed by reactions with neutral oxygen producing HCO+ and with neutral molecules producing molecular ions. These undergo dissociative recombination with electrons yielding complex organic molecules. Therefore, in the presence of UV radiation, gas-phase organic chemistry is initiated through CH (?, ?, ?).
The ongoing chemistry in d203-506 described above differs greatly from what has been observed in disks that are not exposed to external UV irradiation where the freeze out of H2O and CO2 control the gas composition. In such disks, high abundances of water, HCN, CH4, C2H2, etc. are observed (?, ?), species which are not detected in d203-506. In the last decades, the formation of organic molecules in space has been considered to happen mostly at the surface of grains (?, ?). The detection of CH indicates that alternative gas-phase routes are available to activate the organic chemistry, when UV radiation is present. Far from being anecdotal, external UV irradiation is expected to occur during the early life of most protoplanetary disks (?), making UV-driven organic chemistry common for the chemical evolution of most protoplanetary disks and of the early the Solar System (?, ?). More generally, this chemistry can be active in any environment providing sufficiently high gas density and FUV irradiation ( cm-3, ). This can include, for instance, star-forming regions, the envelopes of planetary nebulae, the inner regions of disks around T-Tauri stars, and the interstellar medium of star-forming galaxies near and far. While the CH detection presented here is a promising achievement, there are still numerous unanswered questions surrounding the excitation, chemistry, and spectroscopic properties of this species (Methods and Supplementary Information). These topics shall be addressed thanks to interdisciplinary scientific efforts that incorporate the expertise of astronomers, physicists, and spectroscopists (both laboratory and theory) in order to fully understand the role of CH in organic chemistry in space.
References
- 1. Black, J. & Dalgarno, A. Models of interstellar clouds. i-the zeta ophiuchi cloud. Astrophys. J. Supplement Series 34, 405–423 (1977).
- 2. Smith, D. The ion chemistry of interstellar clouds. Chemical reviews 92, 1473–1485 (1992).
- 3. Herbst, E. Unusual chemical processes in interstellar chemistry: Past and present. Frontiers in Astronomy and Space Sciences 8, 776942 (2021).
- 4. Roueff, E. et al. \chCH2D+, the search for the holy grail. The Journal of Physical Chemistry A 117, 9959–9967 (2013).
- 5. Indriolo, N., Oka, T., Geballe, T. & McCall, B. J. Constraining the environment of \chCH+ formation with \chCH3+ observations. Astrophys. J. 711, 1338 (2010).
- 6. Cuppen, H. et al. Grain surface models and data for astrochemistry. Space Science Reviews 212, 1–58 (2017).
- 7. Semenov, D. et al. Chemistry in disks-IV. Benchmarking gas-grain chemical models with surface reactions. Astron. Astrophys. 522, A42 (2010).
- 8. Berné, O. et al. PDRs4All: A JWST early release science program on radiative feedback from massive stars. Publications of the Astronomical Society of the Pacific 134, 054301 (2022).
- 9. Bally, J., O’Dell, C. & McCaughrean, M. J. Disks, microjets, windblown bubbles, and outflows in the orion nebula. Astron. J. 119, 2919 (2000).
- 10. Menten, K. M., Reid, M. J., Forbrich, J. & Brunthaler, A. The distance to the Orion Nebula. Astron. Astrophys. 474, 515–520 (2007).
- 11. Hillenbrand, L. A. & Carpenter, J. M. Constraints on the stellar/substellar mass function in the inner orion nebula cluster. Astrophys. J. 540, 236 (2000).
- 12. Cunha de Miranda, B. K. et al. Threshold photoelectron spectroscopy of the methyl radical isotopomers, \chCH3, \chCH2D, \chCHD2 and \chCD3: Synergy between vuv synchrotron radiation experiments and explicitly correlated coupled cluster calculations. The Journal of Physical Chemistry A 114, 4818–4830 (2010).
- 13. Asvany, O., Thorwirth, S., Redlich, B. & Schlemmer, S. Spectroscopy of the low-frequency vibrational modes of \chCH3+ isotopologues. Journal of Molecular Spectroscopy 347, 1–6 (2018).
- 14. Kraemer, W. & Špirko, V. Potential energy function and rotation-vibration energy levels of \chCH3+. Journal of Molecular Spectroscopy 149, 235–241 (1991).
- 15. Keçeli, M., Shiozaki, T., Yagi, K. & Hirata, S. Anharmonic vibrational frequencies and vibrationally-averaged structures of key species in hydrocarbon combustion: \chHCO+, \chHCO, \chHNO, \chHOO, \chHOO-, \chCH3+, and \chCH3. Molecular Physics 107, 1283–1301 (2009).
- 16. Crofton, M. W., Jagod, M., Rehfuss, B. D., Kreiner, W. A. & Oka, T. Infrared spectroscopy of carbo‐ions. III. band of methyl cation \chCH3+. The Journal of Chemical Physics 88, 666–678 (1988).
- 17. Hierl, P. M., Morris, R. A. & Viggiano, A. A. Rate coefficients for the endothermic reactions C+ + H2 -¿ CH+ + H . J. Chem. Phys. 106, 10145–10152 (1997).
- 18. Zanchet, A. et al. H2(v = 0,1) + C+(2 P) - ¿ H+CH+ State-to-state Rate Constants for Chemical Pumping Models in Astrophysical Media. Astrophys. J. 766, 80 (2013).
- 19. Champion, J. et al. Herschel survey and modelling of externally-illuminated photoevaporating protoplanetary disks. Astron. Astrophys. 604, A69 (2017).
- 20. Black, J. H., Chaffee, F. H. & Foltz, C. B. Molecules at early epochs. II - H2 and CO toward PHL 957. Astrophys. J. 317, 442–449 (1987).
- 21. Sternberg, A. & Dalgarno, A. Chemistry in Dense Photon-dominated Regions. Astrophys. J.s 99, 565 (1995).
- 22. Agúndez, M., Goicoechea, J. R., Cernicharo, J., Faure, A. & Roueff, E. The Chemistry of Vibrationally Excited H2 in the Interstellar Medium. Astrophys. J. 713, 662–670 (2010).
- 23. Thi, W.-F. et al. Detection of ch+ emission from the disc around hd 100546. Astron. Astrophys. 530, L2 (2011).
- 24. Thomas, R. D. et al. Dissociative Recombination of Vibrationally Cold CH+ 3 and Interstellar Implications. Astrophys. J. 758, 55 (2012).
- 25. Cuadrado, S. et al. The chemistry and spatial distribution of small hydrocarbons in UV-irradiated molecular clouds: the Orion Bar PDR. Astron. Astrophys. 575, A82 (2015).
- 26. Pontoppidan, K. M. et al. A spitzer survey of mid-infrared molecular emission from protoplanetary disks. i. detection rates. Astrophys. J. 720, 887 (2010).
- 27. Grant, S. L. et al. Minds. the detection of 13co2 with jwst-miri indicates abundant co2 in a protoplanetary disk. The Astrophysical Journal Letters 947, L6 (2023).
- 28. Winter, A. J. & Haworth, T. J. The external photoevaporation of planet-forming discs. The European Physical Journal Plus 137, 1132 (2022).
- 29. Bergin, E. A., Alexander, C., Drozdovskaya, M., Gounelle, M. & Pfalzner, S. Interstellar heritage and the birth environment of the solar system (To appear in “Comets III”, University of Arizona Press).
- 30. Naraoka, H. et al. Soluble organic molecules in samples of the carbonaceous asteroid (162173) ryugu. Science 379, eabn9033 (2023).
- 31. Western, C. M. PGOPHER: A program for simulating rotational, vibrational and electronic spectra. J. Quant. Spectrosc. Radiat. Transf. 186, 221–242 (2017).
- 32. Berné, O. et al. PDRs4All: A JWST Early Release Science Program on Radiative Feedback from Massive Stars. PASP 134, 054301 (2022).
- 33. Labiano, A. et al. Wavelength calibration and resolving power of the jwst miri medium resolution spectrometer. Astron. Astrophys. 656, A57 (2021).
- 34. Berné, O., Foschino, S., Jalabert, F. & Joblin, C. Contribution of polycyclic aromatic hydrocarbon ionization to neutral gas heating in galaxies: model versus observations. Astron. Astrophys. 667, A159 (2022).
- 35. Roueff, E. et al. The full infrared spectrum of molecular hydrogen. Astron. Astrophys. 630, A58 (2019).
- 36. Foschino, S., Berné, O. & Joblin, C. Learning mid-IR emission spectra of polycyclic aromatic hydrocarbon populations from observations. Astron. Astrophys. 632, A84 (2019).
- 37. Tabone, B., van Hemert, M. C., van Dishoeck, E. F. & Black, J. H. OH mid-infrared emission as a diagnostic of H2O UV photodissociation. I. Model and application to the HH 211 shock. Astron. Astrophys. 650, A192 (2021).
- 38. Zannese, M. et al. OH mid-infrared emission as a diagnostic of H2O UV photodissociation. II. Application to interstellar PDRs. arXiv e-prints arXiv:2208.13619 (2022).
- 39. Pound, M. W. & Wolfire, M. G. The photodissociation region toolbox: Software and models for astrophysical analysis. Astron. J. 165, 25 (2022).
- 40. Gordon, I. et al. The HITRAN2020 molecular spectroscopic database. Journal of Quantitative Spectroscopy and Radiative Transfer 277, 107949 (2022).
- 41. Schulenburg, A. M., Alcaraz, C., Grassi, G. & Merkt, F. Rovibrational photoionization dynamics of methyl and its isotopomers studied by high-resolution photoionization and photoelectron spectroscopy. The Journal of Chemical Physics 125, 104310 (2006).
- 42. Chai, J.-D. & Head-Gordon, M. Long-range corrected hybrid density functionals with damped atom–atom dispersion corrections. Phys. Chem. Chem. Phys. 10, 6615 (2008).
- 43. Dunning, T. H. Gaussian basis sets for use in correlated molecular calculations. I. The atoms boron through neon and hydrogen. J. Chem. Phys. 90, 1007–1023 (1989).
- 44. Woon, D. E. & Dunning, T. H. Gaussian basis sets for use in correlated molecular calculations. III. The atoms aluminum through argon. J. Chem. Phys. 98, 1358–1371 (1993).
- 45. Frisch, M. J. et al. Gaussian 16 Revision A.01 (2016).
- 46. Pracna, P., Spirko, V. & Kraemer, W. Ab initio study of linestrengths of vibration-rotation transitions of ammonia and methyl cations. Journal of Molecular Spectroscopy 158, 433–444 (1993).
- 47. Nyman, G. & Yu, H.-G. Infrared vibrational spectra of \chCH3+ and its deuterated isotopologues. AIP Advances 9, 095017 (2019).
- 48. Jagod, M.-F., Gabrys, C. M., Rösslein, M., Uy, D. & Oka, T. Infrared spectrum of ch3+ involving high rovibrationai levels. Canadian Journal of Physics 72, 1192–1199 (1994).
- 49. Le Petit, F., Nehmé, C., Le Bourlot, J. & Roueff, E. A Model for Atomic and Molecular Interstellar Gas: The Meudon PDR Code. Astrophys. J. S. 164, 506–529 (2006).
- 50. Goicoechea, J. R. & Le Bourlot, J. The penetration of Far-UV radiation into molecular clouds. Astron. Astrophys. 467, 1–14 (2007).
- 51. Cardelli, J. A., Clayton, G. C. & Mathis, J. S. The Relationship between Infrared, Optical, and Ultraviolet Extinction. Astrophys. J. 345, 245 (1989).
- 52. Birnstiel, T. et al. The Disk Substructures at High Angular Resolution Project (DSHARP). V. Interpreting ALMA Maps of Protoplanetary Disks in Terms of a Dust Model. Astrophys. J. Let. 869, L45 (2018).
- 53. Walsh, C., Millar, T. J. & Nomura, H. Molecular Line Emission from a Protoplanetary Disk Irradiated Externally by a Nearby Massive Star. Astrophys. J. Let. 766, L23 (2013).
- 54. Plasil, R. et al. Reactions of Cold Trapped CH+ Ions with Slow H Atoms. Astrophys. J. 737, 60 (2011).
- 55. Blint, R. J., Marshall, R. F. & Watson, W. D. Calculations of the lower electronic states of CH3+: a postulated intermediate in interstellar reactions. Astrophys. J. 206, 627–631 (1976).
- 56. McEwan, M. J. et al. New H and H2 Reactions with Small Hydrocarbon Ions and Their Roles in Benzene Synthesis in Dense Interstellar Clouds. Astrophys. J. 513, 287–293 (1999).
- 57. Adams, N. & Smith, D. Reactions of hydrocarbon ions with hydrogen and methane at 300 k. Chemical Physics Letters 47, 383–387 (1977).
- 58. Larson, Å. et al. Branching Fractions in Dissociative Recombination of CH+2. Astrophys. J. 505, 459–465 (1998).
- 59. Scott, G. B. I., Milligan, D. B., Fairley, D. A., Freeman, C. G. & McEwan, M. J. A selected ion flow tube study of the reactions of small CmHn+ ions with O atoms. J. Chem. Phys. 112, 4959–4965 (2000).
- 60. Argyriou, I. et al. JWST MIRI flight performance: The Medium-Resolution Spectrometer. arXiv preprint arXiv:2303.13469 (2023).
Acknowledgments
OB is funded by a CNES APR program. MIRI data reduction is performed at the French MIRI centre of expertise with the support of CNES and the ANR-labcom INCLASS between IAS and the company ACRI-ST. Part of this work was supported by the Programme National “Physique et Chimie du Milieu Interstellaire” (PCMI) of CNRS/INSU with INC/INP co-funded by CEA and CNES. Quantum chemical calculations were performed using HPC resources from the “Mésocentre” computing center of CentraleSupélec and École Normale Supérieure Paris-Saclay supported by CNRS and Région Île-de-France (http://mesocentre.centralesupelec.fr/). JRG and SC thank the Spanish MCINN for funding support under grant PID2019-106110GB-I00. JC and EP acknowledge support from the University of Western Ontario, the Institute for Earth and Space Exploration, the Canadian Space Agency, and the Natural Sciences and Engineering Research Council of Canada. The Cologne spectroscopy group acknowledges funding by the Deutsche Forschungsgemeinschaft DFG (CRC956, sub-project B2, ID 184018867) and the ERC AdG Missions (ID: 101020583). Work by YO and MR is carried out within the Collaborative Research Centre 956, sub-project C1, funded by the DFG – project ID 184018867. CB is grateful for an appointment at NASA Ames Research Center through the San José State University Research Foundation (80NSSC22M0107). TO acknowledges support from JSPS Bilateral Program, Grant Number 120219939.
Author contributions
O.B. found the signal in the data and led the analysis of the data and write-up of the article. M.A.M.D., I.S., U.J., B.G., E.D., L.C., E.B., F.A., J.C., E.R., J.B., O.A., C.J., S.S., S.T., J.C., M.G., A.T., T.O., M.Z. conducted the spectroscopic analysis and participated in the write-up. M.A.M.D. created figures 3, S4, S5. I.S. created figures 1, 2, S1, S2, S3. I.S. and O.B. created figure S6. J.G. performed the chemical models and figures S7, S8 and participated in the write-up. O.B., E.H., E.P. led the JWST observing program. I.S., J.G., E.D., E.B., F.A., J.C., A.C., B.T., C.J., A.T., M.Z., A.A., J.B.S., C.B., E.B., R.C., S.C., D.D., M.E., A.F., K.D., L.I., O.K., B.K., O.L., D.L., R.L.G., A.M., R.M., Y.O., T.O., S.P., M.P., M.R., M.R., B.S., T.S., A.S., B.T., D.V.P., S.V. and M.W. contributed to the observing program with JWST. I.S., A.C., R.C., A.S., B.T., F.A., D.V.P. reduced the data. E.D., M.A.M.D., L.C., J.G. and O.B. conducted the column density analysis. J.H.B. wrote the section on the excitation of \chCH3+. M.W. and J.H.B. corrected the English throughout the manuscript. All authors contributed to the discussions and provided feedback on the manuscript.
Methods
Observations and data reduction
The JWST/MIRI Medium Resolution Spectroscopy (MRS) Integral Field Unit (IFU) data were obtained on 2023 January 31 as part of the JWST ERS 1288 program (PI: O. Berné, E. Habart, E. Peeters, (?)) referred to as “PDRs4All”. All four channels and the three sub-channels were used, covering a wavelength range of 4.9–28 µm at a spectral resolution of 4000–1500 (?). The observations are centered on RA=05h35m 20s.4749 DEC and span a mosaic of 9 pointings. The overall science exposure time is 14086.11s for the whole mosaic. We used the FASTR1 readout mode with 4-point dithering. We reduced the data using the JWST Data Reduction pipeline version 1.9.5. The stage 2 residual fringe correction was applied in addition to the standard fringe correction step. A master background subtraction was applied in stage 3 of the reduction. At the end of the data reduction, we obtained four MIRI datacubes, one for each channel, each channel containing its three corresponding sub-channels (short, medium and long). The details of the data reduction for MIRI-IFU is part of a dedicated paper by the PDRs4All team (Chown et al. in preparation).
In this paper we also use one narrow band image of the NIRSpec observations of the same object as well as a NIRCam filter. Specifically, we use the NIRCam F212N filter image and the NIRSpec spectral cube corresponding to the F290LP filter which spans from to 5 µm. Observations were obtained with JWST-NIRSpec (JWST-NIRCam) on 2022 September 10 and reduced using the JWST pipeline version 1.9.4 (1.7.1) with Calibration Reference Data System (CRDS) context file jwst_1014.pmap (jwst_0969.pmap). For the NIRCam observations, no OFF emission was subtracted. For the NIRSpec observations, a dedicated OFF observation was subtracted. The details of the data reduction for these two instruments is discussed in a dedicated paper by the PDRs4All team on NIRCam (Habart et al. in prep) and NIRSpec (Peeters et al. in prep). The details on the observing strategy can be found in (?).
Data analysis
In order to work with complete spectra spanning all the MIRI MRS wavelength range of 4.9–28 µm, we first stitch the spectra of the four channels to remove jumps between spectral orders. For each spectrum, we arbitrarily choose the one from Channel 2 long as a reference. Shorter and longer wavelengths (Channels 1, 3, and 4) are thus scaled accordingly. We create (with numpy) an array of wavelengths spanning the full wavelength range, i.e. between 4.900 and 27.901 µm, with 50 000 points and a constant step . Each channel spectrum is then interpolated onto this grid and jumps are removed by scaling each spectral order based on the average flux in the overlap region. The integrated intensity is conserved in this procedure, and uncertainties propagated.
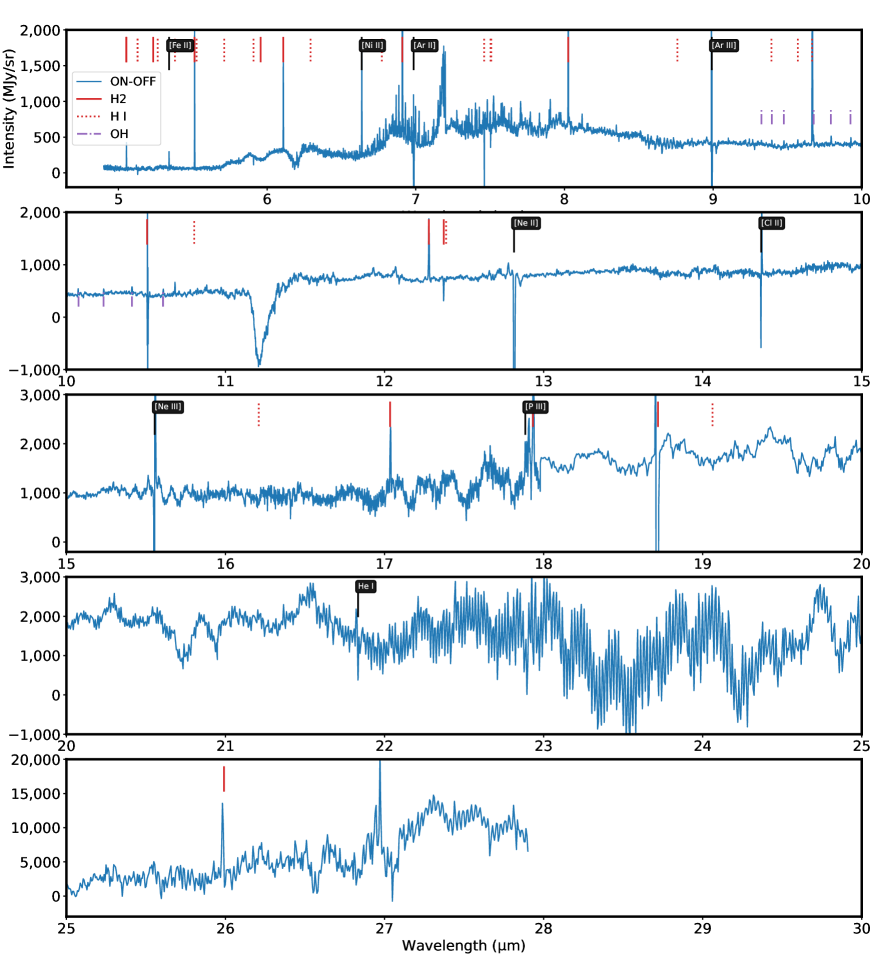
The two extracted spectra shown in blue and orange in Fig. 2 are from the “ON” and ——OFF” position, respectively. The ON (OFF) spectrum were extracted from an ellipse (circular aperture) centered on the position 5:35:20.357 , 5:25:05.81 ( 5:35:20.370, 5:25:04.97), with dimension ”, ” (of radius ”) and a position angle PA=+33 (0) degrees (trigonometric) with respect to North. In order to have the emission of d203-506 we choose to subtract the nebula emission by evaluating ONOFF. The ON and OFF spectra over the full MIRI-MRS range are shown in Extended Data Fig. 1, and the full subtracted spectrum is shown in Extended Data Fig. 2. In Extended Data Fig. 2, some lines are negative due to the over-subtraction of ionized emission lines which dominate in the nebula but are absent in d203-506. Some PAH bands are seen in negative in the ONOFF spectrum; this is due to intrinsic variation of the PAH bands due to e.g. size or ionization, and this cannot be interpreted as PAH absorption.
Line identification
Using the ON-OFF spectrum described previously and the line list provided by the PDRs4All ERS team (?), we identified the strong emission lines present in the data. The main emission lines are from H i and H2 and are listed in Table 1 and 2, respectively. The H2 lines intensities presented in the latter table are measured using a Gaussian fitting to the observed lines, and the wavelength of the H2 transition from (?). The approach to fit the observed lines is presented in (?). Nebular emission lines from atomic ions are also identified and are shown in Figures 2 and 2 with black vertical lines with their name in the attached box. In addition, a number of OH lines are also identified between 9 and 11 µm and are shown as green vertical lines on the same Figures. For this wavelength range we used OH wavelengths from (?) and (?). The study of OH emission in d203-506 will be the subject of a forthcoming paper (Zannese et al. in prep.).
From the H2 lines listed in Table 2 we derive an excitation diagram, using the H2 Toolbox (?) developed as part of the PDRs4All project science enabling products (see https://pdrs4all.org/seps/ and). This is a tool for fitting temperature, column density, and ortho-to-para ratio in H2 excitation diagrams. A one or two temperature model is assumed, and the fit finds the excitation temperatures and column densities, and optionally ortho-to-para ratio. The source code is available at https://dustem.astro.umd.edu/tools.html. (?)he result of this analysis is shown in Extended Data Fig. 3. The derived excitation temperature is .
Other candidate molecules
There are no unassigned series of lines observed in the 5.2–6.2 µm range, corresponding to \chC=O or \chC+N vibrations (Fig. 2) thus excluding most small species containing these chemical functions as carrier of the observed 7 µm features. At longer wavelengths (8–17 µm, see Extended Data Fig. 2), the spectrum is devoid of strong unassigned emission lines. Many hydrocarbon molecules, radicals, and ions (e.g., \chCH2, \chCH2+, …) possess low frequency modes and would thus emit in that range. Instead, the lowest vibrational modes of \chCH3+ lie at 7 µm. We thoroughly inspected the literature data on other hydrocarbons and known interstellar species (both neutral and charged) for possible matches and used local thermodynamic equilibrium (LTE) models to predict the emission from molecules in this spectral range. The tested molecules include—not exhaustively—H2O (and isotopologues), H2O+, NH, C2H2, \chCH3, HCN, SO2, all hydrocarbons present in the HITRAN database (?), NH3, CH3OH, and CH3CN.
Spectroscopy of the Methyl cation
CH3+ is a planar molecule belonging to the group of symmetry. It possesses four fundamental modes of vibration following an irreducible representation (the two modes are doubly degenerate). It is an oblate symmetric-top molecule for which rotational energy levels of non-degenerate vibrational states are described with two quantum numbers, , the total-angular-momentum quantum number excluding nuclear spin, and , the projection of (the total angular momentum excluding nuclear and electron spins) along the principal axis of symmetry; an additional quantum number accounts for Coriolis-coupling in degenerate vibrational states ( in ). The energy levels in a given vibronic state can be calculated using the energy of the vibronic state, two rotational constants ( and ), centrifugal distortion parameters (, , …), and, for states of symmetry, additional Coriolis-coupling and -doubling parameters (, , ). The molecule possesses three equivalent hydrogen atoms (fermions, ) resulting in spin-statistical weights of (0, 0, 4, 4, 2, 2) for the levels of the states of symmetries () (?). In the following, we used the PGOPHER software (?) to simulate the rovibrational spectrum of \chCH3+.
Since no experimental information is available on the ( symmetry) and ( symmetry) states of \chCH3+, except the band positions (?, ?), we rely on quantum chemical calculations to estimate the rotational constants in these excited states. We carried out geometry optimization and anharmonic frequency analysis at the B97X-D/cc-pVQZ level of theory (?, ?, ?) using the Gaussian 16 suite of electronic structure programs (?). The main results from these calculations are reported in Table 3. The table also contains the calculated constants reported in the literature (?, ?). Besides the rotational constants, the quantum chemical calculations also give us insights about the transition moments of the (out-of-plane bending, “umbrella” motion) and (in-plane bending) bands. Our calculations predict transition moments of 0.084 D and 0.064 D for and , respectively. Such low values have to be taken with caution as experimental values can differ significantly, by 0.1 D or more. Nevertheless, these values are consistent with the small values obtained by CCSD(T)/cc-pwCVTZ calculations performed in course of the work presented in Ref. (?) (0.06 D and 0.07 D, respectively), as well as those reported in Ref. (?) (0.049 D and 0.111 D) and Ref. (?) (0.10 D and 0.16 D).
To assess the reliability of the spectroscopic constants derived from the different quantum chemical calculations (both from this work and the literature), the calculated values in and were compared to the experimental values of the band. Transitions within the band (asymmetric stretching) observed by Crofton et al. (?) were fitted in the present work using PGOPHER (so as to use the same model for and ) leading to the spectroscopic parameters reported in Table 3. These derived parameters are in excellent agreement with those reported in Ref. (?). They also are in very good agreement with the parameters obtained by the anharmonic calculations from this study. These results were used to scale the calculated constants in and according to the formula (and similarly for ). For the rotational constants calculated in Ref. (?), since no calculated values in are reported, the scaling was made using values in . The scaled values appear in blue in Table 3; they serve as a range of confidence for the spectral simulations.
Despite our best efforts, no definite spectroscopic analysis of the bands observed by JWST was achieved, i.e., we could not assign with confidence quantum numbers to the observed transitions. Instead, we performed several simulations by varying the rotational constants of and until qualitative agreement with the observational data was achieved. Such qualitative agreement was assessed using the following criteria (by decreasing order of importance): i) Q-branch line position and intensity; ii) P- and R-branches spread and spectral line density; iii) line positions and intensities in the P- and R-branches. In all cases, the Coriolis interaction constants were kept fixed to the calculated values of those in , and so were the transition moments of the and bands. This lead us to produce four models, I to IV (see Table 3 and Figures 4-5; model III being the model presented in the main article), that reasonably reproduce the astronomical data. It is worth noting, however, that the spectral density is greater on the spectrum of d203-506 than in our simulations, which could either reflect the presence of another species, or some discrepancies in the rotational constants used in models I to IV. Regarding the temperature, for all models, a rotational temperature of 400 K seems to adequately simulate the astronomical features (i.e., the spread of the P-, Q- and R-branches). Higher temperatures lead to P- and R-branches that spread further than what is observed in the astronomical spectrum. While the simulations were performed under the assumption of thermal equilibrium, astronomical excitation conditions may differ significantly (see detailed discussion in the following section). This is particularly relevant to the relative intensities of the and bands, since the and vibrational states may be populated differently in d203-506.
We have also investigated the presence of lines emanating from the band of CH near 3 µm in the NIRSpec data of d203-506 presented in Berné et al.(in prep.). The band has been observed at high resolution in the laboratory by Refs. (?, ?). Using the constants derived from these observations, we computed a synthetic spectrum of the band at 400 K and compare it to the NIRSpec background subtracted spectrum (using the same apertures as for MIRI, see Methods) in Extended Data Fig. 6. The predicted lines are found to coincide with lines in the observations.
In summary, high-resolution laboratory infrared spectra of CH in the 7 µm region are needed to identify individual transitions in the astronomical data. First laboratory measurements at low temperatures will initiate this process, hopefully deciphering the strong Coriolis coupling between the degenerate and vibrations of CH. In order to support a quantitative analysis of the astronomical spectra, laboratory works also conducted at higher temperatures are required.
Chemistry of the Methyl cation
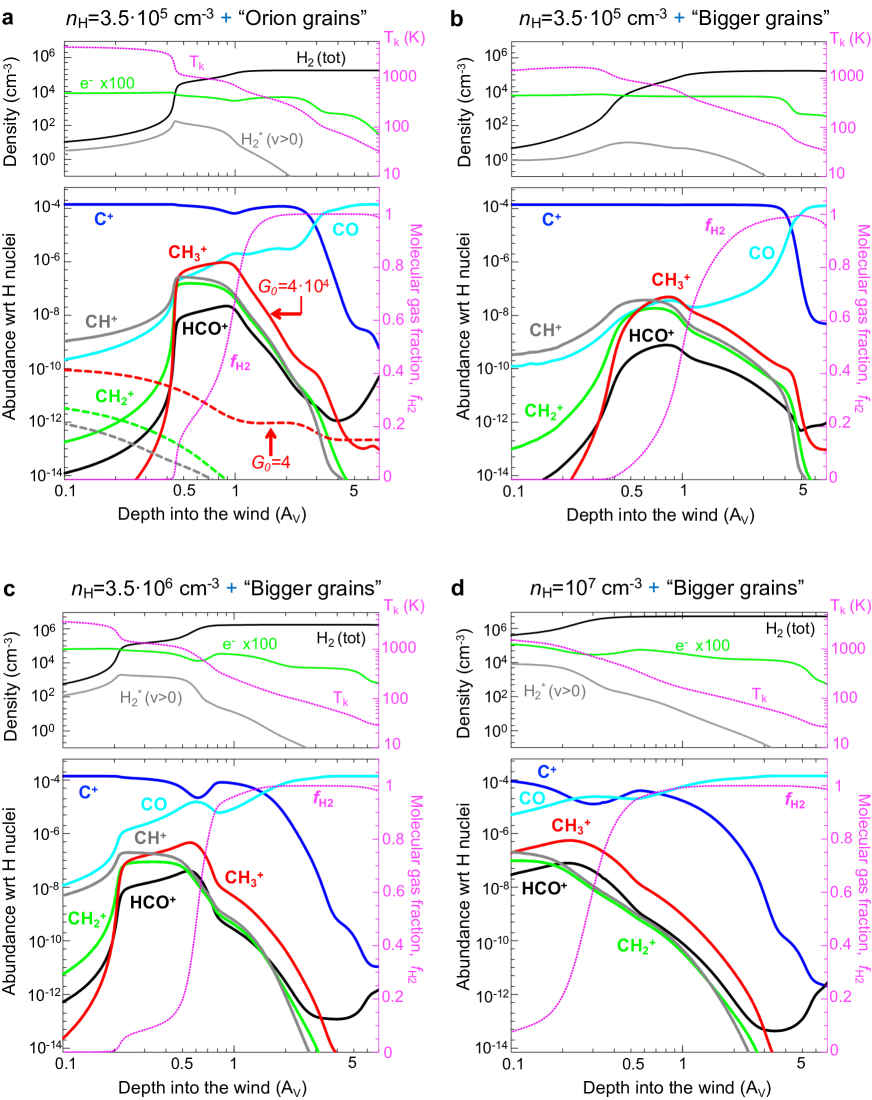
We modeled the chemistry in the strongly FUV–irradiated photoevaporative wind and upper disk layers of d203-506 using the Meudon Photodissociation Region (PDR hereafter) code (?). The code solves the FUV radiative transfer in a medium of gas and dust (?), as well as the steady-state heating, cooling, chemistry, and H2 (, ) level populations as a function of depth into the neutral disk (in mag of visual extinction ). Berné et al.(in prep.) previously used this code to reproduce the H2 line intensities detected by JWST/NIRSpec and obtained a radiation field intensity 4104 and a gas density = (H) + 2(H2) 3.5105 cm-3 as the best-fit. We first adopt the same physical parameters and use an extinction law suited to Orion molecular cloud (?), and consistent with dust grains ( = 5.62 and / = 1.051022 cm-2) bigger than in standard diffuse interstellar clouds ( = 3.1). This choice leads to a FUV dust extinction cross-section, (FUV) = 1.110-21 cm-2/H, which is in the upper range of the cross-sections estimated by Berné et al. (in prep.) for this object, and a factor of about two smaller than standard ISM grains. In addition, we run models adopting ”bigger grains” (by a factor of about four), leading to (FUV) = 710-22 cm-2/H. This smaller FUV cross-section is still compatible with the wind models presented by Berné et al. (in prep.) and with the kind of dust grains expected in the upper layers of protoplanetary disks (?).
Extended Data Fig. 7 shows the predicted density and temperature structure of the wind and upper disk layers (upper panels) as well as the C+, CH+, CH, CH, CO, and HCO+ abundance profiles (lower panels). Figure 7a refers to models using “Orion grains” and = 3.5105 cm-3 (Berné et al. in prep.). The other plots refer to models adopting “bigger grains” and densities of 3.5105 cm-3 (Extended Data Fig. 7b), 3.5106 cm-3 (Extended Data Fig. 7c), and 107 cm-3 (Extended Data Fig. 7d). The latter ones are more representative of the outer layers of a disk (?).
In all these models, reaction C+ + H2(, ) CH+ H [1] drives the formation of CH+ as soon as the H2 abundance rises. In these conditions, high temperatures and presence of FUV-pumped vibrationally excited H, reaction [1] is much faster than the slow radiative association reactions C+ + H2 CH photon and C+ + H CH+ photon. These radiative associations produce small amounts of CH and CH+ in cold gas ( 100 K). Our models include an H2(, ) state-dependent treatment of reaction [1] (?), appropriate to the nonthermal populations of H in FUV-irradiated environments. In particular, the CH+ formation rate is computed by summing over all formation rates for each specific state of H2. Once CH+ is formed, fast and exoergic hydrogen abstraction reactions CH+ CH CH lead to CH. The efficiency of this chemical pipe to CH depends on the abundance of H atoms in the gas (because they readily react with CH+; (?)) and that of electrons (because they destroy CH and CH). Reactions with atomic hydrogen dominate CH+ destruction when the molecular gas fraction, defined as = 2(H2)/, is 0.5 ( = 1 when all hydrogen is in molecular form). All models in Extended Data Fig. 7 predict that the CH abundance peaks close to the H /H2 transition, at 1 mag, where 1000-800 K. Extended Data Fig. 8 summarizes the dominant chemical reactions at the CH abundance peak. We note that the CH+ and CH abundance profiles roughly follow the density profile of vibrationally excited H (dotted black curve in the upper panel of Extended Data Fig. 7). Hence, irrespective of the exact gas density value, the infrared H2 lines detected with JWST in d203-506 probe strongly FUV-irradiated hot gas, where CH+ and CH efficiently form.
Our models predict (CH)/(CH+) column density ratios of 1–15 (increasing as increases). We note that the bulk column density of these species stem from FUV-illuminated gas at 3 mag. Deeper inside, their abundances drop by orders of magnitude. Hence, both CH+ and CH are chemical tracers of the most irradiated wind and upper disk layers.
The local CH+ / CH abundance ratio can be analytically estimated from the following network of gas-phase chemical reactions:
C+ + H2 (, ) CH+ H [1]
CH+ + H C+ H2 [2a]
CH+ + H2 CH H [2b]
CH + H2 CH H [3]
CH + e- products [4]
CH + e- products [5]
We note that adopting the photodissociation rate of (?), CH photodissociation is expected to be much slower than dissociative recombination with electrons even in strong UV fields. Therefore, in steady-state one obtains:
| (1) |
where = (e-)/ is the electron abundance. In the last step we assumed that CH destruction by reactions with H2 are much faster than dissociative recombinations with electrons at the CH abundance peak (as confirmed by the model). In our model we used the following reaction rate coefficients: = 1.210-9 cm3 s-1 (?), = 1.610-9 cm3 s-1 (?), = 6.4010-7 cm3 s-1 (?), and = 6.9710-7 cm3 s-1 (?). Using representative values for the wind and upper disk layers of d203-506; = 900 K and (C+) 1.410-4, one obtains (CH) / (CH+) 12 from Eq. (1). This analytical abundance ratio agrees with the detailed predictions of our photochemical models. That is, the above chemical reactions dominate the formation of CH in FUV-irradiated gas. In particular, models predict that the CH abundance peaks at gas molecular fractions of 0.3–0.5 (pink dotted curves in Figs. 7).
Reaction [5] produces CH2, CH, and C in similar amounts (?). These are key reactive intermediate species that trigger the chemistry of carbon species (?). In addition, reaction O + CH HCO+ + H2 (?) is a dominant source of HCO+, and thus of CO, in these irradiated hot gas layers ( Extended Data Fig. 7 also shows the predicted HCO+ abundance profile in the photoevaporative wind and upper disk layers). The morphology of the observed HCO+ = 4-3 line emission (first detected by (?) and then mapped with ALMA at high angular resolution by (Berné et al. in prep.)) resembles that of vibrationally excited H2 and CH3+ observed with JWST (Berné et al. in prep.). It will be difficult to explain the presence of extended HCO+ emission in these strongly irradiated gas layers without the FUV-driven chemistry described here and tested by the presence of CH. We note that this hot HCO+ linked to the extended H emission is different from the HCO+ present in lower and denser layers of protoplanetary disks and formed by standard ion-molecule chemistry (?).
Specific 2D models, better adapted to the geometry of the upper disk layers and FUV-irradiated wind, will be needed to fully understand the density structure and abundance distribution of the observed molecular emission with JWST.
Data Availability
The JWST data presented in this paper is publicly available through the MAST online archive (http://mast.stsci.edu) using the PID 1288. The MIRI spectra presented in Fig. 2 and Extended Data Figs. 1,2 are available in ASCII format at https://doi.org/10.5281/zenodo.7989669. The p-Gopher files to create the model spectra of \chCH3+ are available via : https://doi.org/10.5281/zenodo.7993330.
Code Availability
The JWST pipeline used to produce the final data produducts presented in this article is available at https://github.com/spacetelescope/jwst. The MEUDON PDR code is publicly available at https://ism.obspm.fr/pdr_download.html
Author information
Supplementary Information is available for this paper.
Correspondence and requests for materials should be addressed to Olivier Berné.
The authors declare no financial or non-financial competing interest.
Supplementary information
Supplementary methods
emission of CH
CH has a band () near 3µm. This spectral range was observed as part of the PDRs4All ERS program with the NIRSpec instrument. These data are subject of other papers in preparation, however we present here an analysis of these data for d203-506 in the context of the CH detection. The NIRSpec spectrum in the spectral range of the band is shown in Fig. 6. The shaded region represents the error interval of the data. This error interval has been computed as the sum of the errors provided by the JWST pipeline and an empirical error. The empirical error is three times the standard deviation of noise in the 3.102 to 3.126 spectral range of NIRSpec, where no lines are present. In the same figure we show a best fit model of the OH lines which are present in this spectral range. This is an LTE model at a temperature of 800K. A detailed model of the OH emission will be presented in a forthcoming paper (Zannese et al. in prep). The objective here is not to obtain the best possible model, but rather to assess the contribution of OH in this spectral range. The H2 lines present in the spectral range have been fitted individually with Gaussians using the wavelengths provided by (?). The width is set by the instrumental resolution. The CH model used here is Model III., at a temperature of 400K. All the models have been convolved to the spectral resolution of NIRSpec which is 2100 in this range, and re-sampled on the NIRSpec wavelength grid. The total model is the sum of the OH, H2 and CH models. It can be seen in Fig. 6 that there is a good agreement between the total model and the NIRSpec data. We note that the intensity of the detectable CH signal is comparable with the 3 noise of NIRSpec. Several strong lines of CH, in particular at 3.157 or 3.223 µm do appear clearly in the data. However, at this stage, the noise level in the data is too high to provide a definitive identification of specific lines of CH with NIRSpec. We are currently working on obtaining a higher SNR spectrum by improving the data reduction, and by performing additional observations.
Excitation of CH infrared bands
Hereafter we estimate the rates of the competing processes that might influence the excitation and line emission of CH.
COLLISIONAL EXCITATION. A vibrationally excited state of the molecule can be excited by inelastic collisions with H or H2 with an upward rate coefficient
where is the kinetic temperature of the gas, is the corresponding collisional quenching rate of the band , with degeneracies and of the upper and lower states, respectively. The wavenumber of the transition is . In the disk wind, the H2 pure rotational lines, which have a critical density lower than that of the gas density, are thermalized, hence K. The quenching rate coefficient might be as large as cm3 s-1; therefore, at the gas density of the reference PDR model shown in Fig. 7, cm-3, the collisional excitation rates of the CH and fundamental bands would be at most s-1 and s-1 per ion, respectively. For a higher density of cm-3, these rates would be and s-1 per ion, respectively. The spontaneous transition probability of the fundamental band is calculated to be s-1. This means that the vibrationally excited state of CH cannot be thermally populated at the : the collisional rates are many orders of magnitude too small, and thus .
FORMATION-PUMPING. As shown in previous sections, CH is thought to form mainly through a sequence of exothermic ion-neutral reactions. The change of enthalpy in the reaction
is 65.6 kJ/mol, which corresponds to 5481 cm-1. Energetically, this is sufficient to leave the product ion in the (1403 cm-1) or (3108 cm-1) vibrationally excited states; however, this is likely to happen in only a small fraction of the reactions. In steady state, the total formation rate in cm-3 s-1 is balanced by a total destruction rate . The principal destruction processes in the PDR include dissociative recombination with electrons, slow radiative association reactions with H2, reaction with atomic O to form HCO+, and photodissociation. Photodissociation of CH was investigated through ab initio computations (?), but there has been no recent treatment of the process. As a result, photodissociation of CH is absent from the Leiden database of photodissociation and photoionization of astrophysically relevant molecules. (?) identified the electronic states of CH that would participate in its photodissociation and found only one 1E” state with an energy below 13.6 eV with the right symmetry. They estimated that the oscillator strength for transitions to this state must be small, , implying that the photodissociation rate in the background Galactic radiation field must be of the order of 10-11 s-1. The reference PDR model in Fig. 7 has , so that that the corresponding photodissociation rate is s-1. With reference to the zone of the PDR model where CH is most abundant, cm-3, K, and the electron fraction . Adopting the rate coefficients of (?) for dissociative recombination, we estimate that the destruction rate of CH by electrons is s-1, which completely dominates over reactions with H2 and O. For higher densitites - as discussed in the previous section, this destruction process will be even more efficient. For a given density, CH is likely to be destroyed at least 100 times faster than it can be vibrationally excited by collisions at 900 K. This means that the excited vibrational states cannot be populated in equilibrium. It also implies that the excitation rate by the formation process might be of the order of s-1 per ion. Thus if the ion-neutral source reaction yields of the product CH ions in , the formation process could be at least as important as collisional excitation.
RADIATIVE EXCITATION. The rate of radiative pumping by absorption of continuous radiation is given by
where is the spontaneous transition probability and is the brightness temperature of radiation at frequency defined by the Planck function
As shown in Fig 2, the surface brightness of the continuum in the ON-OFF difference spectrum is 500 MJy sr-1 ( W m-2 Hz-1 sr-1) near the wavelength of the fundamental band. This corresponds to K. In the calculation of Ref. (?), this band has a transition dipole moment of Debye and , so that the corresponding transition probability is s-1. If the continuum source is roughly co-extensive with the CH-emitting region, then the molecules ”feel” the same surface brightness that we see. Thus the radiative pumping rate in the band itself is of the order of s-1 per ion. The total continuum brightness in the PDR spectrum (Fig. 2), is 10 times larger than that of the ON-OFF spectrum, which suggests that the molecules might be exposed to an even larger radiative excitation rate. The surface brightness in the NIRSpec spectrum of d is approximately 450 MJy sr-1 at 3150 cm-1 in the vicinity of the band, corresponding to K at this frequency. For a calculated transition probability s-1 (dipole transition moment 0.181 Debye from (?)), this implies a radiative excitation rate of s-1 per ion. Both estimates of radiative excitation omit the diluted starlight from the stars that energize the PDR.
COMPARISON. The rates of collisional excitation, hot-molecule formation, and infrared-radiative excitation of the observed CH bands can be comparable to order-of-magnitude in the case of a moderate density ( cm-3). For higher densities ( cm-3) collisions are likely to dominate the excitation. This example illustrates the possible non-LTE excitation mechanisms of the molecular vibrational bands that JWST may detect in related interstellar environments.
Column density estimates
Because the excitation processes that lead to the observed emission of CH remain to be determined (see previous section), it is difficult at this stage to provide an accurate determination of the total column density of the species. We however provide an order of magnitude estimate hereafter, and also point to the main limiting factors in this derivation to guide future studies.
The integration over frequency of the emission band in the JWST observations in the 1200–1600 cm-1 range, after local baseline subtraction (spline fit on points outside the strong bands), is of W/m2/sr. To get an estimate of the column density of \chCH3+, we operate under the assumption that the and bands of this ion are the major contributors to the observed features (once the strong isolated atomic and \chH2 lines are removed). Using the Einstein coefficients reported in Ref. (?) of s-1 and 4.43 s-1, the column density in these upper emitting states can be derived by:
i.e., cm-2. From PGOPHER models using dipole moments values 0.084 and 0.064 D from our best model (III.) for the vibrational modes and , respectively, we derive a total emission in the 7 µm band of W/CH. Thus, under such assumptions a column density of cm-2 is estimated. These numbers must be taken with caution however, and are provided to the reader as an order of magnitude on the column densities for this species in this protoplanetary disk, as the line strength are not determined experimentally yet, resulting in possible change by large factors in the derivation. In addition, as the excitation is unlikely to be at LTE (see previous section), the determination of (\chCH3+), the total column density of \chCH3+, cannot be safely determined by using simple Boltzmann factors to relate and populations to the ground state one. Within LTE approximation, this factor is given by the ratio of states degeneracies multiplied by . For the considered transitions, and excitation temperatures in the K range, it implies total column densities a factor of ten to thousand times the above quoted , respectively. At 400 K at LTE, (\chCH3+) cm-2. A model including lines spectroscopic assignment and collisional rates, when they will be determined, is to be developed in the future to better constrain the \chCH3+ excitation (see section above) and the total column densities, under the observed astronomical conditions. Finally, an additional uncertainty in this derivation stems from the beam dilution, as the emission from the \chCH3+ emitting region is likely not spatially resolved with MIRI. Hence – put aside the spectroscopic uncertainties describe hereabove, the determined column density value should be considered as a lower limit. Overall, this discussion further demonstrates the absolute need for collaborative actions coordinating astrophysicists observations and spectroscopists dedicated laboratory astrophysics experiments to interpret such sets of data.
Extended Data
| (µm) | Transition | ||
|---|---|---|---|
| (1) | (2) | (3) | (4) |
| 5.128662 | 156225.1 | 3.6881 104 | 6–10 |
| 5.263685 | 157316.1 | 1.3121 103 | 7–18 |
| 5.379776 | 157257.1 | 1.7812 103 | 7–17 |
| 5.525190 | 157186.7 | 2.4709 103 | 7–16 |
| 5.711464 | 157101.8 | 3.51558 103 | 7–15 |
| 5.908220 | 155854.9 | 7.0652 104 | 6–9 |
| 6.291918 | 156869.4 | 7.8457 103 | 7–13 |
| 6.771993 | 156707.3 | 1.2503 104 | 7–12 |
| 7.45984 | 153419.7 | 1.0254 106 | 5–6 |
| 7.502502 | 155337.5 | 1.5609 105 | 6–8 |
| 7.508107 | 156498.9 | 2.1174 104 | 7–11 |
| 8.760068 | 156225.1 | 3.9049 104 | 7–10 |
| 9.392013 | 156869.4 | 7.8037 103 | 8–13 |
| 10.803593 | 157186.7 | 2.2679 103 | 9–16 |
| 12.387158 | 156498.9 | 2.3007 104 | 8–11 |
| 16.20909 | 156225.1 | 4.6762 104 | 8–10 |
| 19.06192 | 155337.5 | 2.272 105 | 7–8 |
(1) Emission line wavelength (µm); (2) upper level energy (K); (3) Einstein A coefficient; (s-1) (4) Transition label.
| (µm) | Transition | Intensity () | |||
|---|---|---|---|---|---|
| (1) | (2) | (3) | (4) | (5) | (6) |
| 5.0531 | 8677.1 | 1978.977 | 3.236 10-7 | 0-0 S(8) | 0.864 |
| 5.5111 | 7196.7 | 1814.492 | 2.001 10-7 | 0-0 S(7) | 4.367 |
| 6.1085 | 5829.8 | 1637.046 | 1.142 10-7 | 0-0 S(6) | 2.582 |
| 6.9095 | 4586.1 | 1447.280 | 5.879 10-8 | 0-0 S(5) | 12.217 |
| 8.0250 | 3474.5 | 1246.099 | 2.643 10-8 | 0-0 S(4) | 4.193 |
| 9.6649 | 2503.7 | 1034.670 | 9.836 10-9 | 0-0 S(3) | 6.468 |
| 12.278 | 1681.6 | 814.424 | 2.755 10-9 | 0-0 S(2) | 2.408 |
| 17.034 | 1015.1 | 587.032 | 4.761 10-10 | 0-0 S(1) | 1.742 |
(1) Emission line wavelength (µm), from (?); (2) Upper level energy (K); (3) Transition energy (cm-1); (4) Einstein A coefficient (s-1); (5) transition label; (6) erg s-1 cm-2 sr-1
| Experimental | Calculated∗,a | Models∗ | ||||||||
| This workb | Ref. (?) | Ref. (?) | I | II | III | IV | ||||
∗ Rotational, centrifugal distortion, and Coriolis constants in the ground state, , , and (in cm-1), and transition moments of the and bands. Comparison of quantum calculated values, and those used to best model the spectrum of the d203-506 source around 1400 cm-1. a Values in brakets (in blue) are scaled according to results when available, to otherwise
b B97X-D/cc-pVQZ, this work
c Coriolis interaction parameter between and , unitless
d Transition dipole moment of the fundamental bands, in Debye