Abstract
Constraining the physical conditions of the ionized media in the vicinity of an active supermassive black hole (SMBH) is crucial to understanding how these complex systems operate. Metal emission lines such as iron (Fe) are useful probes to trace the gaseous media’s abundance, activity, and evolution in these accreting systems. Among these, the Feii emission has been the focus of many prior studies to investigate the energetics, kinematics, and composition of the broad-emission line region (BELR) from where these emission lines are produced. In this work, we present the first simultaneous Feii modeling in the optical and near-infrared (NIR) regions. We use cloudy photoionization code to simulate both spectral regions in the wavelength interval 4000 - 12000 Å. We compare our model predictions with the observed line flux ratios for I Zw 1 - a prototypical strong Feii-emitting active galactic nuclei (AGN). This allows putting constraints on the BLR cloud density and metal content that is optimal for the production of the Feii emission, which can be extended to I Zw 1-like sources, by examining a broad parameter space. We demonstrate the salient and distinct features of the Feii pseudo-continuum in the optical and NIR, giving special attention to the effect of micro-turbulence on the intensity of the Feii emission.
keywords:
galaxies: active; (galaxies:) quasars: emission lines; (galaxies:) quasars: supermassive black holes; accretion, accretion disks; radiation mechanisms: thermal; radiative transfer; methods: numerical; methods: observational; techniques: spectroscopic1
\issuenum1
\articlenumber0
\datereceived
\daterevised \dateaccepted
\datepublished
\hreflinkhttps://doi.org/
\TitleJoint analysis of the iron emission
in the optical and near-infrared spectrum of I Zw 1
\TitleCitationJoint analysis of the iron emission
in the optical and near-infrared spectrum of I Zw 1
\AuthorDenimara Dias dos Santos 1,2,‡∗\orcidA, Swayamtrupta Panda 3,‡∗\orcidB, Alberto Rodríguez-Ardila 1,3\orcidC, Murilo Marinello 3\orcidD
\AuthorNamesDenimara Dias dos Santos, Swayamtrupta Panda, Alberto Rodríguez-Ardila, Murilo Marinello
\AuthorCitationD. Dias dos Santos; S. Panda; A. Rodríguez-Ardila; M. Marinello.
\corresCorrespondence: denimara.santos@inpe.br; spanda@lna.br
\secondnoteThese authors contributed equally to this work.
1 Introduction
Active Galactic Nuclei (AGNs) are harbored within the central cores of galaxies and host active supermassive black holes (SMBHs) at their very centers. The radiation originates from the heating of material that is drawn toward the SMBH and subsequently triggers ionization within the gas and metal-rich environment surrounding these systems (Netzer, 2015; Padovani et al., 2017). The appearance of AGNs can vary based on the observer’s perspective due to their intricate geometry (Collin et al., 2006; Panda et al., 2019). This phenomenon also becomes evident in their observed spectra.
AGNs are further classified in terms of the types of emission line profiles they demonstrate in their observed spectrum. Sources displaying a combination of broad (permitted and semi-permitted) as well as narrow forbidden emission line profiles are categorized as Type I sources, while those lacking broad emission lines are classified as Type-II (Antonucci, 1993; Urry and Padovani, 1995; Sulentic et al., 2000; Netzer, 2015). This study exclusively concentrates on Type-I sources and their emissions. The origin of the broad emission lines can be traced back to a region located around 0.01 - 0.1 parsecs away from the central ionizing source. This measurement is derived through the widely recognized technique of reverberation mapping, which has been applied to a substantial sample of over 200 AGNs to date (Blandford and McKee, 1982; Peterson et al., 2004; Bentz et al., 2013; Du et al., 2015; Grier et al., 2017; Panda et al., 2019; Shen et al., 2023). This region, known as the broad line region (BLR), contributes significantly to the emissions observed in a typical Type-I AGN spectrum (Peterson et al., 1993, 1994; Rosenblatt et al., 1994; Korista et al., 1995; Veilleux et al., 1997; Berk et al., 2001; Kollatschny, 2003; Glikman et al., 2006; Vestergaard and Peterson, 2006; Marziani et al., 2010; Bentz et al., 2013; Du et al., 2015; Pozo Nuñez et al., 2015; Marziani et al., 2018; MacLeod et al., 2019; Wolf et al., 2020; Fonseca Alvarez et al., 2020; Rakshit, 2020; Schindler et al., 2020; Li et al., 2022; Pandey et al., 2022; Lu et al., 2022; Bentz et al., 2023; Donnan et al., 2023). Notably, among the salient BLR emission features is the Feii emission, encompassing a wavelength range from ultraviolet (UV) to near-infrared (NIR) (Wills et al., 1985; Verner et al., 1999; Marinello et al., 2020).
The emission from Feii is remarkable in the Type-I AGN spectra, primarily due to the aggregation of an extensive array of transitions, above 344,000 in number. The accumulation of the lines mimics a continuum and is hence known as a pseudo-continuum in an AGN spectrum (Phillips, 1977; Verner et al., 1999; Sigut and Pradhan, 2003; Sigut et al., 2004). The large number of emissions stemming from the Feii ion play a pivotal role in characterizing the energy distribution within the BLR - approximately 25% of the total emission originating in the BLR is attributed to the Feii lines (Wills et al., 1985). Succeeding investigations have confirmed the utility of Feii emission as a surrogate for quantifying metal abundances in the BLR of AGNs across a broad range of redshifts, contributing to insights into the evolutionary trends of metallic elements within these galaxies (Hamann and Ferland, 1992; Baldwin et al., 2004; Panda et al., 2019; Martínez-Aldama et al., 2021; Sarkar et al., 2021).
Another crucial outcome from studies centered on Feii pertains to the development of emission templates specific to Feii. From a purely observational standpoint, the pioneering work of Boroson and Green (1992) marked the inception of extracting Feii emission from a quintessential AGN Feii emitter, I Zw 1, which itself has a long and rich history (Phillips, 1976, 1977; Oke and Lauer, 1979; Joly, 1981; Halpern and Oke, 1987; Laor et al., 1997; Negrete et al., 2012; Park et al., 2022). The Feii template was meticulously constructed by isolating and excluding all emission lines except in the Feii. This template-driven approach continues to be employed across various studies, serving as the foundation for quantifying the optical intensity of Feii. Boroson and Green (1992) played a pioneering role in comprehending Feii emission. In the same article, the authors established a robust association between the strength of Feii and various attributes of both the Broad Line Region (BLR) and the Narrow Line Region (NLR). Employing Principal Component Analysis (PCA) - a dimensionality reduction technique, they identified multiple correlations between observed spectroscopic parameters. Eigenvector1 (EV1) was the paramount correlation space among them. The EV1 from their study shows a strong correlation between the optical Feii emission within the spectral range of 4434 - 4684Å, (centered at 4570 Å), the peak intensity of [Oiii]5007 and the Full Width at Half Maximum (FWHM) of broad component of the H emission profile. This led to the well-established FWHM(H) vs. RFeII connection111 RFeII is usually the ratio of the integrated Feii emission within 4434 - 4684Å to the broad H emission., that is the well-known optical plane of the quasar main sequence (Sulentic et al., 2000; Shen and Ho, 2014; Marziani et al., 2010, 2018; Panda et al., 2019; Deconto-Machado et al., 2023; Mengistue et al., 2023). Within this framework, Feii emission not only plays a crucial role in discerning the underlying factors driving EV1 (Panda et al., 2019) but also serves as a link between line strength and the emitting gas physics for a diverse population of Type-1 AGNs along the EV1 plane.
Regarding Feii templates, Vestergaard and Wilkes (2001) progressed in the UV domain by extending the template methodology into the ultraviolet spectrum using a high-quality HST/FOS spectrum for I Zw 1. Subsequent efforts have since created several templates, effectively characterizing UV-optical Feii emission across large samples of AGNs (Tsuzuki et al., 2006; Kovačević-Dojčinović and Popović, 2015; Dong et al., 2010, 2011; Kovačević et al., 2010). Kovačević et al. (2010) devised an innovative optical Feii template through a semi-empirical approach, combining the observed Feii emission with theoretical predictions based on allowed transitions between energy levels for the ion. By meticulously measuring individual Feii multiplet groups, they achieved a better overall agreement and were successful in getting an improved estimate for the RFeII. Reproducing Feii emission in sources similar to I Zw 1 has been challenging, as empirical templates struggle to replicate specific features in observed spectra. In a recent development, Park et al. (2022) introduced a new template based on the Mrk 493 spectrum to improve the modeling of Feii emission in I Zw 1-like sources.
Significant strides in predicting near-infrared (NIR) Feii spectra were accomplished by Sigut and Pradhan (1998) and Sigut and Pradhan (2003) through their utilization of the Ly fluorescence excitation mechanism to elucidate Feii emission within the wavelength range of, 8500 - 9500 Å. This Ly process exclusively governs the stimulation of energy levels reaching up to 13.6 eV, giving rise to the emission lines observed within this spectral segment. This assertion was corroborated by observations conducted by Rodriguez-Ardila et al. (2002). A semi-empirical template for NIR Feii emissions was later developed by Garcia-Rissmann et al. (2012), combining an observed spectrum of I Zw 1 with theoretical models from prior works by Sigut and Pradhan (1998, 2003); Sigut et al. (2004). More recently, this semi-empirical template was successfully applied in the NIR Fe ii modeling in several AGNs spectra by Marinello et al. (2016, 2020).
It is important to note here that the NIR spectrum exhibits Feii emission lines that are either isolated or semi-isolated, in contrast to the UV-optical region (see Figure 1). This feature provides a distinct advantage by enabling a more precise and reliable determination of the Feii emission line properties. The Feii lines around the 1-micron region at 9997, 10502, 10863 and 11127 are the most intense among the Feii lines (Rudy et al., 2000; Rodriguez-Ardila et al., 2002; Riffel et al., 2006).
Recent research (Marinello et al., 2016) has highlighted the intrinsic correlation between Feii emission in the optical and near-infrared spectral regions. Due to the intricacies of Feii ion’s behavior and the challenges associated with modeling its emission, researchers have been prompted to explore alternative approaches for investigating the Feii emitting gas (Martínez-Aldama et al., 2015; Panda et al., 2020). Observational and photoionization modeling works have been indicating that less complex ions, such as Caii triplet (8498Å, 8542Å, and 8662Å, also known as CaT), and Oi lines at 8446 and 11287, can serve as proxies for studying the spatial distribution of Feii emitting gas (Marinello et al., 2016; Rodriguez-Ardila et al., 2002; Martínez-Aldama et al., 2015; Panda et al., 2020; Panda, 2021).
The Feii emission is dependent on the BLR temperature and gas density, and also on other parameters such as composition and Brownian motion within the BLR cloud – high temperature (5000 - 10000 K), relatively high density (log nH = 10 - 12 cm-3), super-solar abundances and micro-turbulence of the order of 100 km s-1 have been shown to positively impact the production of the Feii emission, especially in the UV and optical (Baldwin et al., 2004; Bruhweiler and Verner, 2008; Panda et al., 2018, 2019). In a recent study dos Santos et al. , we assessed the NIR Feii emission in I Zw 1 under low column density regime (1022 cm-2). In this current work, we make a comprehensive analysis of the influence of micro-turbulence on NIR emission, over a broad range of cloud densities and metal content, in conjunction with the optical region.
We aim to model the Feii emission to understand the line formation and the nature of the physical conditions in AGN with strong Feii emission, exploring how changing metal content and micro-turbulence effectively increases the Feii optical and NIR emissions simultaneously. For this purpose, we investigate three cases of micro-turbulence velocities within the ionized media, i.e., 0, 10, and 100 km s-1 and their impact on the optical and NIR Feii emission (based on the previous study by Panda (2021) which focused only on recovering the optical Feii emission). The inclusion of the micro-turbulence parameter has been shown to augment the Feii emission line intensity in the optical and UV regions, due to the increase in the overall random, Brownian motion of the ions within the cloud (Panda et al., 2018, 2019; Sarkar et al., 2021). This is the first study that tests the effect of micro-turbulence and metal content on the production of NIR Feii emission, along with the optical Feii emission.
The paper is organized as follows: Section 2 presents the observational spectroscopic data in the optical and NIR for I Zw 1. Section 3 describes the extraction of the Feii emission in the optical and NIR regime and estimation of the corresponding Feii strengths from the observed spectra. In Section 4, we demonstrate the modeling setup using the photoionization code cloudy (Ferland et al., 2017). Results are highlighted in Section 5, followed by a brief discussion in Section 6. We summarize our findings from this study in Section 7.
2 I Zw 1 the prototypical Feii emitter
The I Zwicky 1 (I Zw 1) is a nearby (z=0.061) Narrow-line Seyfert 1 galaxy (NLS1), considered a prototypical Feii emitter, and widely studied in the literature (Wills et al., 1985; Rudy et al., 2000; Vestergaard and Wilkes, 2001; Véron-Cetty et al., 2004; Huang et al., 2019). NLS1s, a subclass of classical Type-I AGNs, display a narrower-to-broader range of H line widths compared to classical Seyfert-I galaxies, which typically feature FWHM(H) 2000 km s-1 and a flux ratio, [Oiii]5007/H3 (Osterbrock and Pogge, 1985).
The I Zw 1 spectrum has a rich historical record of UV, optical, and NIR studies (Boroson and Green, 1992; Vestergaard and Wilkes, 2001; Kovačević et al., 2010; Garcia-Rissmann et al., 2012). Recent reverberation mapping estimated the BLR’s distance of the line-emitting BLR from the central ionizing source, RBLR=37.2 light-days (Huang et al., 2019), a crucial parameter in our model that allows to minimize the degeneracies in our models.
To perform the optical and NIR analysis, we use the reduced and available spectra of the I Zw 1 from previous works Rodriguez-Ardila et al. (2002); Riffel et al. (2006); Garcia-Rissmann et al. (2012); Marinello et al. (2016). The NIR spectrum was observed using the 3.2 m IRTF telescope (NASA Infrared Telescope Facility) at Mauna Kea, Hawaii-USA in 2000 (PI: Rodríguez-Ardila). It employed the SpeX spectrograph in cross dispersion mode (SXD) covering the wavelength interval 0.8 - 2.4 microns, and photometric bands zJHK, with a spectral resolution, R = 2000 corresponding to the 0.8” 15” slit. Rodriguez-Ardila et al. (2002) and Riffel et al. (2006) presented in detail the reduced spectrum and related observational information. The optical counterpart region was obtained from the published work of Rodriguez-Ardila et al. (2002). The optical spectrum was obtained at the CASLEO Observatory (Complejo Astronómico el Leoncito — San Juán, Argentina), employing the REOSC spectrograph in long slit mode covering the range 3500 - 6800 Å with resolution is 0.10 Å pixel-1.
3 Optical and NIR Feii Templates
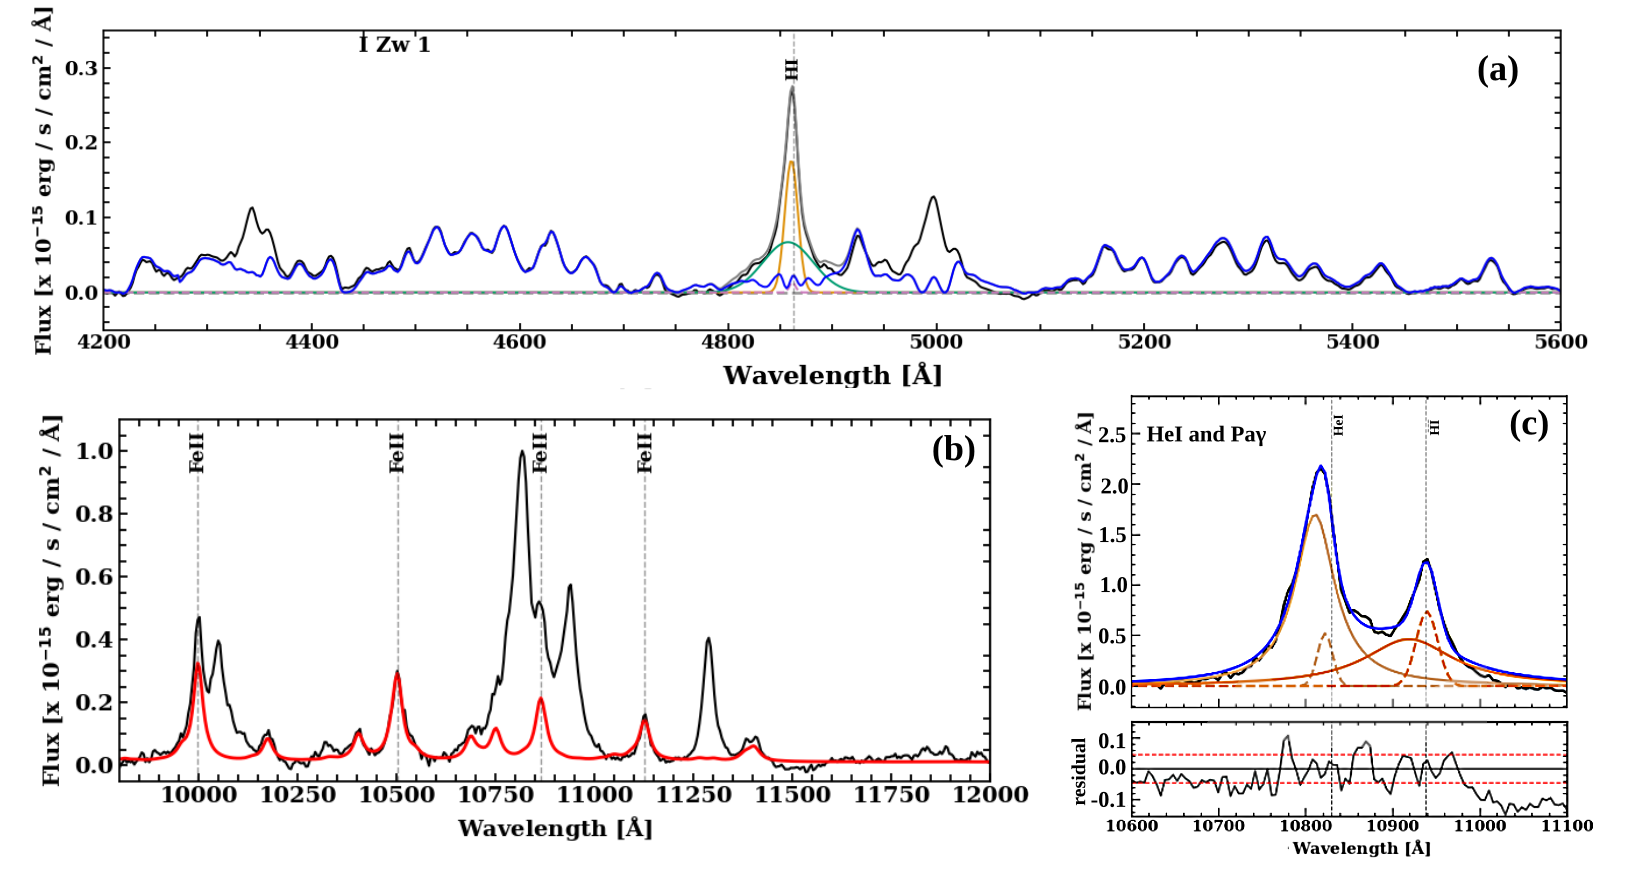
The Feii pseudo-continuum is comprised of a multitude of permitted Feii lines spanning from the UV to the NIR spectral regions, necessitating the use of templates for accurate modeling. In the optical domain, we used the empirical Feii template by Boroson and Green (1992) derived from the spectrum of I Zw 1, the archetypal Narrow-Line Seyfert 1 (NLS1) galaxy. In the NIR range, we employed the semi-empirical template from Garcia-Rissmann et al. (2012). These models encompass approximately 1915 lines, within the wavelength range of 8000 - 11600 Å. The Feii spectrum was synthesized using the template, where first we widened it based on the width of the 10502 Å line, and then scaled the template to match with the observed spectrum. We use the 10502 Å line as it is the most isolated Feii line in this region, thus allowing for accurate measurement of the overall Feii intensity. The best-fit template was determined by minimizing the chi-square value at, 10502 Å. Figure 1 illustrates the spectral fitting and component decomposition for the optical and NIR region for I Zw 1. The estimation of flux uncertainty is based on the standard deviation of the best-fitted model, considering the spectrum within 3 of the lines of interest. For the ratios, we employed error propagation to estimate their uncertainties (see Table 1). In NLS1s, BLR emission line profiles are best represented using Lorentzian, while those of Type-I AGN with broader lines follow Gaussian shapes (Marziani et al., 2022). We fit the emission lines using the LMFIT library from Python, employing Lorentzian profiles to represent the BLR components, where the minimizes the residual left after subtraction of the fitted profile. For lines emitted by the Narrow-line Region (NLR), we employ only Gaussian components. This procedure enabled us to measure the integrated flux, FWHM, and centroid position of the lines of interest for this study.
From these spectra and template fits, we obtain the optical Feii and NIR intensities and their respective ratios to the nearest Hydrogen line, where for the optical Feii we obtained R4570 = 1.620.06. Our findings are similar to previous works (1.47 (Sulentic et al., 2000)). For R, we observe a discrepancy between our findings and the results reported by Marinello et al. (2016) where they recover a ratio, R1μm = 1.810.08. It is crucial to clarify that the value of 1.81 is derived from the study by Marinello et al. (2016), and not from our current investigation. This value, from our analysis, is much smaller. We refer the readers to Table 1. The noted disparity is attributed to differing methodologies employed in the two studies. Specifically, Marinello et al. (2016) estimated measurements corresponding to Pa and utilized the theoretical lines’ ratio from Garcia-Rissmann et al. (2012) to re-scale to Pa intensity. In contrast, our approach involves the estimation of the flux of the broad component of Pa. We opted for the utilization of Pa rather than Pa, as the latter is situated within a telluric spectral region (see e.g., Marinello et al., 2020).
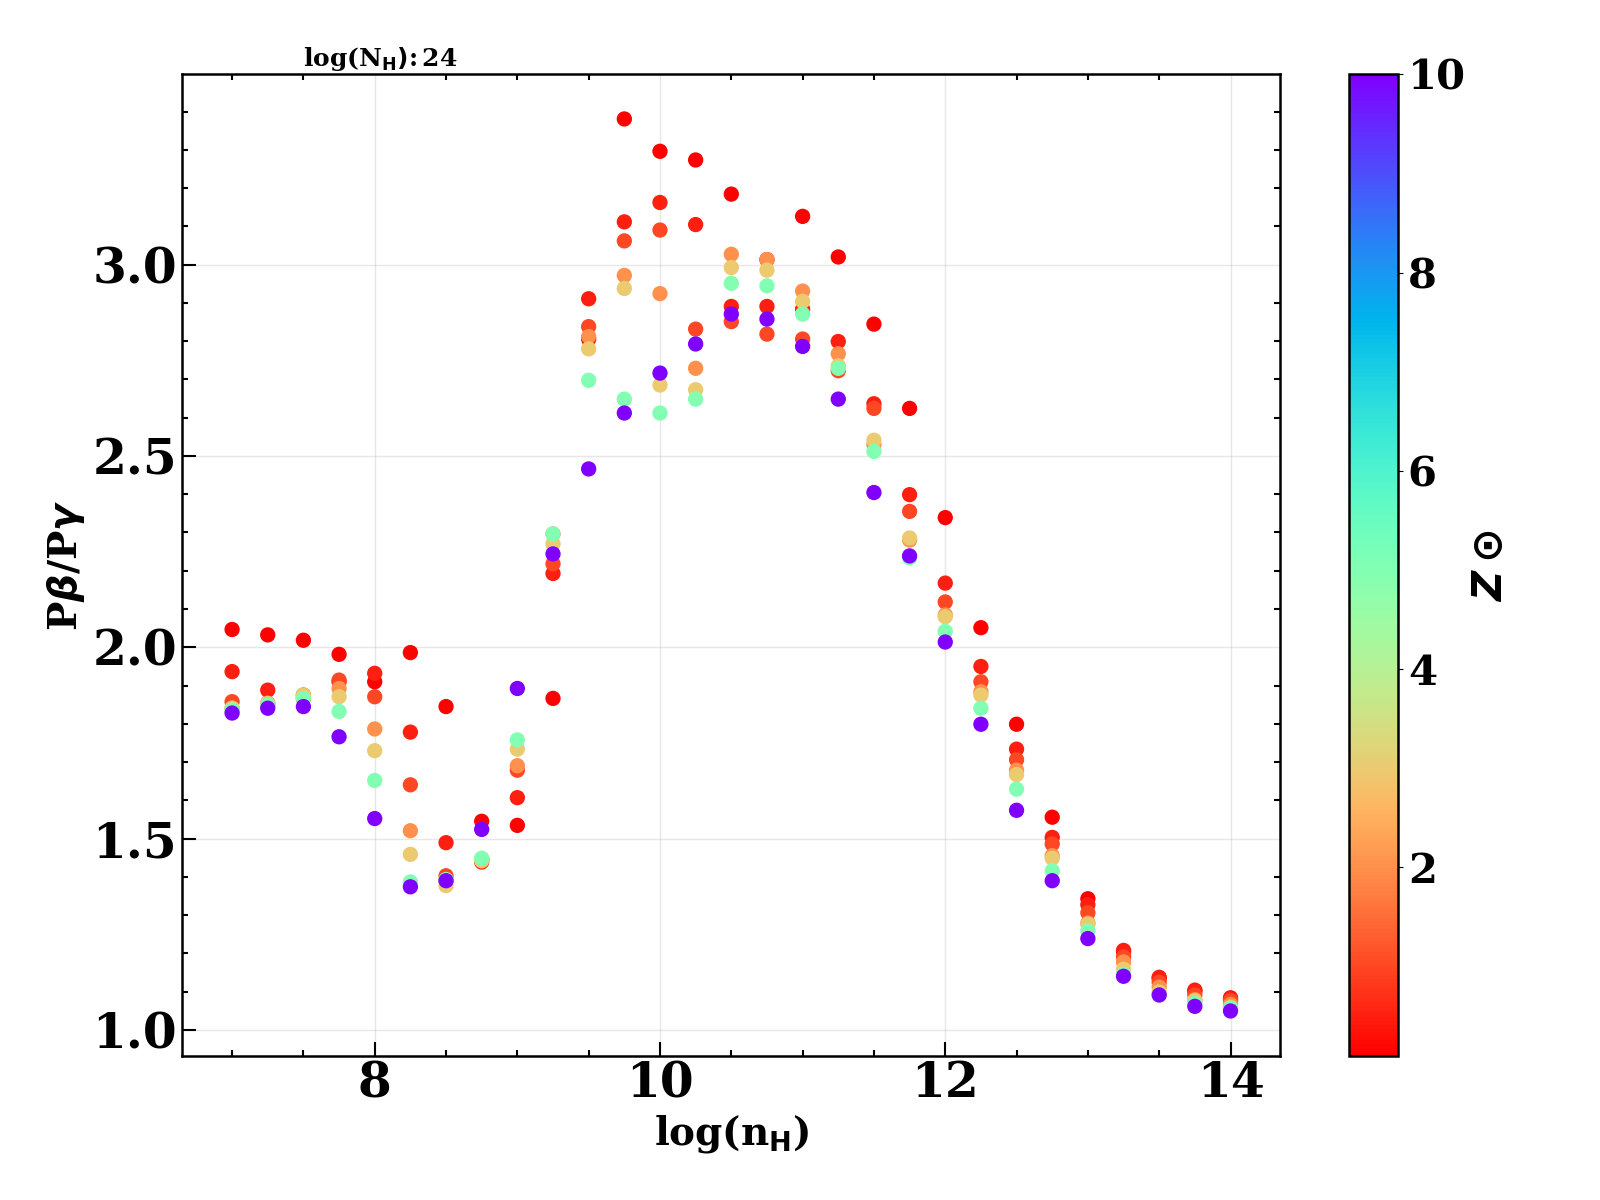
We investigated how the ratio between Pa and Pa evolves under varying gas physical conditions from our cloudy simulations (see Appendix 6) instead of using the theoretical value for Pa/Pa (i.e., 0.8531). In Figure 6, we highlight the dependence of the ratio on the cloud density as a function of the a range of metal content that is assumed in this work using cloudy photoionization code. The value of the Pa/Pa ratio varies between 1.05 - 3.38. We assume a fixed column density (=1024 cm-2) with no micro-turbulence for this analysis. We then derive the R1μm estimates based on the calculated minimum and maximum value of the ratios obtained from these simulations which we detail in the next section. We re-scale the Pa observed flux to get the flux for Pa (for the minimum and maximum values of their ratio) and estimate the minimum and maximum values for the intensity of Feii 1-micron lines. Consequently, we obtained a range of values for R1μm = 0.460.47, and 1.480.15, respectively.
| Feii10502 | Feii9998 | Feii10863 | Feii11127 | Pa | R1μm | H | Feii 4570 | R4570 |
|---|---|---|---|---|---|---|---|---|
| 2.701.38 | 4.131.06 | 0.1500.17 | 2.321.29 | 5.960.83 | 0.460.47 - 1.480.15 | 10.301.84 | 16.702.80 | 1.620.06 |
4 Photoionization modelling
The range of the physical conditions, used in this work, was based on previous approaches (Panda et al., 2020; Panda, 2021; dos Santos et al., ). We employ the default model for the Feii ion in cloudy, i.e., the one defined by Verner et al. (1999), which includes 371 levels ranging in energy up to 11.6 eV, and 68,635 transitions to keep the consistency with previous studies in low column density regimedos Santos et al. .
We carry out numerical simulations using cloudy v17.03 (Ferland et al., 2017). To constrain the number of free parameters to three, we adopt the following fixed values: the luminosity at 5100 Å , L5100 = 3.191044 erg s-1 from Kaspi et al. (2000), the BLR radius determined via reverberation mapping, RBLR = 37.2 light-days, based on Huang et al. (2019), and a cloud column density NH = 1024 cm-2 as concluded from earlier studies involving the recovery of the optical Feii emission in this source (Panda et al., 2020; Panda, 2021). Also, we adopt the spectral energy distribution for I Zw 1 from Panda et al. (2020) as the radiation field in our simulations. Thus, the remaining free parameters are: (i) the cloud mean hydrogen density, nH which ranges between 109 - 1014 cm-3 and (ii) the metal content in the cloud in the range of 0.1 10 (in solar units), estimated using the GASS10 module (Grevesse et al., 2011). Moreover, we incorporate two scenarios for internal random motions within the BLR clouds, specifically micro-turbulence (Vturb) of 10 and 100 km s-1. The micro-turbulence in the BLR is caused by random motions of photons within the ionized gas, which is likely triggered by magnetic fields in the confined clouds (Bottorff and Ferland, 2000; Rees, 1987) and acts as a secondary contributor to the overall line width, as has been shown in previous studies (e.g., Kollatschny and Zetzl (2013)). We assume the values for the micro-turbulent velocity based on previous works, which were successful in modeling the Feii emission in the UV region for I Zw 1 about 10-30km s-1 (Bruhweiler and Verner, 2008). In addition, Panda et al. (2018); Panda (2021) find that a micro-turbulence velocity between 10-100 km s-1 can reproduce the Feii emission in the optical region. Additionally, as we aim to compare the effect of using micro-turbulence in the gas, we perform simulations in the absence of micro-turbulence in the gas (Vturb = 0 km s-1). This results in a total of 609 model combinations: Vturb (3) nH (29) Z (7).
5 Results
We derive from cloudy models the optical Feii and the NIR Feii ratio, denoted as R4570 and R1μm, respectively. The R4570 represents the ratio of the flux of optical Feii multiplets 37, 38, within the range 4434 - 4684 Å to the flux of H broad component (Boroson and Green, 1992; Sulentic et al., 2000). The R1μm is calculated as the ratio of the combined fluxes from the four NIR prominent isolated Feii lines at wavelengths 9997, 10502, 10863, and 11127 to the flux of Pa broad component (Rodriguez-Ardila et al., 2002). Rodriguez-Ardila et al. (2002) and Marinello et al. (2016) demonstrate that the optical and NIR intensities are correlated, indicating that both emissions should have origin and excitation mechanisms in common.
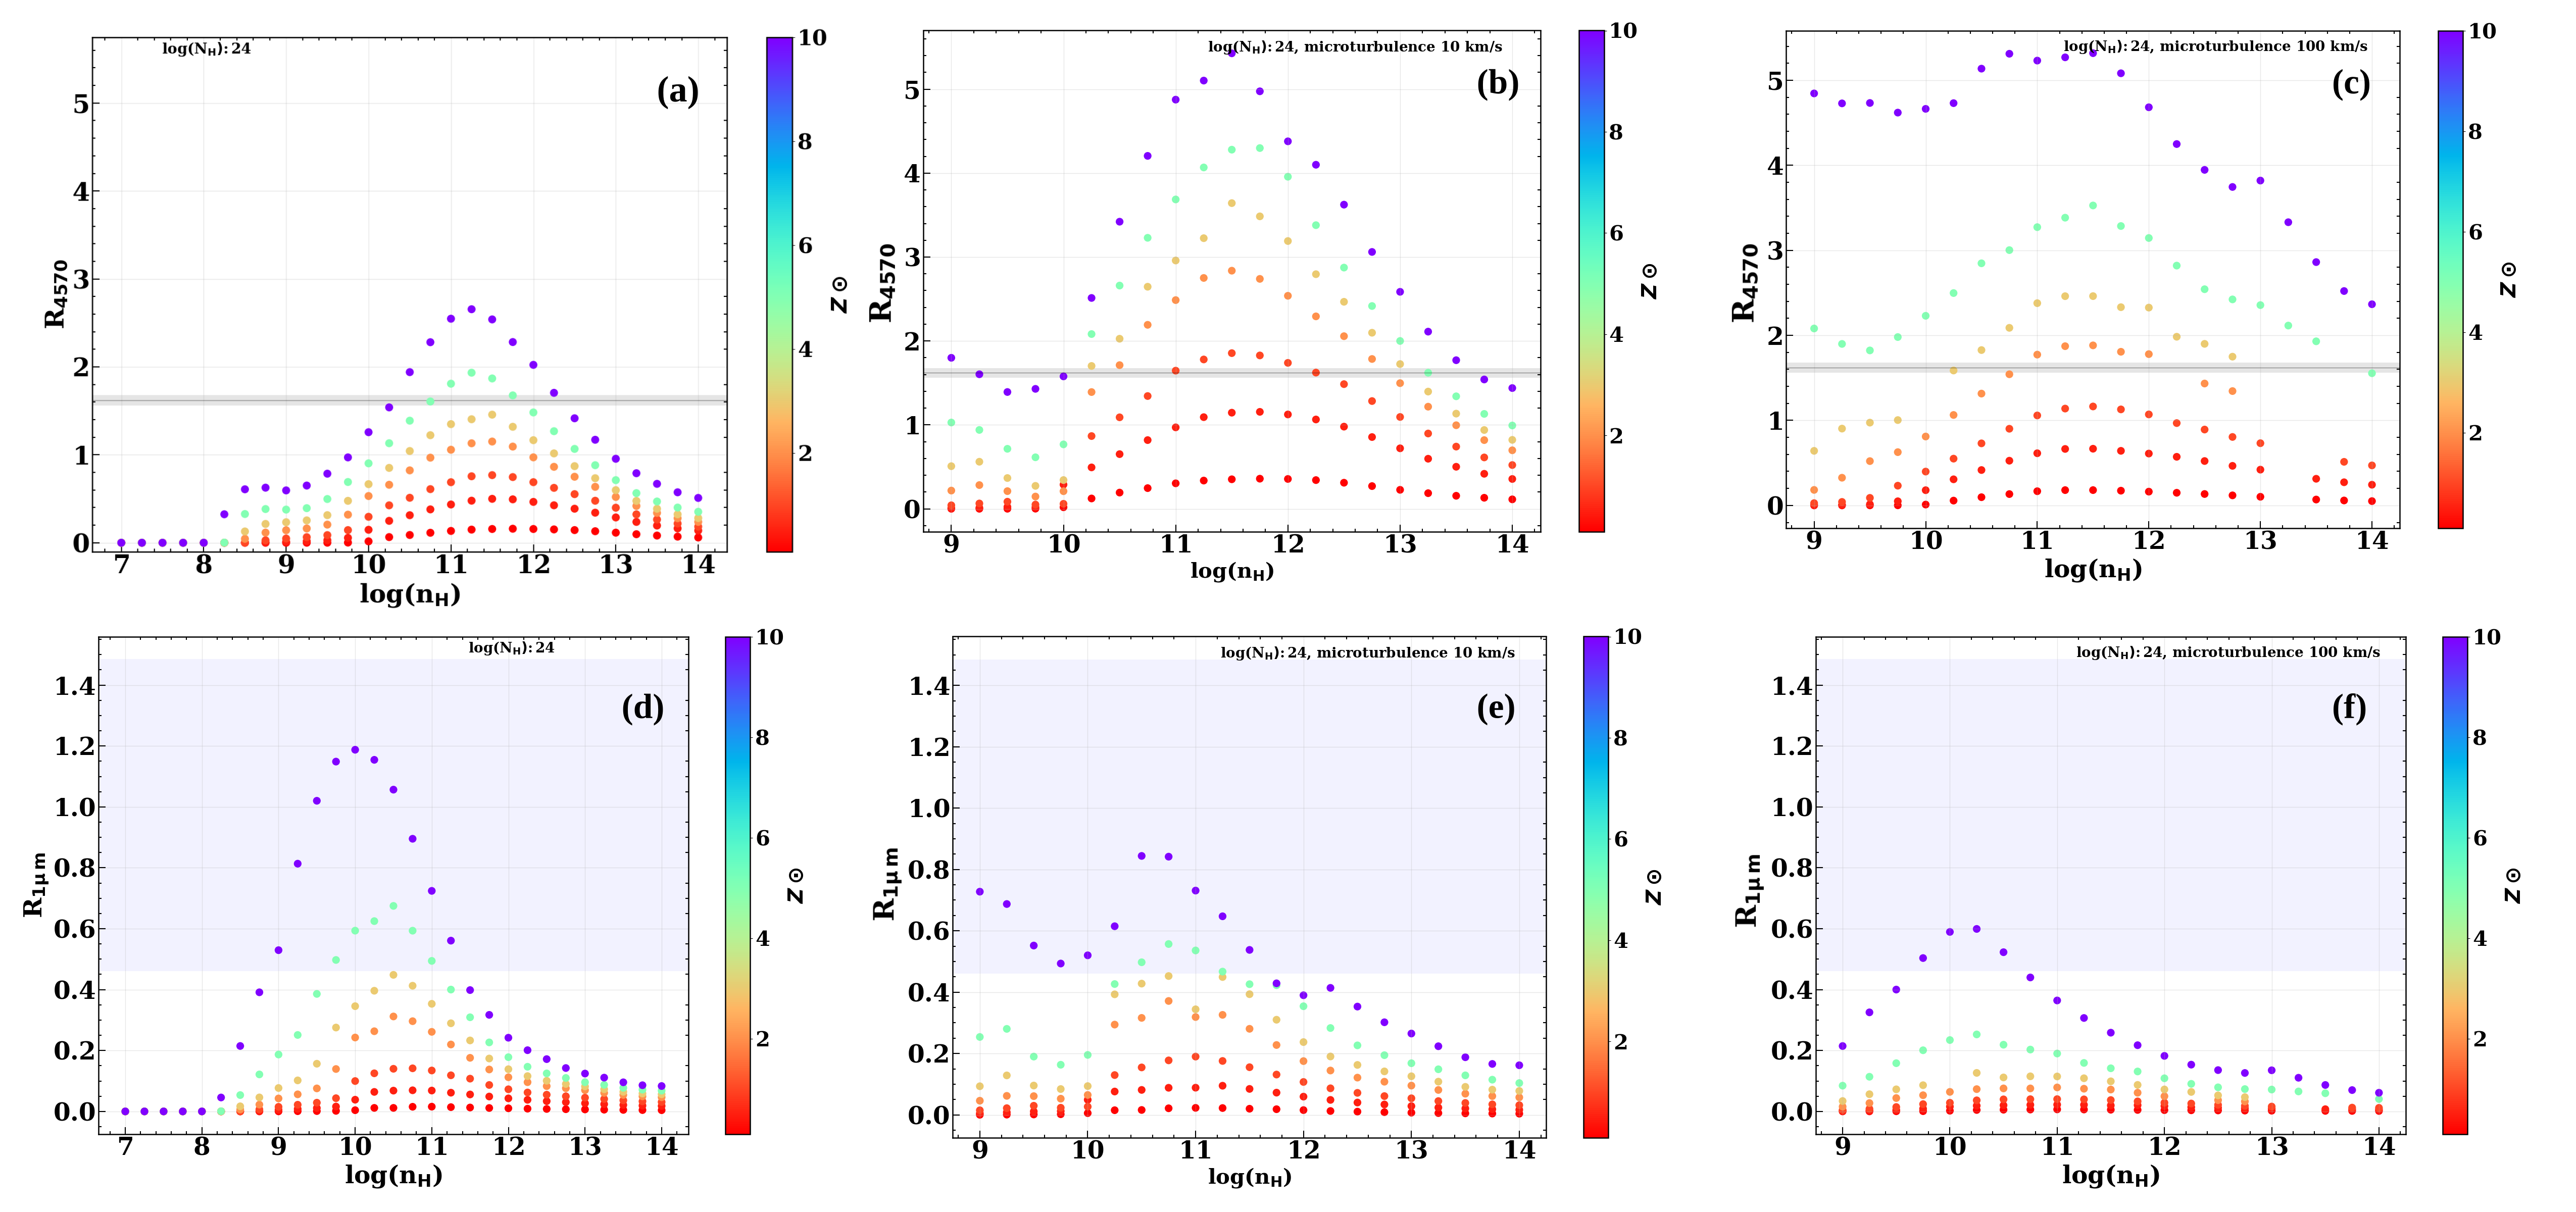
In the optical Feii emission, the micro-turbulence effect has been extensively studied (Bruhweiler and Verner, 2008; Panda, 2021), but not in the NIR. In this work, for the first time, we study the micro-turbulence effect applied to the NIR Feii region. The results are shown in Figure 2 for the column density scenario of 1024 cm-2 for optical (upper panels) and NIR (lower panels) spectral regions. The diagnostic diagrams in the same figure show the outcomes for Vturb values of 0, 10, and 100 km s-1, for R4570 and R1μm intensities as a function of the local cloud density. In each of the panels in Figure 2, we observe how the intensities vary with different metal content levels in the BLR clouds depicted using the color gradient. We further highlight the observed ratios, R4570 and R1μm, and their associated uncertainties, obtained by fitting the observed spectra, using the gray and blue shaded regions, respectively.
5.1 No micro-turbulence
Our result without micro-turbulence (i.e., at 0 km s-1) is shown in the left panels of Figure 2, where we compare the simulated results from cloudy with the observed values for optical and NIR, R4570 = 1.620.06 and R1μm = 0.46–1.48, respectively, represented by the gray and blue bands222the symmetric errors for 1-micron values are 0.15 and 0.47, respectively, also highlighted in Table 1.. Here, the widths of the gray bands account for the uncertainties associated with the ratios. The results show that we can reproduce R4570 with a metal content above 3 Z⊙ and with a local hydrogen density between 1010.75–1012.50 cm-3. Moreover, from the NIR results, to reproduce R1μm, it is necessary to have a local hydrogen densities range from 109.00 to 1011.50 cm-3, and a metal content above 3 Z⊙. These results demonstrate a comparable physical parameter range to reproduce the Feii strengths for I Zw 1 in the optical and NIR regimes within our setup.
5.2 Applying micro-turbulence
Previous studies (Bruhweiler and Verner, 2008; Panda et al., 2020) demonstrated that the value obtained for R4570 in high metal content simulations can be achieved by increasing the micro-turbulent velocity. To investigate how changing metallicity and micro-turbulence can increase both optical and NIR emissions simultaneously, we include two cases of micro-turbulent velocity, at 10 and 100 km s-1, and compare it with the default case (i.e., with no micro-turbulence). We expect that the micro-turbulence in the gas increases the Brownian motion within the cloud and allows for the Feii ions to receive preferentially more ionizing photons, consequently leading to an increase in the intensity of the Feii lines.
The results using micro-turbulence of 10 and 100 km s-1 are shown in Figure 2 in the middle and right panels, respectively. Our results for the optical region reveal that the Feii at 4570Å strength increases with the increase in micro-turbulence, as expected from previous works (Panda et al., 2020; Panda, 2021).
On the other hand, the results in the NIR show a different behavior compared to the ones in the optical, as presented in Figure 2. Considering a single case with nH=1012 cm-3, solar metallicity, and Vturb = 10 km s-1 (see Figure 2 lower middle panel), R1μm is approximately 0.2, whereas at 100 km s-1, it dropped to 0.05 (see Figure 2 lower right panel). In contrast, the case with no micro-turbulence produces an R1μm value of 0.1 (see Figure 2 lower left panel). Notably, the absence of micro-turbulence results in lower R1μm values compared to the scenario with Vturb = 10km s-1, as expected, based on the results obtained in the optical regime. Although, for metallicities above solar, R values overall decrease when compared to scenarios without micro-turbulence. The R appears to be suppressed and fails to increase as expected from the optical results. For example, when we consider the highest metallicity value of 10Z⊙ (see Figure 2), and Vturb = 10 km s-1, and 100km s-1 the maximum Feii ratio in the NIR is, respectively, 0.8, and 0.6, whereas in the zero micro-turbulence case, this ratio approaches 1.2.
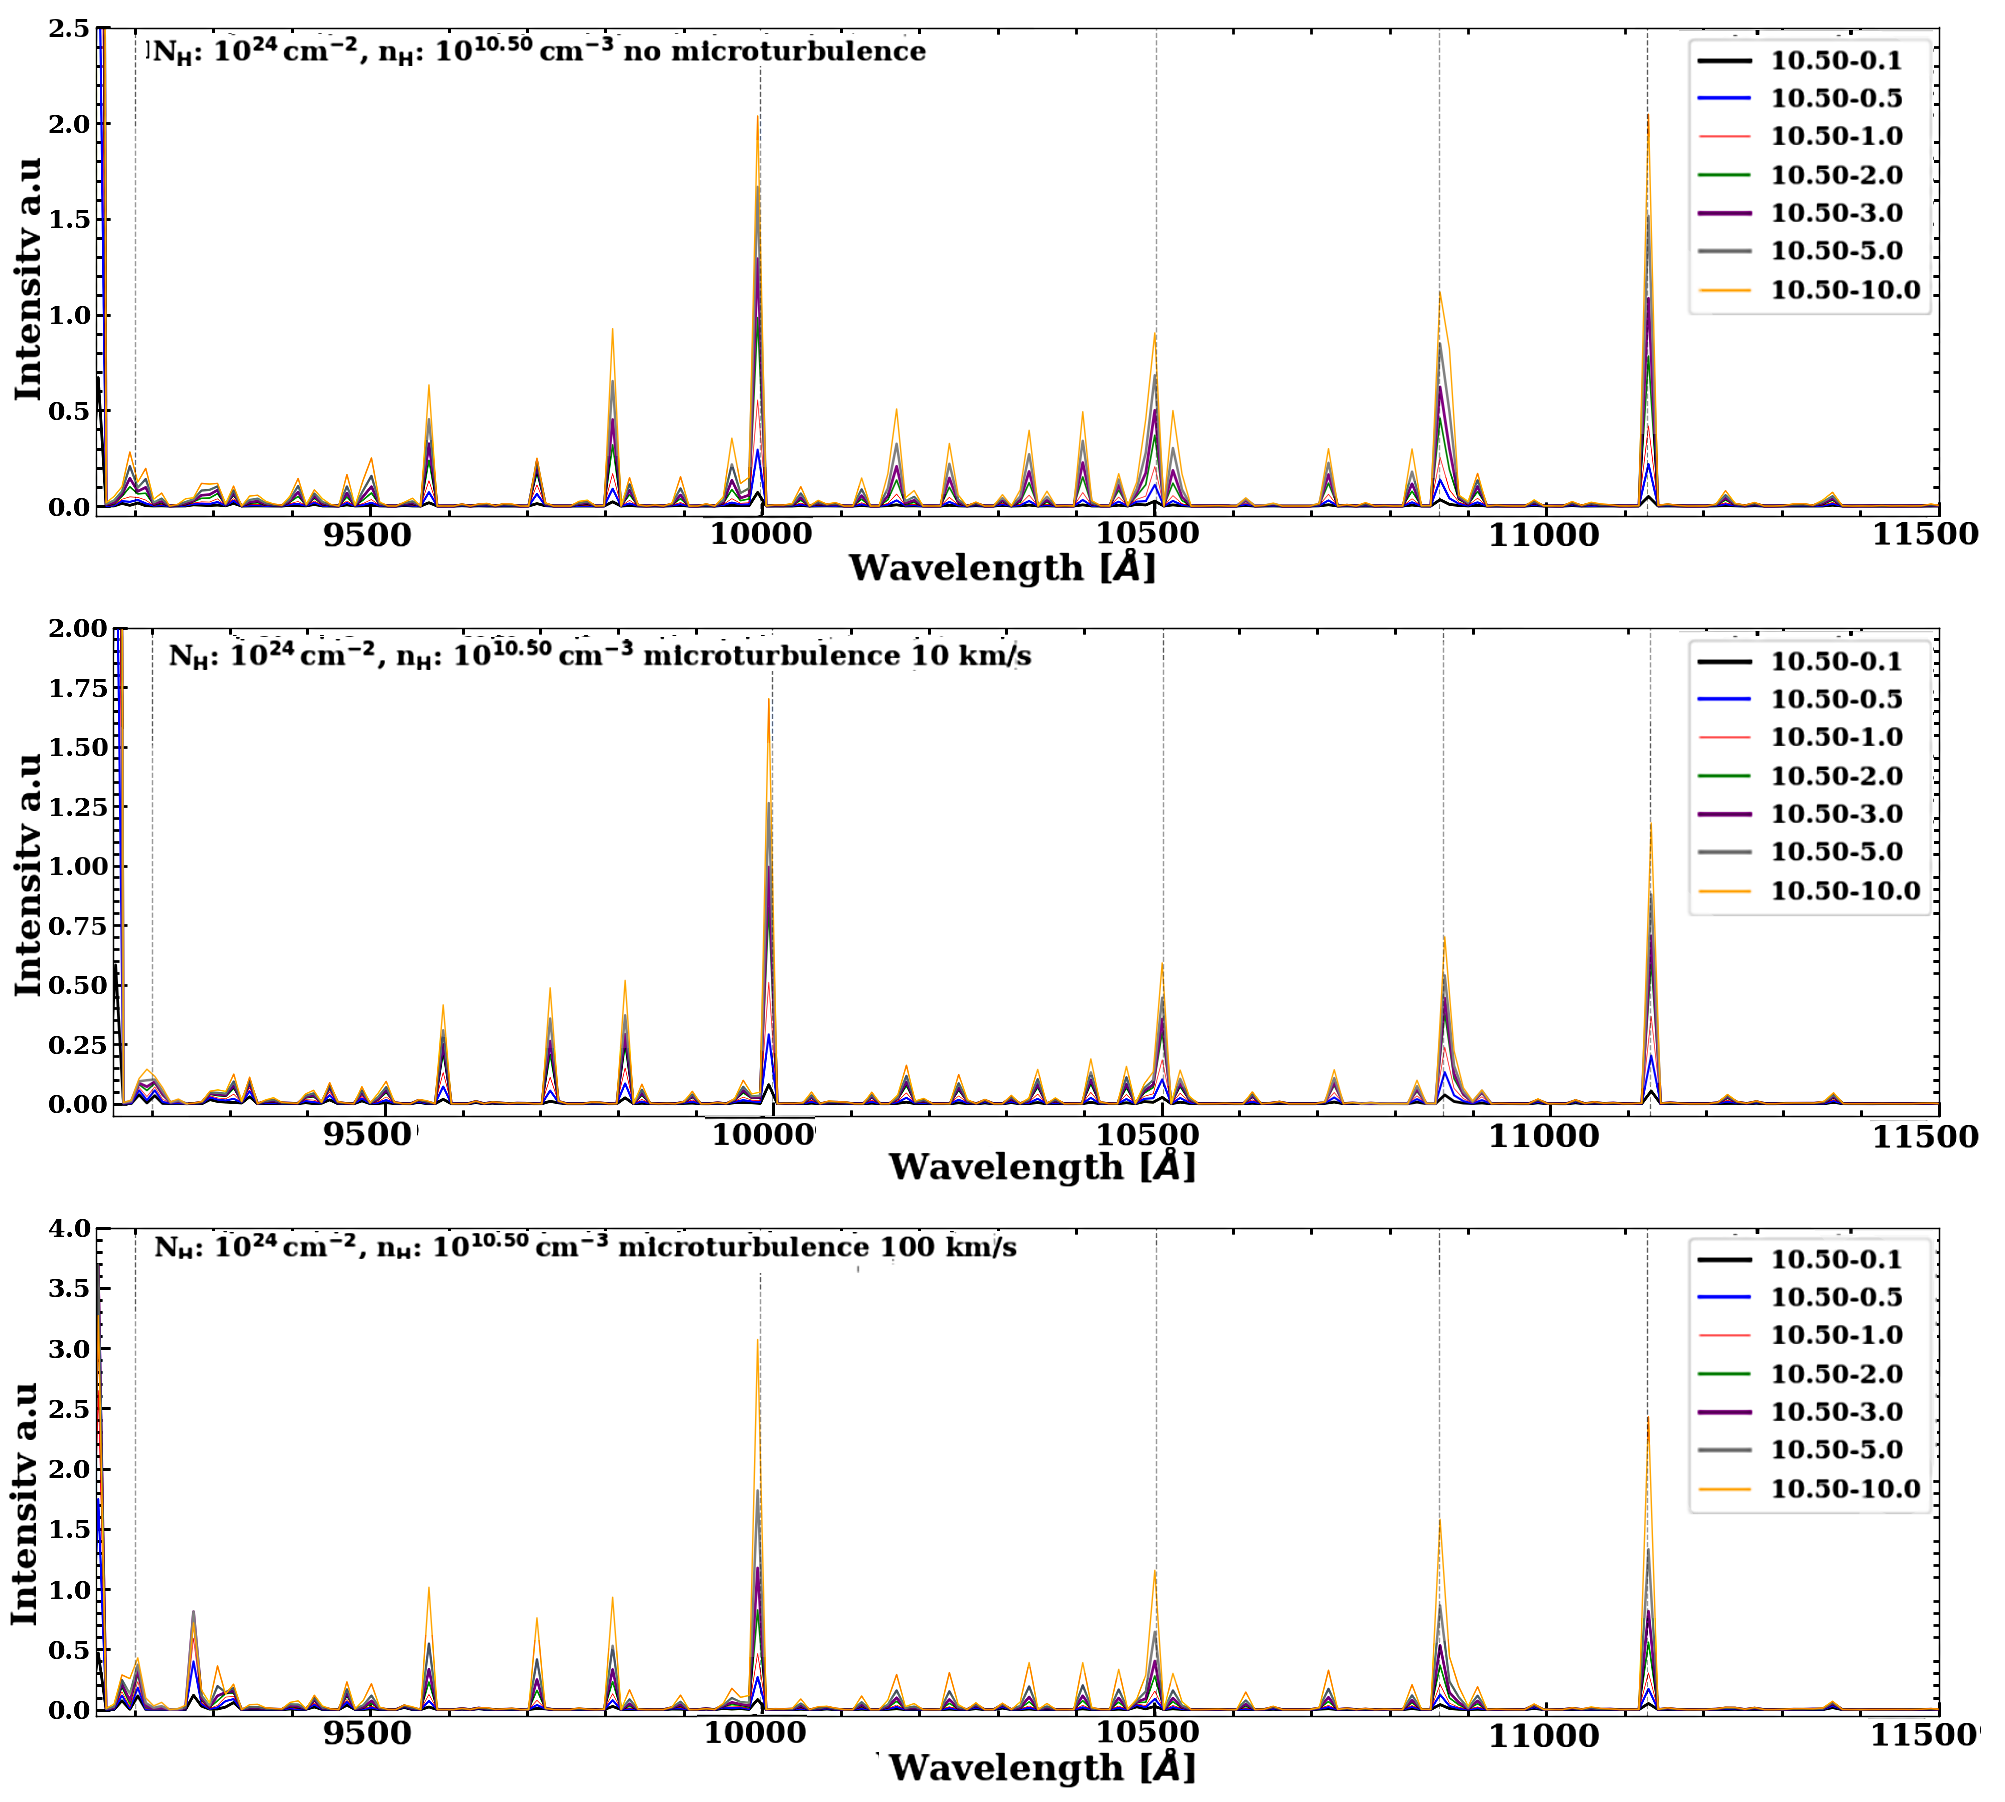
To comprehend this intriguing behavior from our cloudy simulations, Figure 3 provides a comparison of the Feii pseudo-continuum in the spectral region 9500–11500 Å for a fixed local hydrogen density (1010.5 cm-3) for three scenarios: without micro-turbulence, Vturb = 10 and 100 km s-1. We note that the pseudo-continuum of Vturb = 10 km s-1 exhibits less intense lines relative to the case without micro-turbulence. The case with 100 km s-1 shows even weaker Feii lines. Although, for the two cases with Vturb = 10 and 100 km s-1, we observe a boosting of lines , specifically between 9600–9900 Å, which were not prominent in the spectrum in the zero micro-turbulence case.
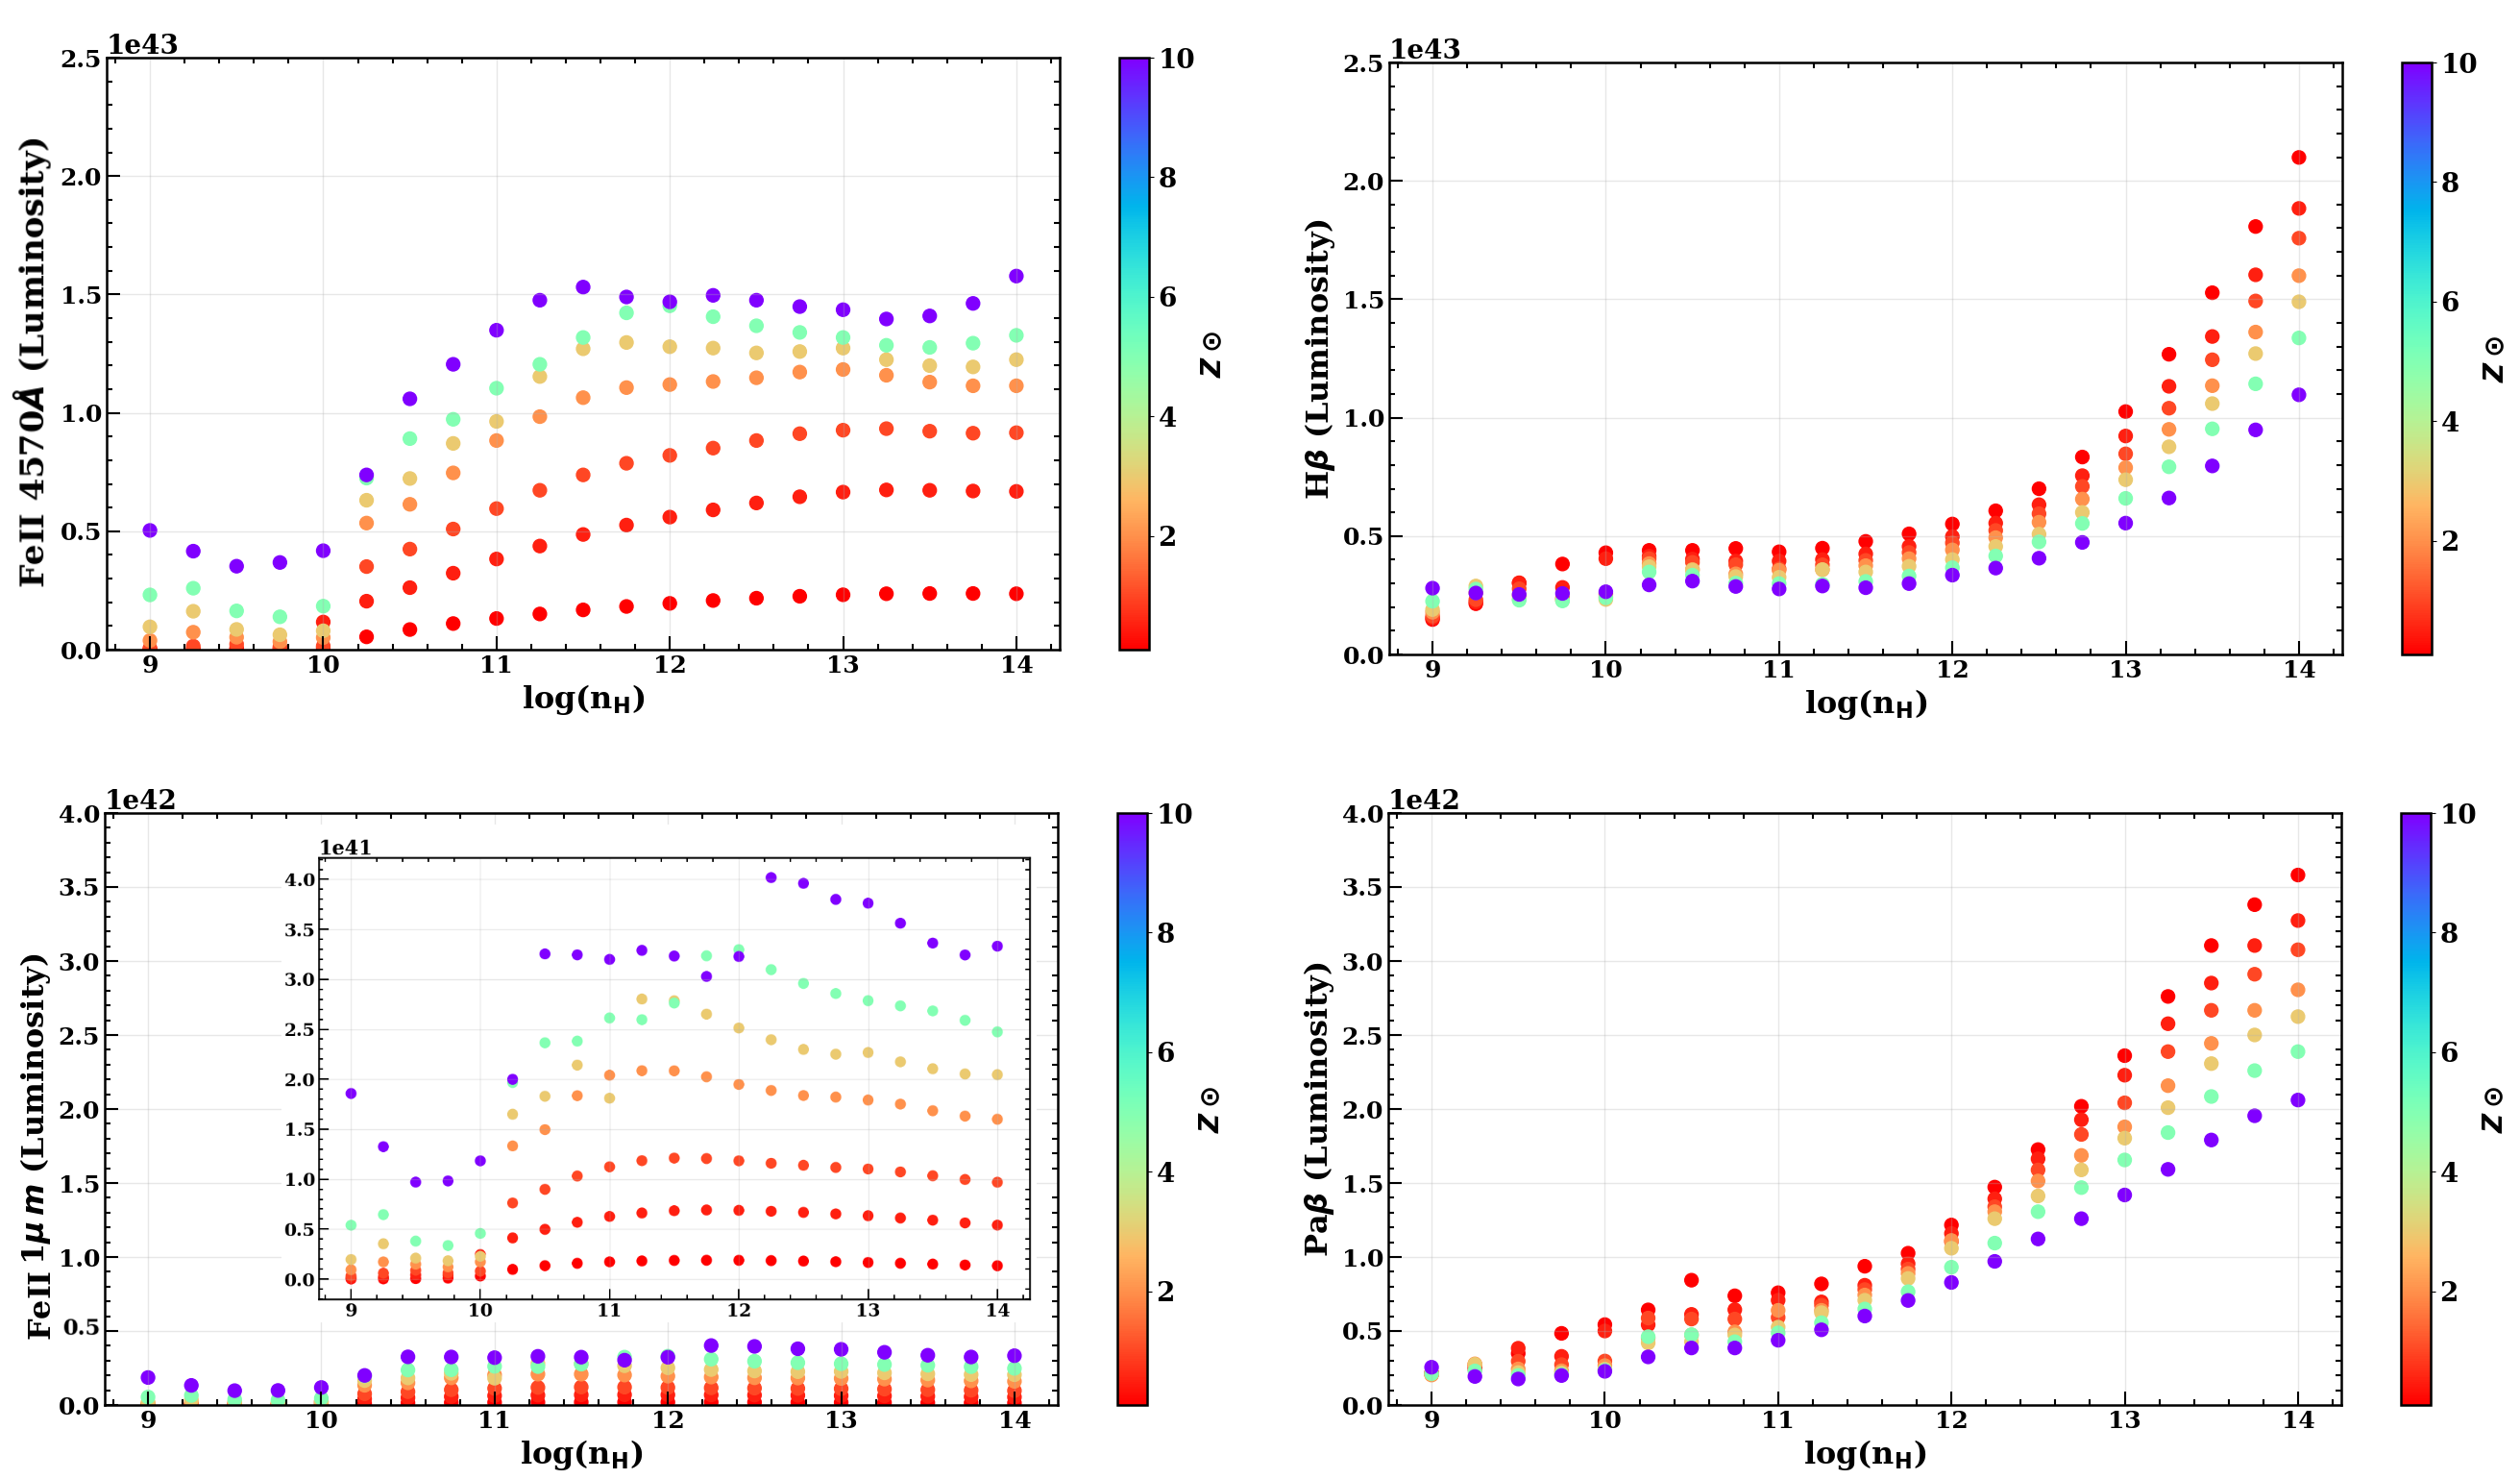
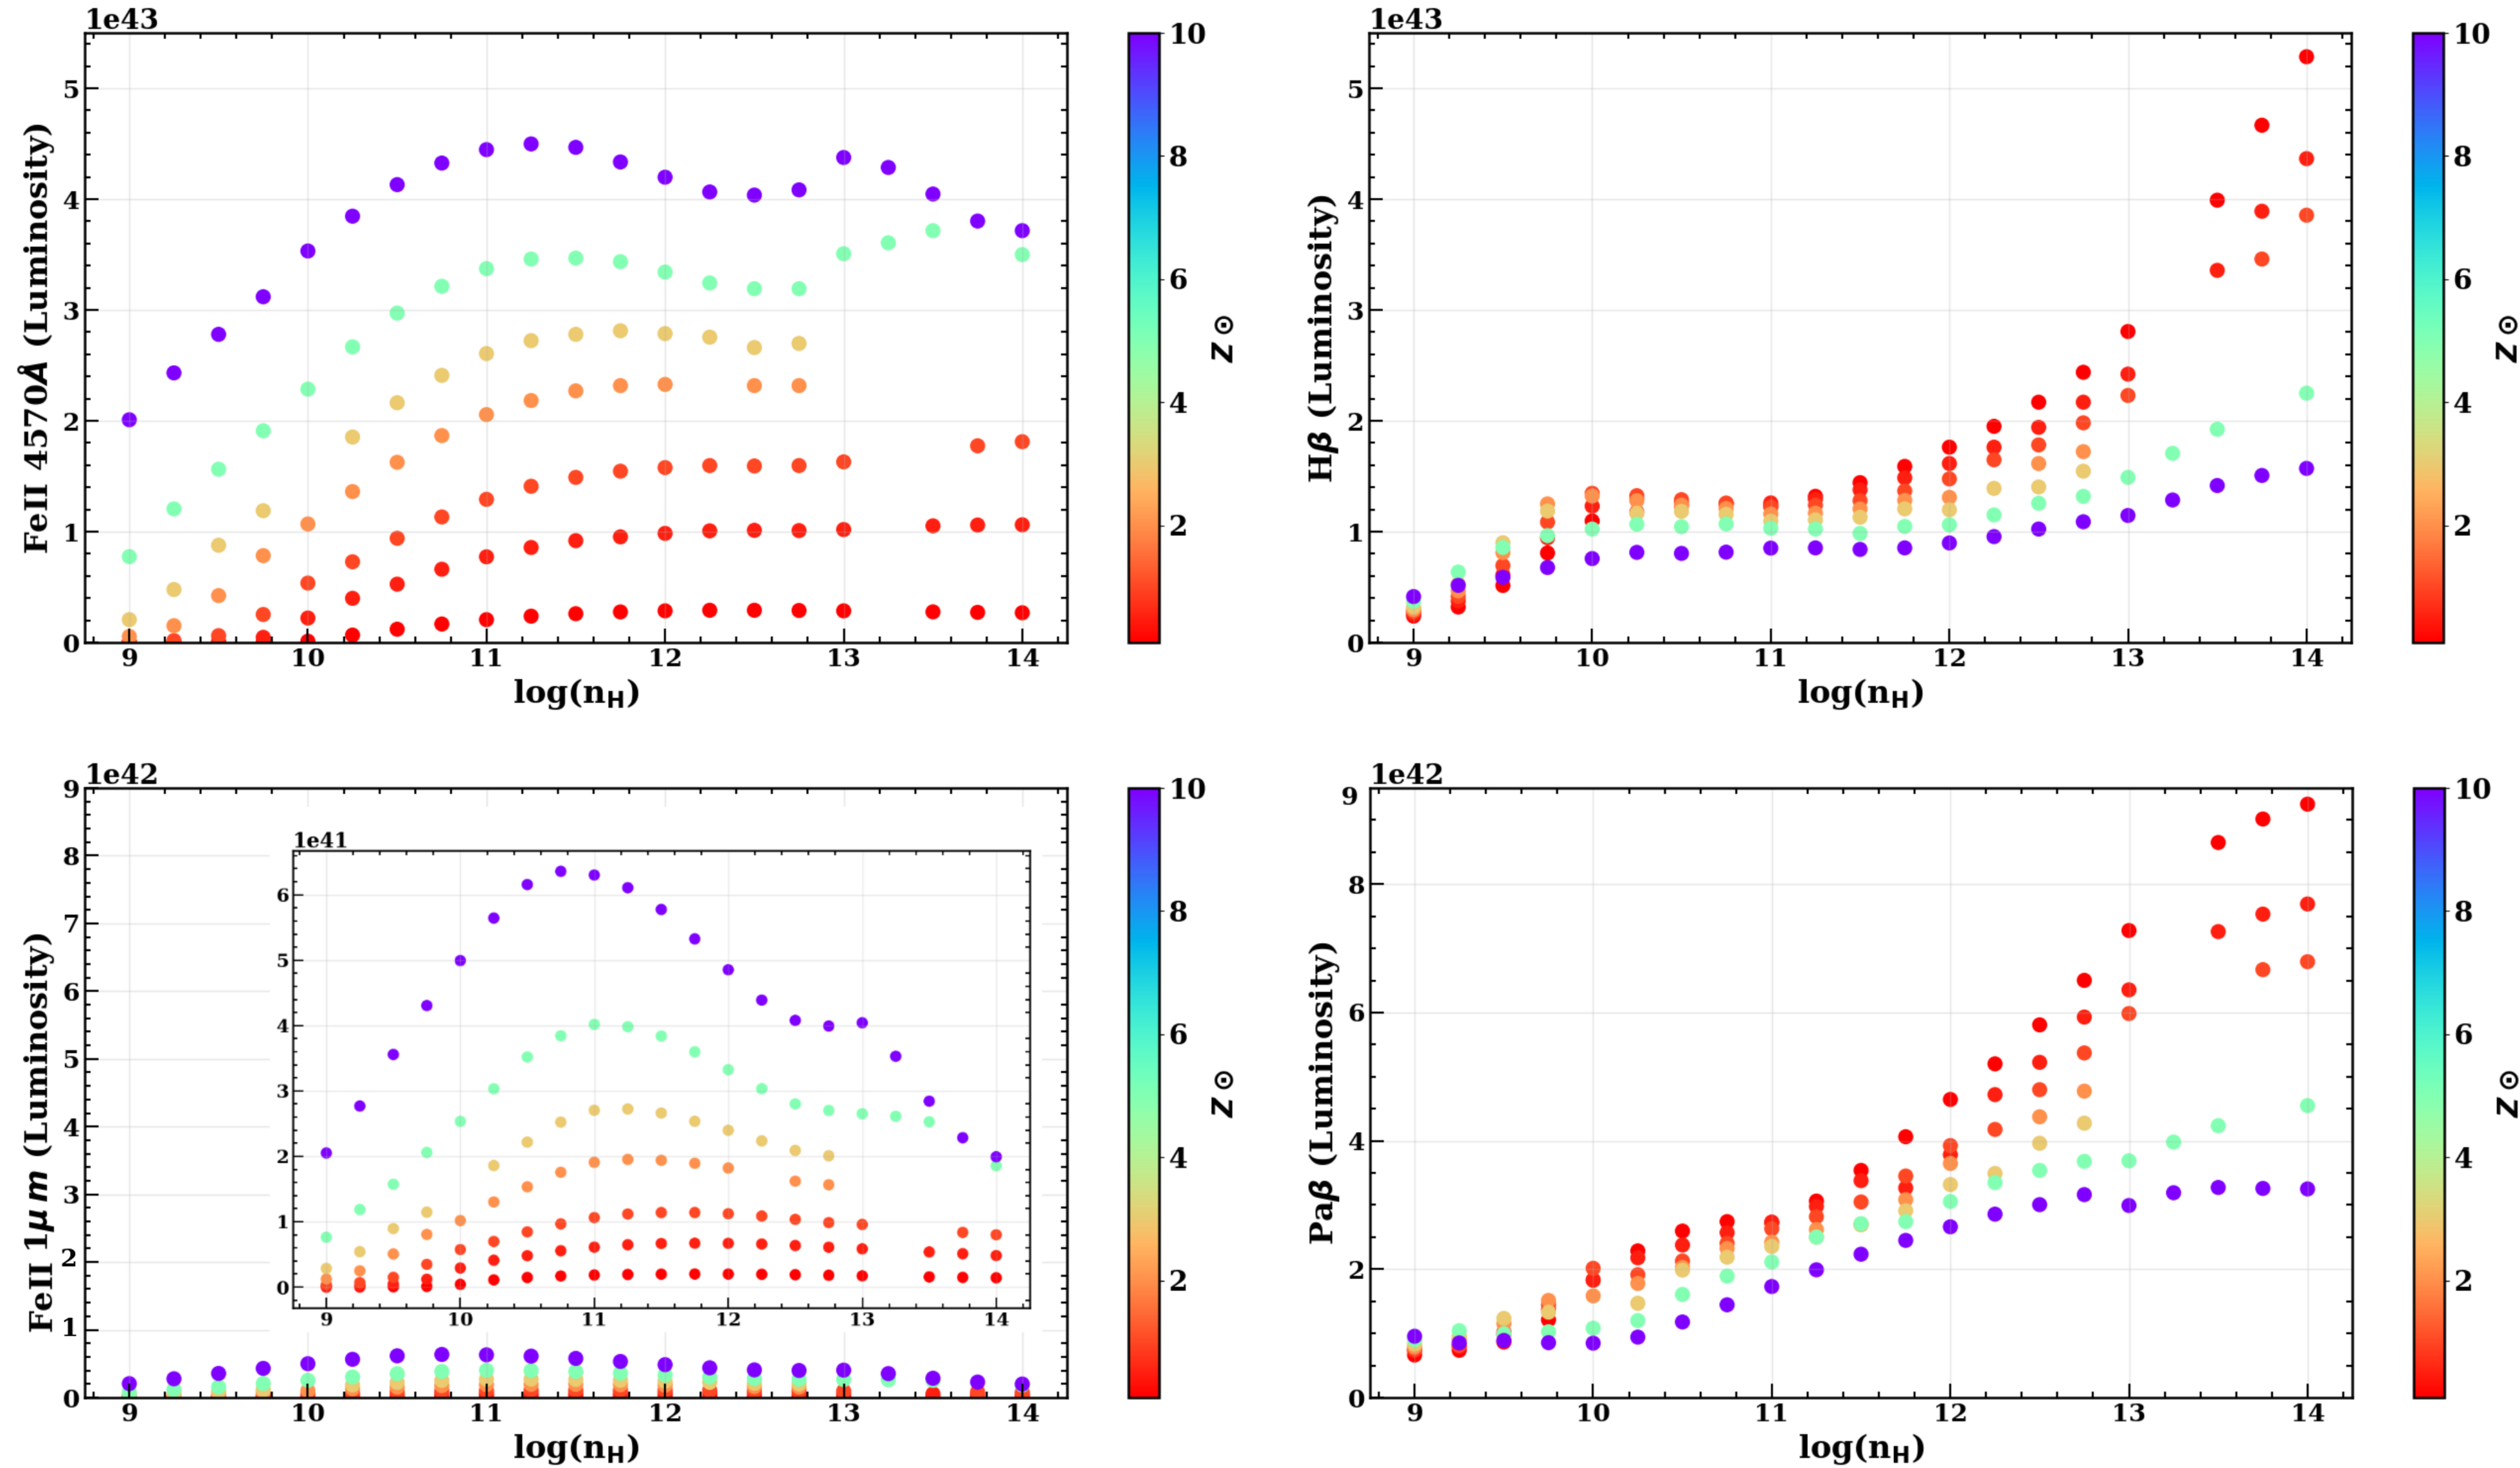
It is important to emphasize that the intensity of the NIR Feii is characterized by the ratio of four isolated emissions to Pa line, whereas the ratio in the optical is composed of blended Feii multiplets (m37, m38) normalized by the H (Kovačević et al., 2010; Marziani et al., 2021). Hence, to understand the variations in the R1μm, we need to study also the behavior of the Pa line across the parameter space, especially under the influence of microturbulence. We notice that the luminosity of the Pa emission significantly exceeds that of the NIR Feii lines. In contrast, in the optical range, both the H and the optical Feii lines exhibit a similar increase in luminosity with the density, as shown in Figures 4 and 5.
Moreover, the 1-micron lines exhibit two significant excitation mechanisms, collisional and Lyman- fluorescence, whereas the Feii bump at 9200 Å is exclusively influenced by the Lyman- fluorescence mechanism (Rodriguez-Ardila et al., 2002; Marinello et al., 2016). This distinction is an important indicator of the Lyman- fluorescence mechanism. In our work, we note that the 9200 Å region remains unaffected by the enhancement of micro-turbulence in the models.
6 Discussion
The specific influence of micro-turbulence on the NIR emission of Feii is particularly intriguing in comparison to its well-documented impact in the optical region. The optical models suggest that when micro-turbulence is introduced in the gas, it enhances the intensity of the Feii lines. Surprisingly, our simulations indicated a contrary trend in the NIR region, where the R1μm displays lower values when microturbulence is considered than when micro-turbulence is absent.
The discrepancy between our observations and cloudy predictions may raise intriguing questions regarding the true impact of micro-turbulence in the near-infrared region. Initially, it was anticipated that the increased micro-turbulence would result in enhanced photon absorption by Feii ions, leading to an increase in the emission in this spectral region as well, as re-affirmed by the results from the Feii modeling in the optical region. This leads us to question whether micro-turbulence potentially influences the Lyman- absorption by the Feii ion, thereby affecting NIR Feii emission (Sigut and Pradhan, 1998; Rodriguez-Ardila et al., 2002; Garcia-Rissmann et al., 2012; Marinello et al., 2016). A comprehensive investigation is required, which is beyond the scope of our current work.
We attribute the unexpected effects observed in the 1-micron lines to a physical limitation, where we assume a fixed value for the column density as a stopping criterion for the simulations. If we allow this parameter to be free, this can lead to a complex interplay between the column density and the metal content in the ionized gas, as found in Panda (2021) in the case of the optical Feii emission. If this parameter is cm-2, one would have a cloud where the optical depth is 1 where scattering effect becomes significant (see Panda, 2021, for more details). The limit at cm-2 serves to constrain the cloud’s physical condition, drawing inspiration from prior works (Ferland and Persson, 1989; Bruhweiler and Verner, 2008; Panda, 2021) wherein the radiative calculations are made under the optically thin regime. Thus, the non-monotonic behavior in the NIR may be ascribed to the collective influence of the microturbulence and cloud column density. In light of these intricate findings, further dedicated investigations are warranted to unravel the exact mechanisms at play, that includes also the advances in the available Feii atomic datasets.
Coming back to the issue of the Feii flux ratio in the NIR obtained from the observed spectrum and under the physical conditions proposed in our study, our model is not able to replicate the ratio from Marinello et al. (2016), which is R1μm 1.81. To reproduce this value, a metal content exceeding 10Z⊙ would be required. This would mean that the optical and NIR Feii emissions require quite different metal compositions, even though they are formed in close vicinity to each other. This latter aspect is confirmed from the correlation observed for the FWHMs for Feii in the optical and NIR (Marinello et al., 2016). Nevertheless, exploring scenarios with significantly elevated metal content may be a possibility in future research of the NIR Feii emission, especially for high-accreting sources.
Furthermore, it is worthy to emphasize the importance of investigating how the hydrogen line ratios within the BLR of an AGN vary under different physical conditions. This inquiry will significantly improve the precision of measuring the Feii ratio in the NIR for quasars with a non-reliable Pa line (see Marinello et al. (2016, 2020) for other examples). A future study should be considered, as it has the potential to further refine our understanding of AGN environments and improve the accuracy of critical astrophysical measurements.
7 Conclusions
In this study, we aimed at understanding the line formation and physical conditions in a strong Feii emitter AGN, I Zw 1. We investigated how changes in micro-turbulence and metal content impact the optical and NIR emissions of Feii simultaneously. By introducing micro-turbulent velocities within the line-emitting cloud, of 10 and 100 km s-1, employing a range of cloud densities (109 - 1014 cm-3), and metal content from sub-solar to 10 times solar inspired by previous works (Panda et al., 2019, 2020), we explored their combined effect on the recovery of the Feii intensities. Notably, this research is the first to examine the impact of micro-turbulence in the NIR regime, especially for the Feii emission, using photoionization model predictions and corroborating them with observed flux ratios obtained from archival spectra in optical and NIR for this source. While our findings align with prior findings made in the optical regime, we observed contrasting behavior in the NIR when micro-turbulence is introduced. Nonetheless, there is an overall agreement within the parameter ranges studied in the two wavelength regimes. A set of physical conditions can simultaneously reproduce optical and NIR Feii intensities, with nH = 1010.75 - 1011.50 cm-3, and a metal content ranging from 5 Z⊙ Z 10 Z⊙.
We reproduced the R1μm value for I Zw 1 simultaneously in the optical and NIR. This result is significant not only for this source but is applicable also for I Zw 1-like AGNs. The ability to replicate R1μm values across these wavelengths is a novel accomplishment. In conclusion, a comprehensive future analysis of excitation mechanisms and Feii models holds significant promise for further insights into this complex study.
The idea for the article and manuscript preparation was made by DDdS and SP. ARA and MM assisted with the editing and proofreading of the manuscript. All authors have read and agreed to the published version of the manuscript.
This research received no external funding.
Data used in this work can be provided upon request to the corresponding authors.
Acknowledgements.
The authors thank the Brazilian Agencies: Agency of Coordenação de Aperfeiçoamento de Pessoal de Nível Superior (CAPES), and Conselho Nacional de Desenvolvimento Científico e Tecnológico (CNPq). \conflictsofinterestThe authors declare no conflict of interest. \abbreviationsAbbreviations The following abbreviations are used in this manuscript:| AGNs | Active galactic nuclei |
| BELR | Broad-emission line region |
| BLR | Broad-line region |
| EV1 | Eigenvector 1 |
| FWHM | Full width at half maximum |
| FOS | Faint Object Spectrograph |
| HST | Hubble Space Telescope |
| IRTF | Infrared Telescope Facility |
| NLR | Narrow-line region |
| NLS1 | Narrow-line Seyfert 1 |
| NIR | Near-infrared |
| PCA | Principal component analysis |
| SMBHs | Supermassive black holes |
| SXD | Short wavelength cross-dispersed mode |
| UV | Ultraviolet |
Appendix A
References
References
- Netzer (2015) Netzer, H. Revisiting the Unified Model of Active Galactic Nuclei. Annual Reviews in Astronomy and Astrophysics 2015, 53, 365–408, [arXiv:astro-ph.GA/1505.00811]. https://doi.org/10.1146/annurev-astro-082214-122302.
- Padovani et al. (2017) Padovani, P.; Alexander, D.M.; Assef, R.J.; De Marco, B.; Giommi, P.; Hickox, R.C.; Richards, G.T.; Smolčić, V.; Hatziminaoglou, E.; Mainieri, V.; et al. Active galactic nuclei: what’s in a name? Astronomy & Astrophysics Reviews 2017, 25, 2, [arXiv:astro-ph.GA/1707.07134]. https://doi.org/10.1007/s00159-017-0102-9.
- Collin et al. (2006) Collin, S.; Kawaguchi, T.; Peterson, B.M.; Vestergaard, M. Systematic effects in measurement of black hole masses by emission-line reverberation of active galactic nuclei: Eddington ratio and inclination. Astronomy & Astrophysics 2006, 456, 75–90, [arXiv:astro-ph/astro-ph/0603460]. https://doi.org/10.1051/0004-6361:20064878.
- Panda et al. (2019) Panda, S.; Marziani, P.; Czerny, B. The Quasar main sequence explained by the combination of Eddington ratio, metallicity, and orientation. The Astrophysical Journal 2019, 882, 79. https://doi.org/10.3847/1538-4357/ab3292.
- Antonucci (1993) Antonucci, R. Unified models for active galactic nuclei and quasars. Annual Review of Astronomy and Astrophysics 1993, 31, 473–521. https://doi.org/10.1146/annurev.aa.31.090193.002353.
- Urry and Padovani (1995) Urry, C.M.; Padovani, P. Unified Schemes for Radio-Loud Active Galactic Nuclei. Publications of the Astronomical Society of the Pacific 1995, 107, 803, [arXiv:astro-ph/astro-ph/9506063]. https://doi.org/10.1086/133630.
- Sulentic et al. (2000) Sulentic, J.; Marziani, P.; Dultzin-Hacyan, D. Phenomenology of broad emission lines in active galactic nuclei. Annual Review of Astronomy and Astrophysics 2000, 38, 521–571. https://doi.org/https://doi.org/10.1146/annurev.astro.38.1.521.
- Blandford and McKee (1982) Blandford, R.; McKee, C. Reverberation mapping of the emission line regions of Seyfert galaxies and quasars. The Astrophysical Journal 1982, 255, 419–439. https://doi.org/10.1086/159843.
- Peterson et al. (2004) Peterson, B.M.; Ferrarese, L.; Gilbert, K.M.; Kaspi, S.; Malkan, M.A.; Maoz, D.; Merritt, D.; Netzer, H.; Onken, C.A.; Pogge, R.W.; et al. Central Masses and Broad-Line Region Sizes of Active Galactic Nuclei. II. A Homogeneous Analysis of a Large Reverberation-Mapping Database. The Astrophysical Journal 2004, 613, 682–699, [arXiv:astro-ph/astro-ph/0407299]. https://doi.org/10.1086/423269.
- Bentz et al. (2013) Bentz, M.C.; Denney, K.D.; Grier, C.J.; Barth, A.J.; Peterson, B.M.; Vestergaard, M.; Bennert, V.N.; Canalizo, G.; De Rosa, G.; Filippenko, A.V.; et al. The low-luminosity end of the radius–luminosity relationship for active galactic nuclei. The Astrophysical Journal 2013, 767, 149. https://doi.org/10.1088/0004-637X/767/2/149.
- Du et al. (2015) Du, P.; Hu, C.; Lu, K.X.; Huang, Y.K.; Cheng, C.; Qiu, J.; Li, Y.R.; Zhang, Y.W.; Fan, X.L.; Bai, J.M.; et al. Supermassive black holes with high accretion rates in active galactic nuclei. IV. H time lags and implications for super-Eddington accretion. The Astrophysical Journal 2015, 806, 22.
- Grier et al. (2017) Grier, C.; Pancoast, A.; Barth, A.; Fausnaugh, M.; Brewer, B.; Treu, T.; Peterson, B. The structure of the broad-line region in active galactic nuclei. II. Dynamical modeling of data from the AGN10 reverberation mapping campaign. The Astrophysical Journal 2017, 849, 146.
- Panda et al. (2019) Panda, S.; Martínez-Aldama, M.L.; Zajaček, M. Current and future applications of Reverberation-mapped quasars in Cosmology. Frontiers in Astronomy and Space Sciences 2019, 6, 75. https://doi.org/https://doi.org/10.3389/fspas.2019.00075.
- Shen et al. (2023) Shen, Y.; Grier, C.J.; Horne, K.; Stone, Z.; Li, J.I.; Yang, Q.; Homayouni, Y.; Trump, J.R.; Anderson, S.F.; Brandt, W.N.; et al. The Sloan Digital Sky Survey Reverberation Mapping Project: Key Results. arXiv e-prints 2023, p. arXiv:2305.01014, [arXiv:astro-ph.GA/2305.01014]. https://doi.org/10.48550/arXiv.2305.01014.
- Peterson et al. (1993) Peterson, B.M.; Ali, B.; Horne, K.; Bertram, R.; Lame, N.J.; Pogge, R.W.; Wagner, R.M. The Structure of the Broad-Line Region in the Seyfert Galaxy Markarian 590. The Astrophysical Journal 1993, 402, 469. https://doi.org/10.1086/172150.
- Peterson et al. (1994) Peterson, B.M.; Berlind, P.; Bertram, R.; Bochkarev, N.G.; Bond, D.; Brotherton, M.S.; Busler, J.R.; Chuvaev, K.K.; Cohen, R.D.; Dietrich, M.; et al. Steps toward Determination of the Size and Structure of the Broad-Line Region in Active Galactic Nuclei. VII. Variability of the Optical Spectrum of NGC 5548 over 4 Years. The Astrophysical Journal 1994, 425, 622. https://doi.org/10.1086/174009.
- Rosenblatt et al. (1994) Rosenblatt, E.I.; Malkan, M.A.; Sargent, W.L.W.; Readhead, A.C.S. The Broad Emission Line and Continuum Variations of Seyfert Galaxies. II. Broad-Line Region Structure and Kinematics. The Astrophysical Journal Supplements 1994, 93, 73. https://doi.org/10.1086/192047.
- Korista et al. (1995) Korista, K.T.; Alloin, D.; Barr, P.; Clavel, J.; Cohen, R.D.; Crenshaw, D.M.; Evans, I.N.; Horne, K.; Koratkar, A.P.; Kriss, G.A.; et al. Steps toward Determination of the Size and Structure of the Broad-Line Region in Active Galactic Nuclei. VIII. an Intensive HST, IUE, and Ground-based Study of NGC 5548. The Astrophysical Journal Supplements 1995, 97, 285. https://doi.org/10.1086/192144.
- Veilleux et al. (1997) Veilleux, S.; Sanders, D.B.; Kim, D.C. A Near-Infrared Search for Hidden Broad-Line Regions in Ultraluminous Infrared Galaxies. The Astrophysical Journal 1997, 484, 92–107. https://doi.org/10.1086/304337.
- Berk et al. (2001) Berk, D.E.V.; Richards, G.T.; Bauer, A.; Strauss, M.A.; Schneider, D.P.; Heckman, T.M.; York, D.G.; Hall, P.B.; Fan, X.; Knapp, G.; et al. Composite quasar spectra from the sloan digital sky survey. The Astronomical Journal 2001, 122, 549.
- Kollatschny (2003) Kollatschny, W. Accretion disk wind in the AGN broad-line region: Spectroscopically resolved line profile variations in Mrk 110. Astronomy & Astrophysics 2003, 407, 461–472, [arXiv:astro-ph/astro-ph/0306389]. https://doi.org/10.1051/0004-6361:20030928.
- Glikman et al. (2006) Glikman, E.; Helfand, D.J.; White, R.L. A near-infrared spectral template for quasars. The Astrophysical Journal 2006, 640, 579. https://doi.org/https://doi.org/10.1086/500098.
- Vestergaard and Peterson (2006) Vestergaard, M.; Peterson, B.M. Determining Central Black Hole Masses in Distant Active Galaxies and Quasars. II. Improved Optical and UV Scaling Relationships. The Astrophysical Journal 2006, 641, 689–709, [arXiv:astro-ph/astro-ph/0601303]. https://doi.org/10.1086/500572.
- Marziani et al. (2010) Marziani, P.; Sulentic, J.W.; Negrete, C.A.; Dultzin, D.; Zamfir, S.; Bachev, R. Broad-line region physical conditions along the quasar eigenvector 1 sequence. Monthly Notices of the Royal Astronomical Society 2010, 409, 1033–1048, [arXiv:astro-ph.CO/1007.3187]. https://doi.org/10.1111/j.1365-2966.2010.17357.x.
- Pozo Nuñez et al. (2015) Pozo Nuñez, F.; Ramolla, M.; Westhues, C.; Haas, M.; Chini, R.; Steenbrugge, K.; Barr Domínguez, A.; Kaderhandt, L.; Hackstein, M.; Kollatschny, W.; et al. The broad-line region and dust torus size of the Seyfert 1 galaxy PGC 50427. Astronomy & Astrophysics 2015, 576, A73, [arXiv:astro-ph.GA/1502.06771]. https://doi.org/10.1051/0004-6361/201525910.
- Marziani et al. (2018) Marziani, P.; Dultzin, D.; Sulentic, J.W.; Del Olmo, A.; Negrete, C.A.; Martínez-Aldama, M.L.; D’Onofrio, M.; Bon, E.; Bon, N.; Stirpe, G.M. A main sequence for Quasars, 2018. https://doi.org/10.3389/fspas.2018.00006.
- MacLeod et al. (2019) MacLeod, C.L.; Green, P.J.; Anderson, S.F.; Bruce, A.; Eracleous, M.; Graham, M.; Homan, D.; Lawrence, A.; LeBleu, A.; Ross, N.P.; et al. Changing-look Quasar Candidates: First Results from Follow-up Spectroscopy of Highly Optically Variable Quasars. The Astrophysical Journal 2019, 874, 8, [arXiv:astro-ph.GA/1810.00087]. https://doi.org/10.3847/1538-4357/ab05e2.
- Wolf et al. (2020) Wolf, J.; Salvato, M.; Coffey, D.; Merloni, A.; Buchner, J.; Arcodia, R.; Baron, D.; Carrera, F.J.; Comparat, J.; Schneider, D.P.; et al. Exploring the diversity of Type 1 active galactic nuclei identified in SDSS-IV/SPIDERS. Monthly Notices of the Royal Astronomical Society 2020, 492, 3580–3601, [arXiv:astro-ph.HE/1911.01947]. https://doi.org/10.1093/mnras/staa018.
- Fonseca Alvarez et al. (2020) Fonseca Alvarez, G.; Trump, J.R.; Homayouni, Y.; Grier, C.J.; Shen, Y.; Horne, K.; Li, J.I.H.; Brandt, W.N.; Ho, L.C.; Peterson, B.M.; et al. The Sloan Digital Sky Survey Reverberation Mapping Project: The H Radius-Luminosity Relation. The Astrophysical Journal 2020, 899, 73, [arXiv:astro-ph.GA/1910.10719]. https://doi.org/10.3847/1538-4357/aba001.
- Rakshit (2020) Rakshit, S. Broad line region and black hole mass of PKS 1510-089 from spectroscopic reverberation mapping. Astronomy & Astrophysics 2020, 642, A59, [arXiv:astro-ph.GA/2007.07672]. https://doi.org/10.1051/0004-6361/202038324.
- Schindler et al. (2020) Schindler, J.T.; Farina, E.P.; Bañados, E.; Eilers, A.C.; Hennawi, J.F.; Onoue, M.; Venemans, B.P.; Walter, F.; Wang, F.; Davies, F.B.; et al. The X-SHOOTER/ALMA Sample of Quasars in the Epoch of Reionization. I. NIR Spectral Modeling, Iron Enrichment, and Broad Emission Line Properties. The Astrophysical Journal 2020, 905, 51, [arXiv:astro-ph.GA/2010.06902]. https://doi.org/10.3847/1538-4357/abc2d7.
- Li et al. (2022) Li, S.S.; Feng, H.C.; Liu, H.T.; Bai, J.M.; Li, R.; Lu, K.X.; Wang, J.G.; Huang, Y.K.; Zhang, Z.X. Velocity-resolved Reverberation Mapping of Changing-look Active Galactic Nucleus NGC 4151 during Outburst Stage: Evidence for Kinematics Evolution of Broad-line Region. The Astrophysical Journal 2022, 936, 75, [arXiv:astro-ph.GA/2208.02966]. https://doi.org/10.3847/1538-4357/ac8745.
- Pandey et al. (2022) Pandey, S.; Rakshit, S.; Woo, J.H.; Stalin, C.S. Spectroscopic reverberation mapping of Quasar PKS 0736 + 017: broad-line region and black-hole mass. Monthly Notices of the Royal Astronomical Society 2022, 516, 2671–2682, [arXiv:astro-ph.GA/2209.01649]. https://doi.org/10.1093/mnras/stac2418.
- Lu et al. (2022) Lu, K.X.; Bai, J.M.; Wang, J.M.; Hu, C.; Li, Y.R.; Du, P.; Xiao, M.; Feng, H.C.; Li, S.S.; Wang, J.G.; et al. Supermassive Black Hole and Broad-line Region in NGC 5548: Results from Five-season Reverberation Mapping. The Astrophysical Journal Supplements 2022, 263, 10, [arXiv:astro-ph.GA/2209.10853]. https://doi.org/10.3847/1538-4365/ac94d3.
- Bentz et al. (2023) Bentz, M.C.; Onken, C.A.; Street, R.; Valluri, M. Reverberation Mapping of IC 4329A. The Astrophysical Journal 2023, 944, 29, [arXiv:astro-ph.GA/2212.05954]. https://doi.org/10.3847/1538-4357/acab62.
- Donnan et al. (2023) Donnan, F.R.; Hernández Santisteban, J.V.; Horne, K.; Hu, C.; Du, P.; Li, Y.R.; Xiao, M.; Ho, L.C.; Aceituno, J.; Wang, J.M.; et al. Testing super-eddington accretion on to a supermassive black hole: reverberation mapping of PG 1119+120. Monthly Notices of the Royal Astronomical Society 2023, 523, 545–567, [arXiv:astro-ph.GA/2302.09370]. https://doi.org/10.1093/mnras/stad1409.
- Wills et al. (1985) Wills, B.J.; Netzer, H.; Wills, D. Broad emission features in QSOs and active galactic nuclei. II-New observations and theory of Fe II and HI emission. The Astrophysical Journal 1985, 288, 94–116. https://doi.org/https://doi.org/10.1086/162767.
- Verner et al. (1999) Verner, E.; Verner, D.; Korista, K.; Ferguson, J.W.; Hamann, F.; Ferland, G.J. Numerical simulations of Fe II emission spectra. The Astrophysical Journal Supplement Series 1999, 120, 101. https://doi.org/10.1086/313171.
- Marinello et al. (2020) Marinello, M.; Rodríguez-Ardila, A.; Marziani, P.; Sigut, A.; Pradhan, A. Panchromatic properties of the extreme Fe ii emitter PHL 1092. Monthly Notices of the Royal Astronomical Society 2020, 494, 4187–4202.
- Phillips (1977) Phillips, M.M. Observations of Fe II emission in Seyfert galaxies and QSOs. The Astrophysical Journal 1977, 215, 746–754. https://doi.org/10.1086/155408.
- Sigut and Pradhan (2003) Sigut, T.; Pradhan, A.K. Predicted Fe II emission-line strengths from active galactic nuclei. The Astrophysical Journal Supplement Series 2003, 145, 15. https://doi.org/10.1086/345498.
- Sigut et al. (2004) Sigut, T.; Pradhan, A.K.; Nahar, S.N. Theoretical Fe I-III emission-line strengths from active galactic nuclei with broad-line regions. The Astrophysical Journal 2004, 611, 81. https://doi.org/https://doi.org/10.1086/422027.
- Hamann and Ferland (1992) Hamann, F.; Ferland, G. The age and chemical evolution of high-redshift QSOs. The Astrophysical Journal 1992, 391, L53–L57. https://doi.org/10.1086/186397.
- Baldwin et al. (2004) Baldwin, J.; Ferland, G.J.; Korista, K.; Hamann, F.; LaCluyzé, A. The origin of Fe II emission in active galactic nuclei. The Astrophysical Journal 2004, 615, 610. https://doi.org/10.1086/424683.
- Martínez-Aldama et al. (2021) Martínez-Aldama, M.L.; Panda, S.; Czerny, B.; Marinello, M.; Marziani, P.; Dultzin, D. The CaFe Project: Optical Fe II and Near-infrared Ca II Triplet Emission in Active Galaxies. II. The Driver (s) of the Ca II and Fe II and Its Potential Use as a Chemical Clock. The Astrophysical Journal 2021, 918, 29. https://doi.org/https://doi.org/10.3847/1538-4357/ac03b6.
- Sarkar et al. (2021) Sarkar, A.; Ferland, G.; Chatzikos, M.; Guzmán, F.; van Hoof, P.; Smyth, R.; Ramsbottom, C.; Keenan, F.; Ballance, C. Improved Fe ii Emission-line Models for AGNs Using New Atomic Data Sets. The Astrophysical Journal 2021, 907, 12. https://doi.org/https://doi.org/10.3847/1538-4357/abcaa6.
- Boroson and Green (1992) Boroson, T.A.; Green, R.F. The emission-line properties of low-redshift quasi-stellar objects. The Astrophysical Journal Supplement Series 1992, 80, 109–135.
- Phillips (1976) Phillips, M.M. The optical spectrum of I Zwicky 1. The Astrophysical Journal 1976, 208, 37. https://doi.org/10.1086/154578.
- Oke and Lauer (1979) Oke, J.B.; Lauer, T.R. An analysis of the spectra of the Seyfert galaxies Markarian 79 and I Zw 1. The Astrophysical Journal 1979, 230, 360–372. https://doi.org/10.1086/157092.
- Joly (1981) Joly, M. The Fe II spectrum of Seyfert 1 galaxies and quasars. Astronomy & Astrophysics 1981, 102, 321–330.
- Halpern and Oke (1987) Halpern, J.P.; Oke, J.B. Narrow-Line Seyfert Galaxies with Permitted Fe II Emission: Markarian 507, 5C 3.100, and I Zwicky 1. The Astrophysical Journal 1987, 312, 91. https://doi.org/10.1086/164851.
- Laor et al. (1997) Laor, A.; Jannuzi, B.T.; Green, R.F.; Boroson, T.A. The Ultraviolet Properties of the Narrow-Line Quasar I Zw 1. The Astrophysical Journal 1997, 489, 656–671, [arXiv:astro-ph/astro-ph/9706264]. https://doi.org/10.1086/304816.
- Negrete et al. (2012) Negrete, C.A.; Dultzin, D.; Marziani, P.; Sulentic, J.W. Broad-line Region Physical Conditions in Extreme Population A Quasars: A Method to Estimate Central Black Hole Mass at High Redshift. The Astrophysical Journal 2012, 757, 62, [arXiv:astro-ph.CO/1107.3188]. https://doi.org/10.1088/0004-637X/757/1/62.
- Park et al. (2022) Park, D.; Barth, A.J.; Ho, L.C.; Laor, A. A New Iron Emission Template for Active Galactic Nuclei. I. Optical Template for the H Region. The Astrophysical Journal Supplements 2022, 258, 38, [arXiv:astro-ph.GA/2111.15118]. https://doi.org/10.3847/1538-4365/ac3f3e.
- Sulentic et al. (2000) Sulentic, J.W.; Zwitter, T.; Marziani, P.; Dultzin-Hacyan, D. Eigenvector 1: An Optimal Correlation Space for Active Galactic Nuclei. The Astrophysical Journal Letters 2000, 536, L5–L9, [arXiv:astro-ph/astro-ph/0005177]. https://doi.org/10.1086/312717.
- Shen and Ho (2014) Shen, Y.; Ho, L.C. The diversity of quasars unified by accretion and orientation. Nature 2014, 513, 210–213. https://doi.org/https://doi.org/10.1038/nature13712.
- Deconto-Machado et al. (2023) Deconto-Machado, A.; del Olmo Orozco, A.; Marziani, P.; Perea, J.; Stirpe, G.M. High-redshift quasars along the main sequence. Astronomy & Astrophysics 2023, 669, A83, [arXiv:astro-ph.GA/2211.03853]. https://doi.org/10.1051/0004-6361/202243801.
- Mengistue et al. (2023) Mengistue, S.T.; Del Olmo, A.; Marziani, P.; Pović, M.; Martínez-Carballo, M.A.; Perea, J.; Márquez, I. Optical and near-UV spectroscopic properties of low-redshift jetted quasars in the main sequence context. Monthly Notices of the Royal Astronomical Society 2023, 525, 4474–4496, [arXiv:astro-ph.GA/2308.06080]. https://doi.org/10.1093/mnras/stad2467.
- Vestergaard and Wilkes (2001) Vestergaard, M.; Wilkes, B.J. An empirical ultraviolet template for iron emission in quasars as derived from I Zwicky 1. The Astrophysical Journal Supplement Series 2001, 134, 1. https://doi.org/https://doi.org/10.1086/320357.
- Tsuzuki et al. (2006) Tsuzuki, Y.; Kawara, K.; Yoshii, Y.; Oyabu, S.; Tanabé, T.; Matsuoka, Y. Fe II emission in 14 low-redshift quasars. I. Observations. The Astrophysical Journal 2006, 650, 57. https://doi.org/https://doi.org/10.1086/506376.
- Kovačević-Dojčinović and Popović (2015) Kovačević-Dojčinović, J.; Popović, L.Č. The connections between the UV and optical Fe II emission lines in type 1 AGNs. The Astrophysical Journal Supplement Series 2015, 221, 35. https://doi.org/https://doi.org/10.1088/0067-0049/221/2/35.
- Dong et al. (2010) Dong, X.B.; Ho, L.C.; Wang, J.G.; Wang, T.G.; Wang, H.; Fan, X.; Zhou, H. The Prevalence of Narrow Optical Fe II Emission Lines in Type 1 Active Galactic Nuclei. The Astrophysical Journal Letters 2010, 721, L143. https://doi.org/https://doi.org/10.1088/2041-8205/721/2/L143.
- Dong et al. (2011) Dong, X.B.; Wang, J.G.; Ho, L.C.; Wang, T.G.; Fan, X.; Wang, H.; Zhou, H.; Yuan, W. What controls the Fe II strength in active galactic nuclei? The Astrophysical Journal 2011, 736, 86. https://doi.org/https://doi.org/10.1088/0004-637X/736/2/86.
- Kovačević et al. (2010) Kovačević, J.; Popović, L.Č.; Dimitrijević, M.S. Analysis of optical Fe II emission in a sample of active galactic nucleus spectra. The Astrophysical Journal Supplement Series 2010, 189, 15. https://doi.org/https://doi.org/10.1088/0067-0049/189/1/15.
- Park et al. (2022) Park, D.; Barth, A.J.; Ho, L.C.; Laor, A. A New Iron Emission Template for Active Galactic Nuclei. I. Optical Template for the H Region. The Astrophysical Journal Supplement Series 2022, 258, 38. https://doi.org/https://doi.org/10.3847/1538-4365/ac3f3e.
- Sigut and Pradhan (1998) Sigut, T.; Pradhan, A.K. Ly Fluorescent Excitation of Fe II in Active Galactic Nuclei. The Astrophysical Journal 1998, 499, L139. https://doi.org/https://doi.org/10.1086/311369.
- Rodriguez-Ardila et al. (2002) Rodriguez-Ardila, A.; Viegas, S.; Pastoriza, M.G.; Prato, L. Infrared Fe II Emission in Narrow-Line Seyfert 1 Galaxies. The Astrophysical Journal 2002, 565, 140. https://doi.org/https://doi.org/10.1086/324598.
- Garcia-Rissmann et al. (2012) Garcia-Rissmann, A.; Rodríguez-Ardila, A.; Sigut, T.; Pradhan, A. A near-infrared template derived from I Zw 1 for the Fe II emission in active galaxies. The Astrophysical Journal 2012, 751, 7. https://doi.org/https://doi.org/10.1088/0004-637X/751/1/7.
- Marinello et al. (2016) Marinello, M.; Rodríguez-Ardila, A.; Garcia-Rissmann, A.; Sigut, T.; Pradhan, A. The Fe II Emission in Active Galactic Nuclei: Excitation Mechanisms and Location of the Emitting Region. The Astrophysical Journal 2016, 820, 116. https://doi.org/https://doi.org/10.3847/0004-637X/820/2/116.
- Rudy et al. (2000) Rudy, R.J.; Mazuk, S.; Puetter, R.; Hamann, F. The 1 micron Fe II lines of the seyfert galaxy I Zw 1. The Astrophysical Journal 2000, 539, 166. https://doi.org/https://doi.org/10.1086/309222.
- Riffel et al. (2006) Riffel, R.; Rodriguez-Ardila, A.; Pastoriza, M.G. A 0.8–2.4 m spectral atlas of active galactic nuclei. Astronomy & Astrophysics 2006, 457, 61–70. https://doi.org/https://doi.org/10.1051/0004-6361:20065291.
- Martínez-Aldama et al. (2015) Martínez-Aldama, M.L.; Dultzin, D.; Marziani, P.; Sulentic, J.W.; Bressan, A.; Chen, Y.; Stirpe, G.M. O i AND Ca ii OBSERVATIONS IN INTERMEDIATE REDSHIFT QUASARS. The Astrophysical Journal Supplement Series 2015, 217, 3. https://doi.org/https://doi.org/10.1088/0067-0049/217/1/3.
- Panda et al. (2020) Panda, S.; Martínez-Aldama, M.L.; Marinello, M.; Czerny, B.; Marziani, P.; Dultzin, D. The CaFe Project: Optical Fe ii and Near-infrared Ca ii Triplet Emission in Active Galaxies. I. Photoionization Modeling. The Astrophysical Journal 2020, 902, 76. https://doi.org/https://doi.org/10.3847/1538-4357/abb5b8.
- Panda (2021) Panda, S. The CaFe project: Optical Fe II and near-infrared Ca II triplet emission in active galaxies: simulated EWs and the co-dependence of cloud size and metal content. Ats 2021, 650, A154, [arXiv:astro-ph.GA/2004.13113]. https://doi.org/10.1051/0004-6361/202140393.
- Bruhweiler and Verner (2008) Bruhweiler, F.; Verner, E. Modeling fe II emission and revised Fe II (UV) empirical templates for the seyfert 1 galaxy I Zw 1. The Astrophysical Journal 2008, 675, 83. https://doi.org/https://doi.org/10.1086/525557.
- Panda et al. (2018) Panda, S.; Czerny, B.; Adhikari, T.P.; Hryniewicz, K.; Wildy, C.; Kuraszkiewicz, J.; Śniegowska, M. Modeling of the Quasar Main Sequence in the Optical Plane. The Astrophysical Journal 2018, 866, 115. https://doi.org/10.3847/1538-4357/aae209.
- (77) dos Santos, D.D.; Panda, S.; Rodríguez-Ardila, A.; Marinello, M. Modelling the strong Fe ii emission. Boletim da Sociedade Astronômica Brasileira, 34, 295–299.
- Panda et al. (2019) Panda, S.; Czerny, B.; Done, C.; Kubota, A. CLOUDY View of the Warm Corona. The Astrophysical Journal 2019, 875, 133, [arXiv:astro-ph.HE/1901.02962]. https://doi.org/10.3847/1538-4357/ab11cb.
- Ferland et al. (2017) Ferland, G.J.; Chatzikos, M.; Guzmán, F.; Lykins, M.L.; van Hoof, P.A.M.; Williams, R.J.R.; Abel, N.P.; Badnell, N.R.; Keenan, F.P.; Porter, R.L.; et al. The 2017 Release Cloudy. Revista Mexicana de Astronomía y Astrofísica 2017, 53, 385–438, [arXiv:astro-ph.GA/1705.10877]. https://doi.org/10.48550/arXiv.1705.10877.
- Véron-Cetty et al. (2004) Véron-Cetty, M.P.; Joly, M.; Véron, P. The unusual emission line spectrum of I Zw 1. Astronomy & Astrophysics 2004, 417, 515–525. https://doi.org/https://doi.org/10.1051/0004-6361:20035714.
- Huang et al. (2019) Huang, Y.K.; Hu, C.; Zhao, Y.L.; Zhang, Z.X.; Lu, K.X.; Wang, K.; Zhang, Y.; Du, P.; Li, Y.R.; Bai, J.M.; et al. Reverberation mapping of the narrow-line Seyfert 1 galaxy I Zwicky 1: black hole mass. The Astrophysical Journal 2019, 876, 102. https://doi.org/https://doi.org/10.3847/1538-4357/ab16ef.
- Osterbrock and Pogge (1985) Osterbrock, D.E.; Pogge, R.W. The spectra of narrow-line Seyfert 1 galaxies. The Astrophysical Journal 1985, 297, 166–176. https://doi.org/10.1086/163513.
- Marziani et al. (2022) Marziani, P.; del Olmo, A.; Negrete, C.A.; Dultzin, D.; Piconcelli, E.; Vietri, G.; Martínez-Aldama, M.L.; D’Onofrio, M.; Bon, E.; Bon, N.; et al. The intermediate-ionization lines as virial broadening estimators for Population A quasars. The Astrophysical Journal Supplement Series 2022, 261, 30. https://doi.org/10.3847/1538-4365/ac6fd6.
- Kaspi et al. (2000) Kaspi, S.; Smith, P.S.; Netzer, H.; Maoz, D.; Jannuzi, B.T.; Giveon, U. Reverberation Measurements for 17 Quasars and the Size-Mass-Luminosity Relations in Active Galactic Nuclei. The Astrophysical Journal 2000, 533, 631. https://doi.org/10.1086/308704.
- Panda (2021) Panda, S. Physical Conditions in the Low-Ionization Broad-Line Region in Active Galaxies. Publications de l’Observatoire Astronomique de Beograd 2021, 100, 333–338. https://doi.org/10.3847/1538-4365/ac6fd6.
- Grevesse et al. (2011) Grevesse, N.; Asplund, M.; Sauval, A.; Scott, P. The chemical composition of the sun1This review is part of a Special Issue on the 10th International Colloquium on Atomic Spectra and Oscillator Strengths for Astrophysical and Laboratory Plasmas. Canadian Journal of Physics 2011, 89, 327–331, [https://doi.org/10.1139/p10-119]. https://doi.org/10.1139/p10-119.
- Bottorff and Ferland (2000) Bottorff, M.C.; Ferland, G.J. Magnetic confinement, magnetohydrodynamic waves and smooth line profiles in active galactic nuclei. Monthly Notices of the Royal Astronomical Society 2000, 316, 103–106, [https://academic.oup.com/mnras/article-pdf/316/1/103/3894373/316-1-103.pdf]. https://doi.org/10.1046/j.1365-8711.2000.03465.x.
- Rees (1987) Rees, M.J. Magnetic confinement of broad-line clouds in active galactic nuclei. Monthly Notices of the Royal Astronomical Society 1987, 228, 47P–50P, [https://academic.oup.com/mnras/article-pdf/228/1/47P/2807795/mnras228-047P.pdf]. https://doi.org/10.1093/mnras/228.1.47P.
- Kollatschny and Zetzl (2013) Kollatschny, W.; Zetzl, M. The shape of broad-line profiles in active galactic nuclei. Astronomy & Astrophysics 2013, 549, A100.
- Marziani et al. (2021) Marziani, P.; Berton, M.; Panda, S.; Bon, E. Optical Singly-Ionized Iron Emission in Radio-Quiet and Relativistically Jetted Active Galactic Nuclei. Universe 2021, 7. https://doi.org/10.3390/universe7120484.
- Ferland and Persson (1989) Ferland, G.J.; Persson, S.E. Implications of CA II Emission for Physical Conditions in the Broad-Line Region of Active Galactic Nuclei. The Astrophysical Journal 1989, 347, 656. https://doi.org/10.1086/168156.