Accretion and Obscuration in Merger-Dominated Luminous Red Quasars
Abstract
We present an analysis of the X-ray properties 10 luminous, dust-reddened quasars from the FIRST-2MASS (F2M) survey based on new and archival Chandra observations. These systems are interpreted to be young, transitional objects predicted by merger-driven models of quasar/galaxy co-evolution. The sources have been well-studied from the optical through mid-infrared, have Eddington ratios above 0.1, and possess high-resolution imaging, most of which shows disturbed morphologies indicative of a recent or ongoing merger. When combined with previous X-ray studies of five other F2M red quasars, we find that the sources, especially those hosted by mergers, have moderate to high column densities ( cm-2) and Eddington ratios high enough to enable radiation pressure to blow out the obscuring material. We confirm previous findings that red quasars have dust-to-gas ratios that are significantly lower than the value for the Milky Way’s interstellar medium, especially when hosted by a merger. The dust-to-gas ratio for two red quasars that lack evidence for merging morphology is consistent with the Milky Way and they do not meet the radiative feedback conditions for blowout. These findings support the picture of quasar/galaxy co-evolution in which a merger results in feeding of and feedback from an AGN. We compare the F2M red quasars to other obscured and reddened quasar populations in the literature, finding that, although morphological information is lacking, nearly all such samples meet blowout conditions and exhibit outflow signatures suggestive of winds and feedback.
keywords:
galaxies: active – galaxies: evolution – quasars: general – X-rays: galaxies1 Introduction
A complete picture of galaxy evolution must include the growth of supermassive black holes (SMBHs) at their centres, as evidence suggests a formation and evolutionary relationship between the two. The ubiquity of SMBHs in the centres of galaxies (Faber et al., 1997), the tight relation (Gebhardt et al., 2000; Ferrarese & Merritt, 2000), and the contemporaneous peak in star formation and black hole growth over cosmic history (Hopkins & Beacom, 2006) all point to an energy exchange, or “feedback”, between the black holes and their hosts. This feedback from active galactic nuclei (AGN) is still poorly understood, and may come in the form of radiation, winds, outflows, and/or jets (Fabian, 2012).
One way to explain these observations is through major galaxy mergers that induce both SMBH accretion and circumnuclear star-formation, resulting in large amounts of dust and gas that obscure much of the SMBH’s growth (Sanders et al., 1988; Hopkins et al., 2006). According to this model, the obscuring dust is eventually cleared by powerful quasar winds, revealing luminous, unreddened emission from the quasar. In this scenario dust-reddened (or “red”) quasars represent a crucial early phase in SMBH/galaxy co-evolution: the transition from a dust-enshrouded core to a typical, unobscured quasar. In the context of this picture, the reddened phase represents a key component of SMBH growth with the potential to reveal the physics of feedback once the quasar becomes luminous enough to blow away the circumnuclear material.
Recently, samples of heavily reddened quasars have been shown to fit into this scenario as the long-sought transitioning population (e.g., Banerji et al., 2012; Tsai et al., 2015; LaMassa et al., 2017). A red quasar sample constructed from the cross-matching of the Faint Images of the Radio Sky at Twenty cm (FIRST; Becker et al., 1995) survey to the Two-Micron All-Sky Survey (2MASS; Skrutskie et al., 2006), applying red optical-to-near infrared colour cuts, and spectroscopically confirming broad-line (Type 1) sources yielded 130 objects that span a broad range of redshifts and reddenings (; Glikman et al., 2004, 2007; Urrutia et al., 2009; Glikman et al., 2012, 2013, hereafter called F2M red quasars). Extensive observations of F2M red quasars show that they are in a transitional phase of a merger-driven process: Hubble Space Telescope (HST) images show mergers are very common ( Urrutia et al., 2008; Glikman et al., 2015); they have high accretion rates ( Kim et al., 2015); their BH masses are under-massive compared to their hosts, suggesting they have not finished growing (Urrutia et al., 2012); and a high fraction of them exhibit outflows and winds via the presence of blue-shifted broad absorption lines in low-ionization species (i.e., LoBALS and FeLoBALs make up of F2M red quasars compared to 5% in the general quasar population; Urrutia et al., 2009) indicative of winds and outflows. More recently, integral field spectroscopy of three F2M red quasars show bi-conal superbubbles in [O iii] emission, catching the short-lived “break-out” phase (Shen et al., 2023).
One way to determine whether an AGN is in the radiatively-driven “blow-out” phase is by comparing its Eddington ratio () to the hydrogen column density (). A study of hard X-ray-selected local () AGN showed that they are either completely obscured, with and cm-2, or largely unobscured, with and cm-2 (Ricci et al., 2017a). There exist a unique set of conditions whereby an AGN has sufficiently high and a not-too-high to blow out the dust and gas (Fabian et al., 2008; Ishibashi et al., 2018). Recently, Stacey et al. (2022) used ALMA observations to show that reddened quasars with reside in this “blow-out” region of vs. space.
While we have measured black hole masses, Eddington ratios, and reddenings () for all the F2M red quasars, our understanding of their X-ray properties has been deficient. Twelve F2M quasars were observed with Chandra in 2004 with ksec exposures (Urrutia et al., 2005). While all of the sources show absorbed X-ray spectra, the detections were mostly too low-count (all but one had counts) for detailed spectral analysis and the ancillary data for F2M red quasars had not been obtained making it difficult to draw conclusions.
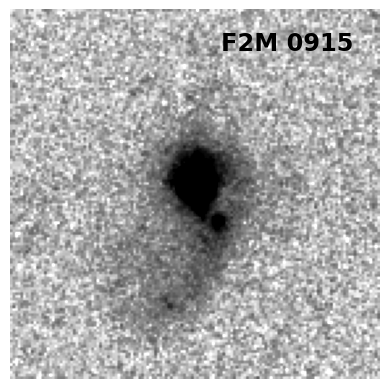
More recently, we obtained high-quality X-ray spectra of four F2M red quasars with XMM-Newton and NuSTAR, as well as archival Chandra data (LaMassa et al., 2016b; Glikman et al., 2017, hereafter, L16 and G17, respectively); three of these have HST images showing merging hosts. We found that these three sources fall squarely in the blowout region of the the vs. diagram (Glikman, 2017). The source that lies outside of the blowout region lacks morphological information, and has a dust-to-gas ratio consistent with the Galactic value, possibly because it is obscured by dust lanes in its host galaxy. In addition, a fifth F2M red quasar (F2M J0915) has a 3.2 ksec Chandra observation analyzed in Urrutia et al. (2005) as well as high-spatial-resolution imaging revealing a merging host (Urrutia et al., 2008). We list the properties of these F2M red quasars in Table 1 as a reference for the remainder of the paper.
| Name | R.A. | Decl. | Redshift | Merger? | Ref | ||||
| (J2000) | (J2000) | (mag) | (erg s-1) | (cm-2) | |||||
| F2M J0830 | 08:30:11.12 | +37:59:51.8 | 0.414 | Y | L16 | ||||
| F2M J0915 | 09:15:01.70 | +24:18:12.2 | 0.842 | Y | Urrutia et al. (2005) | ||||
| F2M J1113 | 11:13:54.67 | +12:44:38.9 | 0.681 | Y | G17 | ||||
| F2M J1227 | 12:27:49.15 | +32:14:59.0 | 0.137 | ? | L16 | ||||
| F2M J1656 | 16:56:47.11 | +38:21:36.7 | 0.732 | Y | G17 | ||||
| † Bolometric luminosities were determined by applying a bolometric correction of 7.6 (Richards et al., 2006) to the 6m luminosity, | |||||||||
| which was determined by interpolating their WISE mid-infrared luminosities in the rest-frame. | |||||||||
| ‡ As reported in Kim et al. (2015) except for F2M J0830 and F2M J1227 which were obtained from G17. | |||||||||
X-rays give the best measure of an AGN’s true underlying accretion luminosity, because they originate close to the black hole and penetrate gas and dust for all but the most obscured AGN ( cm-2 and keV). Besides showing evidence for active radiative feedback, the studies in L16 and G17 found that the three merger-hosted sources were best fit by an absorbed power-law model with a small fraction of the incident emission being leaked or scattered back into the line-of-sight (we refer to this as the ‘scattering fraction’; here, ) and moderate line-of-sight extinction ( cm-2). Intriguingly, self-consistent physically-motivated model fitting with MYTorus (Murphy & Yaqoob, 2009) exposes the presence of globally distributed gas suggesting a more complex environment than a simple absorber along the line-of-sight.
In this paper we present X-ray observations for 10 additional F2M red quasars, which doubles the initial sample to more robustly verify the previous results. All the sources have high resolution imaging which enable us to tie host galaxy morphology to X-ray properties, including their potential for existing in a blowout phase. When optical magnitudes are discussed, we specify whether they are on the AB or Vega system via a subscript. Uncertainties on X-ray parameters are reported as 90% confidence limits. Throughout this work, we adopt the concordance CDM cosmology with km s-1 Mpc-1, , and .
2 The Sample and Observations
2.1 Source Selection and Characteristics
Of the F2M red quasars, all have optical and/or near-infrared spectroscopy, as well as photometric coverage from ultraviolet to mid-infrared wavelengths and 27 have HST11124 red quasars have targeted HST imaging from Urrutia et al. (2008, 13 objects) and Glikman et al. (2015, 11 objects), one red quasar was targeted in a snapshot HST program (Marble et al., 2003), and another was serendipitously located in the background of another HST snapshot program (GO-11604). or other high resolution imaging (either targeted or serendipitous). For this study, we assembled a list of F2M red quasars that have the following observations in hand: (1) high resolution imaging from HST or other imaging; (2) optical and/or near-infrared spectra with at least one broad emission line enabling an estimate of a black-hole mass (). We further required that our targets yield at least 70 counts (see §2.2) in ksec Chandra observation and identified eight sources that obeyed these criteria. In addition, two sources were found in the background of archival Chandra observations, with one source appearing in two different datasets. Our sample, therefore consists of 10 F2M red quasars with new or archival Chandra observations.
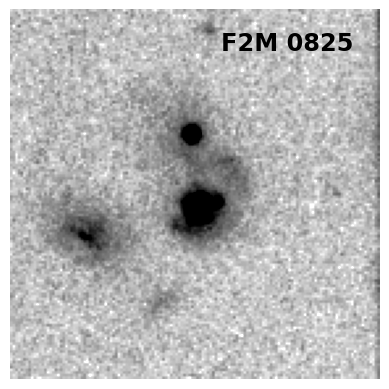
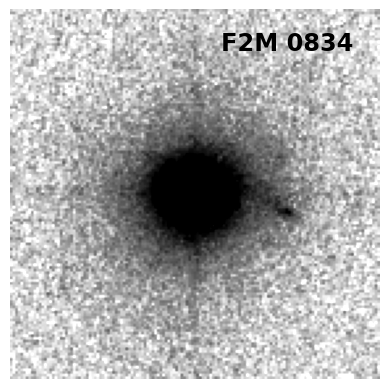
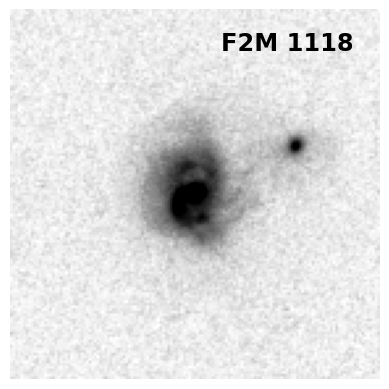
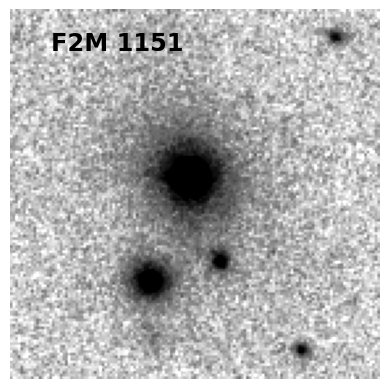
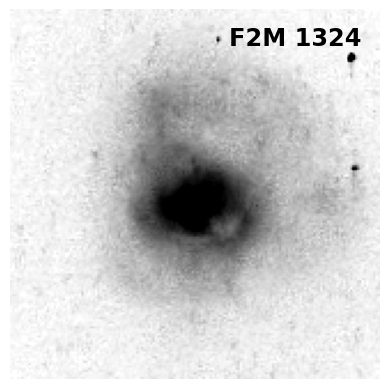
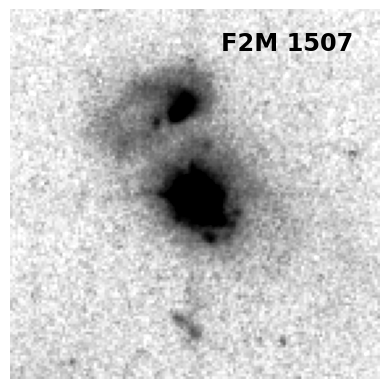
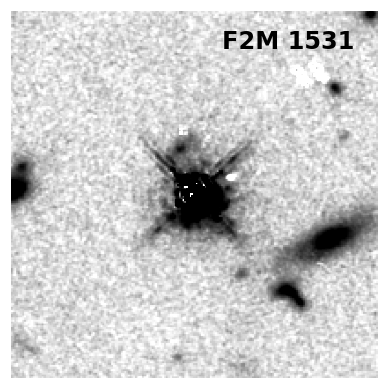
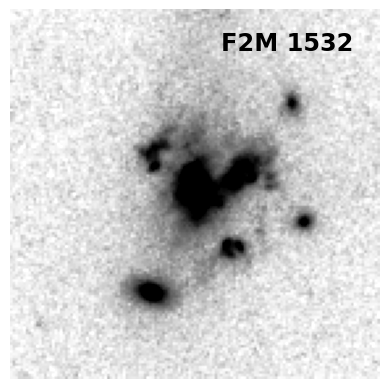
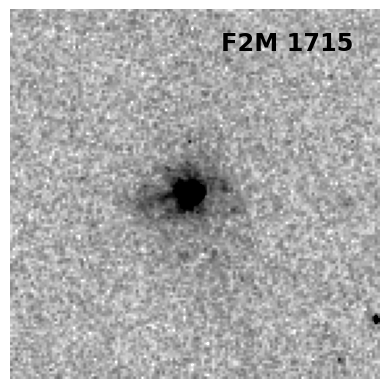
Figure 1 shows the HST image cutouts for these sources, as well as for F2M J0915. The images were obtained from the archives, except for F2M J1531 whose point spread function (PSF) subtracted WFC3/IR F160W image from Glikman et al. (2015) is reproduced here. The morphology of F2M J1106 is based on integral field spectroscopy (IFS) with the GMOS instrument showing bi-conal bubbles in the [O iii] (see Shen et al., 2023). Images of the remaining sources listed in Table 1 are shown in L16 and G17.
The fifth column of Tables 1 and 2 lists the reddening of each quasar parametrized by the color excess, , which we determined by performing a linear fit in log space to the ratio of each red quasar spectrum, , to an unreddened quasar template spectrum, i.e.
| (1) |
Here, is the optical-to-near-infrared quasar composite template from Glikman et al. (2006) and is the Small Magellanic Cloud (SMC) dust extinction law from Gordon & Clayton (1998). Although values were already in-hand, we recomputed them for this work as newer spectra had been obtained for some sources which, in some cases, broadened the wavelength coverage or, in others, improved the signal-to-noise. The uncertainties on were computed by heavily smoothing and perturbing the original spectrum by its own error array and re-fitting it to determine 1000 times. The reported uncertainty is then the standard deviation of that distribution.
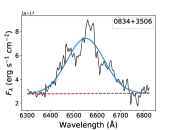
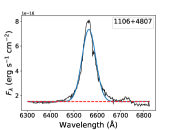
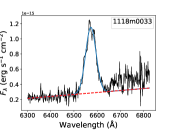
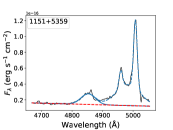
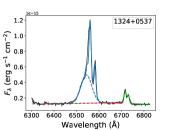
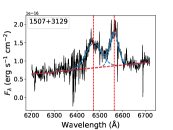
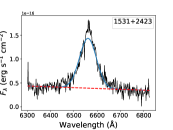
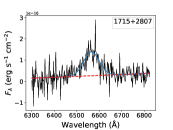
We determine the black hole masses, , from a broad emission line in the quasars’ spectra. Eight sources were analyzed using their broad emission line widths, either from H or H, using the line with the highest signal-to-noise ratio. We performed multi-component Gaussian fits to the lines, including narrow emission line components combined with a broad component. Figure 2 shows these line fits.
We use the established relations from Shen & Liu (2012),
| (2) |
to compute for each line species, employing the full-width at half maximum (FWHM) in km s-1 for the velocity term. When the line used was H, we adopted the values , , for sources with erg s-1 and , , for for sources with erg s-1. For estimates based on H, we adopted the values , , , which apply to sources with , erg s-1 (the , , coefficients are from the calibration of Assef et al., 2011).
Two sources, F2M J0825 and F2M J1532, have only narrow H lines visible in their optical spectrum, likely because the broad component has experienced significant extinction from dust. The H line is shifted into a noisy part of the optical and near-infrared spectra precluding our ability to perform reliable Gaussian fitting. Both sources exhibit broad Pa emission in their near-infrared spectrum and their values were computed in Kim et al. (2015) along with 14 other red quasars using a single-epoch relation derived by Kim et al. (2010) for Paschen lines,
| (3) |
where , , and . Kim et al. (2010) calibrated this relation using near-infrared spectra of unreddened quasars and found that they agree with the Balmer-line-based relations to within 0.18-0.24 dex.
In addition to line widths, the relations require a luminosity at a particular wavelength to estimate the radial distance to the broad line region. The bolometric luminosity listed in Tables 1 and 2 is determined by applying a bolometric correction of 7.6 to the 6m luminosity based on the mean quasar spectral energy distribution (SED) in Richards et al. (2006). Because the luminosities in the relations are at optical and UV wavelengths, which are affected by reddening in these quasars, we interpolate their Wide-field Infrared Survey Explorer (AllWISE; Wright et al., 2010; Mainzer et al., 2011) mid-infrared fluxes to estimate their rest-frame 6m luminosity, , and scale it to the optical flux using a ratio of the bolometric corrections for 6m (7.6) and 5100Å (10) for the Richards et al. (2006) mean quasar spectral energy distribution (SED). To determine the uncertainty on , each SED is perturbed by its photometric errors, drawing from a Gaussian distribution, to generate 1000 SEDs which we interpolate to measure . The reported uncertainty is then the standard deviation of the distribution. is also used to find the bolometric luminosity () of the quasars, applying a bolometric correction factor of 7.6 derived from the same SED. When combined with their bolometric luminosities, we are able to compute an Eddington ratio () for each source. Table 2 lists the quasars, their positions, redshifts, and . The table also lists the source of the imaging, , , and .
| Name | R.A. | Decl. | Redshift | Line | Merger? | Image Ref | ||||
| (J2000) | (J2000) | (mag) | () | (erg s-1) | ||||||
| F2M J0825a | 08:25:02.00 | +47:16:52.0 | 0.804 | 12.252.98 | Pa | Y | U08 | |||
| F2M J0834 | 08:34:07.00 | +35:06:01.8 | 0.470 | 3110† | H | N | U08 | |||
| F2M J1106 | 11:06:48.30 | +48:07:12.3 | 0.435 | 8.22.3 | H | ? | S23 | |||
| F2M J1118 | 11:18:11.10 | 00:33:41.9 | 0.686 | 6.41.8. | H | Y | U08 | |||
| F2M J1151 | 11:51:24.10 | +53:59:57.4 | 0.780 | 5.860.04 | H | N | U08 | |||
| F2M J1324 | 13:24:19.90 | +05:37:05.0 | 0.205 | 5.51.5‡ | H | Y | HST archive | |||
| F2M J1507 | 15:07:18.10 | +31:29:42.3 | 0.988 | 4.61.3⋆ | H | Y | U08 | |||
| F2M J1531 | 15:31:50.47 | +24:23:17.6 | 2.287 | 8022. | H | Y | G15 | |||
| F2M J1532a | 15:32:33.19 | +24:15:26.8 | 0.564 | 6.124.87 | Pa | Y | U08 | |||
| F2M J1715 | 17:15:59.80 | +28:07:16.8 | 0.523 | 8.72.4 | H | N | M03 | |||
| ♯ Bolometric luminosities were determined by applying a bolometric correction of 7.6 (Richards et al., 2006) to the 6m luminosity which was determined | ||||||||||
| by interpolating the WISE mid-infrared luminosities in the rest-frame. | ||||||||||
| † This object has a double-peaked emission line shape, resulting in a likely over-estimated | ||||||||||
| ‡ This source was fit with multiple Gaussian components to account for the presence of narrow lines. | ||||||||||
| ⋆ This source has a blue-shifted broad line, which we do not use in our estimate of .(see §A.1). | ||||||||||
| a and were determined in Kim et al. (2015). | ||||||||||
| Comments – M03 = Marble et al. (2003); U08 = Urrutia et al. (2008); S23 = Shen et al. (2023); U12 = Urrutia et al. (2012);G15 = Glikman et al. (2015) | ||||||||||
2.2 Chandra Observations
We obtained Chandra observations in Cycle 21 of eight red quasars that obeyed our selection requirements outlined in Section 2.1 that had no archival X-ray data (GO 21700216, PI: Glikman). We designed our observing strategy aiming for 70 counts in the Chandra energy range, which we estimated using the interpolated 6m luminosity and the relation, modified to reflect the trends seen for red quasars in L16 and G17 (i.e., dex below the Chen et al. 2017 relation which accounts for any intrinsic ; see §4.2), imposing a 5 ksec minimum on the brighter sources. Table 3 lists the details of the Chandra observations for the eight sources as well as the two sources with archival observations. Given that the scatter in the relation is on a logarithmic scale, while photon detection rates are linear, our total counts vary significantly from the expected 70.
We processed the data with the CIAO v4.15, with CALDB v4.10.4 (Fruscione et al., 2006), using the chandra_repro task to produce a filtered events file, removing periods of anomalously high background. For all but one of the observations, a spectrum was extracted using a 5″ radius aperture around the object using the CIAO tool specextract, with the background extracted from an annulus around the quasar with inner radius 10″ and outer radius 35″. F2M J1532 was present in two archival observations. One of the archival observations had F2M J1532 near the edge of the I2 chip on the ACIS-I detector where the PSF is significantly larger; we use a 35″ radius aperture around the source and an offset circular aperture with a 120″ radius far from any sources for the background. The total net counts detected are listed in Table 3 as reported by the CIAO task dmlist.
| Name | ObsID | Date | Net Exposure Time | Net Counts | |
|---|---|---|---|---|---|
| (1020 cm-2) | (ksec) | (0.5 - 7 keV cnts) | |||
| F2M J0825 | 22570 | 2019 December 20 | 4.15 | 9.94 | 21815 |
| F2M J0834 | 22571 | 2019 December 15 | 4.03 | 9.94 | 42 |
| F2M J1106 | 22572 | 2019 October 24 | 1.38 | 5.99 | 22 |
| F2M J1118 | 22573 | 2020 January 21 | 4.43 | 11.91 | 507 |
| F2M J1151 | 22574 | 2020 August 7 | 1.33 | 17.83 | 225 |
| F2M J1324 | 22575 | 2020 January 21 | 2.32 | 5.0 | 73 |
| F2M J1507 | 22576 | 2019 November 9 | 1.66 | 19.80 | 709 |
| F2M J1531 | 3336 | 2002 September 25 | 3.61 | 5.06 | 11 |
| F2M J1532 | 3138† | 2001 April 30 | 4.14 | 47.13 | 44124 |
| … | 3338 | 2002 July 2 | … | 4.90 | 578 |
| F2M J1715 | 22577 | 2019 October 5 | 3.79 | 8.95 | 25516 |
| † Due to being far off-axis, this source was extracted from a 35″aperture and a nearby 120″-radius circular aperture for the background. | |||||
3 X-ray fitting
3.1 Basic fits
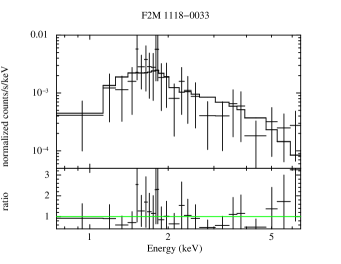
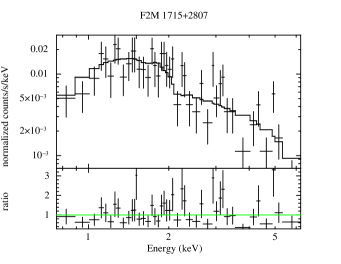
We perform spectral analysis only on sources with counts. Three sources are well detected with counts which we grouped by a minimum of 5 counts per bin. Another two sources have between 50 and 100 counts, which we group by 2 counts per bin. We use the X-ray fitting software XSpec v12.13.0 (Arnaud, 1996) to model these sources. We use the Cash statistics (C-stat; Cash, 1979) with direct background subtraction (Wachter et al., 1979).
We began by fitting a simple power-law model,
| (4) |
allowing only absorption from gas in the Milky Way (phabs). Table 3 lists the Galactic hydrogen column density, determined using the colden CIAO task, which we freeze in all our fits. Given that red quasars experience absorption at optical wavelengths, we further fit an absorbed power-law model,
| (5) |
with absorption occurring both at the source (zphabs) and in the Milky Way to look for potential intrinsic obscuration in the source. Finally, because the previous analyses of the X-ray spectra of red quasars revealed an excess of soft X-ray flux below 2 keV suggesting that there may be scattered or leaked light at lower energies in excess of the absorbed primary continuum (\al@LaMassa16b,Glikman17a; \al@LaMassa16b,Glikman17a), we fit a double-absorbed power law with the same photon index for both components,
| (6) |
We use an F-test to decide whether the additional components significantly improves the fit with a probability of . We report in Table 4 the fitted parameters for these sources, indicating in the second column the model equation used in the best fit.
3.2 Complex fits
For one source, F2M 1507, there appears to be a reduction in flux around keV, which may be due to blue-shifted absorption from an outflow. We discuss the unusual spectral properties and perform more detailed fitting of this object to account for this absorption in Appendix A.1.
In another source, F2M 1532, we noted the presence of an Fe K line suggestive of reflection off a distant medium. While such emission is typically seen in Type 2 AGN, where the reflection occurs off of the obscuring torus, it has been seen in at least one red quasar (F2M 0830; Piconcelli et al., 2010; LaMassa et al., 2016b), where the scattering may be due to clouds farther out from the nucleus. To address such scenarios, we turn to the MYTorus model of Murphy & Yaqoob (2009) which solved the radiative transfer of X-rays from an AGN including scattering off of a torus, line-of-sight absorption, as well as leakage or scattered light. In XSpec, the model is defined similar to Eqn 6:
| (7) |
where E is the observed energy and MYTorusZ, MYTorusS, and MYTorusL are tables that contain pre-calculated parameters derived via Monte Carlo calculations that take into account the reprocessing of the intrinsic AGN continuum in a toroidal structure for a range of column densities. MYTorusZ is the so-called ‘zeroth-order spectrum’, and represents the intrinsic continuum that makes it through any absorbing or scattering medium along the line-of-sight (mytorus_Ezero_v00.fits). MYTorusS tabulates Compton-scattered emission that is added to the zeroth-order spectrum (mytorus_scatteredH500_v00.fits). MYTorusL provides fluorescent line emission that is also added to the zeroth-order spectrum (mytl_V000010nEp000H500_v00.fits, where H200 refers to the termination energy of the model of 200 keV). This model set up is the same as previously used for the analysis of F2M red quasars (\al@LaMassa16b,Glikman17a; \al@LaMassa16b,Glikman17a) as well as 3C 223, whose complex X-ray spectrum has characteristics similar to F2M J1532 (LaMassa et al., 2023). All three MYTorus components are needed in order to preserve the self-consistency of the model. We discuss the detailed fitting of F2M J1532 in Appendix A.2.
We report the results of these complex fits in A.1 and A.2. However, since the essential parameters (, , ) used in the subsequent analysis are similar to the phenomenological results, we do not use the complex fitted parameters in the subsequent analysis.
| Name | Model | C-stat | HR | |||
| Eqn. | (cm-2) | (%) | (DOF) | |||
| F2M J0825 | 2 | … | 44.49 (36) | 0.19 | ||
| F2M J1118 | 2 | … | 10.96 (22) | |||
| F2M J1507 | 3 | ♯ | 16 | 28.29 (27) | 0.31 | |
| F2M J1532† | 3 | 11 | 113.48 (120) | 0.44,0.38‡ | ||
| F2M J1715 | 1 | … | … | 57.72 (42) | ||
| ♯ The photon index for this fit was fixed due to the small number of bins. (See §A.1 for a more complex modeling approach). | ||||||
| †This source was fit jointly with both observations listed in Table 3. | ||||||
| ‡ The HRs were computed separately for each of the observations listed in Table 3, with the longer observation (ObsID 3138) listed first. | ||||||


3.3 Hardness ratios in the low count regime
For the three sources with and counts – an insufficient amount for spectral modeling – we instead report hardness ratios (HRs), which are a meaningful proxy for X-ray absorption. The HR is defined by comparing the net counts in the hard () and soft () bands, defined as keV and keV in the observed frame, respectively, as appropriate for Chandra’s energy response, by the expression . We determine these counts via the CIAO command dmcopy which filters the events file to create an image with just the photons in each energy band. We then apply the same source and background regions to measure the source counts using the CIAO tool dmextract.
Given that we are in this low-count regime, we employ the Bayesian Estimation of Hardness Ratios (BEHR; Park et al., 2006) code which determines HRs, properly handling uncertainties in the Poisson limit, including non-detections. We report in Table 5 the hard and soft counts as well as the mode of the HR determined by BEHR. The stated uncertainties represent the lower and upper bounds reported by BEHR.
Assuming an absorbed power-law model for these red quasars (Eqn. 5) and fixing the power-law index to , we can crudely approximate the column density responsible for the measured HR. Following a similar approach described in Martocchia et al. (2017), we simulate such a spectrum with the WebPIMMS interface222https://cxc.harvard.edu/toolkit/pimms.jsp setting the appropriate Cycle of the observations, providing the soft count rate for each quasar, varying the intrinsic , and computing the HR from the predicted hard count rate until the lower bound reported by BEHR is reached. We then regard the value from the simulated spectrum as representing a lower-limit for the absorption. We report these values in Table 5 as well. We note that the values derived from HRs are highly simplified, as they neglect scattering or leakage of X-ray photons (e.g., Eqn. 6) and assume a fixed power-law continuum, .
Because they are computed in the observed band, HRs depend on redshift, with the strongest dependence occurring for moderately absorbed sources ( cm-2) at (LaMassa et al., 2016a) which is where all the quasars with computed HRs in this paper lie. None the less, in all cases, HRs imply cm-2. Mindful of these considerations, we compare these values to HRs measured in other red quasar samples.
Glikman et al. (2018) surveyed the deg2 equatorial region known as SDSS Stripe 82 (Frieman et al., 2008) which contains a wealth of multi-wavelength ancillary data. Using near-to-mid infrared selection to a relatively shallow flux limit of 20 mJy at 22m, they identified 21 red QSOs, most lacking a radio detection in FIRST but with otherwise similar characteristics as the F2M red quasars. Four red QSOs in that study had X-ray detections that allowed for HR measurements. Their redshifts span to and HR to HR , with the object having HR = 0.792, thus placing them all in the moderately absorbed ( cm-2) regime.
In an X-ray selected red QSO sample over Stripe 82, reaching significantly fainter sources (including SDSS drop-outs) and thus higher redshifts up to , LaMassa et al. (2017) find 12 sources displaying features consistent with the evolutionary paradigm proposed for the F2M red quasars. LaMassa et al. (2017) measure a range of HRs and, applying a similar translation between HR and , find that half have cm-2 with three sources consistent with no absorption. The same caveats about soft excess due to scattering and leakage apply here as well such that higher-count X-ray spectra may reveal more complex physics than a simple absorbed power law.
| Name | Net Soft | Net Hard | HR | |
| (counts) | (counts) | (cm-2) | ||
| F2M J1106 | ||||
| F2M J1151 | ||||
| F2M J1324 | 21.7 (22.4)† | |||
| † This source’s lower and upper bound spanned a very broad range; we provide in parentheses the corresponding to the mode value. | ||||
3.4 Upper limits for undetected sources
Two sources, F2M J0834 and F2M J1531, have counts consistent with non-detections.
For these sources, we follow the CIAO thread for calculating source count rates and model-independent fluxes. We compute the flux over the full energy range using the task srcflux modeling the flux as being absorbed by Milky Way gas (phabs).
We note that F2M J1531 is the only high redshift source in this sample, having while the rest are all at , and is thus the only one with imaging from Glikman et al. (2015).
Therefore, although its morphology shows evidence of a merger, its heterogeneous imaging aspects do not impact the results presented in Section 4.
Having extracted flux information from all ten sources, we present the soft (0.5–2 keV), hard (2–10 keV), and full (0.5–10 keV) X-ray fluxes in Table 6333Although the hard band was defined as keV when computing HRs, we define the hard band as keV when reporting fluxes and luminosities so we can compare them with established X-ray relations in the literature that use that band definition.. We also compute the X-ray luminosities in the 2-10 keV band, which are used to compare with other emission diagnostics in Section 4. For objects with sufficient counts to enable spectral fitting (i.e., those listed in Table 4) we measure and report the observed luminosity using the best-fit model; we omit Milky Way absorption in this calculation. We then also report an absorption-corrected luminosity by defining a simple zpow model with the best-fit power-law index () and its normalization. The uncertainties on the luminosity are derived from the uncertainty on the power-law normalization. For the low count objects (i.e., those listed in Table 5), we determine their luminosities assuming a power-law spectrum (zpow) with an index of . We normalize this model based on a fit to the low count data using the model in Eqn 5, and derive the uncertainties on the luminosity from the uncertainties on the power-law normalization in this model. Given that for these sources was estimated from the HRs, which are already uncertain, we do not compute a luminosity from the observed data. We do not compute a luminosity for the two sources that we deem to be undetected and for which we report upper limits to their fluxes. Table 6 also reports the rest-frame absorption-corrected 2-10 keV luminosities as well as their rest-frame m luminosities, which are determined by interpolating between the WISE photometric bands, as described in Section 2.1.
| Name | |||||
| ( erg cm-2 s-1) | ( erg cm-2 s-1) | ( erg cm-2 s-1) | (erg s-1) | (erg s-1) | |
| F2M J0825 | 46.4720.007 | ||||
| F2M J0834 | … | … | † | … | 45.300.01 |
| F2M J1106 | ‡ | 45.8540.005 | |||
| F2M J1118 | 46.0620.008 | ||||
| F2M J1151 | ‡ | 45.690.02 | |||
| F2M J1324 | ‡ | 45.8370.005 | |||
| F2M J1507 | 46.050.01 | ||||
| F2M J1531 | … | … | † | … | 47.330.02 |
| F2M J1532 | 45.7060.007 | ||||
| F2M J1715 | 45.6730.008 | ||||
| † These fluxes are reported over the 0.5-7 keV range as they are derived directly from the data with the srcflux task on undetected sources. | |||||
| Note – Upper limits are quoted when XSpec returns a 1- lower limit of 0. | |||||
| ‡ These sources had too few counts for spectral modeling. Their intrinsic luminosities are modeled from a fixed | |||||
4 Results and Discussion
Following the definition and identification of F2M red quasars as a population in Glikman et al. (2004), several other reddened and obscured quasar samples have been constructed using various definitions that exhibit similar characteristics of being in a transitional phase of quasar evolution. Many of these samples’ selection criteria overlap the F2M selection, but extend along other parametric axes. We summarize here the various reddened AGN populations and compare their X-ray-derived properties to the F2M sample in this work.
F2M red quasars were selected by applying the optical to near-infrared colour cuts of mag and mag to sources with matches in FIRST and 2MASS. An essential selection criterion for F2M red quasars is that they exhibit at least one broad ( km s-1) emission line in their spectrum; therefore F2M red quasars are by definition Type 1 sources. Although the colour cut avoids most low mass (M class) stars, they remain a strong contaminant since they are abundant in the Galaxy and have colours that resemble reddened quasars (c.f., Warren et al., 2000). Radio selection was invoked to more thoroughly avoid them, but as a result the F2M survey misses large numbers of radio-faint red quasars.
Banerji et al. (2012) and Temple et al. (2019) invoked a more stringent mag colour cut which naturally identifies more heavily reddened systems at higher redshifts (). The sample is restricted to broad line (Type 1) sources and consists of objects. These heavily reddened quasars (HRQs) are also intrinsically more luminous and show outflows in [O iii]. Although no rest-frame high-resolution optical imaging exists to identify whether the HRQs reside in merging hosts, an ALMA observation of one HRQ, J2315, does show merging evidence (Banerji et al., 2021).
Aiming to exploit the mid-infrared photometry from WISE, which is less sensitive to dust extinction, a population of hyperluminous, hot dust obscured galaxies (Hot DOGs; Wu et al., 2012; Tsai et al., 2015) was identified by the “W1W2 dropout” method such that they are weak or undetected at 3.4 m and 4.6 m but bright at 12 m and 22 m. There are only such sources across the entire extragalactic sky and their redshifts are in the cosmic noon era (). These objects likely contain buried AGN whose presence is implied by hot dust temperatures K and optical spectroscopic diagnostic features, though broad lines are often not seen. Fan et al. (2016) investigated the morphologies of 18 Hot DOGs with HST imaging and concluded a merger fraction of % which is lower than for the F2M red quasars (%) but higher than unobscured AGN hosts (%; Villforth, 2023). Farrah et al. (2017) find a similar merger fraction () in their HST study of Hot DOGs but conclude that this high fraction is reflective of the massive galaxy population at . Hot DOGs have been rarely detected in X-rays, likely due to the common presence of heavy ( cm-2) absorption (e.g., Piconcelli et al., 2015; Vito et al., 2018). Hot DOGs are also interpreted as representing an evolutionary phase.
‘Extremely red quasars’ (ERQs) were selected by the optical-to-mid-infrared colour mag in Ross et al. (2015) and mag plus C iv line properties indicative of outflows in Hamann et al. (2017) resulting in ERQs. These criteria pick out objects that are more heavily reddened than the F2M red quasars at redshifts similar to the HRQs (). ERQs contain Type 1 and Type 2 sources, the latter exhibiting significant amounts of polarization (Alexandroff et al., 2018; Zakamska & Alexandroff, 2023). Their hosts are largely not in mergers (only 2/10 sources studied show merger activity; Zakamska et al., 2019) but exhibit powerful winds seen in broad [O iii] emission lines in excess of 1000 km s-1 and with sufficient energy to impact their hosts (Vayner et al., 2021; Lau et al., 2022).
Aiming to overcome the radio-selection of the F2M survey, and to exploit the wealth of multi-wavelength data in the SDSS Stripe 82 region, LaMassa et al. (2016a) and Glikman et al. (2018) used X-ray selection and WISE colours, respectively, to identify additional samples of red quasars.
In addition, Jun et al. (2020) performed a meta analysis of the aforementioned obscured AGN populations to relate their X-ray absorption and dust extinction properties. In the following sections, we compare the F2M quasars in this work to those compiled results and place F2M red quasars in the broader context of luminous obscured quasars.
4.1 Dust-to-gas ratios
The X-ray data for the F2M red quasars presented here provide a measure of the column density, , which parametrizes the absorption due to atomic gas along the line of sight. This value is determined via spectral fitting for the five sources with counts and is considered more reliable than the estimated from the HR measured for sources fewer counts. The dust extinction, parametrized by , is reported in Tables 1 and 2. Together, and provide constraints on the nature of the absorber, namely its dust-to-gas ratio.
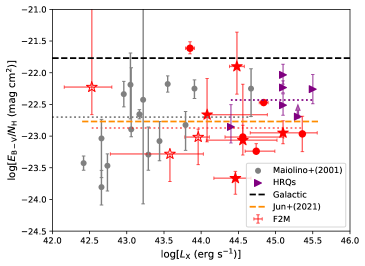
In Figure 4 we plot the dust-to-gas ratio for the F2M red quasars as a function of their 2-10 keV X-ray luminosity with red symbols, where filled circles are the four previously-studied quasars from L16 and G17 as well as F2M J0915 from Urrutia et al. (2005). Filled stars represent the five quasars that had determined via spectral fitting and open star symbols are the three sources whose values were estimated from their HRs and are therefore least precise.
It has already been demonstrated in Maiolino et al. (2001a) that low-luminosity AGN (i.e., Seyfert galaxies) have dust-to-gas ratios that are significantly lower than the interstellar medium value determined for the Milky Way ( mag cm2 shown with a horizontal black dashed line; Bohlin et al., 1978). These Seyfert AGN were selected to have simple X-ray absorption spectra, avoiding sources with warm absorbers or cold absorbers with partial-covering (Eqn. 6). The dust-to-gas ratios found for these AGN, plotted with gray circles 4, is therefore descriptive of circumnuclear material. The mean value for this sample is , shown with a horizontal dotted gray line.
Given that most of the F2M red quasars are found in mergers, are fit by a variety of absorption models including partial covering, and are more luminous by orders of magnitude, they may not have the same source of reddening as the Seyferts in Maiolino et al. (2001a). Yet, the dust-to-gas ratio distribution of F2M red quasars overlaps the Maiolino et al. (2001a) sample. Since the lower dust-to-gas ratio is suggestive of larger dust grains (Maiolino et al., 2001b), but is also consistent with dust grains being sublimated close to the central engine, it is possible that different mechanisms produce similar results. The two sources whose dust-to-gas ratios are consistent with the Milky Way value are F2M J1715, which had the lowest measured value such that its best-fit spectrum was a single power law with no absorption (Eqn. 4)444To compute a dust-to-gas ratio, we use the from an absorbed power-law fit (Eqn. 5; cm-2), which was a poorer fit than a simple unabsorbed power law according to an F-test, but allows for an estimate of the dust-to-gas ratio., and F2M J1227 from L16, which lacks imaging to determine whether it is hosted by a merger and has minimal line-of-sight absorption ( cm-2). The rest of the sources have lower dust-to-gas ratios than the Milky Way value by factors similar to the Maiolino et al. (2001a) sample. In addition, the mean dust-to-gas ratio is (dotted red line), which consistent with the previous studies in L16 and G17.
For comparison, we plot the average dust-to-gas ratio for six HRQs studied in Lansbury et al. (2020) with purple triangles. Their mean value, shown with a dotted purple line, is higher than the F2M red quasars and the Maiolino et al. (2001a) sample. This may be explained by the more stringent colour selection of the HRQ sample which finds preferentially more reddened sources with higher values. The meta analysis of Jun et al. (2020), which includes the previously published F2M red quasars, Type 2 AGN, ERQs, and Hot DOGs, finds a value consistent with the Maiolino et al. (2001a) average (; dashed orange line).
4.2 X-ray versus infrared luminosity
There exist various tracers of intrinsic AGN luminosity and, by extension, SMBH accretion that must be reconciled in order to adopt a consistent physical model for AGN. X-rays trace the innermost emission from the accretion disk, while mid-infrared (e.g., m) arises from reprocessed UV photons from the accretion disk that are absorbed by nuclear dust (i.e., the ‘torus’) and thermally re-emitted. At low luminosities, X-ray and mid-IR emission follow a linear relation (in log-log space; Lutz et al., 2004). However, observations of higher-luminosity quasars show a departure from this relation around erg s-1 (Stern, 2015; Chen et al., 2017) and are are interpreted as being under-luminous in X-rays (Ricci et al., 2017b). The decreasing ratio with increasing luminosities could also be interpreted as due to the increasing bolometric correction in X-rays at high (Martocchia et al., 2017).
In Figure 5 we plot the eight F2M red quasars with X-ray luminosities (Table 6) along with other samples from the literature. The black stars and green asterisks are luminous, unobscured, Type 1 quasars from Stern (2015) and Martocchia et al. (2017). The low luminosity relation from Lutz et al. (2004), which is calibrated at luminosities too low to appear on this plot, is shown by the shaded region. The relations from Stern (2015) and Chen et al. (2017), defined based on unobscured Type 1 samples, are shown with dotted and dashed lines, respectively, and depart from the shaded region. ERQs are shown with orange diamonds (Goulding et al., 2018) and exist in the same part of the relation as the unobscured objects. Hot DOGs, shown with blue pentagons, fall systematically below the extended relations (Ricci et al., 2017b).
Models of radiation-driven feedback postulate that X-rays need to be suppressed in order to enable line-driven winds on small scales (Proga et al., 2000). And it has been shown that quasars with strong outflows are X-ray weak (Luo et al., 2013; Zappacosta et al., 2020).
While the F2M red quasars (red symbols, both from this and previous works) are not as luminous in the infrared as the Hot DOGs or ERQs, they similarly lie below the relation established at low luminosities, even when corrected for absorption. F2M red quasars have an anomalously high fraction of BAL systems indicative of line-driven outflows. In addition, F2M J1507 shows evidence for ultra-fast out-flowing material in its X-ray spectrum (§A.1). In this space, Hot DOGs appear to be an extension of F2M red quasars toward more luminous IR sources whose X-rays are suppressed compared to their IR luminosity (for a discussion on the X-raw weakness of Hot DOG, see Ricci et al., 2017b).
We note that the open F2M symbols were in the low-count regime and had their column density estimated from their HRs which was used to correct the X-ray luminosity. These luminosities are therefore highly uncertain and may be underestimated. However, given that their exposure times are similar to the rest of the sample, while their net counts are lower by more than an order of magnitude, they are likely intrinsically less luminous.

4.3 Radiative feedback
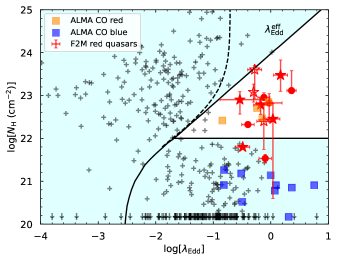
The key to blowing out gas from the vicinity of an AGN – and possibly out of the host galaxy entirely – may be radiation pressure from a high-enough luminosity pushing against infalling material whose composition is a mixture of partially ionized dust and gas. Such a medium has an ‘effective cross section’, , that is larger than the Thomson cross section, , reducing the Eddington luminosity for the system. This resultant ‘effective Eddington limit’ is thus lower than that for pure ionized hydrogen, enabling AGN with a sufficiently high accretion rate, and a not-too-high column density to blow out the dust and gas (Fabian et al., 2006, 2008; Ishibashi et al., 2018). According to this theory, the interplay between an AGN’s accretion, obscuration, and radiative feedback can be understood through two parameters: and , shown in Figure 6. Sources with the right combination of and are found in the white triangular region, referred to as the “forbidden” or “blow-out’‘ region, where the luminosity is high enough to produce outflows and gas density is low enough to avoid stalling them. Since the blow-out of gas as a result of radiation pressure can involve multiple scatterings, as the opacity of the material increases the blowout region can be expanded out to the dashed line, which takes radiation trapping into account (Ishibashi et al., 2018).
Ricci et al. (2017a) explored the nature of obscuration for Swift/BAT AGN, which are hard X-ray-selected AGN with , in the vs. plane and find that they lie in the region suggestive of long-lasting obscuration whether by dust lanes in the host galaxy for sources with or by a high covering fraction of nuclear obscuration for sources with . These sources are plotted with black crosses in Figure 6 confirming that the vast majority of low-luminosity, local AGN are not engaged in radiative feedback.
The F2M red quasars from L16 and G17 as well as F2M J0915 are shown with filled red circles. The red stars are sources from this work where filled stars are the five high-count objects whose values were determined from spectral fitting and the open stars are the three low-count sources whose values were estimated from HRs. The two sources with upper limits on their X-ray counts are not shown. One of these low-count sources, F2M J1106, is on the edge of the region modified by radiation trapping. This source shows bi-conal outflowing superbubbles in [O iii] consistent with trapped photons pushing against an entrained shell of gas expanding out (Shen et al., 2023). The time-scale for these bubbles is estimated to be Myrs, which is roughly consistent with the timeline for the most heavily absorbed simulations in Ishibashi et al. (2018). However, it is also possible that because its value was determined by its HR, this estimate sufficiently uncertain that it may actually live in the unmodified blowout region. We note that F2M J0830, whose X-ray analysis was performed in L16, also shows bi-conal outflowing superbubbles (Shen et al., 2023).
All but one (F2M J1151) of the F2M red quasars in the blowout region show evidence for merging morphologies in their hosts. The two source below the line, where the relatively low obscuration is due to dust lanes in the host galaxy, either have undisturbed morphologies (F2M J1715) or lack imaging (F2M J1227).
In an independent investigation of quasar outflow properties at sub-mm wavelengths, Stacey et al. (2022) found similar differences between blue and red quasars in archival ALMA observations of sixteen Type 1 quasars with CO lines. Four of these sources have determined from SED fitting, while the remaining sources have . We plot the red and blue quasars from Stacey et al. (2022) in the left panel of Figure 6 with orange and blue squares, respectively. Here, too, red quasars with molecular outflows detected by ALMA are in the blowout region. Blue quasars without outflows do not reside in blowout region. In addition, the analysis of the CO lines by Stacey et al. (2022) reveals molecular outflows with velocities of km s-1 in the red quasars, while the blue quasars have weaker velocities km s-1.
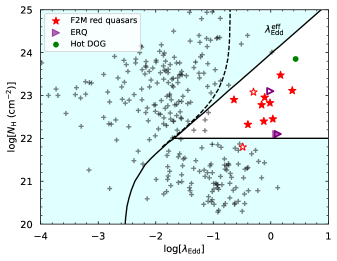
Intriguingly, all of the other dust-obscured quasar samples discussed above (HRQs, Hot DOGs, ERQs, red quasars from Stripe 82, as well as the WISSH quasars) that have and in the literature reside in the blowout region. Figure 7 of Lansbury et al. (2020) shows the aforementioned sources, including the F2M red quasars from L16 and G17, on the vs. diagram. However, high resolution imaging is limited to only a handful of these sources. In the right hand panel of Figure 6 we plot vs. again, focusing only on sources with known host morphologies and we distinguish between merging and undisturbed systems with closed and open symbols, respectively. Twelve F2M red quasars are shown with stars where the two that lack HST imaging, F2M J1227 and F2M J1106555F2M J1106 does possess GMOS IFU imaging with 04 spatial resolution, which is sufficient to reveal galaxy-scale ( kpc) bubbles with a bi-conal morphology. However, it is unknown whether the quasar is hosted by a merger., are omitted. While F2M J1715, which appears to be undisturbed666We note that the among the 11 F2M quasars with sufficient X-ray counts and imaging to be plotted in the right panel of Figure 6, nine come from the HST observations in Urrutia et al. (2008) that were designed to reach similar depths; the exposure times ranged from s to s in the F814W filters, depending on the redshift. However, F2M J1715 was observed in an 800 s snapshot observation, which is shorter than the exposure time for, e.g., F2M J1532, which is at a similar redshift. This means that the surface brightness limit for the image of F2M J1715 is mag shallower and some merger features might be missed., lies outside the blowout region where dust lanes can explain its properties, F2M J1151, which is also undisturbed, lies in the blow out region.
Three ERQs have both HR-based estimates (Goulding et al., 2018) and (Perrotta et al., 2019) as well as HST imaging (J0832+1615, J0834+0159, J1652+1728; Zakamska et al., 2019). All three reside in the blowout region, shown with purple triangles (two points overlap), but only J1652+1728 is a major merger. Though only a few Hot DOGs have X-ray data that enable a measurement of and most are Type 2, precluding a measurement of a black hole mass and thus , we are able to plot one source, WISE J1036+0449 from Ricci et al. (2017b), in the blowout region with a green circle. Although this object does not have morphological information, as noted above, the overall population of Hot DOGs has a high merger fraction.
While all sources with merging hosts reside in the blowout region, a merging morphology is not a necessary condition to meet the requirements needed to blow out large amounts of dust and gas. The presence of winds and outflows may be a more predictive indicator. The entire ERQ sample is shown to have strong outflows in [O iii], with the highest velocities ( km s-1) in the reddest sources (Perrotta et al., 2019) and a fourth ERQ source that lacks imaging (J0006+1215) also meets blowout conditions in vs. . Likewise, the HRQs lack host morphology information but reside in the blowout region (see Figure 7; Lansbury et al., 2020) and exhibit strong outflows with velocities up to 2500 km s-1 in [O iii] (Temple et al., 2019). In a reverse approach, Kakkad et al. (2016) selected AGN in the COSMOS survey that were located in the blowout region and conducted follow-up IFU observations in [O iii] and find outflow velocities of km s-1. None the less, a systematic imaging campaign on the various samples of obscured AGN in the blow out region is needed to more thoroughly investigate any connection between mergers and outflows and better understand the conditions under which radiative feedback dominates.
5 conclusions
In this paper, we investigate the accretion and obscuration properties of a sample of merger-dominated luminous red quasars via X-ray observations. This sample consists of 10 newly analysed X-ray observations as well as 5 previously published sources. All but two have high resolution imaging with HST and one of those two has high resolution, high quality IFU imaging in [O iii]. Although the sources were not chosen to reside in mergers, ten sources have clear evidence of morphologically disturbed hosts (as previously determined by Urrutia et al. 2008 and Glikman et al. 2015). The sample consists of eight new observations, two sources with archival data sets, and five previously published sources. When sufficient counts enabled it, we performed spectral modeling to extract parameters such as that enabled a calculation of the absorption-corrected luminosity. Lower count objects were analyzed via their HRs to estimate ; in cases of non-detection, we determine upper limits. We combine these X-ray-derived properties with host galaxy morphological information from high resolution imaging, dust reddening, infrared luminosity, and accretion rate (). These data allow us to investigate the connection among these properties and we find:
-
1.
F2M red quasars have dust-to-gas ratios that are in general lower than the interstellar medium of the Milky Way. Their dust-to-gas ratios are consistent with low-luminosity AGN in the local universe, though the ratio likely arises from very different physics. The dust-to-gas ratios of F2M red quasars is somewhat lower than, but roughly consistent with the dust-to-gas ratios of comparison samples of luminous dusty quasars.
-
2.
F2M red quasars are under-luminous in X-rays at a given infrared luminosity when compared with local, low luminosity relations as well as luminous, unreddened sources that straddle the high luminosity relation. However, their X-ray deficit is consistent with other, more luminous, dust-obscured quasars such as the Hot DOGs.
-
3.
with the exception of two sources, F2M red quasars reside in the “forbidden” region of vs. indicative of them being in a blowout phase due to radiation pressure on dust. Furthermore, all F2M red quasars with merging hosts are in the blowout region as are other luminous dusty quasars from comparison samples. A broader investigation of the host morphologies of blue quasars outside the blowout region is needed to better understand any connection among reddening, feedback, and mergers.
These findings lend further support to F2M red quasars, along with other luminous dust-reddened quasars, being in a brief transitional phase in a merger-driven co-evolution of galaxies and their supermassive black holes.
Acknowledgements
E.G. acknowledges the generous support of the Cottrell Scholar Award through the Research Corporation for Science Advancement. E.G. is grateful to the Mittelman Family Foundation for their generous support. E.P. and L.Z. acknowledge financial support from the Bando Ricerca Fondamentale INAF 2022 Large Grant “Toward an holistic view of the Titans: multi-band observations of z>6 QSOs powered by greedy supermassive black-holes.” We thank Laura Blecha for useful discussions on the nature of F2M J1507. We thank Hannah Stacey for providing the data for the ALMA-detected quasars plotted in Figure 6. We acknowledge the efforts of Charlotte Moore in the initial phase of this project.
Support for this work was provided by the National Aeronautics and Space Administration through Chandra Award Number 21700216 issued by the Chandra X-ray Center, which is operated by the Smithsonian Astrophysical Observatory for and on behalf of the National Aeronautics Space Administration under contract NAS8-03060. The scientific results reported in this article are based on observations made by the Chandra X-ray Observatory, data obtained from the Chandra Data Archive, and observations made by the Chandra X-ray Observatory and published previously in cited articles. This research has made use of software provided by the Chandra X-ray Center (CXC) in the application packages CIAO. We gratefully acknowledge the National Science Foundation’s support of the Keck Northeast Astronomy Consortium’s REU program through grant AST-1950797.
Data Availability
The X-ray data underlying this article are publicly available through the Chandra archives.
References
- Alexandroff et al. (2018) Alexandroff R. M., et al., 2018, MNRAS, 479, 4936
- Arnaud (1996) Arnaud K. A., 1996, in Jacoby G. H., Barnes J., eds, Astronomical Society of the Pacific Conference Series Vol. 101, Astronomical Data Analysis Software and Systems V. p. 17
- Assef et al. (2011) Assef R. J., et al., 2011, ApJ, 742, 93
- Banerji et al. (2012) Banerji M., McMahon R. G., Hewett P. C., Alaghband-Zadeh S., Gonzalez-Solares E., Venemans B. P., Hawthorn M. J., 2012, MNRAS, 427, 2275
- Banerji et al. (2021) Banerji M., Jones G. C., Carniani S., DeGraf C., Wagg J., 2021, MNRAS, 503, 5583
- Becker et al. (1995) Becker R. H., White R. L., Helfand D. J., 1995, ApJ, 450, 559
- Bohlin et al. (1978) Bohlin R. C., Savage B. D., Drake J. F., 1978, ApJ, 224, 132
- Cash (1979) Cash W., 1979, ApJ, 228, 939
- Chen et al. (2017) Chen C.-T. J., et al., 2017, ApJ, 837, 145
- Faber et al. (1997) Faber S. M., et al., 1997, AJ, 114, 1771
- Fabian (2012) Fabian A. C., 2012, ARA&A, 50, 455
- Fabian et al. (2006) Fabian A. C., Celotti A., Erlund M. C., 2006, MNRAS, 373, L16
- Fabian et al. (2008) Fabian A. C., Vasudevan R. V., Gandhi P., 2008, MNRAS, 385, L43
- Fan et al. (2016) Fan L., et al., 2016, ApJ, 822, L32
- Farrah et al. (2017) Farrah D., et al., 2017, ApJ, 844, 106
- Ferrarese & Merritt (2000) Ferrarese L., Merritt D., 2000, ApJ, 539, L9
- Frieman et al. (2008) Frieman J. A., et al., 2008, AJ, 135, 338
- Fruscione et al. (2006) Fruscione A., et al., 2006, in Silva D. R., Doxsey R. E., eds, Society of Photo-Optical Instrumentation Engineers (SPIE) Conference Series Vol. 6270, Society of Photo-Optical Instrumentation Engineers (SPIE) Conference Series. p. 62701V, doi:10.1117/12.671760
- Gebhardt et al. (2000) Gebhardt K., et al., 2000, ApJ, 539, L13
- Glikman (2017) Glikman E., 2017, Research Notes of the American Astronomical Society, 1, 48
- Glikman et al. (2004) Glikman E., Gregg M. D., Lacy M., Helfand D. J., Becker R. H., White R. L., 2004, ApJ, 607, 60
- Glikman et al. (2006) Glikman E., Helfand D. J., White R. L., 2006, ApJ, 640, 579
- Glikman et al. (2007) Glikman E., Helfand D. J., White R. L., Becker R. H., Gregg M. D., Lacy M., 2007, ApJ, 667, 673
- Glikman et al. (2012) Glikman E., et al., 2012, ApJ, 757, 51
- Glikman et al. (2013) Glikman E., et al., 2013, ApJ, 778, 127
- Glikman et al. (2015) Glikman E., Simmons B., Mailly M., Schawinski K., Urry C. M., Lacy M., 2015, ApJ, 806, 218
- Glikman et al. (2017) Glikman E., LaMassa S., Piconcelli E., Urry M., Lacy M., 2017, ApJ, 847, 116
- Glikman et al. (2018) Glikman E., et al., 2018, ApJ, 861, 37
- Gordon & Clayton (1998) Gordon K. D., Clayton G. C., 1998, ApJ, 500, 816
- Goulding et al. (2018) Goulding A. D., et al., 2018, ApJ, 856, 4
- Hamann et al. (2017) Hamann F., et al., 2017, MNRAS, 464, 3431
- Hopkins & Beacom (2006) Hopkins A. M., Beacom J. F., 2006, ApJ, 651, 142
- Hopkins et al. (2006) Hopkins P. F., Hernquist L., Cox T. J., Di Matteo T., Robertson B., Springel V., 2006, ApJS, 163, 1
- Ishibashi et al. (2018) Ishibashi W., Fabian A. C., Ricci C., Celotti A., 2018, MNRAS, 479, 3335
- Jun et al. (2020) Jun H. D., Assef R. J., Carroll C. M., Hickox R. C., Kim Y., Lee J., Ricci C., Stern D., 2020, The Astrophysical Journal, 906, 21
- Kakkad et al. (2016) Kakkad D., et al., 2016, A&A, 592, A148
- Kim et al. (2010) Kim D., Im M., Kim M., 2010, ApJ, 724, 386
- Kim et al. (2015) Kim D., Im M., Glikman E., Woo J.-H., Urrutia T., 2015, ApJ, 812, 66
- LaMassa et al. (2016a) LaMassa S. M., et al., 2016a, ApJ, 818, 88
- LaMassa et al. (2016b) LaMassa S. M., et al., 2016b, ApJ, 820, 70
- LaMassa et al. (2017) LaMassa S. M., et al., 2017, ApJ, 847, 100
- LaMassa et al. (2023) LaMassa S. M., Yaqoob T., Tzanavaris P., Gandhi P., Heckman T., Lansbury G., Siemiginowska A., 2023, ApJ, 944, 152
- Lansbury et al. (2020) Lansbury G. B., Banerji M., Fabian A. C., Temple M. J., 2020, MNRAS, 495, 2652
- Lau et al. (2022) Lau M. W., Hamann F., Gillette J., Perrotta S., Rupke D. S. N., Wylezalek D., Zakamska N. L., 2022, MNRAS, 515, 1624
- Luo et al. (2013) Luo B., et al., 2013, ApJ, 772, 153
- Lutz et al. (2004) Lutz D., Maiolino R., Spoon H. W. W., Moorwood A. F. M., 2004, A&A, 418, 465
- Mainzer et al. (2011) Mainzer A., et al., 2011, ApJ, 731, 53
- Maiolino et al. (2001a) Maiolino R., Marconi A., Salvati M., Risaliti G., Severgnini P., Oliva E., La Franca F., Vanzi L., 2001a, A&A, 365, 28
- Maiolino et al. (2001b) Maiolino R., Marconi A., Oliva E., 2001b, A&A, 365, 37
- Marble et al. (2003) Marble A. R., Hines D. C., Schmidt G. D., Smith P. S., Surace J. A., Armus L., Cutri R. M., Nelson B. O., 2003, ApJ, 590, 707
- Martocchia et al. (2017) Martocchia S., et al., 2017, A&A, 608, A51
- Murphy & Yaqoob (2009) Murphy K. D., Yaqoob T., 2009, MNRAS, 397, 1549
- Park et al. (2006) Park T., Kashyap V. L., Siemiginowska A., van Dyk D. A., Zezas A., Heinke C., Wargelin B. J., 2006, ApJ, 652, 610
- Perrotta et al. (2019) Perrotta S., Hamann F., Zakamska N. L., Alexandroff R. M., Rupke D., Wylezalek D., 2019, MNRAS, 488, 4126
- Piconcelli et al. (2010) Piconcelli E., Vignali C., Bianchi S., Nicastro F., Miniutti G., Fiore F., 2010, ApJ, 710, 992
- Piconcelli et al. (2015) Piconcelli E., et al., 2015, A&A, 574, L9
- Proga et al. (2000) Proga D., Stone J. M., Kallman T. R., 2000, ApJ, 543, 686
- Ricci et al. (2017a) Ricci C., et al., 2017a, Nature, 549, 488
- Ricci et al. (2017b) Ricci C., et al., 2017b, ApJ, 835, 105
- Richards et al. (2006) Richards G. T., et al., 2006, ApJS, 166, 470
- Ross et al. (2015) Ross N. P., et al., 2015, MNRAS, 453, 3932
- Sanders et al. (1988) Sanders D. B., Soifer B. T., Elias J. H., Madore B. F., Matthews K., Neugebauer G., Scoville N. Z., 1988, ApJ, 325, 74
- Shen & Liu (2012) Shen Y., Liu X., 2012, ApJ, 753, 125
- Shen et al. (2023) Shen L., et al., 2023, Science Advances, 9, eadg8287
- Skrutskie et al. (2006) Skrutskie M. F., et al., 2006, AJ, 131, 1163
- Stacey et al. (2022) Stacey H. R., Costa T., McKean J. P., Sharon C. E., Calistro Rivera G., Glikman E., van der Werf P. P., 2022, MNRAS, 517, 3377
- Stern (2015) Stern D., 2015, ApJ, 807, 129
- Temple et al. (2019) Temple M. J., Banerji M., Hewett P. C., Coatman L., Maddox N., Peroux C., 2019, MNRAS, 487, 2594
- Tsai et al. (2015) Tsai C.-W., et al., 2015, ApJ, 805, 90
- Urrutia et al. (2005) Urrutia T., Lacy M., Gregg M. D., Becker R. H., 2005, ApJ, 627, 75
- Urrutia et al. (2008) Urrutia T., Lacy M., Becker R. H., 2008, ApJ, 674, 80
- Urrutia et al. (2009) Urrutia T., Becker R. H., White R. L., Glikman E., Lacy M., Hodge J., Gregg M. D., 2009, ApJ, 698, 1095
- Urrutia et al. (2012) Urrutia T., Lacy M., Spoon H., Glikman E., Petric A., Schulz B., 2012, ApJ, 757, 125
- Vayner et al. (2021) Vayner A., et al., 2021, MNRAS, 504, 4445
- Villforth (2023) Villforth C., 2023, arXiv e-prints, p. arXiv:2309.03276
- Vito et al. (2018) Vito F., et al., 2018, MNRAS, 474, 4528
- Wachter et al. (1979) Wachter K., Leach R., Kellogg E., 1979, ApJ, 230, 274
- Warren et al. (2000) Warren S. J., Hewett P. C., Foltz C. B., 2000, MNRAS, 312, 827
- Wright et al. (2010) Wright E. L., et al., 2010, AJ, 140, 1868
- Wu et al. (2012) Wu J., et al., 2012, ApJ, 756, 96
- Zakamska & Alexandroff (2023) Zakamska N. L., Alexandroff R. M., 2023, MNRAS,
- Zakamska et al. (2019) Zakamska N. L., et al., 2019, MNRAS, 489, 497
- Zappacosta et al. (2020) Zappacosta L., et al., 2020, A&A, 635, L5
- Zubovas & King (2012) Zubovas K., King A., 2012, ApJ, 745, L34
Appendix A Notes on the Spectral fitting for individual objects
A.1 F2M 1507+3129
The Balmer lines of this object have a blue-shifted broad emission component in addition to broad lines at the systemic velocity, which is determined by the [O iii] lines in its optical spectrum. We note that the the blue-shifted broad emission component of H is similar in structure to H, which is shown in Figure 2. We attribute this component to an out-flowing wind, rather than accretion disk geometry, due to the lack of a red-shifted component that is typically seen in double-peaked-emitting AGN. The H component is blue-shifted by 91Å, corresponding to a velocity of , which is slow compared with typical outflow velocities seen in BALs ( km s-1). We use the line width from the broad component at the systemic velocity, which we assume to represent virialized motion, to compute the black hole mass.
As is seen in Figure 3, the X-ray spectrum exhibits some unusual features including what appears to be a deficit of flux around keV. There is also apparent soft excess at energies below 1.5 keV that required a model with a leakage/scattering component (Eqn. 6). However, given the complexity of this model and the small number of spectral bins, we chose to freeze the photon index to . We initially ignored the keV and found an acceptable fit with cm-2 and a scattering fraction of 16%. We further interpret the flux deficit at keV as absorption of Fe xxvi Ly ( keV) due to an ultra-fast outflow (UFO) and amend the model in Eqn. 6 by adding a Gaussian absorption component.
| (8) |
A fit to this model resulted in the same and scattering fraction, while accounting for the absorption at the blue-shifted energy of 4.59 keV, results in a UFO velocity of . The continuum model components are shown as dotted lines in Figure 3. Table 7 lists the best-fit parameters for this source.
This UFO velocity is significantly higher than that seen in the blue-shifted Balmer emission and arises from radii closest to the central engine. While these features are therefore not associated with the same outflowing system, their presence may be indicative of feedback on many scales due to sustained outflowing winds and shocks. Theoretical models predict that radiation driven relativistic winds interact with shocks against the ISM, triggering galaxy-wide ionized and neutral outflows (e.g., Zubovas & King, 2012). A higher count X-ray spectrum would allow for a more thorough exploitation of the energy resolution of e.g., XMM-Newton, to better constrain the outflow properties closest to the SMBH. IFU spectroscopy of the Balmer lines would similarly trace the kinematics of the large scale outflows, to fully trace the feedback energy being injected into host galaxy by this quasar.
| Parameter | Value |
|---|---|
| 1.8† | |
| Power-law normalization | |
| (cm-2) | |
| Ly (keV) | 6.966† |
| (keV) | ‡ |
| EW (keV) | |
| (%) | |
| † This parameter was frozen. | |
| ‡ Given that this feature was fit to a region represented by only two | |
| spectral bins, this value is highly uncertain with an unconstrained lower | |
| bound and an upper bound of . | |
| energy. | |
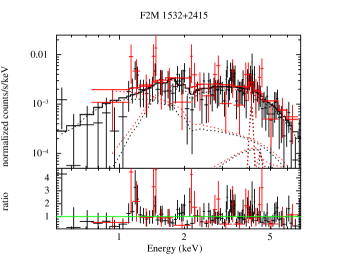
A.2 F2M 1532+2415
This source shows emission at 4.1 keV which is the redshifted fluorescent Iron K line ( keV) suggestive of significant reflected emission often seen atop a strongly suppressed continuum, which is typical in Type 2 quasars. F2M J1532, however, is a Type 1 source, with broad emission lines seen in its spectrum. We performed a self-consistent physically motivated joint fit, with both Chandra observations, to the X-ray spectrum to properly account for line-of-sight attenuation, scattering of photons into the line of sight, and the fluorescent line emission responsible for the Fe K feature. We employed Equation LABEL:eqn:mytorus in XSpec in so-called ‘coupled’ mode, where the column densities (), torus inclination angle (), normalizations of the scattering and fluorescent line coefficient components ( and , respectively) are tied together to preserve the model’s self-consistency. This fit, however, yielded poor results in a best-fit inclination angle of , which is the default, fixed opening angle of the torus-shaped absorber in the MYTorus model. This suggests a grazing incidence angle which is highly unlikely. Therefore, while this is a statistically acceptable fit, it is not a physically meaningful result (see discussion in LaMassa et al., 2016a, 2023, for more details on this phenomenon).
Under such circumstances, it is advisable to fit the spectrum with the same MYTorus model (Eqn. LABEL:eqn:mytorus) but in ‘decoupled’ mode. This approach assumes that the absorbing and X-ray reprocessing media are not necessarily the same, nor are they smooth and homogeneous, as is assumed with a simple torus model. In this approach the line-of-sight column density () is provided by the parameter which is decoupled from the global column density () from surrounding clouds, provided by the terms in Equation LABEL:eqn:mytorus, which are still tied to each other. The inclination angles are also decoupled, such that the transmitted component is frozen at , while the scattered and fluorescent line components are frozen to . In this model, we are not assuming a homogeneous donut-shaped absorber, but utilize the radiative transfer determined by MYTorus to consider light passing through and scattering off of a clumpy and patchy medium surrounding the AGN.
A fit to this model yields reassuring results. The power-law is best described by which, while at the flat end of the range of indices for AGN, is consistent with the value found from the phenomenological XSpec model (Eqn. 6). Additionally, the best-fit line-of-sight column density is cm-2, which is also consistent with the value found from the phenomenological XSpec model (Eqn. 6; cm-2) which only considers line-of-sight absorption and does not account for additional physics. The scattering fraction is also consistent, with the MYTorus fit yielding compared with 11% in the phenomenological model. Finally, the best-fit global column density is cm-2, in the Compton thick regime, which means that this scattered component does not significantly contribute to the continuum allowing for the strong similarity seen with the phenomenological model while also accounting for the Fe K line. This suggests that F2M J1532 is enshrouded by a heavy amount of absorption which is non uniform and our line-of-sight happens to coincide with an opening allowing a direct view to the broad line emission from the quasar.
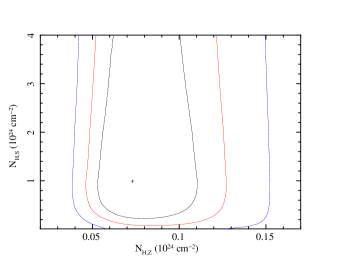
Table 8 lists the best-fit MYTorus parameters for this source. Figure 7 shows the best fit MYTorus model plotted atop the source spectrum, with the individual model components shown separately on the left and a contour plot of the global () versus line-of-sight () column densities showing that while is well constrained and consistent with the phenomenological XSpec model, the global column density is poorly constrained and highly uncertain.
| Parameter | Value |
|---|---|
| † | |
| Power-law normalization | |
| (cm-2) line-of-sight | |
| (cm-2) global‡ | |
| (%) | |
| C-stat (dof) | 106.99 (119) |
| †This parameter was constrained with a lower bound of . | |
| † The error analysis of this parameter was found to have an unconstrained | |
| upper bound, as illustrated by the contour diagram shown in Figure 7. | |