11email: romain.basalgete@uni-jena.de
Water transport through mesoporous amorphous-carbon dust
The diffusion of water molecules through mesoporous dust of amorphous carbon (a-C) is a key process in the evolution of prestellar, protostellar, and protoplanetary dust, as well as in that of comets. It also plays a role in the formation of planets. Given the absence of data on this process, we experimentally studied the isothermal diffusion of water molecules desorbing from water ice buried at the bottom of a mesoporous layer of aggregated a-C nanoparticles, a material analogous to protostellar and cometary dust. We used infrared spectroscopy to monitor diffusion in low temperature (160 to 170 K) and pressure (6 10-5 to 8 10-4 Pa) conditions. Fick’s first law of diffusion allowed us to derive diffusivity values on the order of 10-2 cm2 s-1, which we linked to Knudsen diffusion. Water vapor molecular fluxes ranged from 5 1012 to 3 1014 cm-2 s-1 for thicknesses of the ice-free porous layer ranging from 60 to 1900 nm. Assimilating the layers of nanoparticles to assemblies of spheres, we attributed to this cosmic dust analog of porosity 0.80–0.90 a geometry correction factor, similar to the tortuosity factor of tubular pore systems, between 0.94 and 2.85. Applying the method to ices and refractory particles of other compositions will provides us with other useful data.
Key Words.:
Diffusion, Protoplanetary disks, Comets: general1 Introduction
To date, the soil of comets that have already known activity appears to consist of porous dust that contains water ice in its depths (e.g., Lisse et al., 2022, and references therein). During the active phase of comets, water somehow diffuses through the porous cometary soil and escapes to contribute to the gas coma (e.g., Lecacheux et al., 2003; Kelley et al., 2023). The mechanism of this diffusion or transport is the object of experiments (e.g., Gundlach et al., 2011; Schweighart et al., 2021) and modeling (e.g., Skorov et al., 2011; Laddha et al., 2023; Güttler et al., 2023, and references therein).
We are also interested in the outgassing of porous, refractory materials that contain ices. Aggregated grains of refractory materials that have accumulated ices are components of the dust observed in prestellar cores, as well as in protostellar and protoplanetary disks (e.g., Boogert et al., 2015). The refractory materials are mainly silicates and carbonaceous matter, while the ices consist essentially of water (H2O) (e.g., Demyk, 2011). The sublimation of the volatile icy content of the dust and the associated outgassing cause, for example, ice lines and spatial variations of the gas-to-dust mass ratio (e.g., Stammler et al., 2017; Schoonenberg & Ormel, 2017; Spadaccia et al., 2022). Thus, they affect the trajectory of dust particles and, eventually, planet formation.
The outgassing of dusts lacks experimental characterization. Consequently, the modeling of dust in disks ignores its porosity and its effect on outgassing (e.g., Stammler et al., 2017). To solve this issue, we use our experience in producing layers of aggregated amorphous, refractory nanoparticles (Jäger et al., 2008; Sabri et al., 2013) that are analogs of the interstellar dusts from which prestellar, protostellar, and protoplanetary dusts have formed. We present a new experimental method that allows us to quantify the transport of volatiles in these materials and to derive physical parameters such as diffusion coefficients. We demonstrate the method with the case of water molecules desorbing from buried ice and diffusing through mesoporous layers of amorphous-carbon (a-C) nanoparticles.
2 Experimental
2.1 Preparation of a-C grains and water ice layers
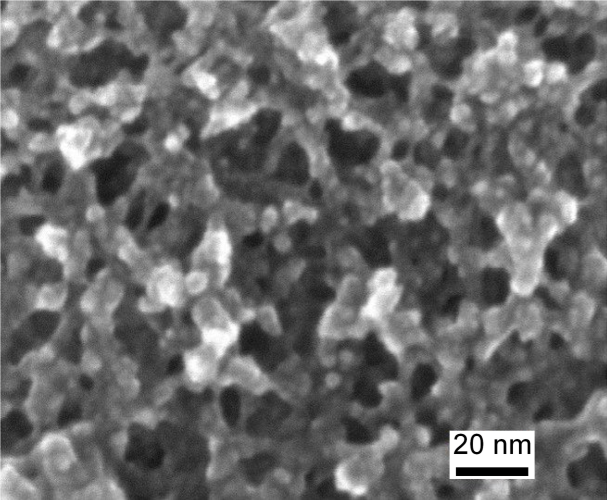
We synthesized a-C nanoparticles using laser ablation of a graphite target under a quenching atmosphere of He gas (Jäger et al., 2008). Appendix A offers detailed information on the procedure. The synthesis apparatus allowed us to generate a beam of these analogs of cosmic carbon grains, to deposit layers of them on KBr substrates, and to perform IR transmission spectroscopy without breaking the vacuum. Figure 1 shows a field emission scanning electron microscopy (FESEM) image of a deposit produced for this study. Individual a-C grains, 1 to 8 nm in diameter, went on to form aggregates and their accumulation produced a mesoporous layer. Its structure is similar to that of a random ballistic deposit of particles, which is not surprising given the method used for its preparation (Appendix A). The diameter of the pores follow a distribution from a few nanometers up to 100 nm, with a typical average on the order of 10–20 nm (mesopores). The porosity of the material, denoted by , ranged from 0.80 to 0.90.
We used a quartz crystal microbalance (QCM) to monitor the deposition of grains and measure the thickness of the deposited layer, ignoring porosity, detailed in Appendix B. The derivation of takes into account a density of 1.55 g cm-3 for the a-C material (Jäger et al., 2008). We determined the thickness of a porous deposit according to:
| (1) |
The synthesis apparatus also made it possible to add a flow of water vapor, H2O(g), parallel to the beam of nanoparticles and a cryostat equipped with a heating element stabilized the substrates to the low temperatures required by the study. Thus, we could deposit grains on a cold substrate together with H2O molecules so as to obtain a composite layer of a-C nanoparticles and water ice, H2O(s). We evaluated the amount of deposited water in terms of molecular column density, denoted , using the area of the 3 m absorption band appearing in the IR spectra and the relevant band strength (see below).
2.2 Isothermal desorption-diffusion experiments
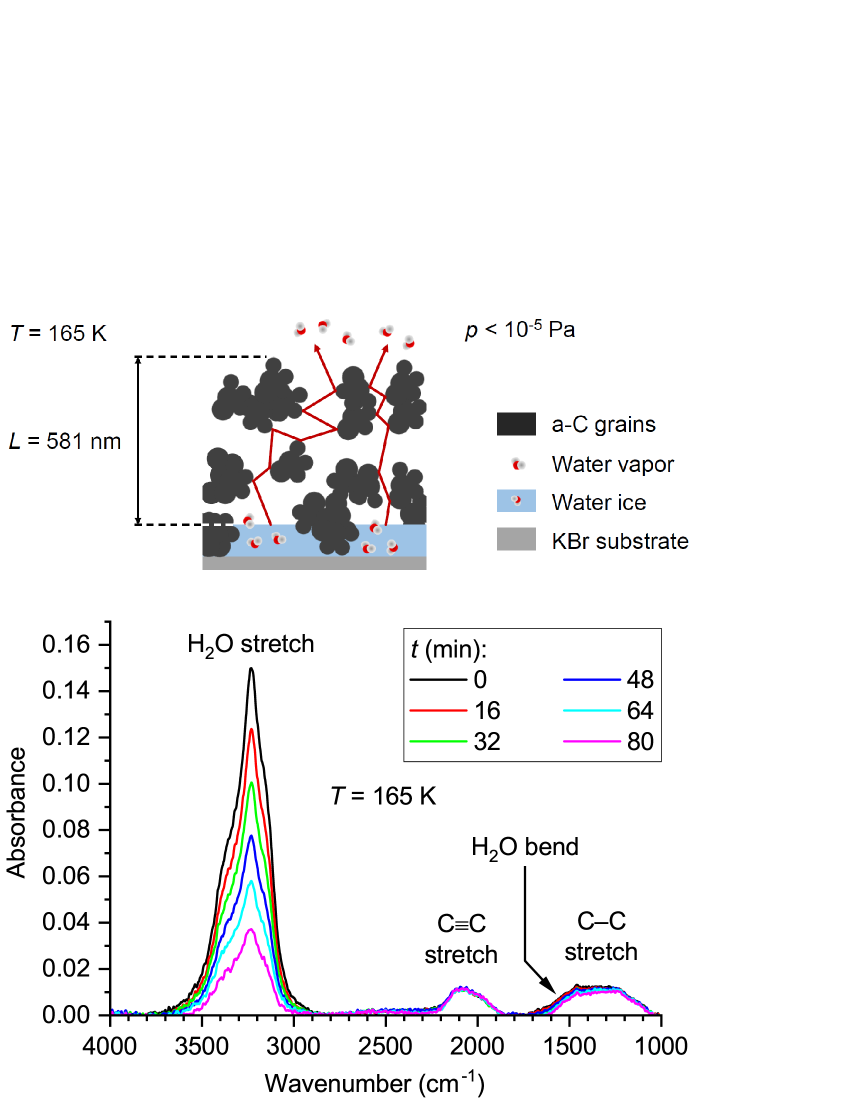
We conducted experiments on the desorption and diffusion of H2O molecules as follows. (i) We first deposited a-C grains and H2O molecules at the same time on a KBr substrate kept at 150 K. Thus, a composite layer of grains and ice covered the substrate. The a-C material amounted to an value of 3 to 6 nm depending on the experiment. At 150 K, H2O molecules formed ice in the hexagonal crystalline polymorph form (Jenniskens et al., 1998). Figure 2 shows a spectrum to which the composite layer contributes and the profile of the 3 m absorption band confirms the phase state of water. We measured the area of the band and, taking into account a strength (or absorption length) of 2.7 10-16 cm (Mastrapa et al., 2009), we derived the column density of the deposited H2O molecules. Depending on the experiment, it was equivalent to a number of monolayers in the 70–200 range, hence, to a thickness of 22 to 64 nm, considering a molecular monolayer density of 1015 cm-2 and a specific mass of 0.931 g cm-3 (Kuhs et al., 1987; Mastrapa et al., 2009). Assuming the composite layer did not comprise empty volumes, its compounded thickness was thus in the 25–70 nm range. (ii) On top of the composite layer, still at 150 K, we deposited a-C grains until we obtained a layer of the desired thickness , typically in the 60–1900 nm range, about 2 to 30 times thicker than the composite layer. Thus, the procedure produced a composite layer of aggregated a-C grains and water ice covered with a thicker, ice-free, mesoporous layer of similar a-C grains (see sketch in Fig. 2). (iii) We then heated the substrate at a rate of 10 K min-1 and stabilized the temperature at either 160, 165, or 170 K in separate experiments. These temperatures being higher than the desorption temperature of H2O molecules from water ice (Fraser et al., 2001; Bolina et al., 2005), they enabled the desorption and diffusion of the molecules. After the substrate temperature and the chamber pressure stabilized, we measured the area of the H2O(s) 3 m band as a function of time. The area decreased, as Fig. 2 shows for a substrate at 165 K and an a-C grain layer of thickness = 581 nm.
3 Results
3.1 Isothermal experiments and diffusion coefficients
We carried out the isothermal experiments at three temperatures, specifically 160, 165, and 170 K, for several thicknesses, of the top, ice-free layer of a-C grains. Figure 3 summarizes the results. The top panels display the time evolution of during the experiments. For clarity, we normalize each series of column densities to the value measured at time = 0. The curves show that the column density decreased at a constant rate during every experiment and that the rate depended on the temperature and on . We do not observe any variation of the shape of the 3 m band during the experiments, an indication that condensed water was present at all times only as crystalline ice. This allowed us to take into account a constant band strength (Sect. 2.2) to derive at all times of every experiment. In most of them, we measured spectra until the ice completely disappeared.
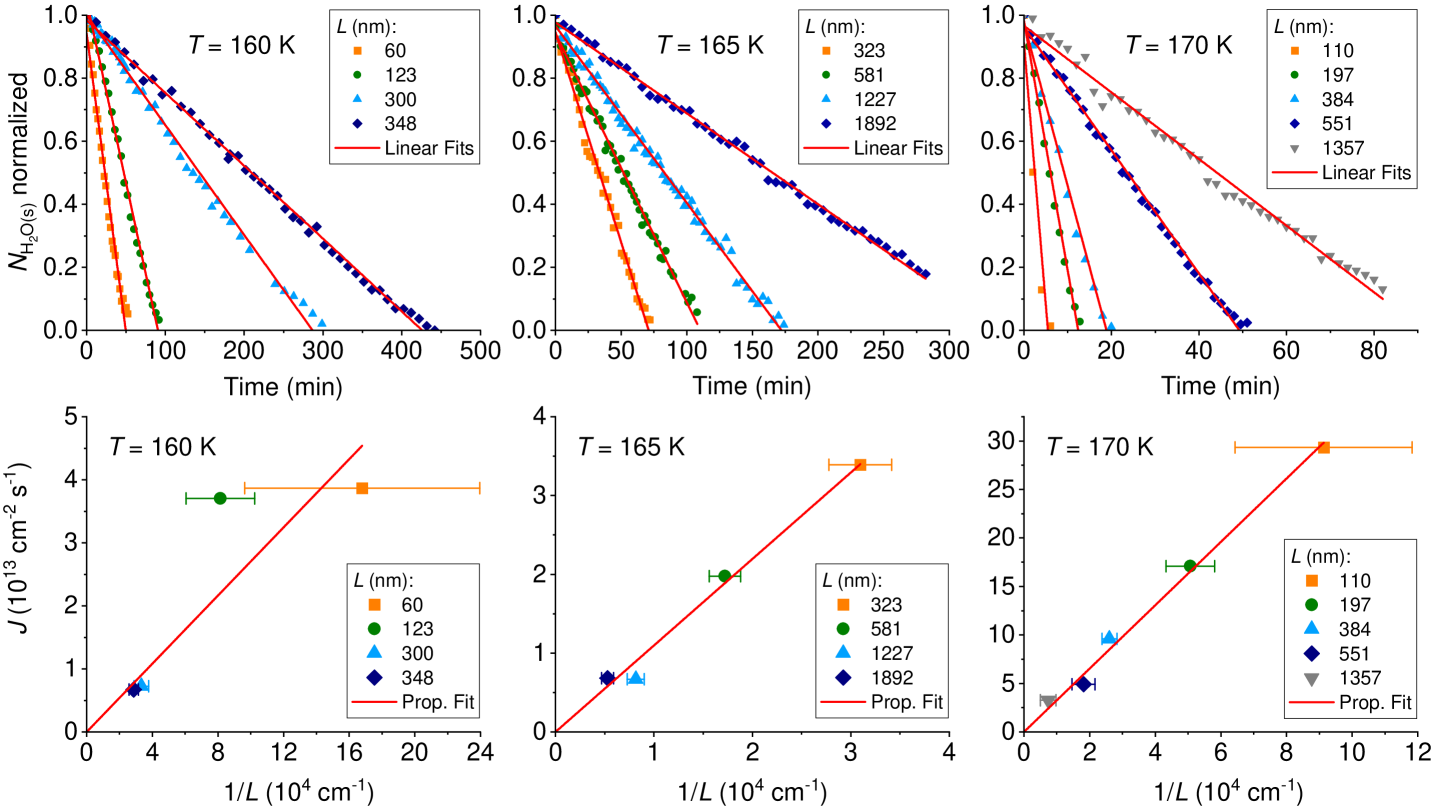
The decrease of probes the amount of H2O molecules desorbing from the ice of the composite layer, that is, from ice located at the bottom of a porous layer of a-C grains. The desorbed molecules left the porous layer because of the surrounding constant vacuum and, given that the lateral dimensions of the layer were three orders of magnitude greater than , we can define the molecular flux through the layer with:
| (2) |
where is not time dependent since the curves in the top panels of Fig. 3 show that varied linearly with time in every experiment.
The bottom panels of Fig. 3 show the values of as a function of and reveal their proportionality. According to Fick’s first law of diffusion (for a review on diffusion processes in mesoporous materials, see Bukowski et al., 2021), the relation between and the molecular concentration through the porous layer is
| (3) |
where is the diffusivity or diffusion coefficient of the water molecules at temperature, , and is the position or height measured from the surface of the ice, that is, the sublimation front, the location of which we considered constant owing to the lack of information on its geometry as a function of time. The assumption was otherwise a reasonable approximation in the experiments with a composite layer that was very thin compared to the ice-free a-C layer. We postulate that the concentration at the bottom of the a-C grain layer corresponded to the vapor pressure of H2O(g) above H2O(s) at the temperature, and take the value from Mauersberger & Krankowsky (2003). The concentration at the top of the layer was negligible compared to since the pressure in the chamber was lower than 10-5 Pa. If we now assume that the concentration gradient of H2O molecules decreased linearly from the bottom to the top of the a-C grain layer, we obtain a proportionality relation between and , namely:
| (4) |
which is consistent with what we observed in the experiments (Fig. 3). Consequently, fitting proportionality functions to the data reported in the bottom panels of Fig. 3 gives us , with already known. Table 1 presents the diffusion coefficients thus obtained, the uncertainties being determined in the fitting procedure.
| (K) | (Pa) | (10-2 cm2 s-1) | |
|---|---|---|---|
| 160 | 6 | 1.04 0.15 | 1.03–2.60 |
| 165 | 2 | 1.14 0.10 | 0.94–2.37 |
| 170 | 8 | 0.97 0.05 | 1.13–2.85 |
3.2 Diffusion process and characterization of the mesoporous a-C dust
Bukowski et al. (2021) discussed diffusion mechanisms in mesoporous materials in detail. In brief, surface diffusion, Knudsen diffusion, and molecular diffusion can occur. Molecular diffusion proceeds through collisions between molecules. Under our experimental conditions, H2O(g) was the only substance that needed to be taken into account. As its pressure was very low ( 10-3 Pa), the mean free path of the molecules was much greater than the dimensions of the pores (Knudsen number 1) and molecular diffusion could not occur. The question is which of the surface diffusion and Knudsen diffusion dominated. Surface diffusion is an activated process for which the diffusivity follows an Arrhenius-type law, that is, , where is the activation energy and is the Boltzmann constant. Knudsen diffusion is an effect of the molecules colliding with the walls of the porous material and the dependence of the Knudsen diffusivity on temperature is such that . Therefore, if one mechanism dominated the other in the experiments, the diffusion coefficients varied following the relevant temperature dependence. However, the uncertainty that affects the values that we derived for temperatures in the 160–170 K range does not allow us to reject one of the mechanisms. Nevertheless, we argue that (i) the apolar nature of the a-C material results in weak interactions of the H2O molecules with its surface; (ii) then, if surface diffusion occurred, the bands of H2O molecules adsorbed at favorable binding sites would be displayed in the spectra at the end of the isothermal experiments, after a total depletion of the ice, however, this is not the case; and (iii) the modeling of the diffusion with a Knudsen regime gave reasonable results (see below). Thus, we find that Knudsen diffusion dominated the transport of H2O molecules in the experiments.
In order to characterize the structure of the present a-C grain layers, we assimilate them to assemblies of monodisperse spheres as those formed by random ballistic deposition. Following Asaeda et al. (1974), in a medium of porosity that consists of packed spheres with an average diameter , the Knudsen diffusivity, , is such that:
| (5) |
where is the universal gas constant, is the molar mass of the diffusing gas, is a correction factor for the geometry of the packing, similar in role to the tortuosity factor of tubular pores, and is a constant equal to 2.18 (or 13/6 in Derjaguin 1946 and Güttler et al. 2023; we note that Mekler et al. 1990 modeled the material of cometary nuclei with randomly packed spheres to study ice sublimation in these objects). In this study, we observed that ranged from 1 to 8 nm and estimated that was 0.80–0.90 (Sect. 2.1). Setting to 5 nm and having measured the Knudsen diffusivity of water molecules as , we obtained the missing descriptor using Eq. (5). Table 1 presents the values obtained for and they verify the condition:
| (6) |
which Asaeda et al. (1974) used to write Eq. (5). We note that the values, which range from 0.94 to 2.85, encompass the value of 1.41 determined by Asaeda et al. (1974) with packed beds of glass spheres and those derived by Güttler et al. (2023) with similar media. Since we observed diffusion in Knudsen regime, we evaluated an effective description of the a-C layer with a medium featuring tubular pores in Appendix C.
4 Discussion and conclusion
The gas-phase condensation that we exploited to synthesize a-C nanoparticles is comparable to the formation mechanism of grains in late-type stars (Jäger et al., 2008). The deposited mesoporous layers of aggregated particles are analogues of interstellar a-C dust, hence, of the carbon component of prestellar, protostellar, and protoplanetary dusts. The a-C material is also relevant to cometary studies as it shows similarities with dust particles in the ejecta of comets. For example, spectral observations of the ejecta of comet 9P/Tempel 1 revealed the presence of a-C matter (Lisse et al., 2006). In terms of morphology, the Rosetta mission collected fluffy dust with porosity up to 0.85 (Levasseur-Regourd et al., 2018, and references therein).
Past experimental studies have focused on the spectral properties of the synthesized a-C materials (Jäger et al., 2008, 2009) and molecular diffusion through them lacked characterization. At 150 K in vacuum, we produced mesoporous layers of aggregated synthetic a-C nanoparticles on top of a mixture of the same particles and crystalline water ice. The average particle size was 5 nm and the porosity 0.80 to 0.90. Stabilizing the temperature of the system in the 160–170 K range, we observed the disappearance of the ice as a function of time with IR spectroscopy and concluded that the ice sublimated and the system outgassed. The analysis of the spectra revealed the kinetic of the phenomenon and we derived molecular fluxes at three temperatures for several thicknesses of the top layer of a-C grains. With indications that Knudsen diffusion occurred, we used Fick’s first law of diffusion to determine diffusion coefficients for H2O molecules in the mesoporous a-C layer, which are found in the order of 10-2 cm2 s-1. At 160 to 170 K and for mesoporous a-C layers 60 to 1900 nm thick, the outgassing ranged from 5 1012–3 1014 cm-2 s-1 in terms of molecular flux. We could further characterize the mesoporous a-C layers with a geometry correction factor between 0.94 and 2.85.
The immediate implication of our experiments is that a dust grain that is a ballistic aggregate of a-C nanoparticles that has accumulated water ice would rapidly lose its entire H2O(s) content when crossing the water ice line in an accretion disk. Actual interstellar carbonaceous grains would be partially hydrogenated, possibly functionalized and the diffusion of H2O molecules in the pores of these active-carbon grains may show significant differences compared to the pure a-C grains studied here. Concerning silicates, their surface strongly interacts with water molecules and features silanol groups (\chSi\bondsbOH) and adsorbed molecules that only high temperatures can remove. Consequently, we expect this interaction to play a role in the transport of H2O molecules through the pores of silicate dust. Our experimental method will allow us to study these cases and also to obtain data on other relevant volatiles.
Acknowledgements.
This work received the support of the Deutsche Forschungsgemeinschaft (DFG) through project No. 504825294 ”From atoms to prebiotic molecules on the surface of cosmic dust grains”. The authors are grateful to C. Güttler for comments that enabled them to improve the manuscript.References
- Asaeda et al. (1974) Asaeda, M., Yoneda, S., & Toei, R. 1974, J. Chem. Eng. Jpn., 7, 93
- Bolina et al. (2005) Bolina, A. S., Wolff, A. J., & Brown, W. A. 2005, JPCB, 109, 16836
- Boogert et al. (2015) Boogert, A. C. A., Gerakines, P. A., & Whittet, D. C. B. 2015, ARA&A, 53, 541
- Bukowski et al. (2021) Bukowski, B. C., Keil, F. J., Ravikovitch, P. I., et al. 2021, Adsorption, 27, 683
- Demyk (2011) Demyk, K. 2011, EPJ Web of Conferences, 18, 03001
- Derjaguin (1946) Derjaguin, B. 1946, CR Acad. Sci. URSS, 53, 623
- Fraser et al. (2001) Fraser, H. J., Collings, M. P., McCoustra, M. R. S., & Williams, D. A. 2001, MNRAS, 327, 1165
- Gundlach et al. (2011) Gundlach, B., Skorov, Y., & Blum, J. 2011, Icar, 213, 710
- Güttler et al. (2023) Güttler, C., Rose, M., Sierks, H., et al. 2023, MNRAS, 524, 6114
- Jäger et al. (2009) Jäger, C., Huisken, F., Mutschke, H., Llamas Jansa, I., & Henning, T. 2009, ApJ, 696, 706
- Jäger et al. (2008) Jäger, C., Mutschke, H., Henning, T., & Huisken, F. 2008, ApJ, 689, 249
- Jenniskens et al. (1998) Jenniskens, P., Blake, D. F., & Kouchi, A. 1998, in Solar System Ices, ed. B. Schmitt, C. de Bergh, & M. Festou (Norwell, MA: Kluwer), 139–155
- Kelley et al. (2023) Kelley, M. S. P., Hsieh, H. H., Bodewits, D., et al. 2023, Natur, 619, 720
- Kuhs et al. (1987) Kuhs, W. F., Bliss, D. V., & Finney, J. L. 1987, JPhyC, 48, 631
- Laddha et al. (2023) Laddha, S., Macher, W., Kargl, G., et al. 2023, MeScT, 34, 045012
- Lecacheux et al. (2003) Lecacheux, A., Biver, N., Crovisier, J., et al. 2003, A&A, 402, L55
- Levasseur-Regourd et al. (2018) Levasseur-Regourd, A.-C., Agarwal, J., Cottin, H., et al. 2018, SSRv, 214, 64
- Lisse et al. (2022) Lisse, C. M., Combi, M. R., Farnham, T. L., et al. 2022, AcAau, 195, 365
- Lisse et al. (2006) Lisse, C. M., VanCleve, J., Adams, A. C., et al. 2006, Sci, 313, 635
- Mastrapa et al. (2009) Mastrapa, R. M., Sandford, S. A., Roush, T. L., Cruikshank, D. P., & Dalle Ore, C. M. 2009, ApJ, 701, 1347
- Mauersberger & Krankowsky (2003) Mauersberger, K. & Krankowsky, D. 2003, GeoRL, 30, 21
- Mekler et al. (1990) Mekler, Y., Prialnik, D., & Podolak, M. 1990, ApJ, 356, 682
- Sabri et al. (2013) Sabri, T., Gavilan, L., Jäger, C., et al. 2013, ApJ, 780, 180
- Schoonenberg & Ormel (2017) Schoonenberg, D. & Ormel, C. W. 2017, A&A, 602, A21
- Schweighart et al. (2021) Schweighart, M., Macher, W., Kargl, G., Gundlach, B., & Capelo, H. L. 2021, MNRAS, 504, 5513
- Skorov et al. (2011) Skorov, Y. V., van Lieshout, R., Blum, J., & Keller, H. U. 2011, Icar, 212, 867
- Spadaccia et al. (2022) Spadaccia, S., Capelo, H. L., Pommerol, A., et al. 2022, MNRAS, 509, 2825
- Stammler et al. (2017) Stammler, S. M., Birnstiel, T., Panić, O., Dullemond, C. P., & Dominik, C. 2017, A&A, 600, A140
Appendix A Synthesis of a-C nanoparticles and layer production
We synthesized a-C nanoparticles by pulsed laser ablation of a rotating graphite target under a quenching atmosphere that consisted of He gas (Westfalen, 99.999% purity) at 4 Torr pressure. The laser source (Continuum Surelite I-10) emitted light of 532 nm wavelength in pulses of 5 ns duration and 50 mJ energy at a repetition rate of 10 Hz. A lens focused the laser light onto the target giving an energy density of 25 J cm-2 at the target.
Differential pumping through a nozzle and a skimmer (Beam Dynamics, Inc., 1.2 mm orifice) allowed us to extract the grains, form them into a beam and deposit them in a separate vacuum chamber on a 2 mm-thick KBr substrate (Korth Kristalle GmbH) attached to the cold head of a compressed-helium, closed-cycle cryocooler (Advanced Research Systems, Inc. ARS-4H and DE-204SL). A quartz crystal microbalance (QCM) received a portion of the grains during production of a layer. It allowed us to measure the amount of deposited material and to determine the thickness of the layer, where did not take porosity into account.
Appendix B Evaluation of
We used a quartz crystal microbalance (QCM) to prepare the carbon grain layers for the diffusion experiments at 165 K temperature. In order to determine for the carbon grain layers produced for the experiments at 160 and 170 K, we compared their IR spectra with those of the layers characterized with the QCM. In each experiment, the initial IR spectrum of the first layer, composite of carbon grains and water ice, served as the reference or baseline for the spectroscopy of the second layer. Practically, we measured the areas of the absorption bands caused by the amorphous carbon material, between 900 and 1800 cm-1 and between 1800 and 2300 cm-1 for the \chCC and \chCC stretching vibrations, respectively. Then, taking the data of the diffusion experiments conducted at 165 K, we fitted for both types of bands a coefficient that related the areas of these bands to the corresponding values measured with the QCM. Finally, we applied the coefficients thus derived to the areas of the bands that arose in the IR spectra of the carbon grain layers deposited for the experiments at 160 and 170 K. The difference between the results that the two types of bands gave indicates an uncertainty between 9% and 43% on .
Appendix C Effective modeling with tubular pores
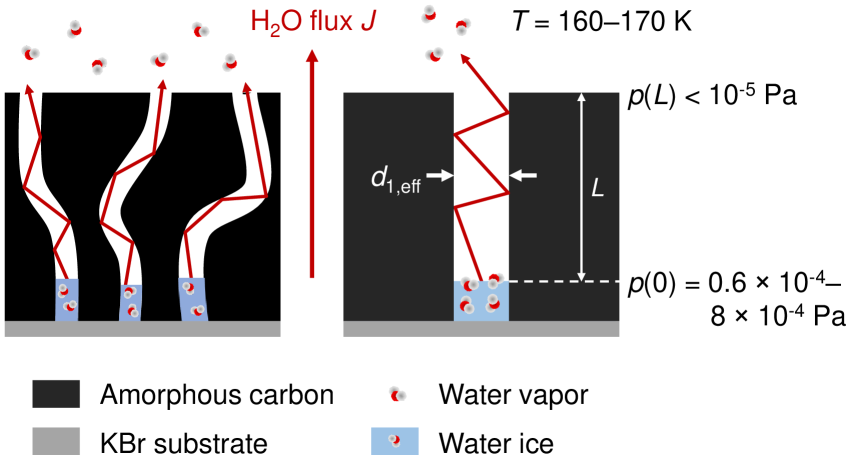
The flows measured in this study being consistent with a Knudsen regime, we can model the a-C grain layers with an effective solid medium of porosity , the pores being tubes with an average diameter of (left side of Fig. 4). We remark that Mekler et al. (1990) also compared the two approaches in a study of ice sublimation in a cometary nucleus. Knudsen diffusion predicts that the diffusivity of a gas in this medium is given by:
| (7) |
where is a tortuosity factor that contains information on the geometry of the pores (Bukowski et al. 2021). Specifically, compares the average path length of the pores, , with the thickness of the medium, , following:
| (8) |
Given that and were 10–20 nm and 0.80–0.90, respectively (Sect. 2.1), entering the measured values (as ) into Eq. (7) gave at 1.0–2.8. The lower value of cannot be smaller than 1 according to Eq. (8). We remark that the values obtained for with the sphere assembly model and are similar, suggesting that the model of tubular pores is actually effective. The comparison of Eq. (5) with Eq. (7) shows that the correction factor plays for assemblies of monodisperse spherical particles the role that the tortuosity factor plays for media with tubular pores (Güttler et al. 2023).
Now considering a simpler model to describe the a-C grain layers, that is, a single straight pore of diameter with (right side of Fig. 4), we can write
| (9) |
With measurements of at hand, we derived the effective pore diameter, , using Eq. (9). We obtained values between 6.0 and 8.5 nm, close to the average diameter of the actual pores of 10 to 20 nm. This result strengthens our conclusion that Knudsen diffusion dominated the transport of the H2O molecules in our experiments.