Properties of Voids and Void Galaxies in the TNG300 Simulation
Abstract
We investigate the properties of voids and void galaxies in the TNG300 simulation. Using a luminous galaxy catalog and a spherical void finding algorithm, we identify 5,078 voids at redshift . The voids cover 83% of the simulation volume and have a median radius of . We identify two populations of field galaxies based on whether the galaxies reside within a void (“void galaxies”; 75,220 objects) or outside a void (“non-void galaxies”; 527,454 objects). Within the voids, mass does not directly trace light. Instead, the mean radial underdensity profile as defined by the locations of void galaxies is systematically lower than the mean radial underdensity profile as defined by the dark matter (i.e., the voids are more “devoid” of galaxies than they are of mass). Within the voids, the integrated underdensity profiles of the dark matter and the galaxies are independent of the local background density (i.e., voids-in-voids vs. voids-in-clouds). Beyond the void radii, however, the integrated underdensity profiles of both the dark matter and the galaxies exhibit strong dependencies on the local background density. Compared to non-void galaxies, void galaxies are on average younger, less massive, bluer in color, less metal enriched, and have smaller radii. In addition, the specific star formation rates of void galaxies are % higher than non-void galaxies and, in the case of galaxies with central supermassive black holes with , the fraction of active void galaxies is % higher than active non-void galaxies.
1 Introduction
The large-scale structure of the Universe is an interconnected network of walls, sheets, filaments, and galaxy clusters, between which lie vast regions of near nothingness known as cosmic voids (see, e.g., Giovanelli & Haynes 1991). The origin of the “cosmic web” dates back to the early Universe during the epoch of inflation, when quantum fluctuations near the end of the inflationary period gave rise to slight anisotropies in the post-inflation matter density field. These anisotropies are observed in the cosmic microwave background (CMB), with regions that deviate by a few micro-Kelvin from the average CMB temperature (see, e.g., Planck Collaboration et al. 2020), and they are responsible for the structure that is seen in the cosmic web today.
Perturbations in the density field are unstable. Regions that are overdense experience an inward gravitational force, causing them to increase in density as they collapse and accrete surrounding matter (Bertschinger, 1998). The opposite is true for regions that are initially underdense. Matter in these regions experiences an outward gravitational force that attracts it towards nearby, higher density regions. As matter streams out, these regions become more underdense, increasing the relative outward gravitational pull and causing them to expand even further. Since these expanding regions never become virialized, their growth can always be modelled by linear perturbation theory (see, e.g., Goldberg & Vogeley 2004). Primordial overdensities in the post-inflation matter density field evolved in a bottom-up, hierarchical fashion consistent with Cold Dark Matter (CDM) theory (see, e.g., Liddle & Lyth 1993), forming halos, clusters, walls, and filaments. Conversely, primordial underdensities expanded, becoming the voids.
Voids have properties that make them interesting regions for performing various cosmological tests (Sheth & van de Weygaert, 2004), and the interiors of mature voids can be described as low density Friedmann-Lemaître-Robertson-Walker universes (see, e.g., Icke 1984; van de Weygaert & van Kampen 1993). This makes voids excellent laboratories for tests of the expansion rate and geometry of the Universe, the dark energy equation of state, and modified theories of gravity (see, e.g., Li et al. 2012; Clampitt et al. 2013; Gibbons et al. 2014; Cai et al. 2015; Pollina et al. 2016; Cai et al. 2017; Falck et al. 2018; Paillas et al. 2019). Furthermore, since voids are smaller than the mean-free path of neutrinos (Lesgourgues & Pastor, 2006), voids can be used to constrain the sum of neutrino masses via tests that examine the ways in which neutrino properties affect the sizes and distributions of voids (see, e.g., Villaescusa-Navarro et al. 2013; Massara et al. 2015; Banerjee & Dalal 2016; Kreisch et al. 2019; Schuster et al. 2019; Contarini et al. 2021).
Voids are not completely devoid of internal structure, and even the most mature voids in the local Universe show substructure in the form of galaxies and diffuse filaments (Szomoru et al., 1996; El-Ad & Piran, 1997; Hoyle & Vogeley, 2004; Sheth & van de Weygaert, 2004; Kreckel et al., 2012; Alpaslan et al., 2014). The dynamical structure within voids can have significant impact on cosmic flow patterns in the local Universe, with matter around the ridges of voids affecting the peculiar motions of galaxies around nearby walls and filaments (see, e.g., Bothun et al. 1992; van de Weygaert 2016; Vallés-Pérez et al. 2021; Bermejo et al. 2022).
Additionally, the fact that voids resemble low-density universes with large Hubble parameters (see, e.g., Icke 1984; Goldberg & Vogeley 2004) makes void galaxies interesting objects with which to test models of galaxy formation and evolution. From linear theory, it is known that dark matter halos in underdense regions of the Universe form later in the history of the Universe than do their counterparts in overdense regions (Liddle & Lyth, 1993). Therefore, studying the physical properties of void galaxies in the local Universe has the potential to provide insight into an early epoch of galaxy evolution.
Furthermore, the degree to which the location of a galaxy within the cosmic web affects the evolution of the galaxy is an open question. Some studies have concluded that, due to their differing dynamical histories, void galaxies differ systematically from non-void field galaxies (see, e.g., Peebles 2001; Croton et al. 2005; Kreckel et al. 2012; Rodríguez Medrano et al. 2022; Rosas-Guevara et al. 2022). For example, when compared to observed galaxies in walls and and filaments, some studies have found that void galaxies are, on average, bluer in color, have lower stellar masses, are richer in HI, have higher specific star formation rates, and have later morphological types (see, e.g., Rojas et al. 2004; Croton et al. 2005; Hoyle et al. 2012; Kreckel et al. 2012; Beygu et al. 2016; Douglass et al. 2018; Florez et al. 2021; Pandey et al. 2021; Rodríguez Medrano et al. 2022). However, other studies have found little to no difference between the stellar masses, gas content, star formation rates, chemical abundances, dark matter profiles, or metallicities of void vs. non-void field galaxies (see, e.g., Szomoru et al. 1996; Patiri et al. 2006; Moorman et al. 2014; Liu et al. 2015; Douglass & Vogeley 2017; Douglass et al. 2019; Wegner et al. 2019; Domínguez-Gómez et al. 2022).
Properties of void and non-void galaxies have also been studied in recent magnetohydroynamical simulations of CDM universes. In agreement with some observational studies, Rosas-Guevara et al. (2022) found that, compared to galaxies in denser environments, void galaxies in the EAGLE simulation (Schaye et al., 2015) have lower stellar mass fractions. In addition, Rosas-Guevara et al. (2022) found clear trends of galaxy properties as a function of the distances of galaxies from the nearest void center. In particular, star formation activity and HI gas density decreased with increasing void-centric distance, and stellar mass fraction increased with increasing void-centric distance. Similarly, in a study of galaxies in the HorizonAGN simulation (Dubois et al., 2016), Habouzit et al. (2020) found that low stellar mass galaxies with high star formation rates occur more frequently in the inner regions of voids than in denser regions of the cosmic web.
Another open question involves the degree to which the location of a galaxy within the cosmic web influences the formation of active galactic nuclei (AGN). Some studies have concluded that the AGN fraction of galaxies is independent of the local matter density (e.g., Karhunen et al. 2014; Sabater et al. 2015; Amiri et al. 2019; Habouzit et al. 2020), while others have found a positive correlation with local matter density (e.g., Manzer & De Robertis 2014; Argudo-Fernández et al. 2018). Still other studies have concluded that there is a negative correlation between AGN fraction and the local matter density (e.g., Kauffmann et al. 2004; Constantin et al. 2008; Platen 2009; Lopes et al. 2017; Ceccarelli et al. 2021 Mishra et al. 2021).
The relatively isolated nature of void galaxies suggests that their growth and evolution do not depend strongly on merger-driven nuclear activity. For example, Ceccarelli et al. (2021) found that the growth channels for void galaxies and their central, supermassive black holes differed from those of their non-void counterparts. Ceccarelli et al. (2021) attribute this to the fact that, compared to the supermassive black holes in their non-void galaxies, the supermassive black holes in their void galaxies had larger surrounding OIII reservoirs that fed into the central regions of the galaxies. In contrast, however, Habouzit et al. (2020) found that void galaxies and their supermassive black holes in the Horizon-AGN simulation grow in a manner that is similar to that of galaxies in denser environments, where merger-driven nuclear activity is common. Understanding the discrepancies between these results could further our understanding of the various ways in which nuclear activity is triggered, as well as the effects that cosmic flow patterns and mergers have on AGN.
Here we investigate the properties of voids and void galaxies in the snapshot of the TNG300 simulation (hereafter TNG300; Nelson et al. 2018; Springel et al. 2018; Marinacci et al. 2018; Naiman et al. 2018; Pillepich et al. 2018). TNG300 is a cosmological magnetohydrodynamical (MHD) simulation of a CDM universe with sufficient spatial and mass resolution within a large volume to conduct statistical analyses of voids and void galaxies. Using TNG300, we construct the largest catalog of luminous void galaxies within a cosmological MHD simulation to date. We compare various physical properties (sizes, colors, star formation rates, luminosity functions, mass functions, metallicities, and nuclear activity) of the void galaxies to those of galaxies found in walls and filaments. In addition, we examine the degree to which location within the cosmic web (i.e., within voids and outside voids) affects AGN activity.
The paper is organized as follows. TNG300 and our void finding algorithm are discussed in §2. In §3 we present the properties of the voids and the void galaxies, and we compare the properties of void galaxies to non-void field galaxies. A summary and discussion of our results is presented in §4. Throughout, we compute error bars using 10,000 bootstrap resamplings of the data. Error bars are omitted from figures when the error bars are comparable to or smaller than the sizes of the data points.
2 Methodology
2.1 TNG300
We use the snapshot of the highest-resolution TNG300 simulation to obtain our sample of galaxies and voids. TNG300 is the largest simulation box in the IllustrisTNG suite of simulations (Nelson et al., 2018; Springel et al., 2018; Marinacci et al., 2018; Naiman et al., 2018; Pillepich et al., 2018), encompassing a co-moving volume of . A total of dark matter particles of mass and hydrodynamical gas cells with initial baryonic mass were used. In the snapshot, the gravitational force softening is kpc and the smallest hydrodyamical gas cells are pc in extent. The volume of the simulation is sufficient for the identification of voids with radii as large as Mpc, and the spatial and mass resolution of the simulation is sufficient for the identification of galaxies with stellar masses as small as . The cosmological parameters adopted in the simulation are: , , , , , and (e.g., Planck Collaboration et al. 2016).
To identify luminous galaxies, we use the publicly-available TNG300 subhalo and group catalogs, which list friends-of-friends groups and their substructures. Excluding subhalos that are flagged as being non-cosmological in origin, there are a total of 664,322 luminous galaxies. To assign luminosities to the galaxies, we adopt the subhalo magnitudes from the supplementary catalog created by Nelson et al. (2018). In comparison to the main IllustrisTNG subhalo catalog, the Nelson et al. (2018) catalog better resembles Sloan Digital Sky Survey (SDSS; York et al. 2000) photometry because it includes the effects of dust obscuration on the simulated galaxies.
In addition to the group and subhalo catalogs, we also make use of particle data from the snapshot, including stellar, dark matter, gas, and black hole particles. Following Pillepich et al. (2018), when quoting stellar masses for our TNG300 galaxies, we apply a 40% correction to the stellar masses from the TNG300 catalog (i.e., to account for the fact that the stellar masses in TNG300 are not as well converged as in the benchmark TNG100 simulation; see Appendix A of Pillepich et al. 2018).
2.2 Void Finder
To identify voids, we use the 3D spherical void finder (SVF) from Padilla et al. (2005) as implemented by Paillas et al. (2017) and Paillas et al. (2019).111https://github.com/epaillas/voidfinder/ This is a computationally inexpensive algorithm that identifies regions with significant central underdensities that converge to the average density beyond the ridges of the voids at void radii. The SVF algorithm can be summarized as follows:
-
1.
A rectangular grid is constructed over the galaxy distribution. The number of galaxies within each cell is then counted and any cell that is completely devoid of galaxies (i.e., the cell contains no galaxies) is considered to be a void center.
-
2.
Spheres are expanded outwards from each void center. The largest sphere around a void center with an integrated underdensity contrast has its radius defined to be the radius of the void. The choice of setting the underdensity contrast threshold to comes from linear theory arguments in Blumenthal et al. (1992), who showed that voids at the present epoch should have interior densities that are 20% of the mean density of the Universe at the time of shell-crossing.
-
3.
Any void that neighbors a larger void by more than 20% of the sum of the radii of both voids is rejected. That is, if the distance, , between voids and (where radius ) satisfies , void is rejected from the sample.
-
4.
Remaining voids have their centers perturbed in random directions to determine whether their radii can be increased. If a shifted void center results in a larger sphere that satisfies the underdensity contrast criterion from Step 2, the center and radius of the void are then updated to the values of the larger sphere.
The rectangular grid from Step 1 contains cells that are Mpc on a side. The grid size was chosen as a balance between: [1] computation time, [2] reducing the error associated with the locations of the centers of the smallest voids, and [3] reducing the number of spurious centers (which can arise due to shot noise). That is, if a void center is identified with low resolution, the error associated with the radius of that void will be adversely affected (i.e., since the radius depends on the integrated underdensity contrast threshold in the region surrounding that center). Therefore, a cell size is chosen such that the error it contributes to the radius of the smallest voids in our sample is less than 10% of the total error for that result (see Paillas et al. 2017 for a detailed discussion).
The 3D SVF does not provide the detailed description of void geometry that can be obtained with more sophisticated void finding algorithms (see, e.g., Neyrinck 2008; Platen et al. 2007); however, voids in the local Universe tend to exhibit spherical symmetry (see, e.g., Icke 1984; Sheth & van de Weygaert 2004; Sutter et al. 2014; Hamaus et al. 2016). Moreover, Paillas et al. (2019) compared the results of six void finding techniques in the context of differentiating gravity models and found that similar results were obtained regardless of the choice of void finding algorithm. For our purposes, then, we consider the 3D SVF to be a reasonable choice of algorithm.
2.3 Field Galaxy Sample
Our investigation of galaxy properties focuses on field galaxies (i.e., galaxies that reside outside cluster environments), subdivided according to whether the galaxies reside within a void (“void galaxies”) or outside a void (“non-void” galaxies). We define field galaxies to be all galaxies that are not contained within parent halos with masses , which eliminates cluster galaxies from the sample. We then use the void catalog from §2.2 to separate void galaxies from non-void galaxies. From this, our field galaxy sample consists of 75,220 void galaxies and 527,454 non-void galaxies.
As part of our analysis, we investigate the relative ages of void and non-void galaxies. Even in simulation space, determining the formation time of a galaxy is not simple. This is due to the hierarchical nature of structure formation, which results in many smaller overdensities merging to form a single galaxy. Here we adopt two indicators of galaxy age: [1] the age of the oldest bound stellar particle and [2] the luminosity-weighted age. For both of these age indicators, we use the subhalo cutout provided by the TNG, which contains all particles that are identified by the SUBFIND algorithm as being bound to the halo. Formation times of stellar particles are given as scale factors in the simulation, and we convert these to lookback times using the Planck Collaboration et al. (2016) cosmological parameters and the astropy.cosmology package (Astropy Collaboration et al., 2013, 2018).
The age of the oldest bound stellar particle is a useful indicator of the age of a simulated galaxy, but it is not straightforward to use as a comparison to observed galaxies. In contrast, the luminosity-weighted age is a metric that can be compared to observations (see, e.g., Li et al. 2018). To obtain luminosity-weighted ages of the simulated galaxies we use the following equation from Lu et al. (2020):
| (1) |
where is the logarithm (base 10) of the formation age of the particle and is the SDSS -band luminosity of the particle. Above, the summation is computed over all stellar particles that are bound to the subhalo.
3 Results
3.1 Void Properties
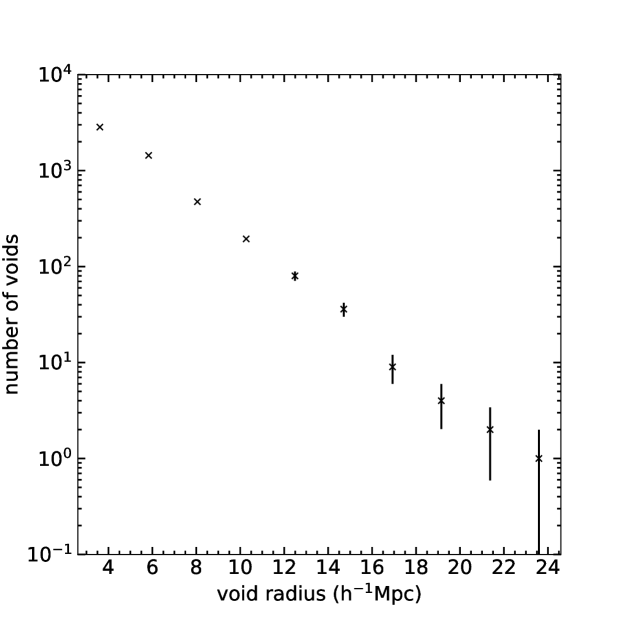
Using the 3D SVF algorithm, a total of 5,078 voids were identified. The void radii span an order of magnitude, with the smallest voids having radii of Mpc and the largest void having a radius of Mpc. The median void radius is Mpc. In total, voids cover a volume of Mpc3, or 82% of the simulation box. The number of voids as a function of radius is shown in Figure 1, from which it is clear that the majority of voids have radii Mpc.
The mean radial number density contrast of the voids is shown in Figure 2. Squares show the result obtained using the luminous galaxies (“luminous density contrast”) and crosses show the result obtained using the dark matter particles (“dark matter density contrast”). For each void, the density contrast in concentric spherical shells of thickness , centered on the void center, was calculated as
| (2) |
where is the number of galaxies or dark matter particles within the radial bin that ranges from to and is the average number density of galaxies or dark matter particles within the simulation box. In both cases (i.e., luminous density contrast and dark matter density contrast), the mean radial density profiles resemble reverse spherical top-hat distributions, which are expected for underdense regions in the local Universe (see, e.g., Icke 1984; Sheth & van de Weygaert 2004). These profiles are characterized by an underdense, flat interior that rises steeply above the mean density at the ridge of a void and slowly decreases to the mean density at large distances from the void center.
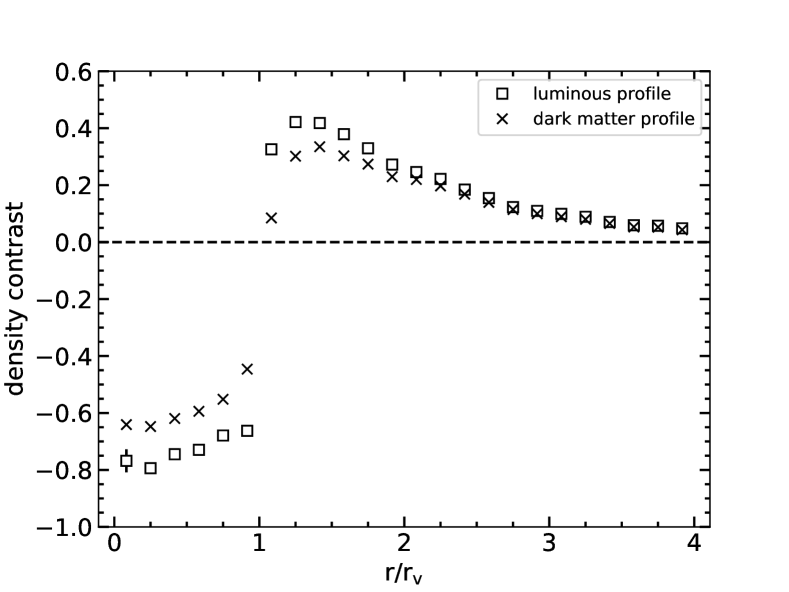
From Figure 2, it is clear that mass does not directly trace light within the voids. Rather, the mean central density contrast obtained from the galaxies ( is somewhat lower than the mean central density contrast of the dark matter (); i.e., the centers of the voids are more “devoid” of galaxies than they are of dark matter. The opposite is true at the ridges of the voids where, on average, there is a higher concentration of galaxies than dark matter, with the mean dark matter density contrast reaching a maximum of at and the mean luminous density contrast reaching a maximum contrast of at .
Voids form in regions of space with differing background densities (i.e., as compared to the average density of the Universe). That is, some voids form in regions of space that have relatively high local background densities (“voids in clouds”) while others form in regions of space that have relatively low local background densities (“voids in voids”); see Sheth & van de Weygaert (2004) for a discussion of void hierarchy. In Figure 3 we use mean integrated number density profiles to explore the effects of the local background density on the density contrast. For legibility of the figure, the number density profiles for the dark matter particles are shown as spline fits. Following Sheth & van de Weygaert (2004), we define voids-in-voids to be those with an integrated galaxy density contrast at and voids-in-clouds to be those with an integrated galaxy density contrast at . To construct the mean integrated density profiles, the number density contrast of the galaxies (points) and the dark matter particles (lines) was computed in concentric spheres of radius , centered on each void center, from which means were then computed.
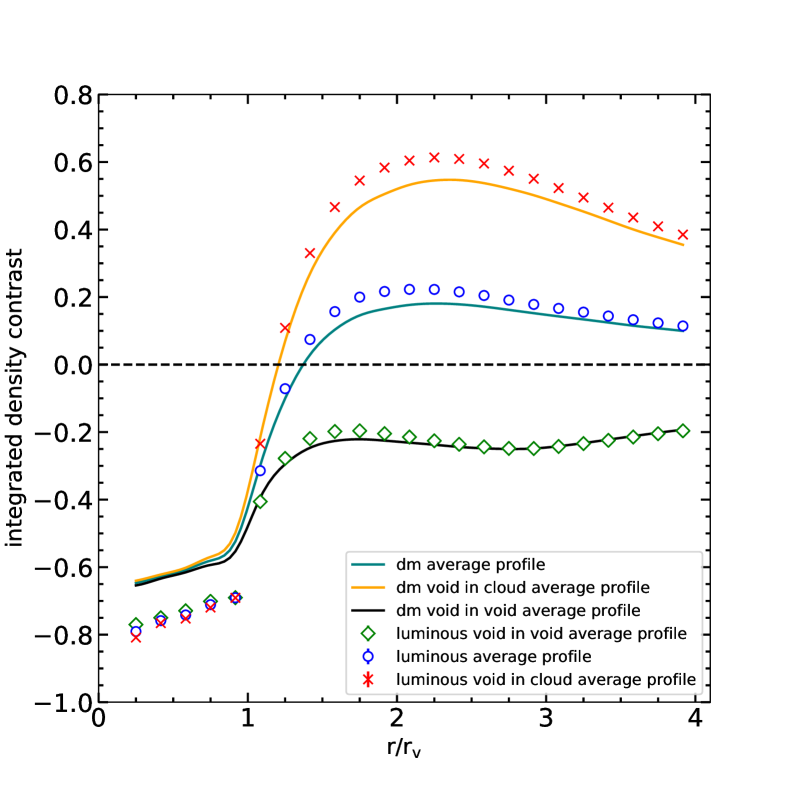
The mean integrated number density profiles obtained using all voids (blue line and blue crosses in Figure 3) show the same trends as the mean differential number density profiles in Figure 2. On average, the central regions of the voids have a dark matter density contrast that is lower than the average dark matter density contrast in the simulation and a galaxy density contrast that is lower than the average galaxy density contrast in the simulation. At the ridges of the voids, the mean interior density contrast for the galaxies reaches a maximum that is higher than the average galaxy density contrast at and the mean interior density contrast for the dark matter reaches a maximum that is higher than the average dark matter density contrast at .
For radii , the local background density in which the voids are located has relatively little effect on the integrated number density profiles of the galaxies and the dark matter. For radii , however, significant differences for the integrated number density profiles of voids-in-voids (black line and green diamonds) and voids-in-clouds (yellow line and red crosses) occur. In the case of voids-in-voids, galaxies largely trace the dark matter for . At the ridges of voids-in-voids, the mean interior density contrast remains less than the average in the simulation (i.e., the mean interior density contrast is at the ridges) and for radii the mean interior density contrast of voids-in-voids remains approximately constant at a value of . In the case of voids-in-clouds, the galaxies trace the dark matter for a small range of radii (), but are more overdense than the dark matter for . At the ridges of voids-in-clouds, the integrated number densities of the galaxies and dark matter exceed the integrated number densities of the galaxies and dark matter in the full void sample by a factor of and they remain significantly higher than than the average density out to distances as large as .
3.2 Properties of Void and Non-void Galaxies
Below we investigate the following properties of void and non-void galaxies: [1] distribution of physical sizes, [2] optical color-magnitude relationships, [3] luminosity and stellar mass functions, [4] ages, [5] stellar and gas chemical abundances, [6] specific star formation rates, and [7] relationships between stellar mass and supermassive black hole mass, as well as AGN fraction.
3.2.1 Physical Sizes
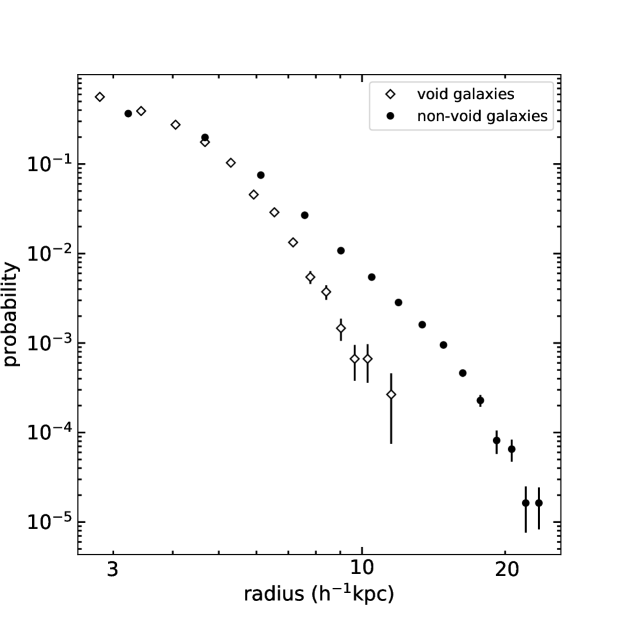
The TNG300 subhalo catalog defines the photometric radii of the galaxies to be the radii at which the surface brightness profiles drop below 20.7 mag arcsec-1 in the -band. We use this definition to compute normalized probability distributions for the radii of void and non-void galaxies, results of which are shown in Figure 4. From this figure, the majority of the galaxies in both populations have radii kpc, and the probability of a given galaxy having a radius kpc is the same for both void and non-void galaxies. For galaxy radii kpc, the distribution of void galaxy radii declines much more steeply than the distribution of non-void galaxy radii. As a result, the largest void galaxies have radii kpc, while the largest non-void galaxies have radii that are times larger than the largest void galaxies.
3.2.2 Optical Color-Magnitude Relationships
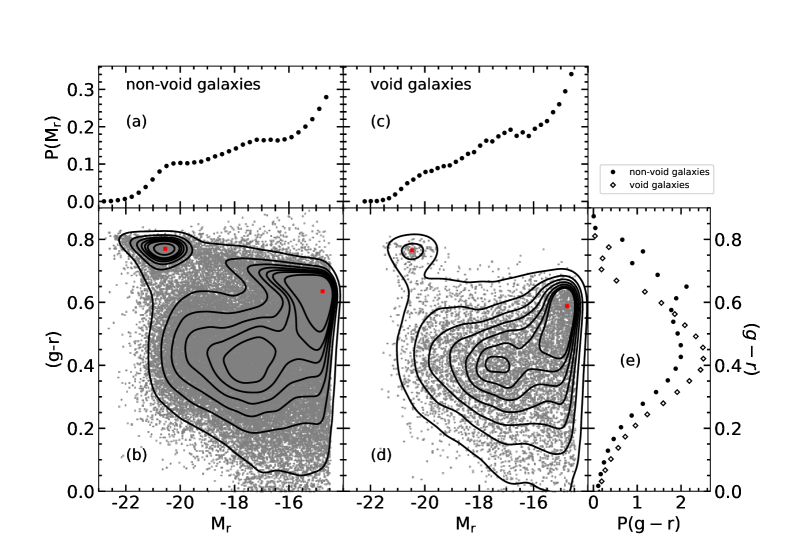
Figure 5 shows the relationship between the optical color and the absolute SDSS -band magnitude, , for non-void galaxies (panel b) and void galaxies (panel d). From these, it is clear that both void and non-void galaxies have distributions that peak in two locations: [1] intrinsically bright, red galaxies and [2] intrinsically faint, blue galaxies. Red crosses in panels (b) and (d) of Figure 5 indicate the locations of the peaks, and show that the peaks occur in similar locations of the vs. space for both void and non-void galaxies. Formally, the blue peak occurs at for the void galaxies and at for the non-void galaxies; i.e., the blue peaks occur at identical absolute magnitudes but slightly different colors, with the void galaxies being somewhat bluer than the non-void galaxies near the blue peaks. The red peak occurs at for the void galaxies and at for the non-void galaxies; i.e., the red peaks occur at essentially identical absolute magnitudes and colors for both populations of galaxies.
Panels (a) and (c) in Figure 5 show normalized probability distributions for the absolute -band magnitudes of the non-void and void galaxies, respectively. From this, it is clear that distributions differ signficantly, and this will be reflected in the luminosity functions of void and non-void galaxies below. Panel (e) in Figure 5 shows normalized probability distributions for the colors of void galaxies (diamonds) and non-void galaxies (circles). From this, it is clear that, while both types of galaxies have a broad distribution of optical colors, the distributions are substantially different and, in particular, there is a much higher concentration of red, non-void galaxies than red void galaxies.
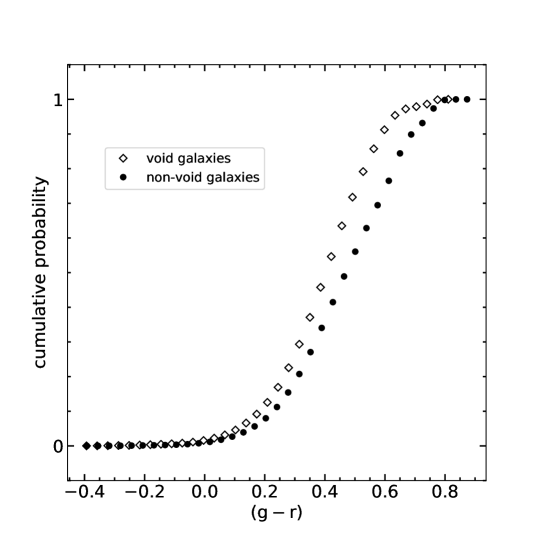
We further explore the differences between the optical color distributions for void and non-void galaxies in Figure 6, which shows the cumulative probability distributions of values for void galaxies (diamonds) and non-void galaxies (circles). A two-sample Kolmogorov-Smirnov (KS) test performed on the two distributions in Figure 6 rejects the null hypothesis that both distributions are drawn from the same underlying distribution at a high confidence level (%), indicating that the distribution of void galaxy colors is significantly different from that of non-void galaxies. In particular, void galaxies are typically bluer than non-void galaxies, with the median color of void galaxies being and the median color of non-void galaxies being .
3.2.3 Luminosity and Stellar Mass Functions
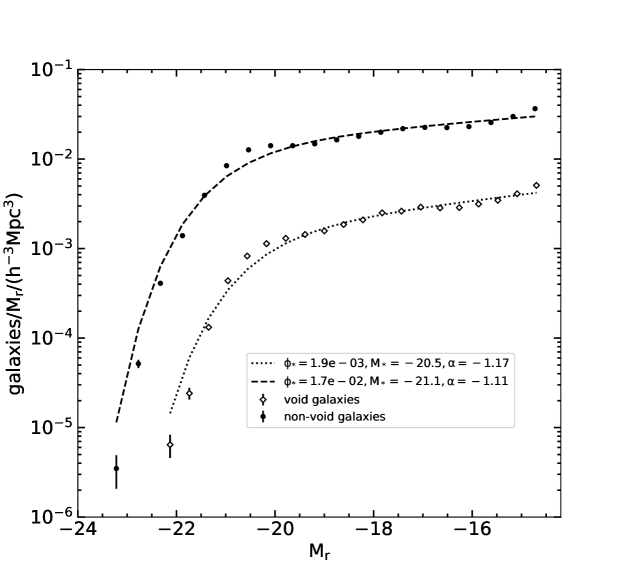
Next we compute luminosity functions and stellar mass functions for void and non-void galaxies. Figure 7 shows the luminosity functions, computed in terms of SDSS -band absolute magnitude (i.e., the number of galaxies per magnitude per unit volume). Lines in Figure 7 show the best-fitting Schechter luminosity functions (Schechter, 1976) of the form:
| (3) |
where is the absolute magnitude of an galaxy.
Overall, the luminosity functions of both void and non-void galaxies are fitted reasonably well by Schechter functions, though some deviation is apparent (particularly at the extreme ends of the luminosity functions). The parameters of the best-fitting Schechter functions are Mpc-3, , (non-void galaxies) and Mpc-3, , (void galaxies). Within the formal errors, the luminosity functions have characteristic bright galaxy absolute magnitudes, , that differ significantly; i.e., non-void galaxies are intrinsically % brighter than void galaxies. However, the faint end slopes of the luminosity functions, , are consistent within .
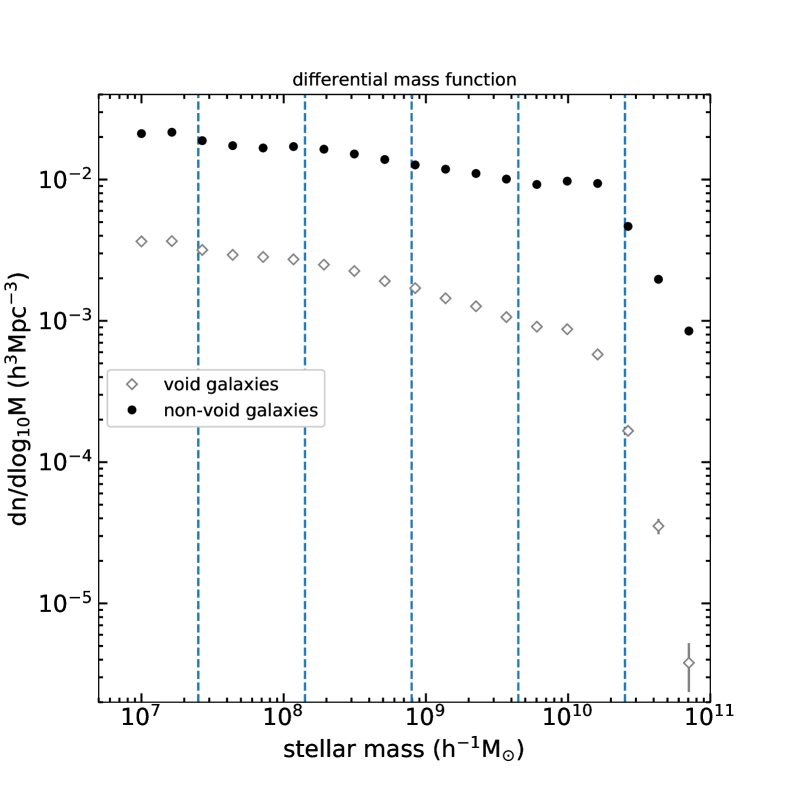
Results for the differential stellar mass functions (i.e., the number of galaxies per log stellar mass bin per unit volume) of void and non-void galaxies are shown in Figure 8. For stellar masses between and , the mass functions exhibit roughly power law behaviors, with the slope of the power law being substantially shallower for non-void galaxies than it is for void galaxies. Below stellar masses of , both mass functions fall below the power law due to the finite resolution of the simulation, which leads to undercounting of the smallest galaxies. Above stellar masses of , both mass functions decrease sharply due to the fact that high mass galaxies are relatively rare objects. From the high mass ends of the mass functions, however, it is clear that the sample of non-void galaxies has a larger fraction of high mass galaxies than does the void galaxy sample. The combined differences in the mass functions result in the median stellar mass for the void galaxies being a factor of smaller than the median stellar mass for the non-void galaxies: vs. .
3.2.4 Ages
Next, we quantify the ages of the void and non-void galaxies using two metrics: [1] the oldest stellar particles within the subhalos and [2] the luminosity weighted ages of the galaxies (see Equation 1). From this, the median age of the oldest stellar particles bound to the subhalos in the void galaxies is 10.1033 0.0001 Gyr and the median age of the oldest stellar particles bound to the subhalos in the non-void galaxies is 10.10685 0.00003 Gyr; i.e., the oldest stellar particles bound to the subhalos in the void galaxies are Myr years younger than the oldest stellar particles in the non-void galaxies. In comparison, the median luminosity weighted age of the void galaxies is 9.217 0.002 Gyr and the median luminosity weighted age of the non-void galaxies is 9.3642 0.0009 Gyr; i.e., when using luminosity weighted ages, we find that the void galaxies are Myr younger than the non-void galaxies. Both age indicators reveal that void galaxies are systematically younger than non-void galaxies, but the age difference between void and non-void galaxies is reflected less by the time at which the first stars formed (i.e., the ages of the oldest stellar particles) than it is by the overall star formation histories of the galaxies (i.e., the luminosity weighted ages). That being said, the difference between the median luminosity-weighted ages of void and non-void galaxies is too small to be detected in modern surveys which report typical dispersions for luminosity-weighted ages of galaxy populations between dex (see, e.g., González Delgado et al. 2014; Scott et al. 2017; Li et al. 2018; Lu et al. 2020).
3.2.5 Stellar and Gas Chemical Abundances
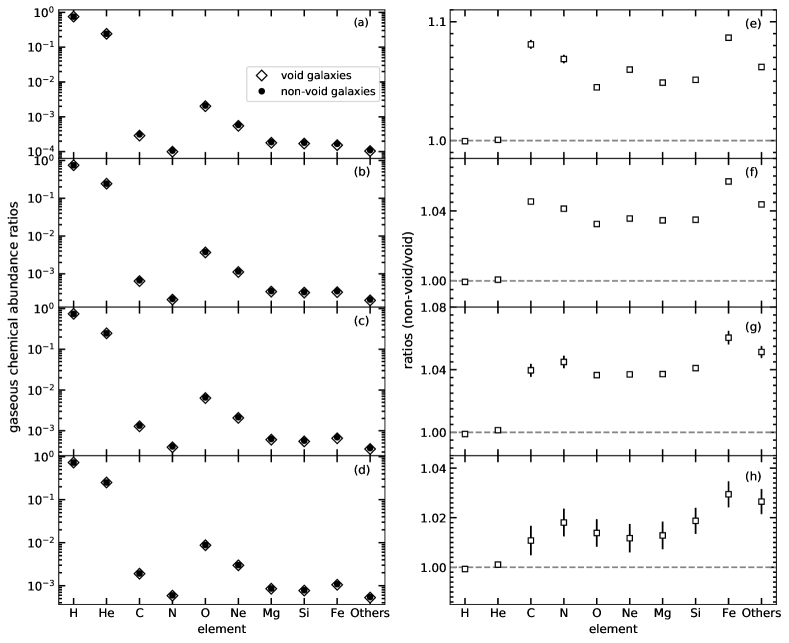
Results for the stellar and gas chemical abundance ratios are shown in Figures 9 and 10, respectively. Here we subdivide the galaxy samples using four distinct stellar mass bins, the boundaries of which are , , , , and . These are indicated by vertical, dashed blue lines in Figure 8. The panels in Figures 9 and 10 are arranged vertically in order of increasing stellar mass, such that panels (a) and (e) include only galaxies in the first bin, panels(b) and (f) include only galaxies in the second bin, panels (c) and (g) include only galaxies in the third bin, and panels (d) and (h) include only galaxies in the fourth bin. The left panels of Figures 9 and 10 show the average stellar and gas chemical abundance ratios, respectively. The right panels of Figures 9 and 10 show the ratios of the corresponding data points for void and non-void galaxies from the left panels.
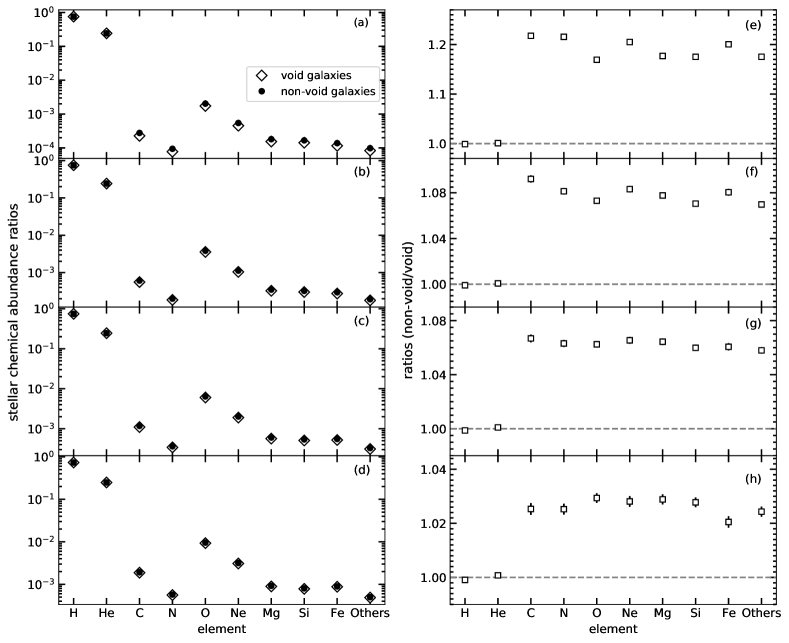
From Figures 9 and 10, void galaxies have stellar and gas metal fractions that are systematically lower than those of non-void galaxies. This result holds true across all stellar mass bins, but the differences are more pronounced for galaxies with lower stellar masses than they are for galaxies with higher stellar masses. That is, in order of increasing stellar mass, the stellar metallicities of non-void galaxies exceed those of void galaxies by % (Figure 9e), % (Figure 9f), % (Figure 9g), and % (Figure 9h). A similar, but less pronounced, trend is shown by the gas metallicities; i.e., in order of increasing stellar mass, the gas metallicities of non-void galaxies exceed those of void galaxies by % (Figure 10e), % (Figure 10f and g), and % (Figure 10h).
3.2.6 Specific Star Formation Rates
Results for the relationships between stellar mass and specific star formation rate (sSFR) are shown in Figure 11b) (non-void galaxies) and Figure 11c) (void galaxies). Here, the specific star formation rates are instantaneous rates, derived from the sum of star formation rates in individual gas cells at . From Figure 11b) and c), it is clear that both void and non-void galaxies show a main sequence of star formation. Normalized 1D probability distributions for and sSSF are also shown Figure 11 (top panels and side panel, respectively). Red crosses at in Figure 11b) and in Figure 11d) indicate the peak densities, which were determined from the relative maxima in the top and side panels.
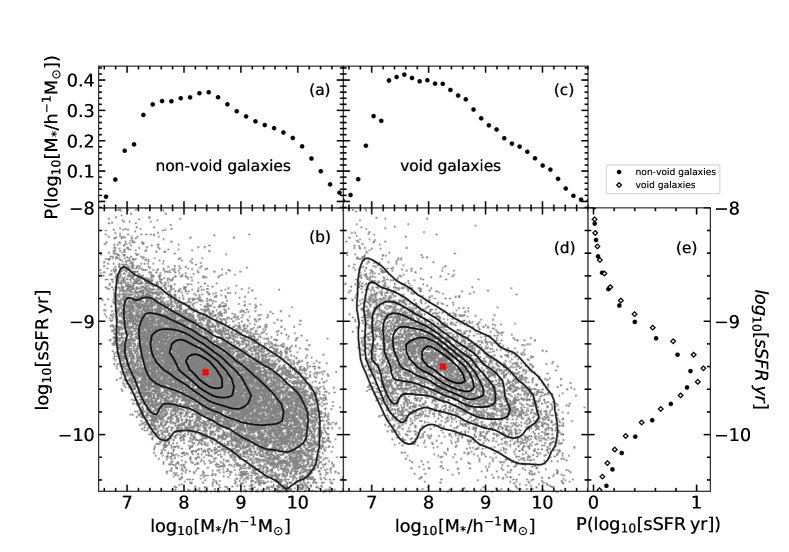
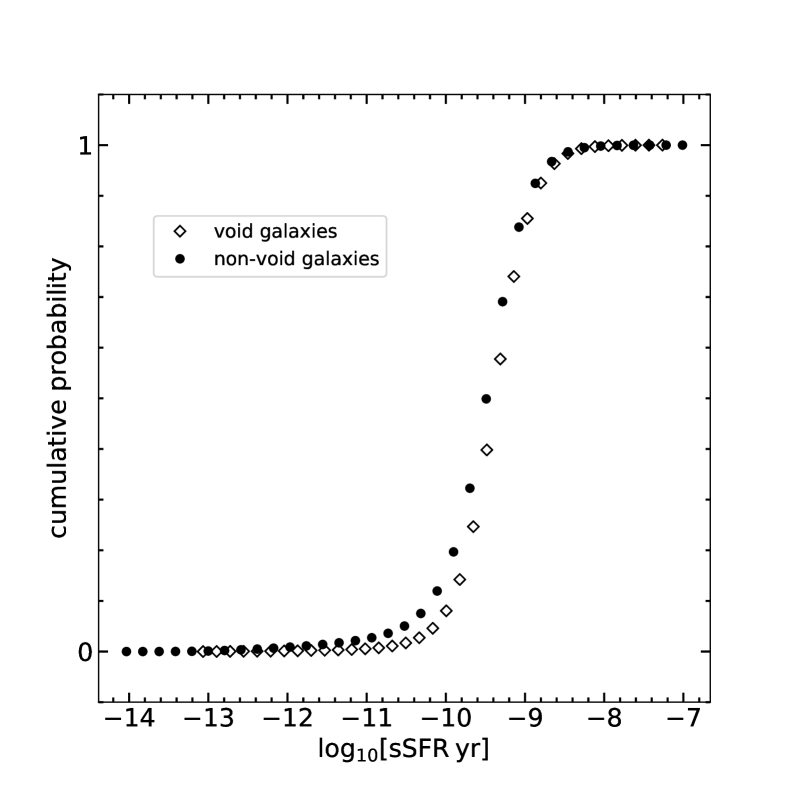
Figure 12 shows the normalized cumulative probability distribution functions for the sSFR of void and non-void galaxies. A two-sample KS test shows that the two distributions are not drawn from the same underlying distribution (confidence level %). The median sSFR for void galaxies is percent higher than it is for non-void galaxies ( vs. ); hence, per unit stellar mass, the void galaxies have star formation rates that are higher than those of the non-void galaxies.
3.2.7 Supermassive Black Holes and AGN Fraction
Finally, we investigate the relationships between stellar mass and supermassive black hole (SMBH) mass for TNG300 void and non-void galaxies, results of which are shown in Figure 13 (black points). SMBHs are “seeded” into TNG subhalos once the subhalos pass a given mass threshold, and this seeding of SBMHs gives rise to unphysical artifacts in the stellar mass–SMBH mass relationship for SMBH with masses below (i.e., due to recently-seeded SMBHs having nearly identical masses, independent of the stellar mass of their host galaxy). Therefore, we focus our analysis below on galaxies for which the masses of the SMBHs are , which results in a sample of 107,527 non-void galaxies and 10,231 void. We further subdivide these particular galaxies according to whether or not their SMBHs are in an active state. To do this, we use the ratio of Bondi accretion rate to Eddington accretion rate as a measure of nuclear activity. Following Weinberger et al. (2017), we classify galaxies with ratios greater than 0.05 as “active”. From this classification, we find 1,330 void galaxies with SMBH masses are in an active state (i.e., AGN fraction of %) and 11,269 non-void galaxies with SMBH masses are an active state (i.e., AGN fraction of %). That is, for TNG300 galaxies with SMBHs in the mass range that we consider, void galaxies have a somewhat higher (%) AGN fraction than do non-void galaxies. We also note that it is primarily intermediate-mass SMBHs that are in an active state, since there are few TNG300 AGNs with SMBH masses or .
The top panels in Figure 13 show the relationships for galaxies with inactive SMBH, while the bottom panels show the relationships for galaxies with active SMBH. Results for non-void galaxies are shown in the left panels of Figure 13 and results for void galaxies are shown in the right panels. The observed relationships between stellar mass and SMBH mass from Reines & Volonteri (2015) are also shown in Figure 13 for comparison (red stars: inactive SMBH; green crosses: active SMBH). Observational results for galaxies with inactive SMBH come from a sample of galaxies with dynamical BH masses (Table 3 of Reines & Volonteri 2015), and observational results for galaxies with active SMBH come from a sample of broadline AGN (Table 1 of Reines & Volonteri 2015).
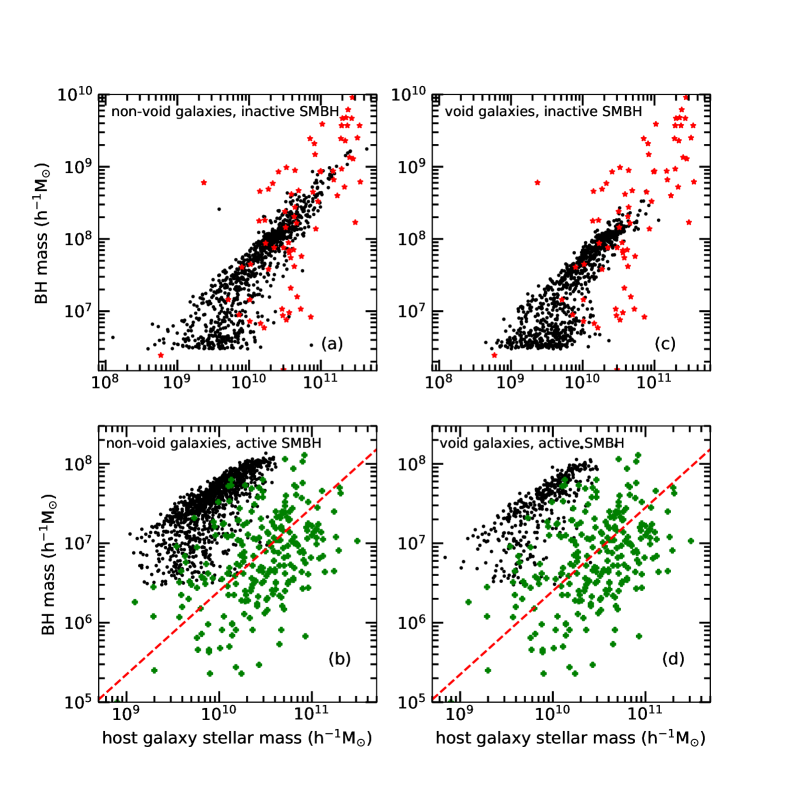
From Figure 13, the relationship between SMBH mass and stellar mass for TNG galaxies with inactive BHs is in rough agreement with the observational results from Reines & Volonteri (2015). For galaxies with inactive BHs that have masses , there is a tighter relationship between SMBH mass and galaxy stellar mass in the TNG300 galaxies than there is for observed galaxies. In contrast to observed galaxies, there are no TNG300 non-void galaxies with inactive black holes with masses and no TNG300 void galaxies with inactive black holes with masses . In the case of non-void galaxies, inactive SMBHs with masses do exist in the TNG300, but all of these objects are located within galaxies that reside in large clusters of galaxies (and all of which were omitted from our sample since the focus of our investigation is the field galaxy population).
Similar to the galaxies with inactive SMBH, TNG300 galaxies with active BHs show a much tighter relationship between stellar mass and SMBH mass than do the observed galaxies from Reines & Volonteri (2015). However, while the slope of the relationship is similar to that of observed galaxies with AGN, the amplitude of the relationship for TNG300 galaxies with AGN is significantly higher than it is for observed galaxies. As a result, at fixed stellar mass, the SMBHs in TNG300 active galaxies are a factor of more massive than would be expected based on the best-fitting relationship from Reines & Volonteri (2015) (i.e., red dashed lines in Figure 13).
4 Summary & Discussion
Here we have investigated the properties of voids and void galaxies in the snapshot of the cosmological MHD simulation TNG300. The large volume and high spatial resolution of the TNG300 makes it possible to study a substantial number of voids and void galaxies.
Voids were identified using a spherical void finding algorithm that was applied to the TNG300 galaxy catalog (i.e., in analogy to observational studies of voids and void galaxies, here the voids were identified via underdensities in the distribution of luminous galaxies, not the distribution of dark matter mass or dark matter halos). From this, a total 5,078 voids with radii that range from Mpc to Mpc were identified. The median radius of the TNG300 voids is Mpc, in good agreement with the typical sizes of voids that have been found in TNG300 (Dávila-Kurbán et al., 2023) and in previous simulations that have computational volumes similar to that of the TNG300 (see, e.g., Paillas et al. 2017; Habouzit et al. 2020).
As expected (see, e.g., Sheth & van de Weygaert 2004), the radial underdensity profiles of the TNG300 voids follow a reverse spherical top-hat profile. This is the case whether luminous tracers of the underdensity (i.e., luminous galaxies) or dark matter particles are used to compute the profiles.
Recently, Schuster et al. (2023) performed an in-depth study of void profiles in the Magneticum222http://www.magneticum.org/ suite of cosmological MHD simulations (see, e.g., Dolag et al. 2016 and Hirschmann et al. 2014 for other studies that have used Magneticum.) The authors find the density profiles of isolated voids to be similar for various void sizes, spatial resolutions, and mass scales. Their stacked, isolated, DM void profiles are similar to ours, although our DM profile (see Figure 2) has a flatter interior out to . However, since we do not investigate void profiles as functions of void shape or size, it is difficult to make direct comparisons. Regardless, the similarities to our galaxy number density profile corroborate their conclusion that the physical properties of voids are universal characteristics that are independent of tracer type and resolution.
Dávila-Kurbán et al. (2023) obtained integrated galaxy number density profiles for “voids-in-clouds” and “voids-in-voids” (“S-type” and “R-type” voids in their notation) in TNG300. To obtain their void catalog, Dávila-Kurbán et al. (2023) used the void finding algorithm of Ruiz et al. (2015), a modified version of the void finding algorithm that we employed, but with a few differences. Dávila-Kurbán et al. (2023) considered candidate void centers as Voronoi cells constructed in the subhalo field that had density contrasts . Dávila-Kurbán et al. (2023) also adopted a stricter integrated underdensity contrast threshold of for their candidate voids. In addition, Dávila-Kurbán et al. (2023) did not allow for any overlap between voids; instead, they rejected all spheres that overlapped already established, larger voids. Because of this, Dávila-Kurbán et al. (2023) identify far fewer voids in TNG300 than we do here (82 voids vs. 5,078 voids), and the radii of their voids are restricted to a much narrow range than the radii of the voids in this work ( Mpc vs. Mpc). Because of the differences in void finding algorithms and size ranges of the resulting voids, we would expect some differences between our results and those of Dávila-Kurbán et al. (2023) and, indeed, this is the case when we compare the two catalogs of “voids-in-clouds”. In particular, the ridges of profiles for “voids-in-clouds” in Dávila-Kurbán et al. (2023) only reach maxima up to , which is considerably lower than the maximum for our median profile (i.e., ). However, the profiles of “voids-in-voids” in Dávila-Kurbán et al. (2023) are similar to the luminous profiles that we find for our “voids-in-voids”.
In the observed Universe, Sánchez et al. (2017) provide 2D photometric galaxy number density profiles for voids in the Dark Energy Survey (DES; Flaugher 2005; Dark Energy Survey Collaboration et al. 2016). These voids were found with a circular void finder, and utilized projected density maps of various thicknesses. Much like our voids, the interiors of DES voids are nearly empty of galaxies. However, the DES voids do not have flat interiors and gradually increase in density out to the ridges of voids. It is unclear whether this is due to projection effects caused by using 2D spectroscopic slices.
Furthermore, several authors have provided void-galaxy cross-correlation functions for large voids in various SDSS, SDSS Baryon Oscillation Spectroscopic Survey (BOSS; Dawson et al. 2013), and SDSS extended BOSS (eBOSS; Alam et al. 2021) Data Releases (see, e.g., Nadathur et al. 2019; Hamaus et al. 2020; Woodfinden et al. 2022). For instance, Nadathur et al. (2019) and Woodfinden et al. (2022) report voids with very empty and flat interiors () out to around Mpc that reach maxima of at . In addition, Hamaus et al. (2020) report values of that rise from in the innermost regions to by and at . Thus, the innermost regions of our TNG300 voids appear to have a higher galaxy density than those in the observed Universe, but their profiles rise more gradually out to the effective radii of voids. Despite this, the ridges of TNG300 voids have a higher overdensity of galaxies not seen in the observed Universe.
In terms of the detectability of our voids, the small size of most of our voids means their average galaxy number density is orders of magnitudes larger than what is available in most current observational surveys. For instance, we report an average galaxy number density of TNG300 voids of , whereas Mao et al. (2017) found an average galaxy number density of in their SDSS BOSS DR12 void member catalogs. Because of this, it is unlikely that the smaller voids we report would be detected in current-generation surveys.
We find that the TNG300 voids are more devoid of galaxies than they are of dark matter, and this result is independent of the local background density within which the voids are embedded (i.e., voids-in-voids vs. voids-in-clouds). That is, within the voids, mass does not trace light. This result agrees with previous studies that have compared luminous tracers within voids to the underlying dark matter field (see, e.g., Ricciardelli et al. 2014; Pollina et al. 2017). In particular, Pollina et al. (2017) used the Magneticum suite to test the linearity of the bias of luminous tracers compared to the underlying dark matter field. There, the authors found a linear relationship between the density contrast of tracers and the density contrast of dark matter within voids when galaxies, clusters, or AGN are used as tracers.
In addition, we note that previous work on the locations of satellite galaxies in the Illustris-1 (Vogelsberger et al., 2014a, b; Genel et al., 2014; Sijacki et al., 2015) and TNG100 simulations have demonstrated that mass does not trace light in host-satellite systems (see, e.g., Brainerd 2018; McDonough & Brainerd 2022). Hence, the distribution of luminous galaxies in a CDM universe is an unreliable tracer of the dark matter distribution in overdense regions of space. However, the linear bias between the galaxy and dark matter distributions in underdense regions still makes galaxies valuable probes of the density field within the linear regime of voids.
In TNG300 we identified a total of 75,220 void galaxies and 527,454 non-void field galaxies, and systematic differences between the void and non-void galaxies are clear. Compared to the non-void galaxies, the void galaxies are, on average, younger, bluer in color, less metal enriched, have lower stellar masses, and have smaller physical extents. The luminosity functions of both void and non-void galaxies exhibit similar faint-end slopes, but the luminosity of an non-void galaxy is % greater than the luminosity of an void galaxy, consistent with void galaxies being smaller and less massive than non-void galaxies on average. In addition, void galaxies have a somewhat higher specific star formation rate than non-void galaxies and, in the case of galaxies with central SMBHs with masses , void galaxies have a somewhat higher AGN fraction than non-void galaxies. These results are in agreement with previous studies that find void galaxies to be bluer, lower in stellar mass, and less metal enriched than non-void galaxies (see, e.g., Rojas et al. 2004; Florez et al. 2021; Rosas-Guevara et al. 2022) and that concluded AGN fraction is not strongly dependent upon the local matter density of a galaxy (see, e.g., Carter et al. 2001; Karhunen et al. 2014; Habouzit et al. 2020).
The relationship between central SMBH mass and host galaxy stellar mass was also investigated. In the case of TNG300 galaxies with inactive SMBHs, the SMBH mass–stellar mass relationships of void and non-void galaxies is in rough agreement with results obtained by Reines & Volonteri (2015) for observed galaxies. However, for galaxies with SMBH masses , the SMBH mass–stellar mass relationship is considerably tighter for TNG300 galaxies than it is for observed galaxies. A relationship between SMBH mass and stellar mass that is tighter for TNG300 galaxies than observed galaxies is also shown by void and non-void TNG300 galaxies with active central black holes. In both cases, the tightness of the relationship for simulated galaxies may simply be reflective of the relative ease with which both parameters can be obtained in simulation space. Lastly, while the slopes of the SMBH mass–stellar mass relationships for active TNG300 void and non-void galaxies agree well with that of observed galaxies, at fixed stellar mass the SMBHs in active TNG300 galaxies are times more massive than would be expected based on the best-fitting relationship from Reines & Volonteri (2015).
The lower host galaxy stellar masses and higher SMBH masses of TNG300 AGN compared to those of Reines & Volonteri (2015) could be caused by several factors. For example, in TNG300, a SMBH of mass is seeded into any friends-of-friends halo whose mass exceeds , which is based on the host-halo relationship of Di Matteo et al. (2008) and Sijacki et al. (2009). This initial mass could be too large, resulting in more massive SMBHs in TNG300 by . This would, however, also affect the relationships in the top panels of Figure 13. Another explanation could involve the AGN feedback models in TNG300, which describe how energy is injected into the galaxies and circumgalactic mediums (CGM). Zinger et al. (2020) find the AGN feedback channel of TNG300 AGN to be both highly “ejective” and “preventative”. This means the AGN state is highly efficient at expelling star-forming gas from the galaxy and increasing the entropy of the CGM, which strongly quenches future star formation within the galaxy. Therefore, if the feedback injection is over-tuned, or if TNG300 galaxies spend too long in their “active” state, this could cause in the host galaxy stellar masses of TNG300 AGN to be lower than those of Reines & Volonteri (2015).
Our results for the systematic differences between void and non-void galaxies in the TNG300 simulation are consistent with the expectation that the two populations of galaxies underwent somewhat different evolutionary paths, with non-void galaxies forming in regions of space that had both higher gas densities and higher galaxy densities than void galaxies. In a universe in which structure forms hierarchically, this naturally leads to non-void galaxies forming earlier than void galaxies (i.e., due to biased galaxy formation in which the highest peaks collapse first) and becoming larger on average than void galaxies (i.e., due to both a larger local reservoir of gas and a higher frequency of galaxy collisions outside the voids). Here we have investigated void and non-void galaxy properties in a single simulation snapshot (corresponding to the present epoch) and, therefore, we cannot make definitive statements about the degree to which the evolutionary paths of the TNG300 void and non-void galaxies differed, and the ways in which those differences affected their physical properties at . Further work, concentrated on the details of the evolution of void and non-void galaxies over cosmic time, will be necessary to establish and quantify differences in the evolutionary paths and the resulting effects on the natures of the two populations of galaxies.
Acknowledgements
We are grateful to the anonymous reviewer for helpful comments and suggestions that improved the manuscript. This work was partially supported by National Science Foundation grant AST-2009397. The IllustrisTNG simulations were undertaken with compute time awarded by the Gauss Centre for Supercomputing (GCS) under GCS Large-Scale Projects GCS-ILLU and GCS-DWAR on the GCS share of the supercomputer Hazel Hen at the High Performance Computing Center Stuttgart (HLRS), as well as on the machines of the Max Planck Computing and Data Facility (MPCDF) in Garching, Germany. In addition, we are pleased to acknowledge that the computational work reported on in this paper was performed on the Shared Computing Cluster which is administered by Boston University’s Research Computing Services.
References
- Alam et al. (2021) Alam, S., Aubert, M., Avila, S., et al. 2021, Phys. Rev. D, 103, 083533, doi: 10.1103/PhysRevD.103.083533
- Alpaslan et al. (2014) Alpaslan, M., Robotham, A. S. G., Obreschkow, D., et al. 2014, MNRAS, 440, L106, doi: 10.1093/mnrasl/slu019
- Amiri et al. (2019) Amiri, A., Tavasoli, S., & De Zotti, G. 2019, ApJ, 874, 140
- Argudo-Fernández et al. (2018) Argudo-Fernández, M., Lacerna, I., & Duarte Puertas, S. 2018, A&A, 620, A113
- Astropy Collaboration et al. (2013) Astropy Collaboration, Robitaille, T. P., Tollerud, E. J., et al. 2013, A&A, 558, A33, doi: 10.1051/0004-6361/201322068
- Astropy Collaboration et al. (2018) Astropy Collaboration, Price-Whelan, A. M., Sipőcz, B. M., et al. 2018, AJ, 156, 123, doi: 10.3847/1538-3881/aabc4f
- Banerjee & Dalal (2016) Banerjee, A., & Dalal, N. 2016, J. Cosmology Astropart. Phys, 2016, 015, doi: 10.1088/1475-7516/2016/11/015
- Bermejo et al. (2022) Bermejo, R., Wilding, G., van de Weygaert, R., et al. 2022, arXiv e-prints, arXiv:2206.14655. https://arxiv.org/abs/2206.14655
- Bertschinger (1998) Bertschinger, E. 1998, ARA&A, 36, 599, doi: 10.1146/annurev.astro.36.1.599
- Beygu et al. (2016) Beygu, B., Kreckel, K., van der Hulst, J. M., et al. 2016, MNRAS, 458, 394, doi: 10.1093/mnras/stw280
- Blumenthal et al. (1992) Blumenthal, G. R., da Costa, L. N., Goldwirth, D. S., Lecar, M., & Piran, T. 1992, ApJ, 388, 234, doi: 10.1086/171147
- Bothun et al. (1992) Bothun, G. D., Geller, M. J., Kurtz, M. J., Huchra, J. P., & Schild, R. E. 1992, ApJ, 395, 347, doi: 10.1086/171657
- Brainerd (2018) Brainerd, T. G. 2018, ApJ, 868, L7, doi: 10.3847/2041-8213/aaedac
- Cai et al. (2017) Cai, Y.-C., Neyrinck, M., Mao, Q., et al. 2017, MNRAS, 466, 3364, doi: 10.1093/mnras/stw3299
- Cai et al. (2015) Cai, Y.-C., Padilla, N., & Li, B. 2015, MNRAS, 451, 1036, doi: 10.1093/mnras/stv777
- Carter et al. (2001) Carter, B. J., Fabricant, D. G., Geller, M. J., Kurtz, M. J., & McLean, B. 2001, ApJ, 559, 606
- Ceccarelli et al. (2021) Ceccarelli, L., Duplancic, F., & Garcia Lambas, D. 2021, arXiv e-prints, arXiv:2111.11488. https://arxiv.org/abs/2111.11488
- Clampitt et al. (2013) Clampitt, J., Cai, Y.-C., & Li, B. 2013, MNRAS, 431, 749, doi: 10.1093/mnras/stt219
- Constantin et al. (2008) Constantin, A., Hoyle, F., & Vogeley, M. S. 2008, ApJ, 673, 715
- Contarini et al. (2021) Contarini, S., Marulli, F., Moscardini, L., et al. 2021, MNRAS, 504, 5021, doi: 10.1093/mnras/stab1112
- Croton et al. (2005) Croton, D. J., Farrar, G. R., Norberg, P., et al. 2005, MNRAS, 356, 1155, doi: 10.1111/j.1365-2966.2004.08546.x
- Dark Energy Survey Collaboration et al. (2016) Dark Energy Survey Collaboration, Abbott, T., Abdalla, F. B., et al. 2016, MNRAS, 460, 1270, doi: 10.1093/mnras/stw641
- Dávila-Kurbán et al. (2023) Dávila-Kurbán, F., Lares, M., & Lambas, D. G. 2023, MNRAS, 518, 3095, doi: 10.1093/mnras/stac3311
- Dawson et al. (2013) Dawson, K. S., Schlegel, D. J., Ahn, C. P., et al. 2013, AJ, 145, 10
- Di Matteo et al. (2008) Di Matteo, T., Colberg, J., Springel, V., Hernquist, L., & Sijacki, D. 2008, ApJ, 676, 33, doi: 10.1086/524921
- Dolag et al. (2016) Dolag, K., Komatsu, E., & Sunyaev, R. 2016, MNRAS, 463, 1797, doi: 10.1093/mnras/stw2035
- Domínguez-Gómez et al. (2022) Domínguez-Gómez, J., Lisenfeld, U., Pérez, I., et al. 2022, A&A, 658, A124, doi: 10.1051/0004-6361/202141888
- Douglass et al. (2019) Douglass, K. A., Smith, J. A., & Demina, R. 2019, ApJ, 886, 153, doi: 10.3847/1538-4357/ab4bce
- Douglass & Vogeley (2017) Douglass, K. A., & Vogeley, M. S. 2017, ApJ, 834, 186, doi: 10.3847/1538-4357/834/2/186
- Douglass et al. (2018) Douglass, K. A., Vogeley, M. S., & Cen, R. 2018, ApJ, 864, 144, doi: 10.3847/1538-4357/aad86e
- Dubois et al. (2016) Dubois, Y., Peirani, S., Pichon, C., et al. 2016, MNRAS, 463, 3948, doi: 10.1093/mnras/stw2265
- El-Ad & Piran (1997) El-Ad, H., & Piran, T. 1997, ApJ, 491, 421
- Falck et al. (2018) Falck, B., Koyama, K., Zhao, G.-B., & Cautun, M. 2018, MNRAS, 475, 3262, doi: 10.1093/mnras/stx3288
- Flaugher (2005) Flaugher, B. 2005, International Journal of Modern Physics A, 20, 3121, doi: 10.1142/S0217751X05025917
- Florez et al. (2021) Florez, J., Berlind, A. A., Kannappan, S. J., et al. 2021, ApJ, 906, 97, doi: 10.3847/1538-4357/abca9f
- Genel et al. (2014) Genel, S., Vogelsberger, M., Springel, V., et al. 2014, MNRAS, 445, 175, doi: 10.1093/mnras/stu1654
- Gibbons et al. (2014) Gibbons, G. W., Werner, M. C., Yoshida, N., & Chon, S. 2014, MNRAS, 438, 1603, doi: 10.1093/mnras/stt2298
- Giovanelli & Haynes (1991) Giovanelli, R., & Haynes, M. P. 1991, ARA&A, 29, 499, doi: 10.1146/annurev.aa.29.090191.002435
- Goldberg & Vogeley (2004) Goldberg, D. M., & Vogeley, M. S. 2004, ApJ, 605, 1, doi: 10.1086/382143
- González Delgado et al. (2014) González Delgado, R. M., Pérez, E., Cid Fernandes, R., et al. 2014, A&A, 562, A47, doi: 10.1051/0004-6361/201322011
- Habouzit et al. (2020) Habouzit, M., Pisani, A., Goulding, A., et al. 2020, MNRAS, 493, 899, doi: 10.1093/mnras/staa219
- Hamaus et al. (2020) Hamaus, N., Pisani, A., Choi, J.-A., et al. 2020, J. Cosmology Astropart. Phys, 2020, 023, doi: 10.1088/1475-7516/2020/12/023
- Hamaus et al. (2016) Hamaus, N., Pisani, A., Sutter, P. M., et al. 2016, Phys. Rev. Lett., 117, 091302, doi: 10.1103/PhysRevLett.117.091302
- Hirschmann et al. (2014) Hirschmann, M., Dolag, K., Saro, A., et al. 2014, MNRAS, 442, 2304, doi: 10.1093/mnras/stu1023
- Hoyle & Vogeley (2004) Hoyle, F., & Vogeley, M. S. 2004, ApJ, 607, 751
- Hoyle et al. (2012) Hoyle, F., Vogeley, M. S., & Pan, D. 2012, MNRAS, 426, 3041, doi: 10.1111/j.1365-2966.2012.21943.x
- Icke (1984) Icke, V. 1984, MNRAS, 206, 1P
- Karhunen et al. (2014) Karhunen, K., Kotilainen, J. K., Falomo, R., & Bettoni, D. 2014, MNRAS, 441, 1802
- Kauffmann et al. (2004) Kauffmann, G., White, S. D. M., Heckman, T. M., et al. 2004, MNRAS, 353, 713
- Kreckel et al. (2012) Kreckel, K., Platen, E., Aragón-Calvo, M. A., et al. 2012, AJ, 144, 16, doi: 10.1088/0004-6256/144/1/16
- Kreisch et al. (2019) Kreisch, C. D., Pisani, A., Carbone, C., et al. 2019, MNRAS, 488, 4413, doi: 10.1093/mnras/stz1944
- Lesgourgues & Pastor (2006) Lesgourgues, J., & Pastor, S. 2006, Phys. Rep., 429, 307, doi: 10.1016/j.physrep.2006.04.001
- Li et al. (2012) Li, B., Zhao, G.-B., & Koyama, K. 2012, MNRAS, 421, 3481, doi: 10.1111/j.1365-2966.2012.20573.x
- Li et al. (2018) Li, H., Mao, S., Cappellari, M., et al. 2018, MNRAS, 476, 1765, doi: 10.1093/mnras/sty334
- Liddle & Lyth (1993) Liddle, A. R., & Lyth, D. H. 1993, Phys. Rep., 231, 1, doi: 10.1016/0370-1573(93)90114-S
- Liu et al. (2015) Liu, C.-X., Pan, D. C., Hao, L., et al. 2015, ApJ, 810, 165, doi: 10.1088/0004-637X/810/2/165
- Lopes et al. (2017) Lopes, P. A. A., Ribeiro, A. L. B., & Rembold, S. B. 2017, MNRAS, 472, 409
- Lu et al. (2020) Lu, S., Cappellari, M., Mao, S., Ge, J., & Li, R. 2020, MNRAS, 495, 4820, doi: 10.1093/mnras/staa1481
- Manzer & De Robertis (2014) Manzer, L. H., & De Robertis, M. M. 2014, ApJ, 788, 140
- Mao et al. (2017) Mao, Q., Berlind, A. A., Scherrer, R. J., et al. 2017, ApJ, 835, 161, doi: 10.3847/1538-4357/835/2/161
- Marinacci et al. (2018) Marinacci, F., Vogelsberger, M., Pakmor, R., et al. 2018, MNRAS, 480, 5113, doi: 10.1093/mnras/sty2206
- Massara et al. (2015) Massara, E., Villaescusa-Navarro, F., Viel, M., & Sutter, P. M. 2015, J. Cosmology Astropart. Phys, 2015, 018, doi: 10.1088/1475-7516/2015/11/018
- McDonough & Brainerd (2022) McDonough, B., & Brainerd, T. G. 2022, ApJ, 933, 161, doi: 10.3847/1538-4357/ac752d
- Mishra et al. (2021) Mishra, H. D., Dai, X., & Guerras, E. 2021, ApJl, 922, L17
- Moorman et al. (2014) Moorman, C. M., Vogeley, M. S., Hoyle, F., et al. 2014, MNRAS, 444, 3559, doi: 10.1093/mnras/stu1674
- Nadathur et al. (2019) Nadathur, S., Carter, P. M., Percival, W. J., Winther, H. A., & Bautista, J. E. 2019, Phys. Rev. D, 100, 023504, doi: 10.1103/PhysRevD.100.023504
- Naiman et al. (2018) Naiman, J. P., Pillepich, A., Springel, V., et al. 2018, MNRAS, 477, 1206, doi: 10.1093/mnras/sty618
- Nelson et al. (2018) Nelson, D., Pillepich, A., Springel, V., et al. 2018, MNRAS, 475, 624, doi: 10.1093/mnras/stx3040
- Neyrinck (2008) Neyrinck, M. C. 2008, MNRAS, 386, 2101
- Padilla et al. (2005) Padilla, N. D., Ceccarelli, L., & Lambas, D. G. 2005, MNRAS, 363, 977
- Paillas et al. (2019) Paillas, E., Cautun, M., Li, B., et al. 2019, MNRAS, 484, 1149, doi: 10.1093/mnras/stz022
- Paillas et al. (2017) Paillas, E., Lagos, C. D. P., Padilla, N., et al. 2017, MNRAS, 470, 4434, doi: 10.1093/mnras/stx1514
- Pandey et al. (2021) Pandey, D., Saha, K., & Pradhan, A. C. 2021, ApJ, 919, 101, doi: 10.3847/1538-4357/ac1078
- Patiri et al. (2006) Patiri, S. G., Prada, F., Holtzman, J., Klypin, A., & Betancort-Rijo, J. 2006, MNRAS, 372, 1710, doi: 10.1111/j.1365-2966.2006.10975.x
- Peebles (2001) Peebles, P. J. E. 2001, ApJ, 557, 495
- Pillepich et al. (2018) Pillepich, A., Nelson, D., Hernquist, L., et al. 2018, MNRAS, 475, 648, doi: 10.1093/mnras/stx3112
- Planck Collaboration et al. (2016) Planck Collaboration, Ade, P. A. R., Aghanim, N., et al. 2016, A&A, 594, A13, doi: 10.1051/0004-6361/201525830
- Planck Collaboration et al. (2020) Planck Collaboration, Aghanim, N., Akrami, Y., et al. 2020, A&A, 641, A1, doi: 10.1051/0004-6361/201833880
- Platen (2009) Platen, E. 2009, PhD thesis, University of Groningen, Netherlands
- Platen et al. (2007) Platen, E., van de Weygaert, R., & Jones, B. J. T. 2007, MNRAS, 380, 551
- Pollina et al. (2016) Pollina, G., Baldi, M., Marulli, F., & Moscardini, L. 2016, MNRAS, 455, 3075, doi: 10.1093/mnras/stv2503
- Pollina et al. (2017) Pollina, G., Hamaus, N., Dolag, K., et al. 2017, MNRAS, 469, 787, doi: 10.1093/mnras/stx785
- Reines & Volonteri (2015) Reines, A. E., & Volonteri, M. 2015, ApJ, 813, 82, doi: 10.1088/0004-637X/813/2/82
- Ricciardelli et al. (2014) Ricciardelli, E., Quilis, V., & Varela, J. 2014, MNRAS, 440, 601, doi: 10.1093/mnras/stu307
- Rodríguez Medrano et al. (2022) Rodríguez Medrano, A. M., Paz, D. J., Stasyszyn, F. A., & Ruiz, A. N. 2022, MNRAS, 511, 2688, doi: 10.1093/mnras/stac127
- Rojas et al. (2004) Rojas, R. R., Vogeley, M. S., Hoyle, F., & Brinkmann, J. 2004, ApJ, 617, 50, doi: 10.1086/425225
- Rosas-Guevara et al. (2022) Rosas-Guevara, Y., Tissera, P., Lagos, C. d. P., Paillas, E., & Padilla, N. 2022, arXiv e-prints, arXiv:2204.04565. https://arxiv.org/abs/2204.04565
- Ruiz et al. (2015) Ruiz, A. N., Paz, D. J., Lares, M., et al. 2015, MNRAS, 448, 1471, doi: 10.1093/mnras/stv019
- Sabater et al. (2015) Sabater, J., Best, P. N., & Heckman, T. M. 2015, MNRAS, 447, 110
- Sánchez et al. (2017) Sánchez, C., Clampitt, J., Kovacs, A., et al. 2017, MNRAS, 465, 746, doi: 10.1093/mnras/stw2745
- Schaye et al. (2015) Schaye, J., Crain, R. A., Bower, R. G., et al. 2015, MNRAS, 446, 521, doi: 10.1093/mnras/stu2058
- Schechter (1976) Schechter, P. 1976, ApJ, 203, 297
- Schuster et al. (2023) Schuster, N., Hamaus, N., Dolag, K., & Weller, J. 2023, J. Cosmology Astropart. Phys, 2023, 031, doi: 10.1088/1475-7516/2023/05/031
- Schuster et al. (2019) Schuster, N., Hamaus, N., Pisani, A., et al. 2019, J. Cosmology Astropart. Phys, 2019, 055, doi: 10.1088/1475-7516/2019/12/055
- Scott et al. (2017) Scott, N., Brough, S., Croom, S. M., et al. 2017, MNRAS, 472, 2833, doi: 10.1093/mnras/stx2166
- Sheth & van de Weygaert (2004) Sheth, R. K., & van de Weygaert, R. 2004, MNRAS, 350, 517
- Sijacki et al. (2009) Sijacki, D., Springel, V., & Haehnelt, M. G. 2009, MNRAS, 400, 100, doi: 10.1111/j.1365-2966.2009.15452.x
- Sijacki et al. (2015) Sijacki, D., Vogelsberger, M., Genel, S., et al. 2015, MNRAS, 452, 575, doi: 10.1093/mnras/stv1340
- Springel et al. (2018) Springel, V., Pakmor, R., Pillepich, A., et al. 2018, MNRAS, 475, 676, doi: 10.1093/mnras/stx3304
- Sutter et al. (2014) Sutter, P. M., Pisani, A., Wandelt, B. D., & Weinberg, D. H. 2014, MNRAS, 443, 2983, doi: 10.1093/mnras/stu1392
- Szomoru et al. (1996) Szomoru, A., van Gorkom, J. H., Gregg, M. D., & Strauss, M. A. 1996, AJ, 111, 2150
- Vallés-Pérez et al. (2021) Vallés-Pérez, D., Quilis, V., & Planelles, S. 2021, ApJ, 920, L2, doi: 10.3847/2041-8213/ac2816
- van de Weygaert (2016) van de Weygaert, R. 2016, in The Zeldovich Universe: Genesis and Growth of the Cosmic Web, ed. R. van de Weygaert, S. Shandarin, E. Saar, & J. Einasto, Vol. 308, 493–523, doi: 10.1017/S1743921316010504
- van de Weygaert & van Kampen (1993) van de Weygaert, R., & van Kampen, E. 1993, MNRAS, 263, 481
- Villaescusa-Navarro et al. (2013) Villaescusa-Navarro, F., Vogelsberger, M., Viel, M., & Loeb, A. 2013, MNRAS, 431, 3670, doi: 10.1093/mnras/stt452
- Vogelsberger et al. (2014a) Vogelsberger, M., Genel, S., Springel, V., et al. 2014a, Nature, 509, 177, doi: 10.1038/nature13316
- Vogelsberger et al. (2014b) —. 2014b, MNRAS, 444, 1518, doi: 10.1093/mnras/stu1536
- Wegner et al. (2019) Wegner, G. A., Salzer, J. J., Taylor, J. M., & Hirschauer, A. S. 2019, ApJ, 883, 29, doi: 10.3847/1538-4357/ab3a3c
- Weinberger et al. (2017) Weinberger, R., Springel, V., Hernquist, L., et al. 2017, MNRAS, 465, 3291, doi: 10.1093/mnras/stw2944
- Woodfinden et al. (2022) Woodfinden, A., Nadathur, S., Percival, W. J., et al. 2022, MNRAS, 516, 4307, doi: 10.1093/mnras/stac2475
- York et al. (2000) York, D. G., Adelman, J., Anderson, John E., J., et al. 2000, AJ, 120, 1579, doi: 10.1086/301513
- Zinger et al. (2020) Zinger, E., Pillepich, A., Nelson, D., et al. 2020, MNRAS, 499, 768, doi: 10.1093/mnras/staa2607