Observation of Liquid Glass in Molecular Dynamics Simulations
Abstract
Molecular anisotropy plays an important role in the glass transition of a liquid. Recently, a novel glass state has been discovered by optical microscopy experiments on suspensions of ellipsoidal colloids. ’Liquid glass’ is a disordered analog of a nematic liquid crystal, where rotation motion is hindered but particles diffuse freely. Global nematic order is suppressed as clusters of aligned particles intertwine. We perform Brownian dynamics simulations to test the structure and dynamics of a dense system of soft ellipsoidal particles. As seen in experiments and in accordance with predictions from mode coupling theory, on the time scale of our simulations rotation motion is frozen but translation motion persists in liquid glass. Analyses of the dynamic structure functions for translation and rotation corroborates the presence of two separate glass transitions for rotation and translation, respectively. Even though the equilibrium state should be a nematic, aligned structures remain small and orientational order rapidly decays with increasing size. Long-wavelength fluctuations are remnants of the isotropic-nematic transition.
I Introduction
Colloids are ubiquitous in our everyday lives. Additionally, they play an important role as models, where they can be considered as ’big atoms’ [1]. To date, most work exploring the structure and dynamics of colloidal suspensions has been performed with spherical particles. However, many physical and technological colloidal systems are non-spherical. Only recently has the role of colloid form come into the focus of scientific interest and, so far, it largely remains unchartered territory [2]. Shape matters especially at higher colloid concentrations, where the packing gets more intricate because of steric constraints. This is apparent already for ellipsoidal particles that are the simplest generalization of spherical bodies. For elliposidal colloids, theory and simulations predict a rich phase diagram of equilibrium fluid, crystal [3] and nematic phases [4], plus additionally jammed [5, 6, 7] and glass states [8, 9, 10, 11] due to the presence of structural and orientational correlations.
Because the colloidal glass transition features many of the phenomena found in atomic and molecular systems, colloids have been used extensively as model systems to study the glass transition [12, 13, 14]. In confocal microscopy studies of suspensions of prolate ellipsoidal colloids with an aspect ratio , we could recently show the importance of colloidal shape on the thermal, quiescent glass [15]. Liquid glass as a new glass state, predicted by theory [8] twenty years ago, was discovered. It is formed as intermediate material in an intriguing two-step vitrification process when increasing the volume fraction. Measurements of angular and translation time-dependent correlation functions demonstrated that when the packing density increases, the orientational motion freezes before the translation one. In between these two glass transitions, a liquid glass exists as a state where colloids can diffuse but do not de-correlate their local angular alignment. It was found that the global nematic order vanishes because ramified clusters of aligned particles interpenetrate and hinder each other [15].
Glass states of ellipsoidal particles have been described in mode coupling theory (MCT) by Schilling and coworkers [16, 17, 8, 18]. MCT derives the structural arrest from the equilibrium static structure factors as input, and for larger aspect ratios predicted two different glass transitions for rotation and translation motion. The topology of state space was further elucidated by developing a schematic model of MCT [15]. It captures the generic coupling of two sets of degrees of freedom, translation and rotation ones, and captures their frequency-dependent interrelation in retarded friction kernels. The model predicts two generic MCT glass transitions, and a region in between that corresponds to the existence range of liquid glass. MCT makes specific predictions on the relaxation of the incipient glassy structure in the supercooled state [19], that we will use to identify liquid glass in the present simulation work.
The formation of liquid glass is driven by the directional correlations accompanying nematic ordering. Yet, in some systems, these directional correlations preempt the ordering transition [15], while in other systems, glass formation causes texture dynamics to arrest in nematic states. Highly elongated colloidal rods, for instance, show arrested texture dynamics in suspensions far in the nematic regime [20, 21]. Static glassy structures obtained by driving particles in external fields [22, 23, 24, 25], and jammed states in athermal systems of ellipsoids [6, 7] are other instructive examples for the importance of local alignment in amorphous solids made from anisotropic particles. A liquid glass-like state also exists in two-dimensional colloidal films [26, 27, 28, 29, 30], where it forms via the mutual steric hindrance of compact nematic domains. The nematic order of the two-dimensional domains extends over hundreds of particles, while it decays to zero fast in the three-dimensional liquid glass [15]. This suggests that ramified and fractal nematic precursors are the building blocks of liquid glass in bulk dispersions. Its mechanical properties should be intriguing as it is expected to flow like a liquid but to transmit torques like a solid even though it lacks nematic order.
In this work, we perform Brownian dynamics simulations to unravel the microscopic structural correlations and the transport properties of liquid glass. The study is motivated by the intriguing absence of a clear observation of liquid glass formation in earlier simulations. To model the hard interaction potential of the ellipsoidal colloids found experimentally, event driven Brownian dynamics (EDBD) simulations [5, 31, 32, 33, 34] were performed previously [9, 15]. In these cases, only rather small systems of around 500 ellipsoidal particles could be simulated because of the numerical complexity to sample random motion without tolerating overlaps of anisotropic particles. In the two-dimensional simulations, an artificial dynamics using kinetic Monte Carlo (kMC) was employed for similar reasons [27]. The EDDB simulations reported the formation of a nematic phase as expected from equilibrium Monte Carlo studies. The formation of a nematic state could be suppressed by rough walls, which led to the formation of a (regular) glass [15], viz. the state of arrested diffusion and rotation. The isotropic-nematic transition prevented the observation of a clear two-step relaxation in angular correlation functions as expected by MCT for liquid glass formation, and the identification of the two different glass transitions for rotation and translation required appreciable extrapolation of the rotation and translation diffusion coefficients to zero [9]. Similar extrapolations of the relaxation times of angular and translation functions was necessary in the kMC simulations in order to indicate the two glass transitions in the films [27]. No EDBD or kMC simulations have been reported in the liquid glass state, however. This has prevented simulations to test whether the dynamics in this state exhibits the decoupling of rotation and translation and follows the predictions of MCT. To overcome the limitations of the previous simulations, we first employ techniques that allow to simulate far larger ellipsoid systems than previously studied. Second, to be able to quench beyond the nematic state, we develop a soft repulsive potential that enables large steps in the effective volume fraction. It simplifies the established Gay-Berne potential [35] by only keeping the repulsion as has been done for spherical particles. For a test how close this approaches true hard interactions see e.g. Ref. [36]. A second aspect neglected in the previous EDBD simulations of ellipsoidal colloids [5, 31, 32, 33, 34, 9, 15] concerns the anisotropic diffusion of the particles parallel and perpendicular to their main axis. In our work, we use the Brownian dynamics algorithm developed in Ref. 37 and take the rotation and translation diffusion coefficients from measurements of the liquid-glass forming colloids in dilute solution [15].
The paper is organized as follows. In Sect. II the system as specified by its interaction potential is introduced. Sect. III summarizes the definitions of the structural and dynamic functions that are evaluated. In Sect. IV, aspects of the simulation methodology are given, and the central section, Sect. V gives the simulation results and compares them with experimental data where available. First, the isotropic and the nematic phases are characterized, and in Sect. V.2 the liquid glass is discussed. Sect. V.3 compares with MCT predictions and analyses the intermediate time dynamics of translation and angular correlation functions. The conclusions and a discussion of the results are given in Sect. VI.
II Model
We study an isotropic dispersion whose constituents are soft ellipsoidal particles with a fixed aspect ratio. The interactions of the ellipsoids among themselves are governed by an anisotropic inverse potential. The study can build on approaches to molecular fluids, where efficient descriptions have been developed. In this section, the interaction potential is presented.
II.1 Interaction Potential for Anisotropic Soft Particles
The interactions of anisotropic particles have been investigated for several decades [38, 35, 39, 40, 41]. In 1981, Gay and Berne modified the overlap potential [38] introduced by Berne and Pechukas and presented their potential which has since been known as the “Gay-Berne potential” [35]. It is a generalization of the Lennard-Jones potential [42] in that it includes orientation dependent parameters. With it, the isotropic, nematic, and the other liquid-crystalline phases could successfully be predicted in molecular dynamics simulations [43, 44]. However, the “Gay-Berne potential” is limited to anisotropic uniaxial particles of the same type. Berardi, Fava, and Zannoni extended it to describe the pair interaction of two identical biaxial molecules [39] and dissimilar biaxial molecules [40]. Their formulation describes the orientational degrees of freedom using the Euler angles. Berardi, Muccioli and Zannoni introduced another expression of the biaxial “Gay-Berne potential” using quaternions to describe the orientation dynamics of the anisotropic molecules[41]. This is more convenient for molecular dynamics simulations because the new potential with the quaternion formulation removes the singularity in the equations of motion resulting from use of the Euler angles to describe molecular rotations.
In this work we are mostly interested in an isotropic fluid at high densities. At such densities the main forces contributing to structure formation are those due to the harsh repulsive interactions of the particles’ hard cores. In such a high-density fluid and since the system is far from the critical point, attractive interactions play negligible roles in stabilizing the fluid structure. Subsequently, we will therefore adopt a purely repulsive potential where the anisotropy enters through a term depending on the distance and the orientation of the ellipsoid. We will refer to the new potential as a “Repulsive Gay-Berne potential (RGB)”. Furthermore, we are going to study a one-component anisotropic fluid made up of identical uniaxial ellipsoids with an aspect ratio .
The RGB potential describes the pairwise repulsive interaction of two ellipsoids, and , and is defined as:
| (1) |
where and are an energy scale and a length scale respectively. is a vector connecting the centers of masses of the two ellipsoids and . The 4-dimensional unit quaternion specifies the orientation of the ellipsoid with the normalization condition . Further, the anisotropic contact term describes the geometrical contact distance:
| (2) |
The overlap matrix is symmetric and defined in terms of the shape matrix where and are the long and short diameters respectively for both ellipsoids. The overlap matrix reads:
| (3) |
where is the rotation matrix corresponding to an active rotation for a unit vector from the space fixed frame to the ellipsoid body frame where the vector becomes :
| (4) |
The rotation matrix is written in terms of the quaternion components:
| (5) |
Note that when considering the limit of isotropic molecules, Eq. 1 reduces to the repulsive part of the Lennard-Jones potential.
III Definition
In this section, we introduce the functions that describe the structure of our ellipsoidal fluid as well as the quantities that give us insight into the fluid’s microscopic dynamics and correlations.
III.1 Statics
For the isotropic fluid, the structure of the fluid is identified by the radial distribution function and the isotropic structure factor defined respectively by
| (6) |
| (7) |
where the brackets refer to the canonical average, is the vector connecting the center-to-center distance between the two ellipsoids and , and the wave vector is with being the system length size and a vector of integers. is the total number of the ellipsoids in the fluid, and is the particle number density. is the isotropic microscopic local density:
| (8) |
The functions and do not give any information on the orientation correlations in the spatial and wavevector domains. Therefore, in addition to these two functions, we study two quantities that describe the spatial correlations of the orientation degrees of freedom. The orientation pair distribution function is defined as
| (9) |
where is a unit vector along the major axis of the ellipsoid expressed in a space fixed frame. is the Legendre polynomial of degree . In the isotropic phase, decays to zero while in the nematic and crystalline phases, it decays to nonzero values [45, 46]. More precisely, for this function decays to the quadratic equilibrium value of the scalar nematic order parameter for large distances [47] .
Another interesting orientation-dependent quantity is defined in the wavevector domain. It is called the orientation structure factor [8] :
| (10) |
is the orientation-dependent microscopic local density which is defined in terms of the spherical harmonics discussed in Ref. 48,
| (11) |
While we consider the density auto-correlations, viz. , only, off-diagonal elements have also been measured [32]. After introducing these two functions, the equilibrium static structure of our fluid can fully be investigated.
An additional important quantity is the scalar nematic order parameter which provides us with knowledge on the degree of the orientation order in our system. This scalar quantity is measured by computing the largest eigenvalue of the nematic order tensor [47] defined as:
| (12) |
where is the component of the eigenvector representing the orientation of the ellipsoid in the simulation box frame. The largest eigenvalue then is
| (13) |
where is the angle pointing away from the nematic director .
III.2 Dynamics
In order to gain insight into the microscopic time evolution of the system, the dynamical quantities recording translation and orientation motions in the fluid need to be defined. These dynamical functions are defined in the temporal domain and tell us inter alia whether the system is in equilibrium so that we can compute the thermodynamic quantities. The first dynamical quantity is the well-known self intermediate scattering function [49] ,
| (14) |
This function probes single particle dynamics in the fluid and gives information on self correlation. In of Eq. (14) and in all other time-dependent correlation functions, time will be chosen large enough to ensure equilibration or aging will be discussed explicitly. No time-averaging over will be performed. In addition to self correlations, cross correlations among the ellipsoids in the fluid must be described. Therefore, we introduce the isotropic dynamic structure factor [49] ,
| (15) |
measures the collective dynamics and correlations of all particles in the fluid. To examine orientation-dependent dynamics and temporal correlations, the following functions are adopted. The first one is the orientation dynamic structure factor [8]
| (16) |
and the second function is the time-dependent orientation correlation function defined in terms of the Legendre polynomial [50]
| (17) |
with the same interpretation for the unit vector as in Eq. (9). The function measures the correlations of the coupled translation-rotation dynamics while the function only measures the correlation of the rotation dynamics. As a special case for , the function decays to the the quadratic value of the equilibrium scalar nematic order parameter for large timescales [47], in that, . Having introduced these functions, we can now probe the dynamics of the anisotropic fluid in detail.
IV The Simulation Setup
We carry out Molecular Dynamics simulations using the Large-scale Atomic/Molecular Massively Parallel Simulator ”LAMMPS” [51]. The Brownian dynamics of an ellipsoidal fluid is simulated at different densities using an algorithm implemented in LAMMPS. The integrator is known in LAMMPS, as the ”fix Brownian/asphere”, and is based on the work done by I. Ilie et al. [37] and S. Delong et al. [52]. Our system of interest is composed of 2197 ellipsoids with a fixed aspect ratio . In our Brownian simulations, the ellipsoids exist in a three dimensional box whose length size is . Periodic boundary conditions are implemented in order to avoid any wall-particle interactions. The initial state of the system is prepared by uniformly distributing tiny isotropic particles on a cubic lattice. While the dynamics are integrated, the small particles are grown until they become ellipsoids with the required aspect ratio. After that, the system is equilibrated, and new simulations start (the measurement phases). In the simulations, we set where is the ellipsoid short semi-axis, is the Boltzmann factor, and is the temperature. The dimensionless time is where is the time whereas the Brownian timescale is with being the average translation diffusion coefficient. We refer to the dimensionless units with the star symbol. The timesteps used in the measurement phases are which is used in Sect. V.1, and which is used in Sect. V.2. The simulation time for Sect. V.1 is while the simulation time for Sect. V.2 is . The anisotropic translation and rotation diffusion tensors input in the simulations are the body-frame diffusion tensors measured in an experiment on dilute colloids made up of hard ellipsoids. All the experimental results or data in this research are taken from the experiment done by Roller et al. [15]. The anisotropic translation diffusion tensor is while the anisotropic rotation diffusion tensor is . This means that the average scalar translation diffusion is . The dimensionless distance and wavenumber are and , respectively.
As we use soft repulsive ellipsoids in the simulation, we adopt an effective density as parameter of the thermodynamic states. The density of the soft particles is notably temperature dependent. For the soft particles the effective density is defined as . In our simulation, we set and . With the above setup, the simulations run at different effective densities . Since most of the figures shown use reduced units, we are going to omit the stars from the dimensionless quantities for simplicity. When dimensional quantities are needed or discussed, their units will be stated explicitly next to them. Also, we will refer to the effective density only as the density.
V Results and Discussion
This section is divided into two parts: Identifying the equilibrium phases of the fluid (the isotropic and nematic) and finding the liquid glass as a nonequilibrium state in the soft ellipsoid fluid. For comparison with the experimental work by Roller, et al. [15], experimental data are only available for the isotropic and the liquid glass states.
V.1 The Isotropic and Nematic Phases
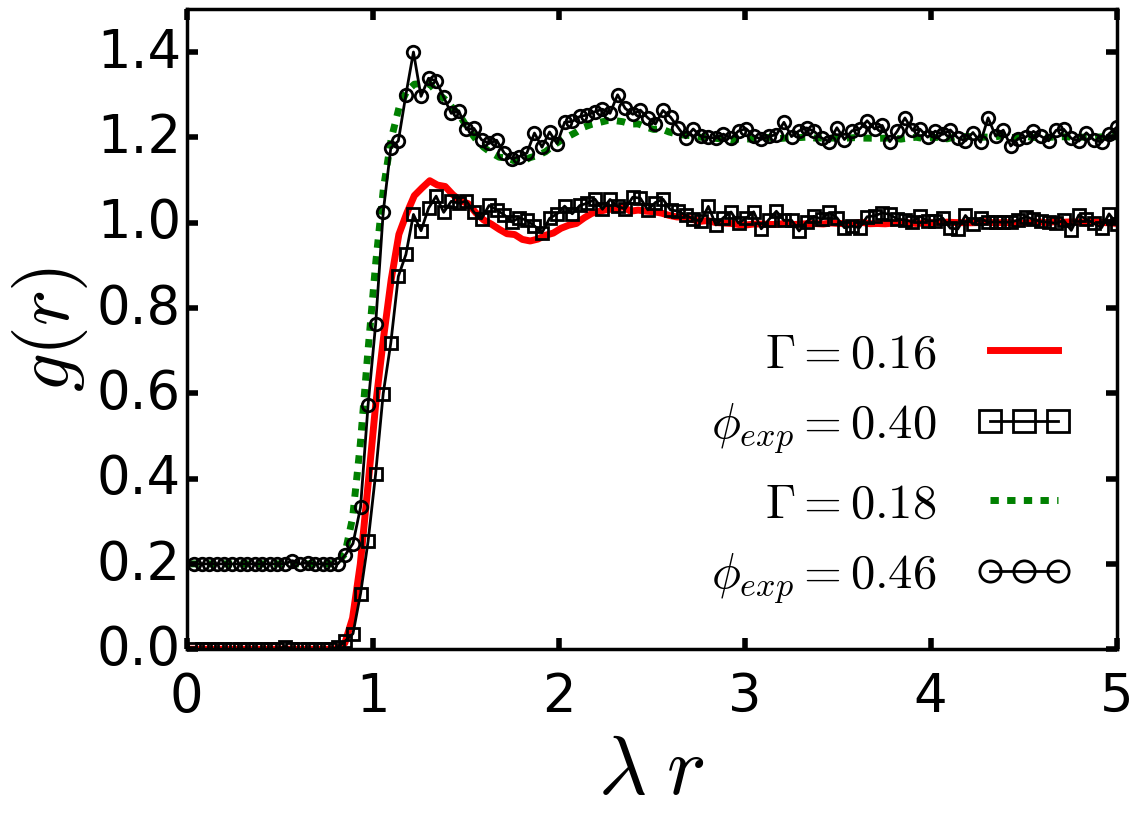
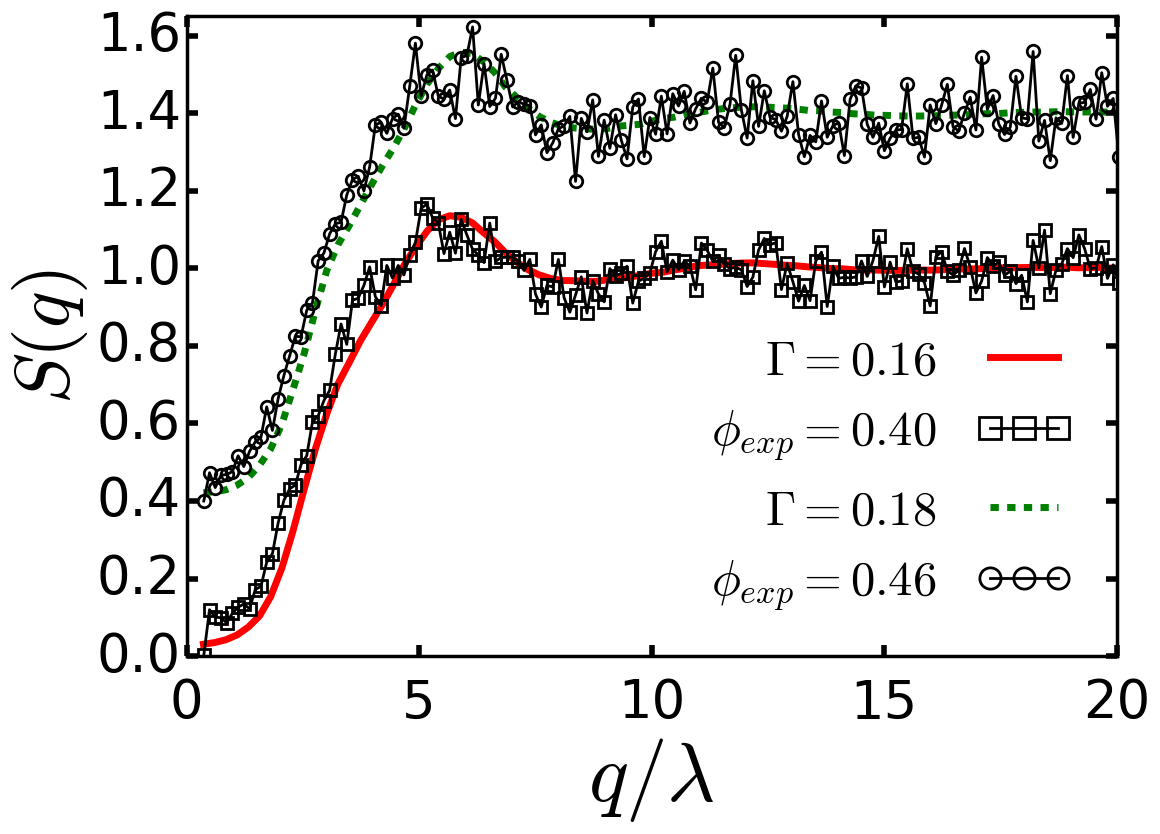
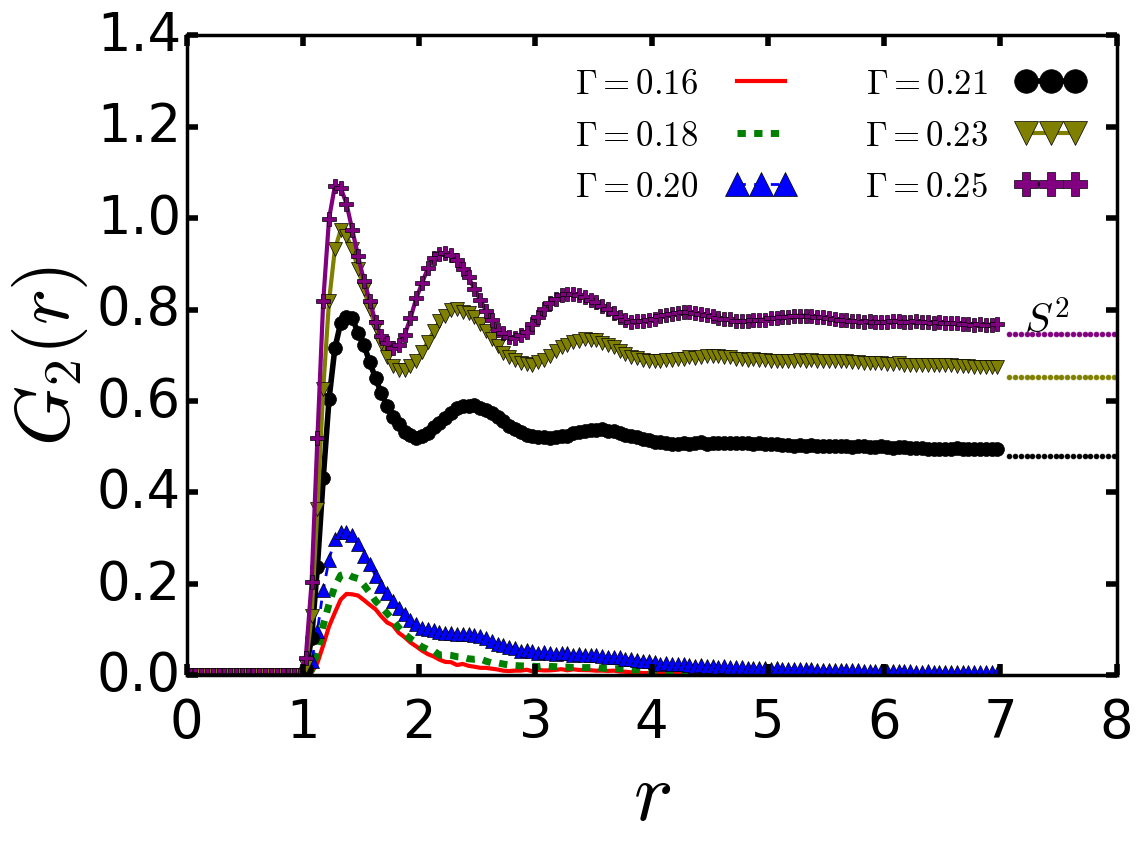
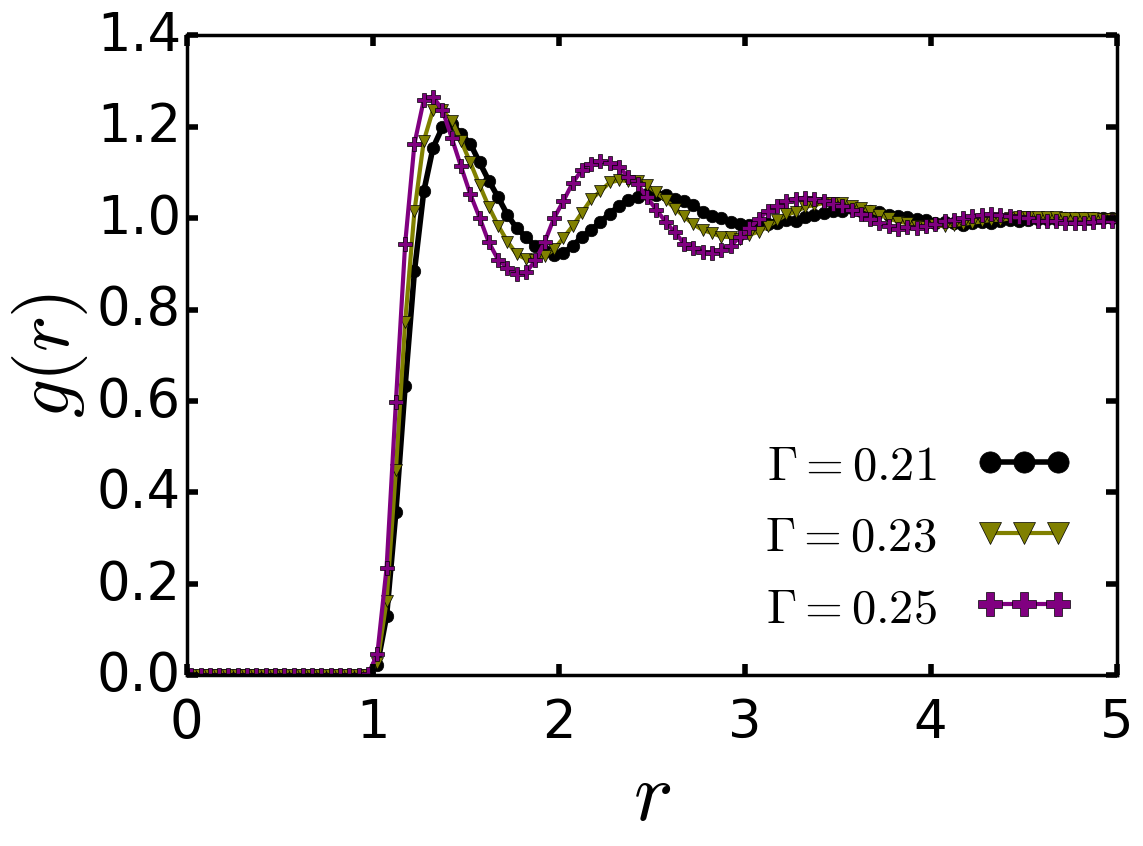
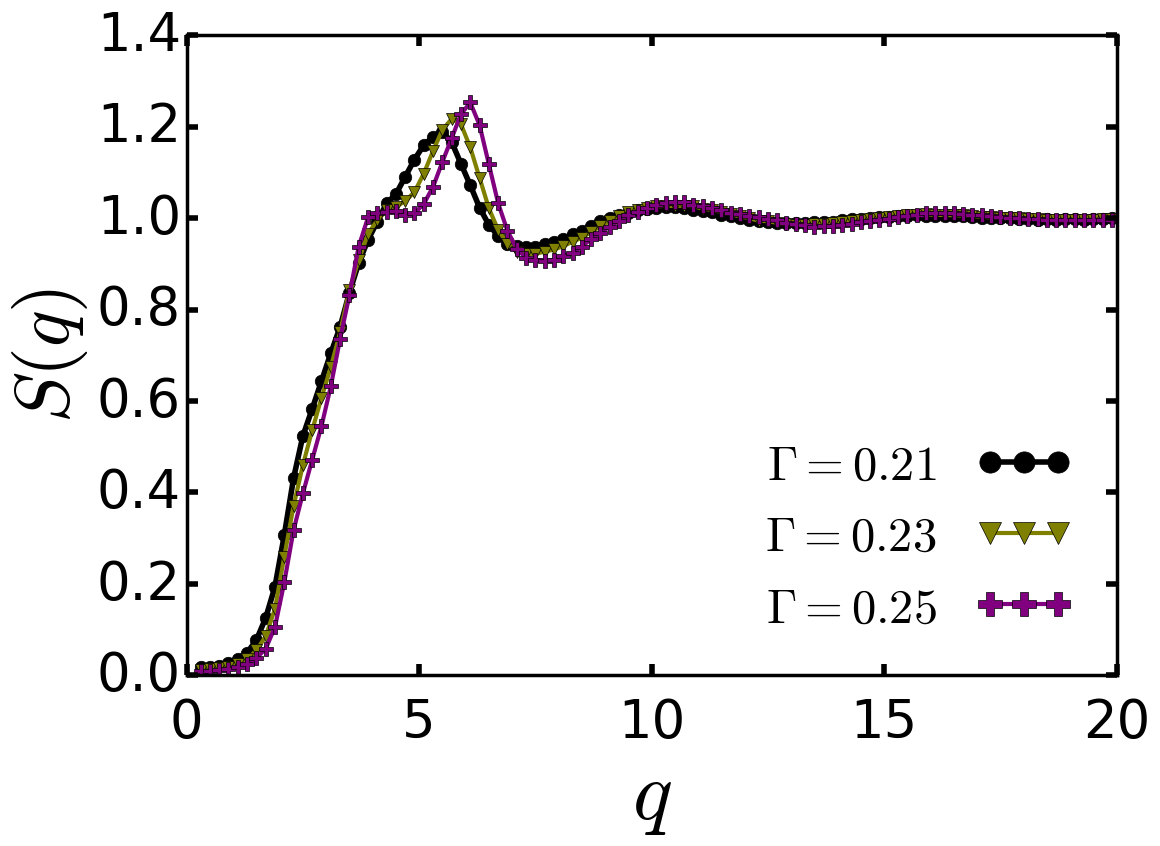
In the simulations, soft ellipsoids with aspect ratio are found to form isotropic states at densities . This can be inferred from the plots of the pair correlation function and the structure factor in Fig. 1 where there are no long range structures. In addition, the isotropic states manifest no nematic order which can be noticed from the decay of the orientation correlation in to zero across the system length scales as noticed in Fig. 3. To inspect that there is no nematic order during the simulation time, the scalar nematic order parameter is measured and shows a very weak and negligible nematic order (not shown). We attribute it to the finite simulation box size. In the plots of and we show comparisons between the soft ellipsoids at different densities and the hard ellipsoids as experimentally measured at different volume fractions . We define a ratio of length-scales as mapping parameter (where is some length scale) so that we can map the soft-ellipsoid structure onto the hard ellipsoid structure. Basically, we scale the x-axis of the soft-ellipsoid plots of the and functions by the factor until the structure of soft ellipsoids matches the structure of the hard ellipsoids. This means that for the structure plots of the hard ellipsoids we have since the hard ellipsoid plots are our reference plots. For the scaled soft ellipsoid plots, the best mapping parameter for the isotropic states is found to be . Considering the translation degrees of freedoms, it is obvious from the and plots that the system structures in the simulation for the isotropic densities and are mapped best to the system structures in the experiment for the isotropic volume fractions and , respectively.
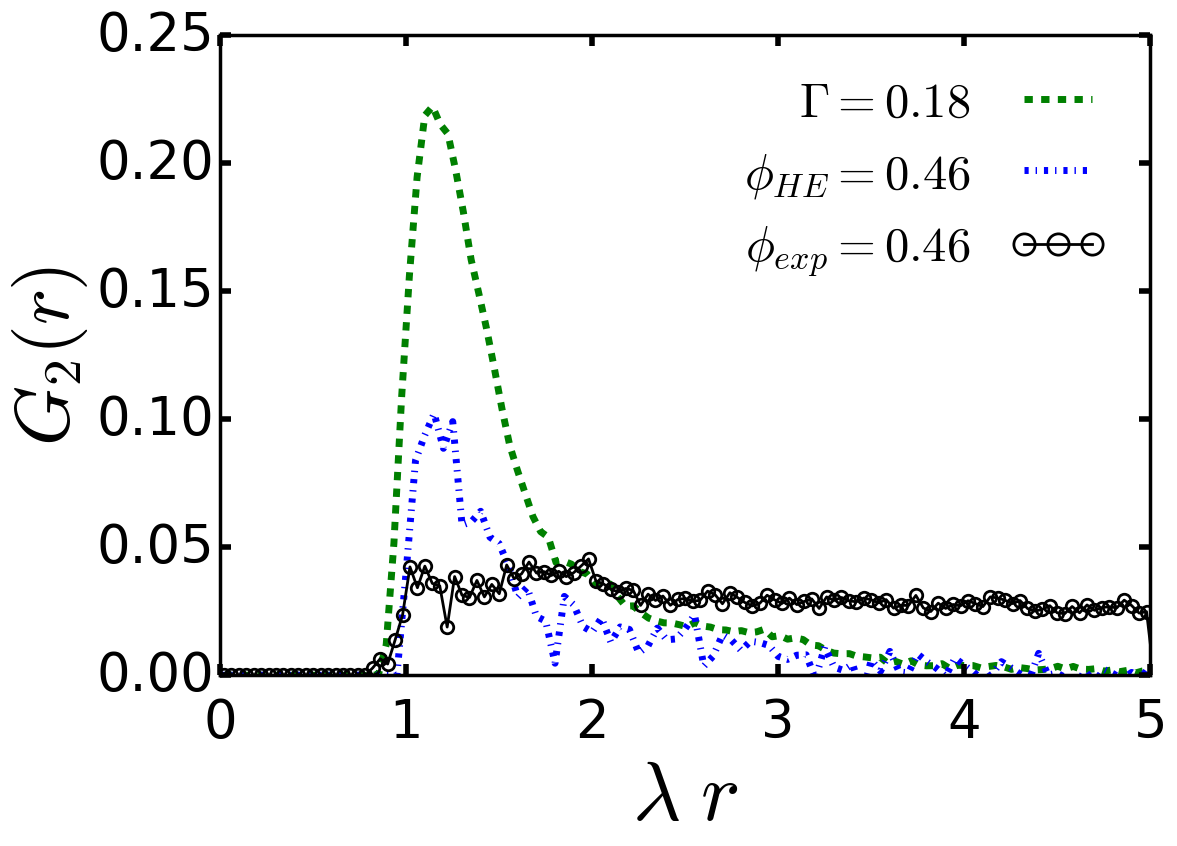
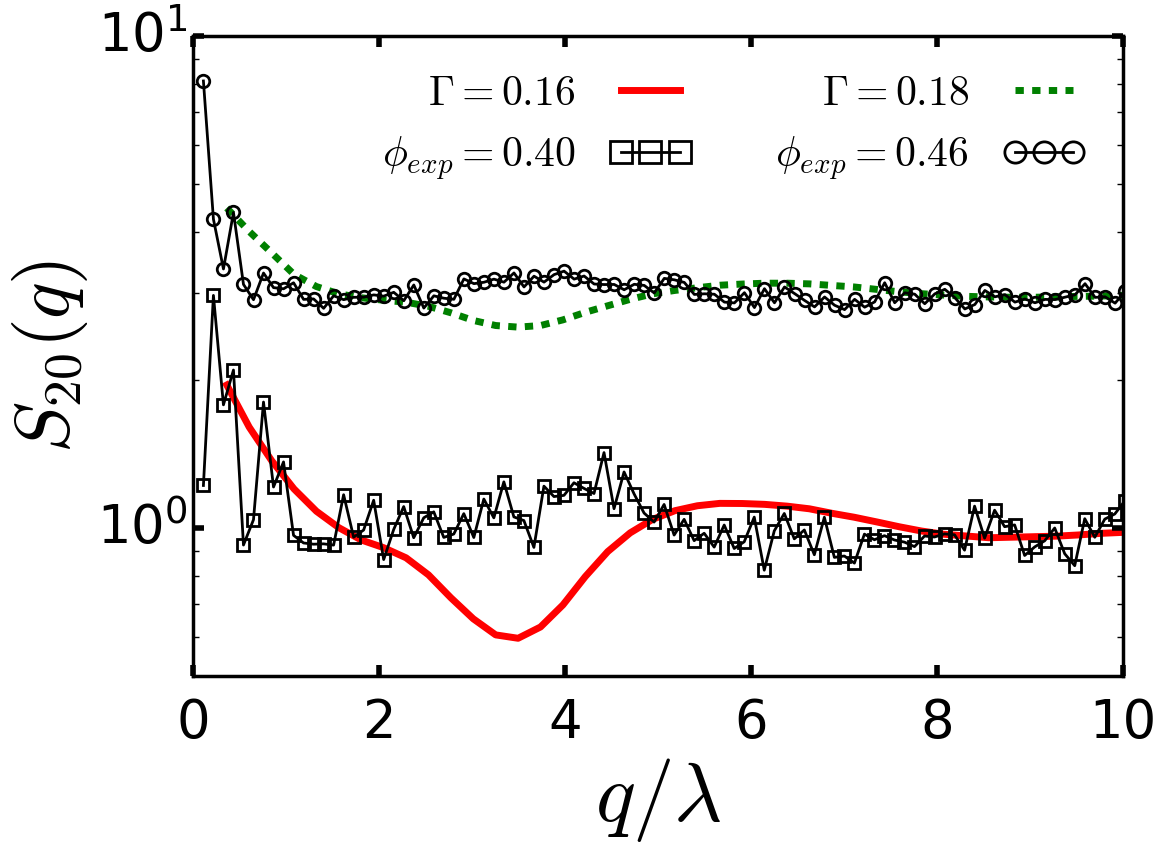
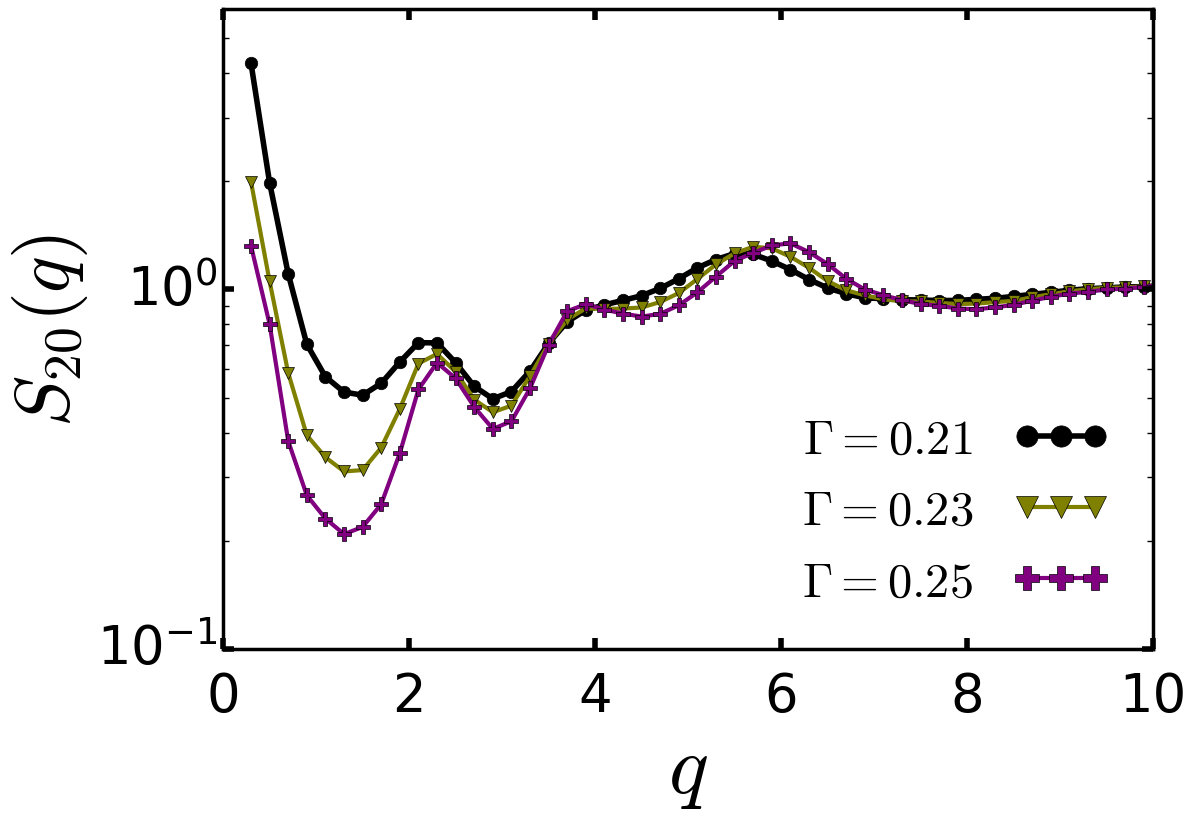
At this point, the spatial orientation structure of the isotropic states needs to be discussed. The upper panel in Fig. 2 presents the orientation radial distribution function in an isotropic state. It is clear from the plot that the orientation correlations in the simulation are more enhanced than the ones in the experiment. Additionally, the from EDBD simulations of hard ellipsoids [15] is included in Fig. 2. Its lower values reflect the fact that the soft ellipsoid neighbours align more strongly than the hard ones. This demonstrates the effect of the particle softness in the simulation which prevents producing unstable forces and torques at small length scales. The smaller correlations measured in the experiment presumably result from polydispersity which makes the short range structure in the sample be different from the structure in the simulations. The orientation structure factor is shown in the lower panel of Fig. 2. The large wavevector oscillations show the discussed local differences, but the long-ranged orientation correlations become stronger on increasing the density equally in simulation and experiment.
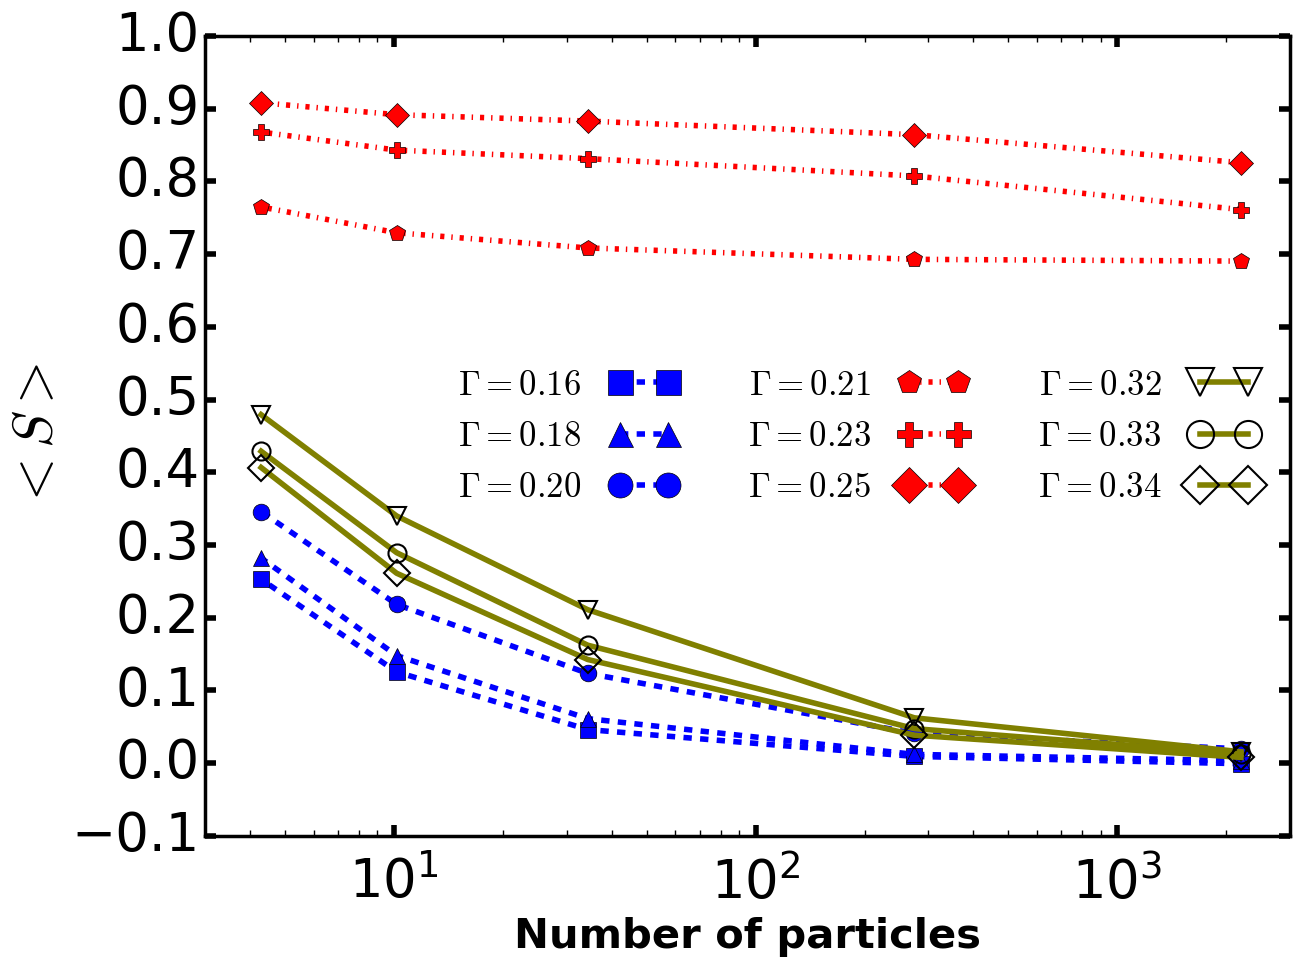
When increasing the densities to larger than , the soft-ellipsoid system transforms from the isotropic to the nematic phase. As there are no experimental data available for the nematic phase, we show the results of this phase only in the simulation. What characterizes the nematic states are the finite limit of the function at far distances and its clear peaks as seen in Fig. 3. Additionally, the values of the nematic scalar order parameter explicitly prove the existence of the nematic phase for . They will be obtained from a finite size analysis performed in Fig. 15; see there for more details. It is clear that when increasing the nematic density more and more, the degree of the nematic order increases as can be seen in the increasing values of and , that fulfill [47] . Probing the structures in the plots of the functions and in Fig. 4, we observe that the nematic states have more translation order than the isotropic states. The translation order is reinforced when the system density increases. The presence of a small peak in the plot around in Fig. 4 reflects the emergence of a weak translation order at that length scale. This weak translation order results from the strong orientation order at the short length scales in the orientation structure factor of the nematic states around and in the same figure. Once again, the softness of the particles plays an important role in having such short and stable orders in the nematic states. An interesting feature of the function is that it informs about the long-wavelength orientation density fluctuations when looking at its small wavevector regime. It is clear that at small wavevectors in Fig. 4 the value of decreases when the fluid density increases. This is due to the fact that the amplitudes of the local orientation density fluctuations become smaller when the system moves away from the density at which the isotropic-nematic phase transition occurs (). In the isotropic phase, the same phenomenon happens but in the opposite direction. When the system density approaches the isotropic-nematic transition, the value of at small wavevectors increases which is a sign that the magnitude of orientation density fluctuations increases so that these fluctuations dominate the whole simulation box at the phase transition.
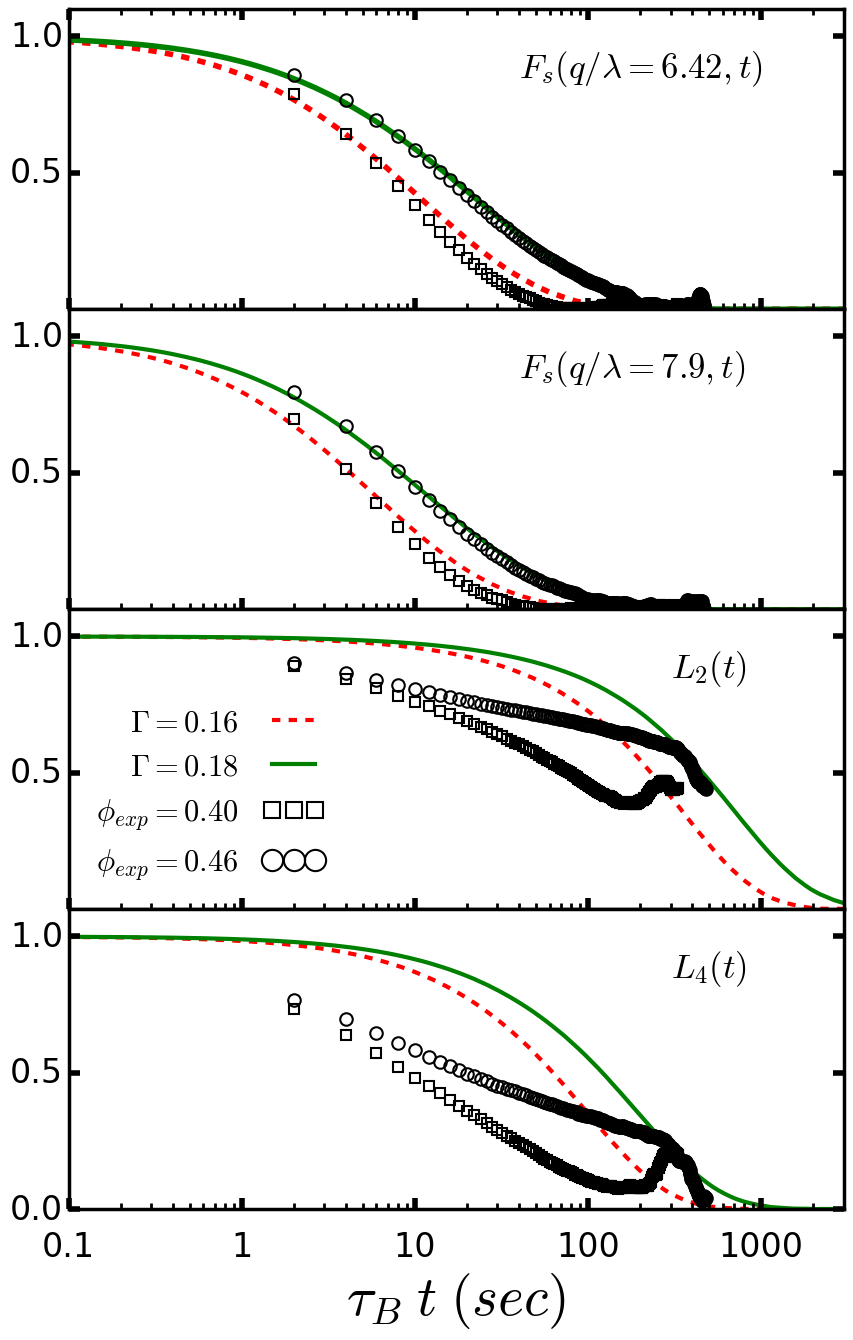
Having discussed the structures of the isotropic and nematic states, we now discus their dynamics and show the results of the translation and orientation correlation functions in both equilibrium phases. Figure 5 shows the self intermediate scattering function and the orientation correlation functions and in the isotropic states for the soft ellipsoids (simulation) and the hard ellipsoids (experiment) fluids. Notice that the time axis is in seconds, and that a single Brownian time depending on the density via hydrodynamic interactions matches the dynamics of all time-dependent functions. The factor is present in the plots in order to have the correct mapping between the soft and hard ellipsoids at the respective length scales. It is obvious from Fig. 5 that the relaxation of the translation dynamics in the simulation agrees almost exactly with that in the experiment. This can be seen in the plots of the self intermediate scattering function for the two wave vectors and . We repeat here that by setting we obtain the hard-ellipsoid value, while setting we obtain the scaled soft-ellipsoid value. The first vector corresponds to the peak in the isotropic structure factor and the second is a vector close to the peak seen in Fig. 1. Observing the decay of the self intermediate scattering function in the simulation and the experiment in Fig. 5, we deduce that the dynamics of the states and agree with the dynamics of the states and respectively. These agreements in the isotropic-phase dynamics between simulation and experiment have also been seen in the isotropic-phase structure functions and in Fig. 1. Also, the relaxations of the rotation degrees of freedoms depicted by the functions and in Fig. 5 show agreements and discrepancies in the rotation dynamics between the soft ellipsoids and the hard ellipsoids. In both systems, the soft ellipsoids and the hard ellipsoids, the rotation correlations seen in and tend to live longer and decay on rotation timescales larger than the translation timescales at which the functions decay. The rotation timescales are larger than the translation timescales by one to two decades in both the soft and hard ellipsoid systems. At the same time, the decay of the rotation dynamics in the hard ellipsoids sets in at earlier times than the one in the soft ellipsoids. An explanation for the discrepancy in the rotation correlation functions between simulation and experiment is the inevitable noise in the experiment that makes the correlation functions in the experiment decorrelate earlier than those of the simulation.
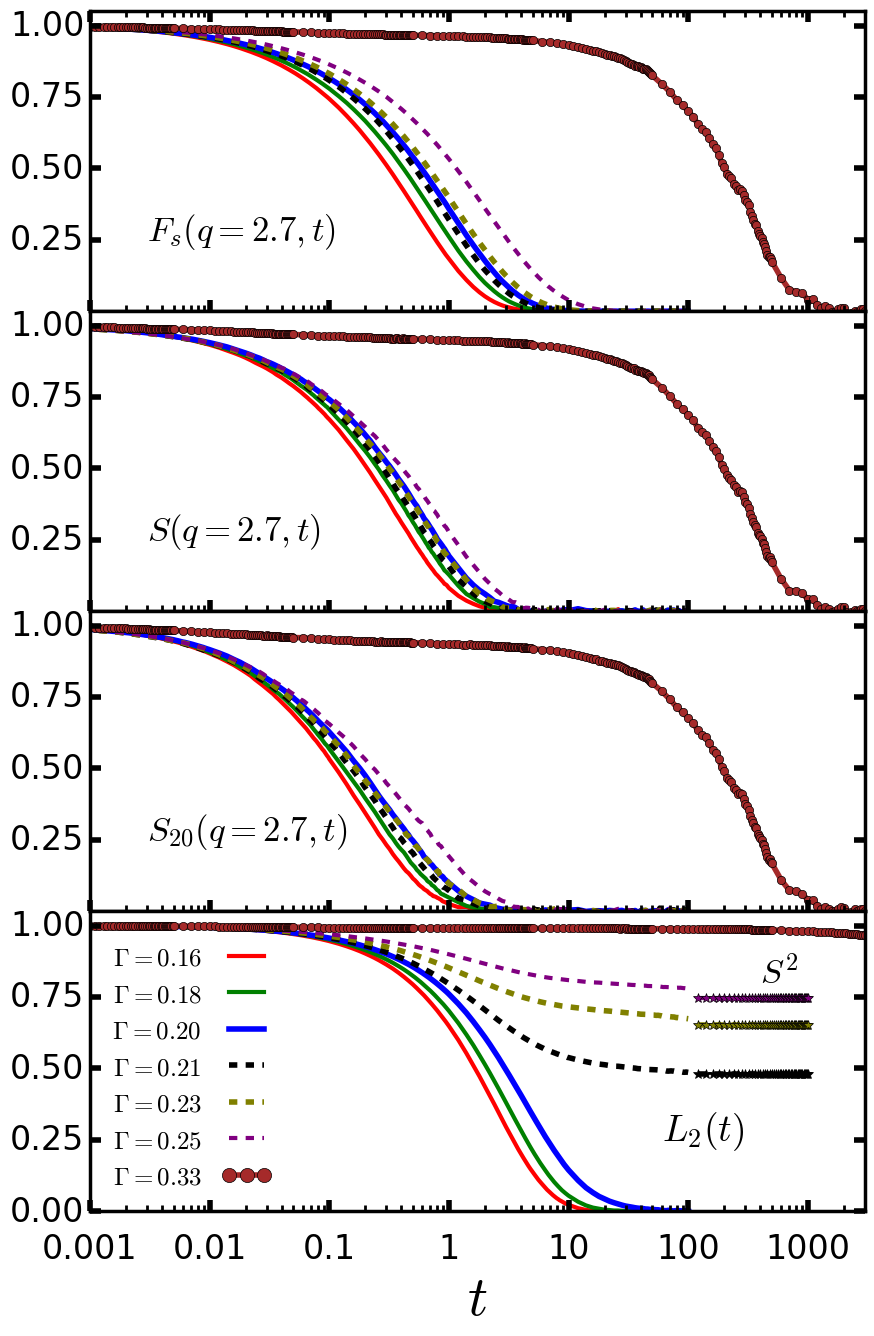
Now, we concentrate our discussion only on the simulation results and show an overview of the dynamics in the isotropic and nematic states, as well as in the state of the liquid glass. Figure 6 depicts the plots of the translation correlation functions , , and at the wavevector , and the orientation correlation function . Notice the absence of the factor which means that the simulation plots are not rescaled because there are no experimental (hard ellipsoids) data. The wavevector corresponds to a small peak in the structure factor of the nematic states in Fig. 4. Figure 6 shows the isotropic states ( with solid lines), the nematic states ( with dashed lines), and a liquid glass state ( with a solid line marked by circles). The fastest decay in the isotropic states corresponds to while the slowest corresponds to . The fastest decay in the nematic states corresponds to while the slowest corresponds to . As expected, in each phase the relaxation timescale of the correlation functions increases when the density increases. At each density, the rotation timescale seen in in Fig. 6 is remarkably larger than the translation timescales observed in , , and for wavevectors connected to the structural relaxation. The simulation time for the isotropic and nematic states stops once the states are equilibrated (at ). We had to run much longer simulations for the state , and yet could not make angular correlations reach equilibrium. The simulation time for the state ends at (see Fig. 6). In the nematic phase, the function decays to a nonzero value which is the quadratic value of the equilibrium scalar nematic order parameter. Furthermore, the decays of the functions , , and in Fig. 6 for are faster than the decays of the same functions at the isotropic state . This reflect the fact that when the particles cross the isotropic-nematic transition, their centers of masses can move more freely due to the orientation order which was absent in the isotropic state . However, this is only noticed close to the isotropic-nematic transition. At , a liquid glass state can be identified. From Fig. 6, the most obvious dynamical behavior of the liquid glass is the decay of the translation correlations in , , and around timescales while the orientation correlation in persists with a very high amplitude. This reflects the fact that the particle rotation dynamics are arrested while the ellipsoid centers of masses are moving freely which enables the translation correlations to equilibrate. While in the nematic state, the arrest in the dynamic orientation correlations is in agreement with the measured nematic order, in the liquid glass, where is very small (see Fig. 15), this relation clearly does not hold.
V.2 The Liquid Glass
To obtain the liquid glass, we first equilibrate the fluid into an ergodic state at low where all correlations vanish. The liquid glass is then obtained by quenching the fluid into a high density . In order to relax the initial high forces, the system is then run until the translation correlations have relaxed; this gives the start of the measurement window. In this part we concentrate on the density . The success in quenching into such a high density heavily relies on the nature of the particles used in the simulation. Introducing the particle softness by using the RGB potential helps to avoid the formations of unstable physical configurations upon quenching. Such softness does not generate any large forces that cease the MD simulation.
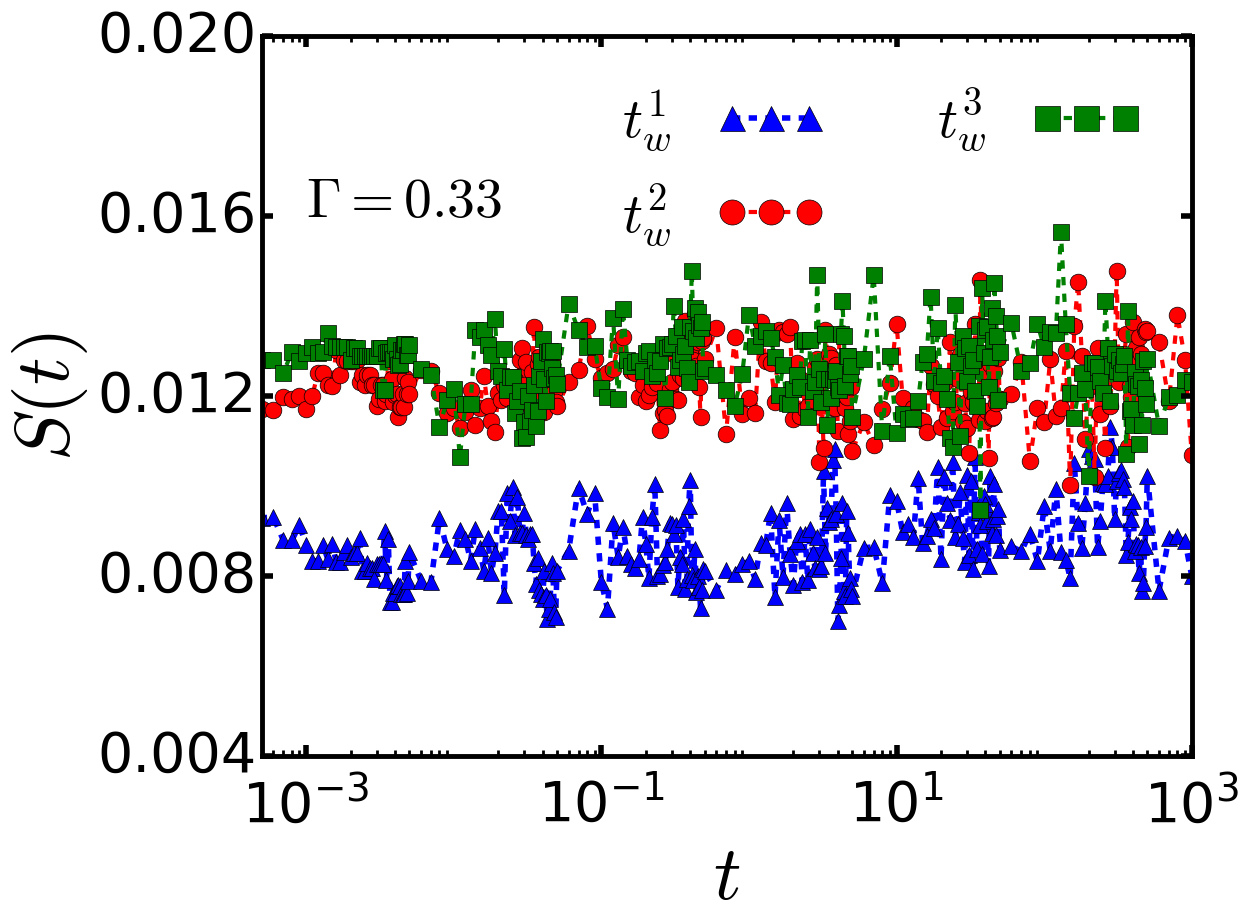
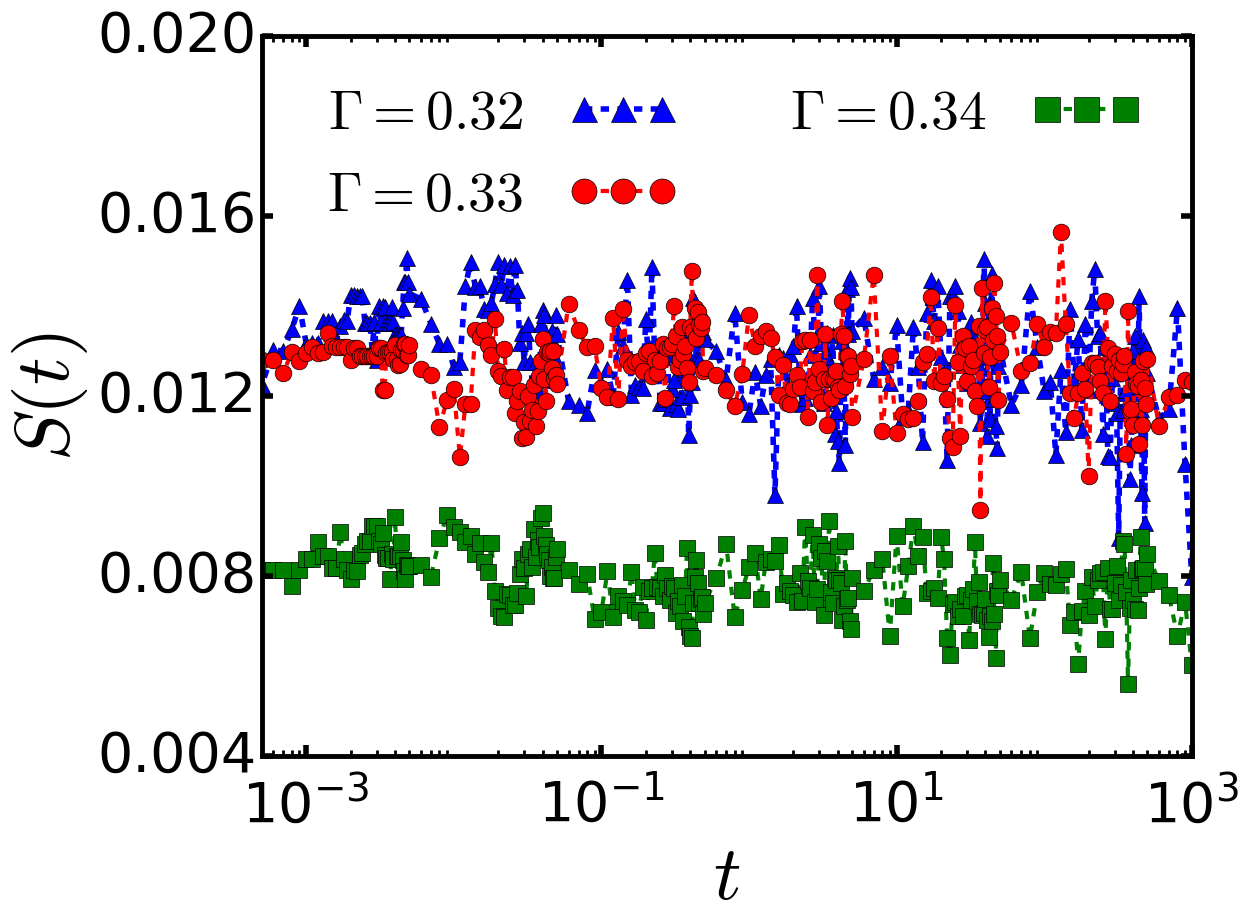
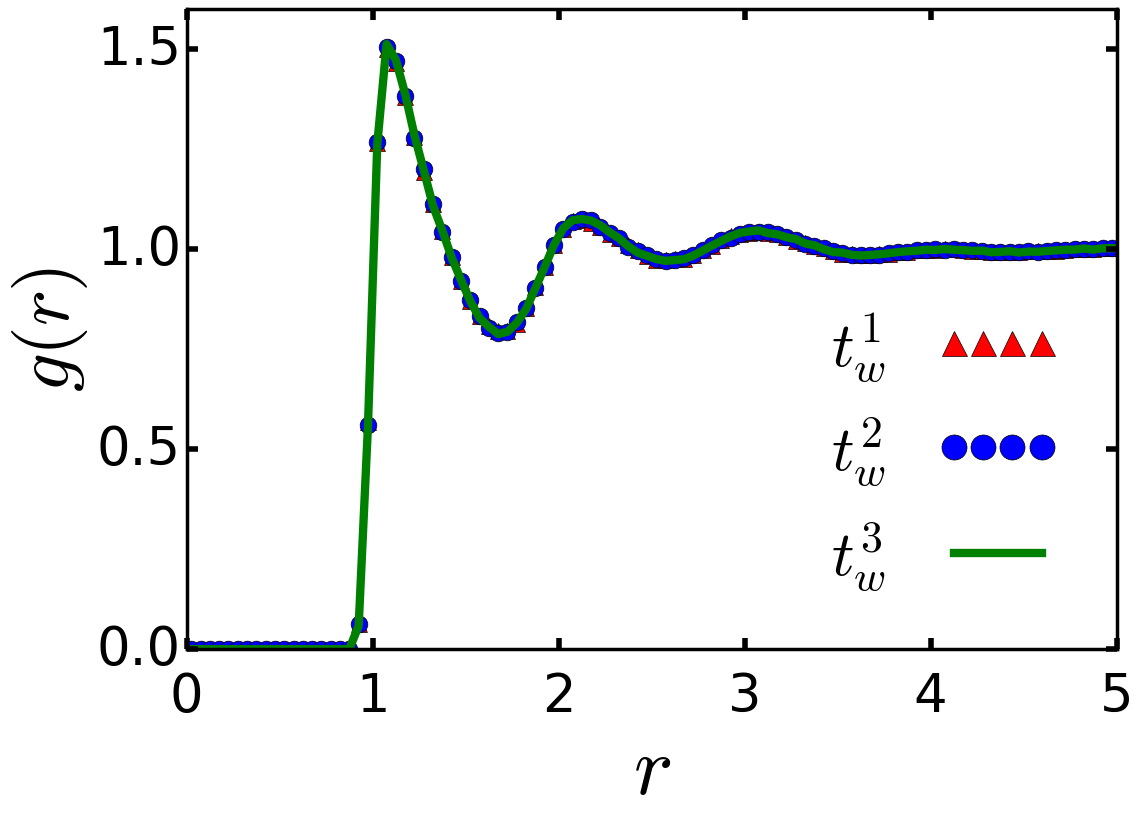
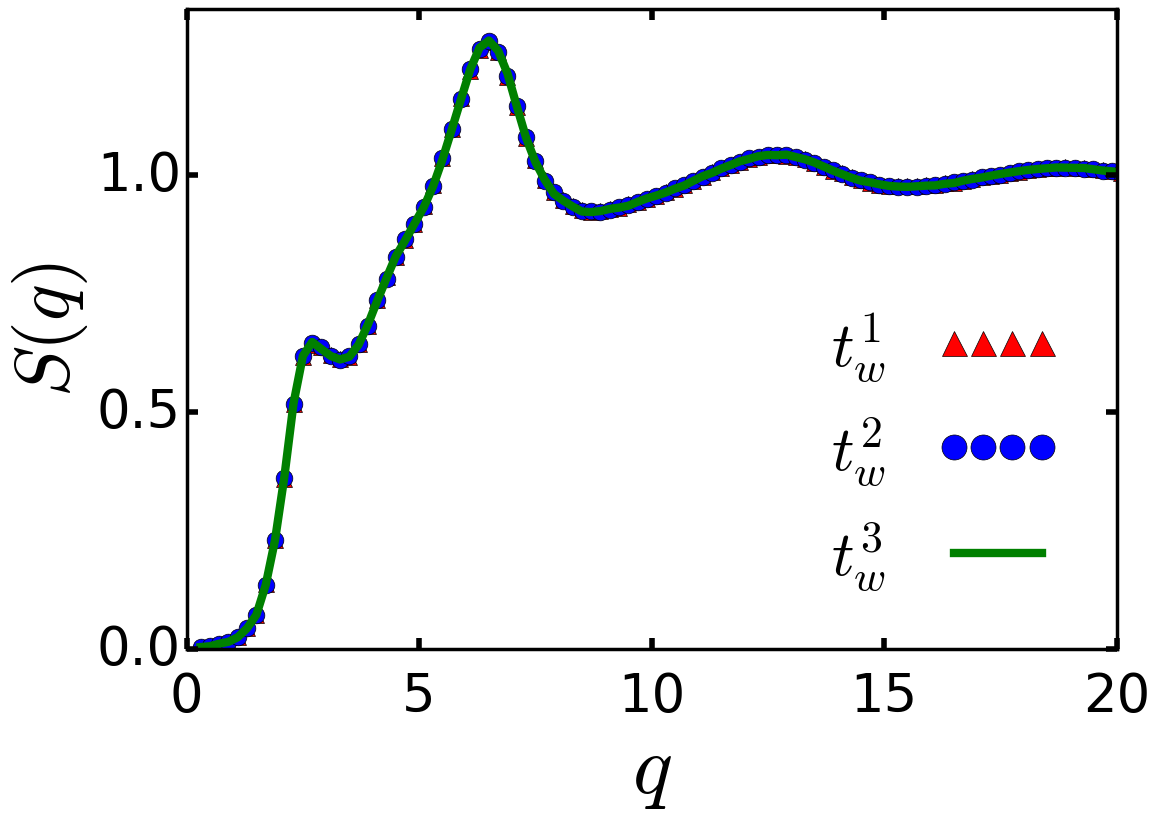
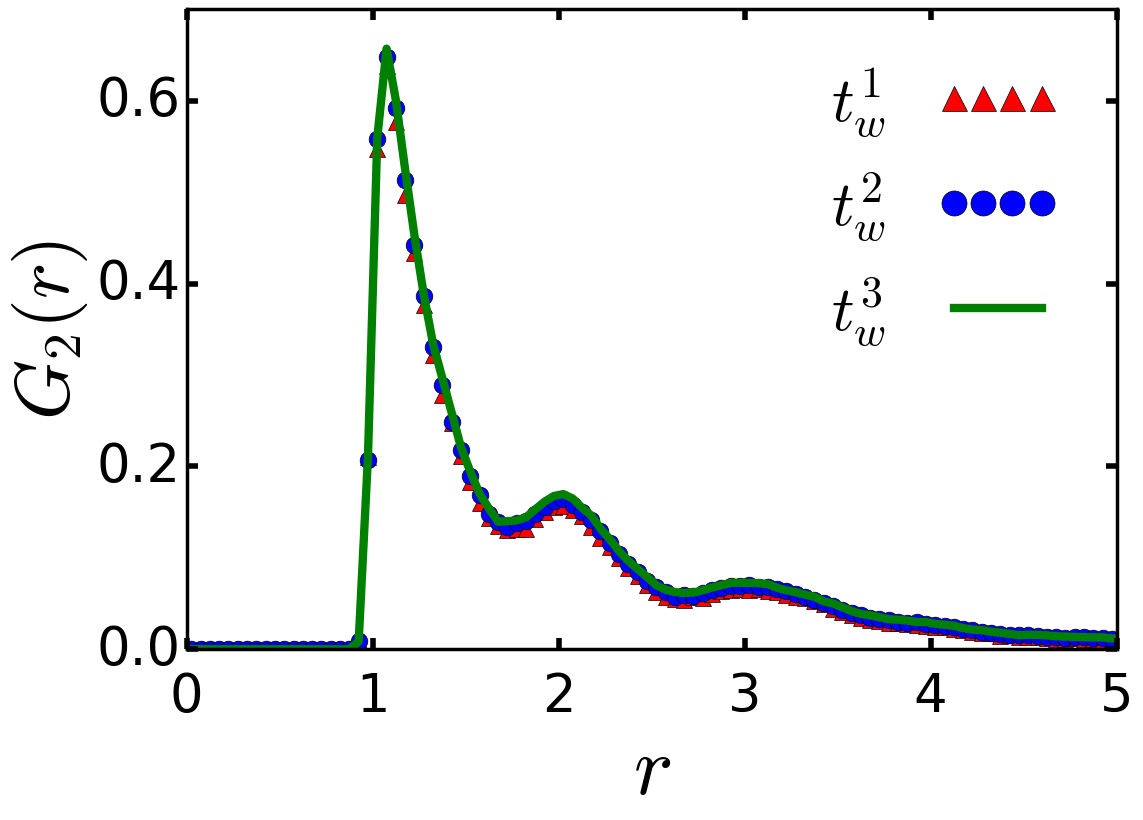
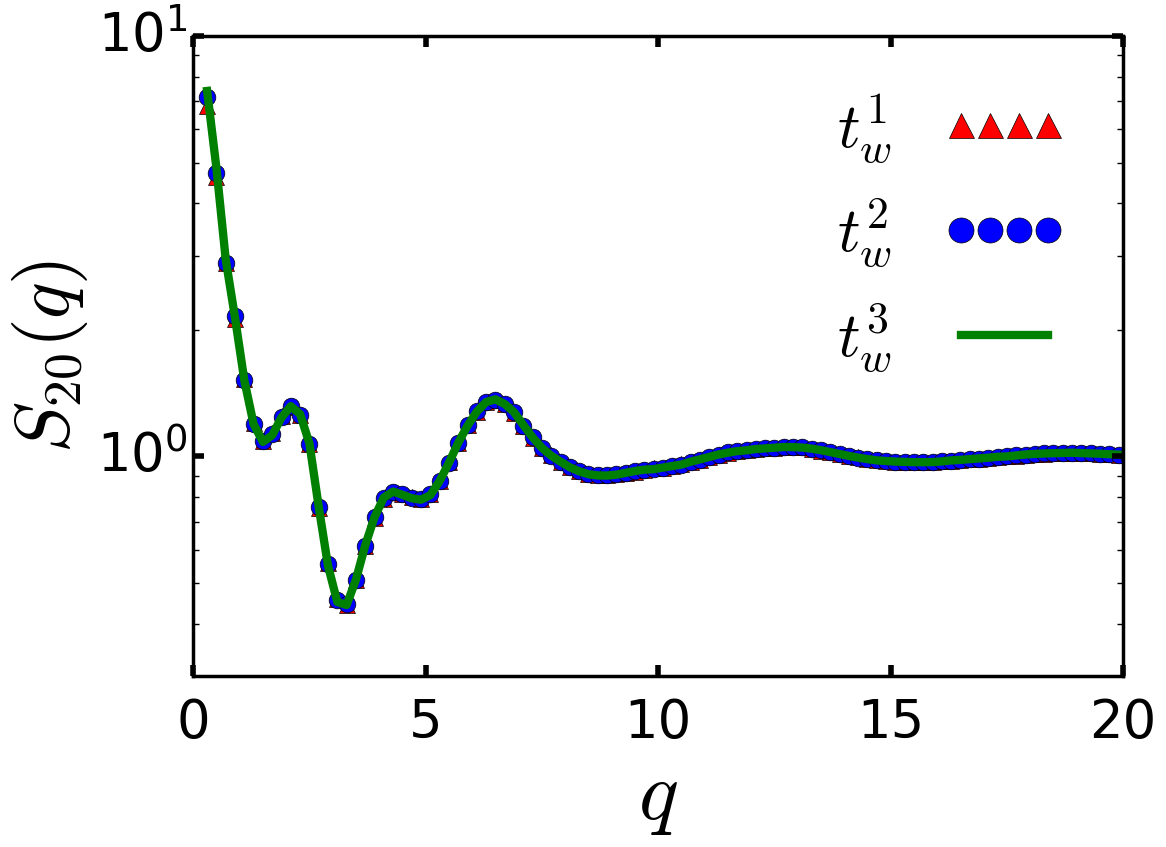
At the liquid glass densities, the anisotropic system becomes arrested in a metastable state identified by a plateau in the translation correlation functions such as and another plateau in the rotation correlation functions such as . The possibility that at such high densities the system might develop long range translation and orientation orders at the same time, viz. enter the crystalline phase, can be inspected by looking at the structure functions in Fig. 7. The meanings of , and in the figure refer to the waiting times for every plot to be produced in the simulation with where . This convention is adopted for Figs. 7 to 10. Looking at the curves in Fig. 7, one can observe the lack of long range translation and orientation orders. In particular, goes to zero as increases which is a sign that the degree of alignment in the system at is neither nematic nor crystalline [45, 46]: Absence of crystallinity is obvious from the plots of , , and in Fig. 7 in the three different simulations (three different waiting times). An interesting feature at small wavevectors is a small peak in at which results from the emergence of the orientation correlations characterized by two distinct peaks in at and . This is reminiscent of the short range orientation order in the plot of of the nematic phase in Fig. 4. These two distinct peaks in indicate that the development of the nematic phase is hindered by the slowing-down of the glassy dynamics. The scalar nematic order parameter for the three waiting times is shown in Fig. 8. It is obvious that there is no substantial nematic order in the three simulations. Probing the structure of the glassy state only does not enable us to identify the glass state. From Fig. 7 one cannot confidently distinguish between the structure of such a glassy state and the structure of the isotropic fluid discussed above. This aspect is typical of glassy systems. Hence the dynamics of the state need to be discussed to obtain a conclusive explanation.
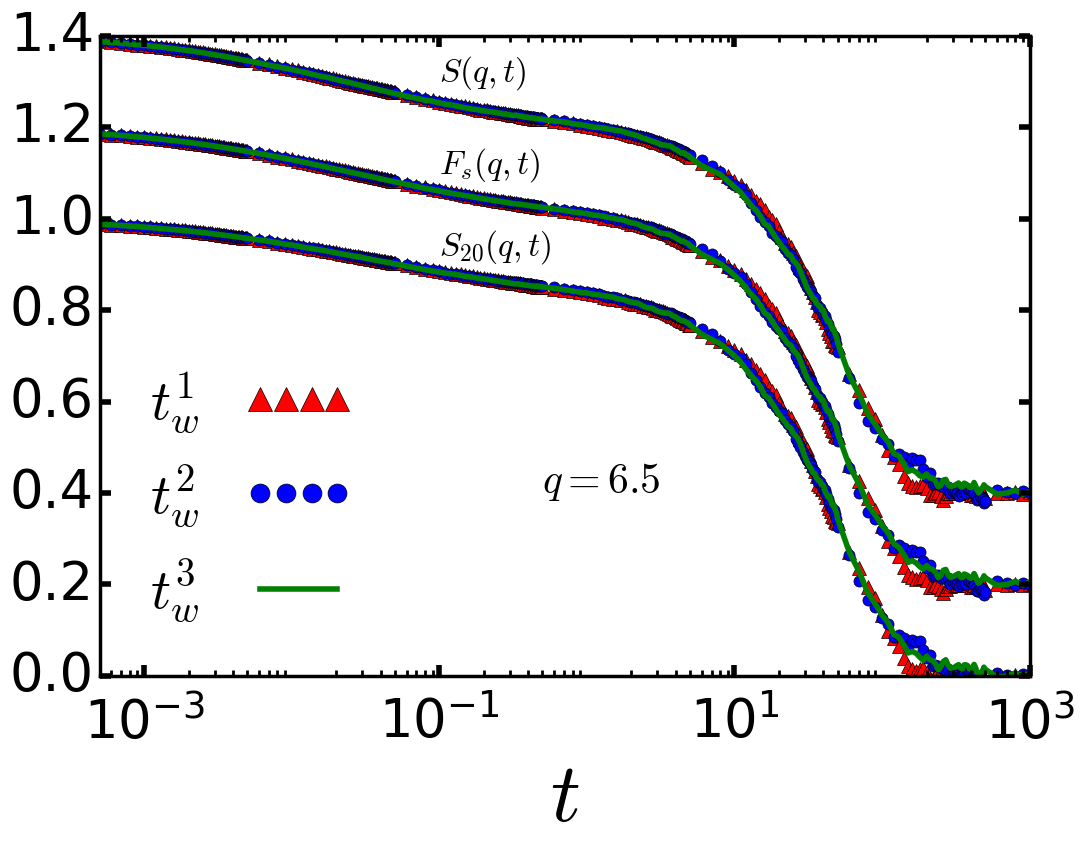
Concerning liquid glass dynamics, first the translation correlation functions shall be discussed. Fig. 9 shows the plots of the dynamic structure factor , the self intermediate scattering function , and the dynamic orientation structure factor . These functions are computed for the wavevector of the main peak in the structure factor as it can be seen in Fig. 7. It is clear that these functions do not show aging in the three simulations, viz. for the three waiting times. Interestingly, the translation dynamics illustrated in Fig. 9 behaves as the dynamics characterizing the supercooled hard-sphere fluid. After the initial diffusive regime, the dynamics relaxes slowly onto a fairly flat plateau and then decays below it. This functional form can be seen in the three translation correlation functions. The plateau is a clear signal of the existence of a cage. The final decay takes the form of a stretched-exponential curve with an initial power-law decay. It describes that the particles leave the cages which impede their translation motion for some intermediate time; see Sect. V.3 for more detail.
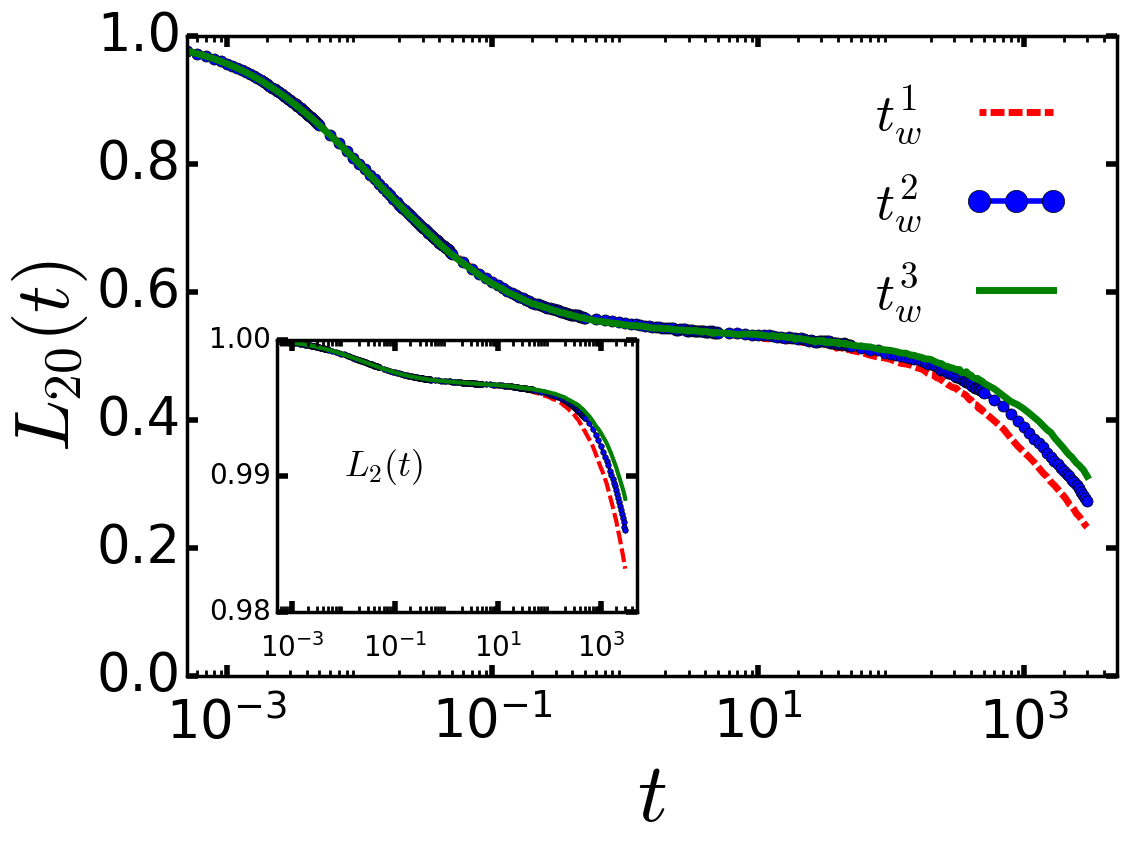
The orientation correlation functions exhibit a different type of dynamics. Figure 10 depicts how the orientation correlations evolve in the simulation. The figure shows . Because of their high plateaus, low orders of do not give indications for two step relaxation. As an example the plot of is shown in the inset of Fig. 10. The reason for this is the tight arrest of the rotation motion of the ellipsoids. Hence, a higher order rotation correlation function () is required in order to resolve it. It is obvious from the figure that the ellipsoid rotation dynamics decay from the initial diffusive regime onto a plateau due to an angular cage which arrests the rotation motion. Later, the system dynamics fail to follow the relaxation decay. The aging phenomenon causes the particle rotation dynamics to relax which is different from the case of the translation dynamics. The longer the simulation, the longer the plateau lives, which means that the particle orientations are arrested for longer times. The aging indicates that the system always finds a new metastable liquid glass state which has a deeper minimum in the free energy landscape of the system. While the orientation correlations are not able to relax, the translation dynamics has already relaxed much earlier around (see figures 9 and 10). The lifetime of the translation plateau is around two decades (and it is followed by a final relaxation), whereas the lifetime of the orientation plateau is around three decades. Hence, the observed type of cage is an orientation cage which allows the translation degrees of freedom to decorrelate but arrests the orientation ones. This confirms an assignment of the state as a liquid glass since the ellipsoids can move while their orientations remain arrested. The height of the plateau and the tightness of the cage will quantitatively be discussed in the framework of mode coupling theory for the glass transition in section V.3.
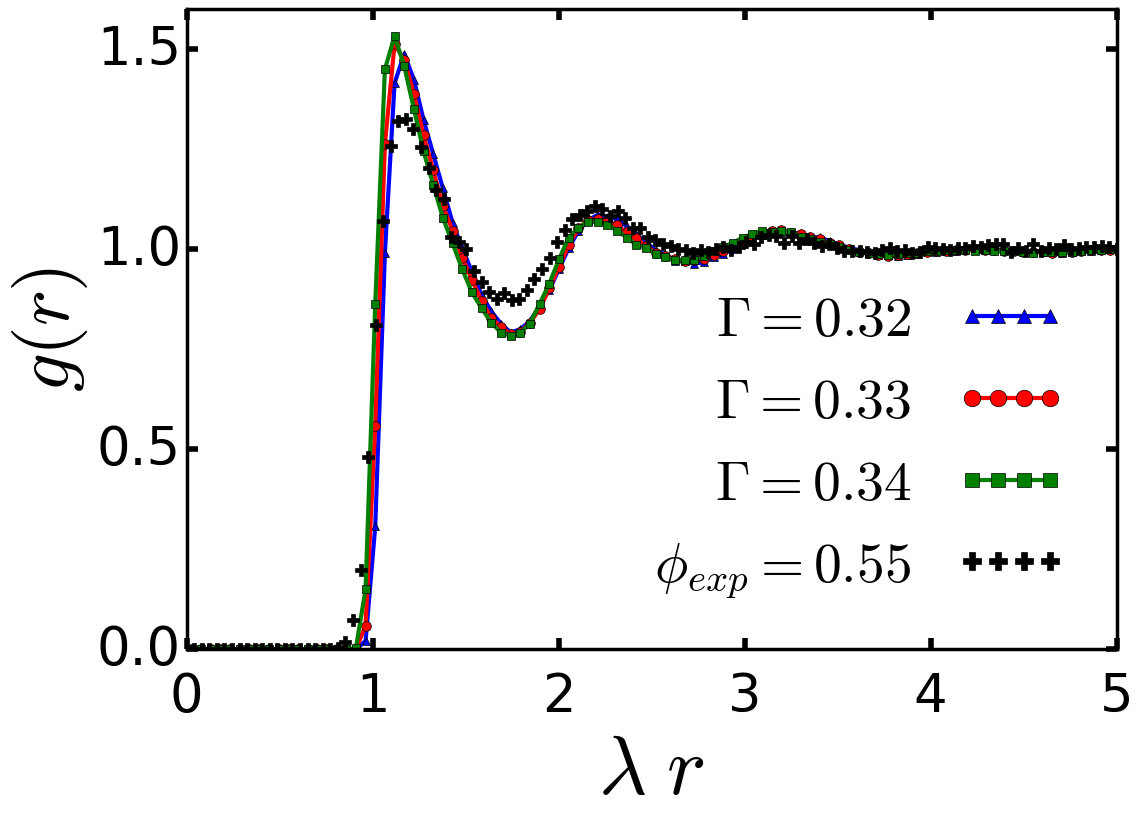
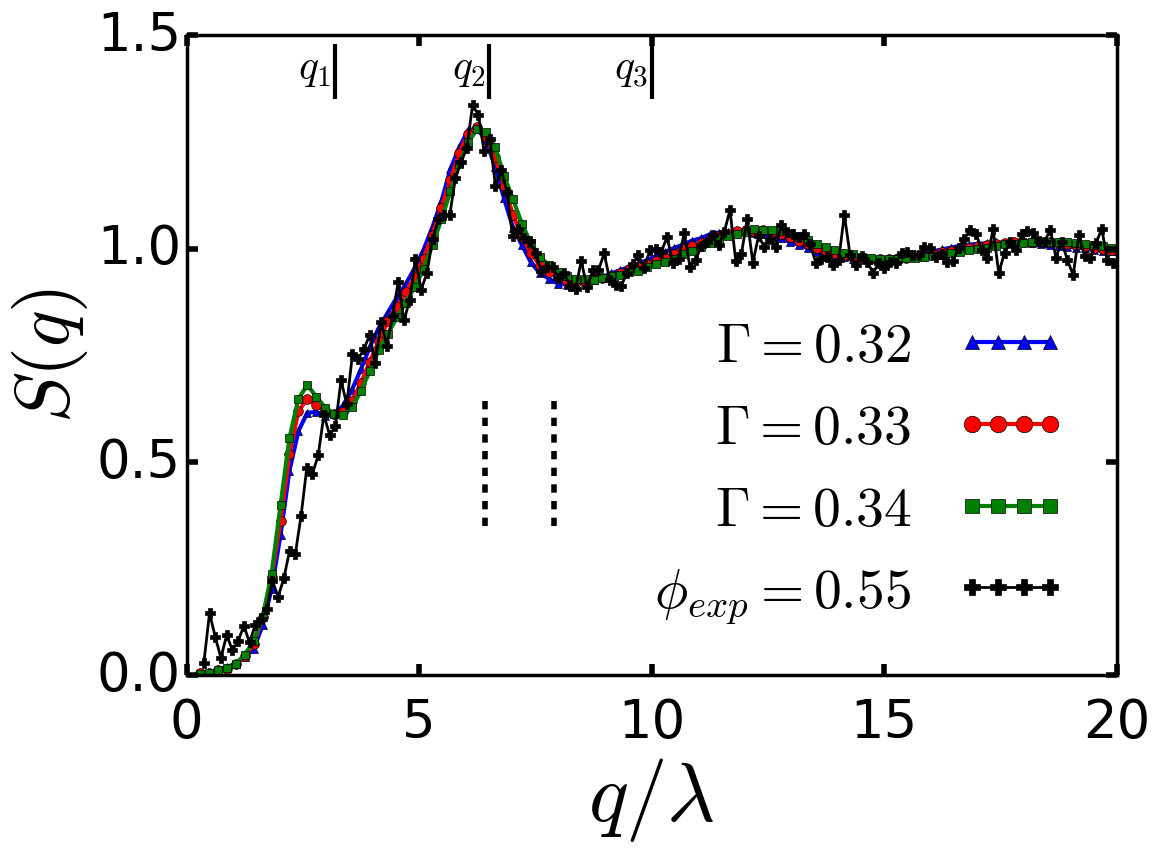
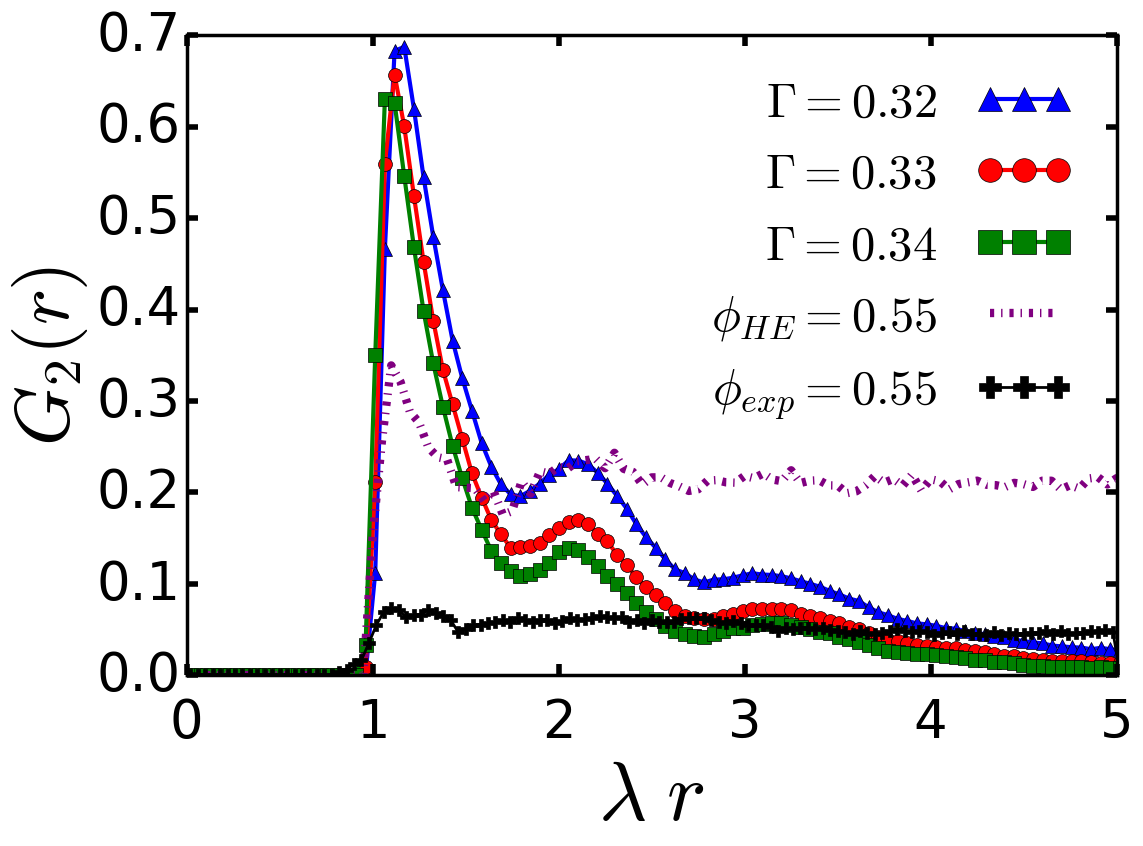
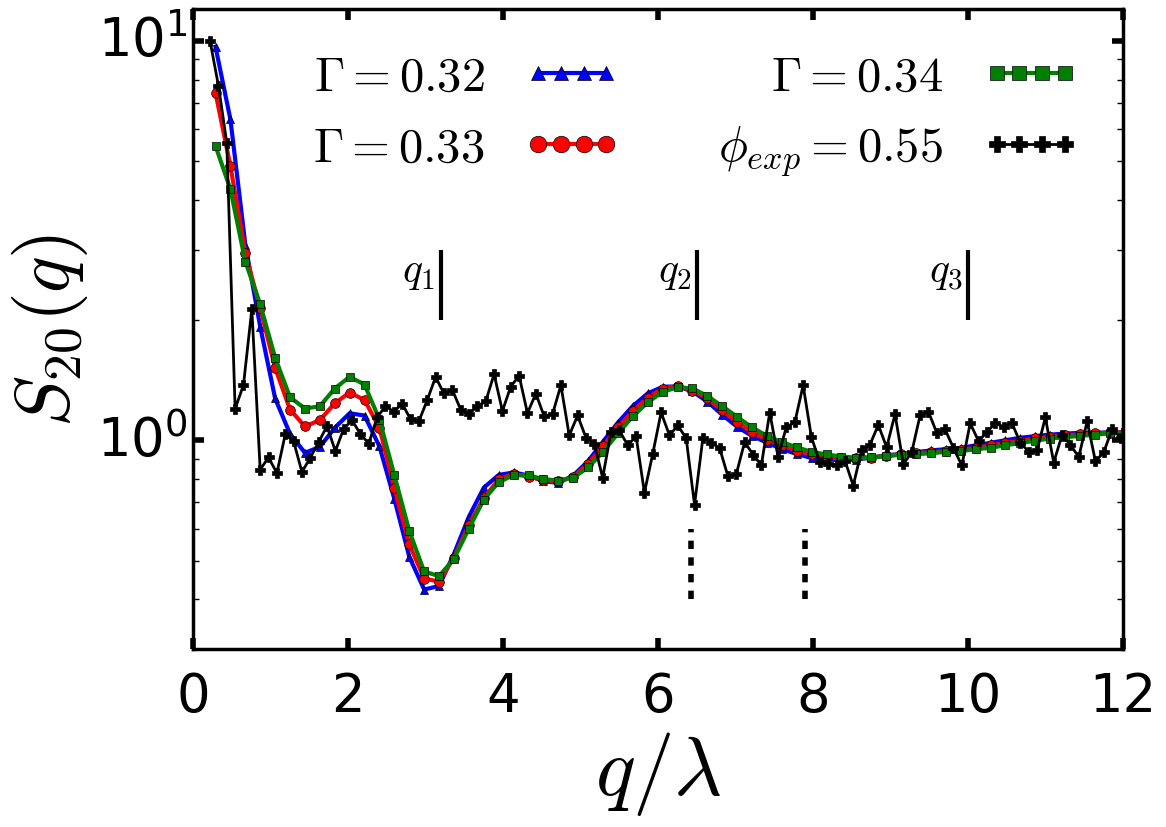
It is of interest to study the liquid glass at different densities. Figures 11 and 12 clarify the static structure functions of the liquid glass at different densities. In these figures the available experimental data are plotted. In the experiment, liquid glass was found at a volume fraction . As before, the factor has the same meaning as in the isotropic phase in section V.1, but here its best value for mapping the soft-ellipsoid liquid glass to the hard-ellipsoid liquid glass is . This value suggests that the effective size of the soft and hard ellipsoids seems to be almost identical. The fact that both systems are at such high densities makes the packing constraints more important and similar, which results in . This agreement can be checked from the plots of the functions and in Fig. 11, which agree except for the small peak at in the structure factor in the simulation. This small peak indicates that there is a weak short-range translation order at this length scale in the soft-ellipsoid fluid. This weak translation order in the simulation cannot be observed in the plot of the experiment (a weak indication of a shoulder can be noticed, however). It is directly related to the short range orientation order seen in the simulation plots of for the three densities; see Fig. 12. The two peaks in the simulation plot of at are a clear signal of the important role played by the ellipsoid softness discussed in the previous section. This short range orientation order is not seen in the experiment which reflects the fact that the orientation structure in the simulation does not exactly match the orientation structure in the experiment. A possible explanation for this is that the procedures of quenching the fluid into the liquid glass are not identical in simulation and experiment. In addition the ellipsoids in the experiment have some degree of polydispersity which clearly influences translation and orientation structures at short length scales. Another point to note in the simulation plot of is that its small wavevector limit decreases when the density increases. This is due to the fact that the isotropic-nematic transition density is further away at higher densities. Finally, the plot of in Fig. 12 shows that the liquid glass state does not show any kind of global nematic order and that even the local nematic order becomes weaker as the density increases. This weakening of the global nematic order on increasing the density can also be observed in the global order parameter shown in the lower panel of Fig. 8. Figure 12 includes the of hard ellipsoids from the experiment and from the EDBD simulations of small systems [15]; the latter show local alignment somewhat weaker but comparable to the soft ellipsoids, and otherwise are in a nematic state at the volume fraction where the dispersion forms a liquid glass. The measured in the dispersion is very weak presumably for the reasons mentioned above when discussing .
The dependence of liquid glass dynamics on the density is illustrated in figures 14 and 13. Figure 14 only contains simulation curves of the functions and at which is the unscaled location of the main peak in the simulation structure factor . The dependence of the translation dynamics on the density only appears during the lifetime of the cage for every dynamic function ( or ). Unexpectedly, the translation correlations increase when the density increases only at timescales starting at the -relaxation regime until in the -relaxation regime. After that, the density dependence disappears and the translation dynamics for the three states , , and behave identically, being characterized by a common timescale. This last finding does not agree with the MCT expectations since MCT predicts that the relaxation timescale becomes longer when the density becomes higher [19, 8, 15]. However, some MCT predictions can still be seen, e.g. the increase of the plateau height as the density increases. In this context it is relevant that MCT considers the relaxation of an equilibrium fluctuation while the simulation records relaxations starting from a metastable state obtained after quenching.
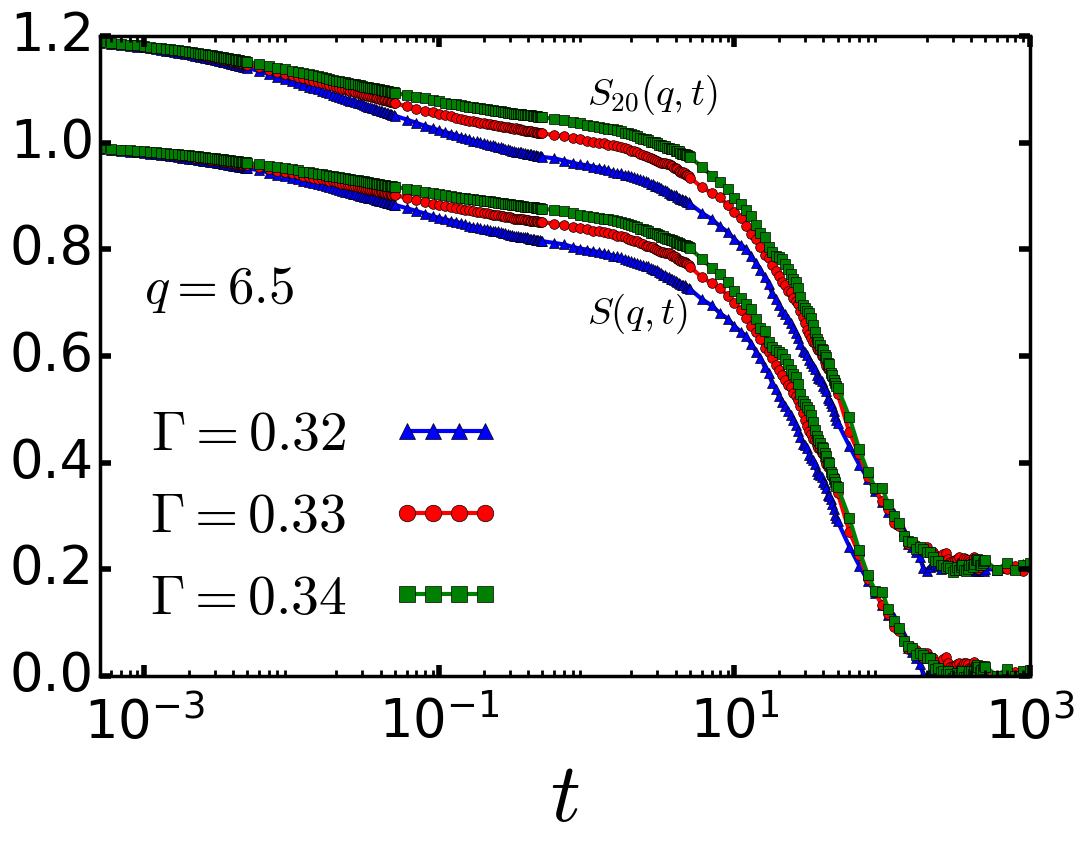
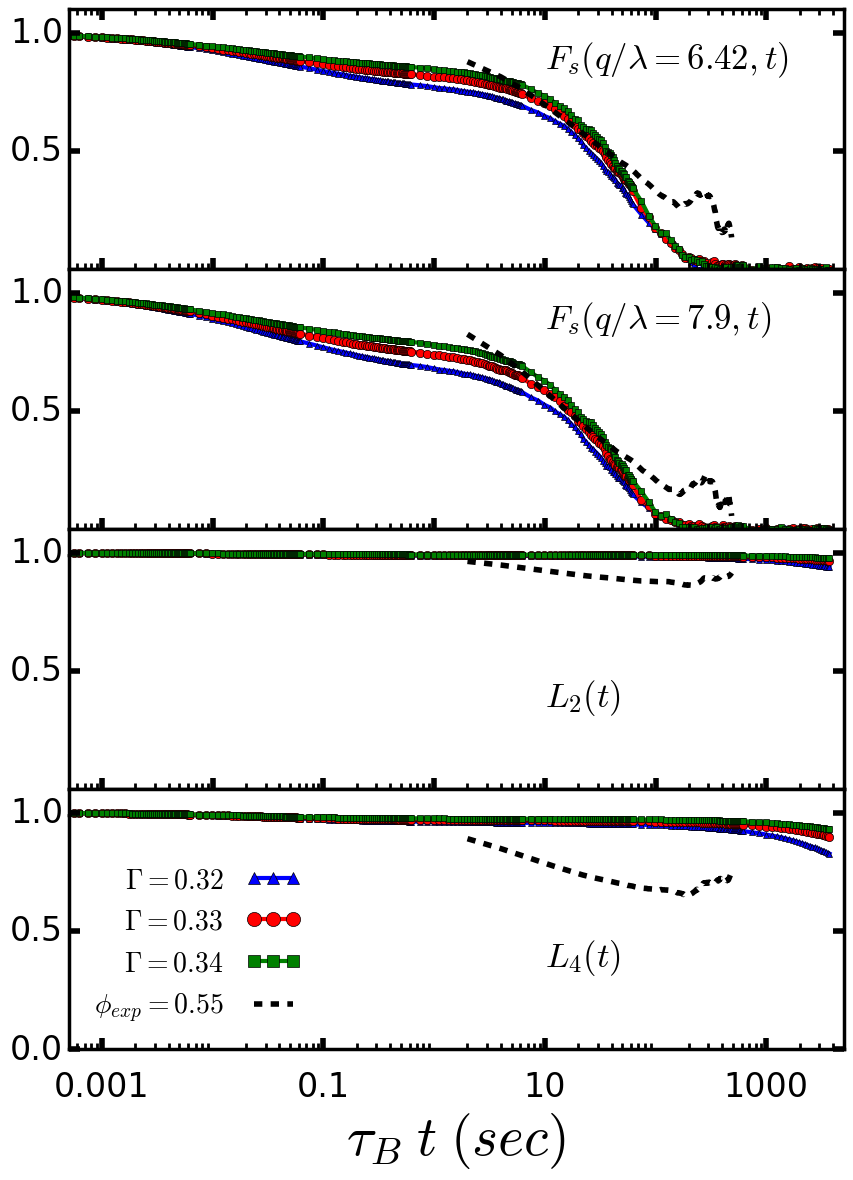
Figure 13 shows the comparison between simulation and experiment in terms of the translation dynamics illustrated by and and the rotation dynamics illustrated by the functions and . The experiment could only probe the long time dynamics of the correlation functions in this case. The wavevector corresponds to the peak of the structure factor in Fig. 12 (the two wavevectors just mentioned are marked by the two vertical dashed lines in the plot). The behavior of the dynamics of the function in the simulation is the same as the dynamical behavior of the functions and when it comes to the density dependence and the MCT predictions. Figure 13 shows the best mapping in the dynamics when of the simulation is mapped at onto the experiment at . Both are liquid glass states. The Brownian timescale in this mapping is which is much smaller than the Brownian timescales in the isotropic phase. The reason why the liquid glass Brownian timescale is much smaller than the Brownian timescales in the previous section ( and in fluid states at and , respectively) could be that at high densities the effective particle distances are smaller and thus the relevant energy scale in the soft-potential is higher. Consequently, the corresponding collision rate would be higher and the particles would diffuse faster.
The close agreement observed in the translation dynamics is not seen in the orientation dynamics as the functions and illustrate. In the experiment, these two functions decorrelate to a lower value earlier than in the simulation. This is obvious from the decays of and in the experimental data around the timescale while the decays of and in the simulation occur at much later timescales which cannot be observed in the time window of the two panels in Fig. 13 anymore. The reason for the lower correlation at longer times in the experiment presumably is the inevitable noise in the experimental environment which was also seen in the isotropic dynamics in Fig. 5. Importantly, however, also the experimental dynamic functions show the absence of a final relaxation of angular correlations. At all of the densities and in the translation and orientation dynamics of the liquid glass, we observe that the rotation correlation functions persist at least two decades longer than the translation one.
Finally, it is expedient to check how the nematic order changes as a function of the number of ellipsoids that form that nematic order. To this end, the simulation boxes are divided into a certain number of sub-boxes where each sub-box contains some number of ellipsoids. Then the nematic order parameter is computed in each sub-box and these values are averaged over the number of sub-boxes. The idea is to choose different numbers of sub-boxes leading to different numbers of particles per sub-box (or per cluster). Thereby, the average nematic order on different length scales is computed. Figure 15 clarifies how the magnitude of the nematic order changes as the number of particles per box increases (or as the number of sub-boxes decreases) for several densities. The figure shows that for all densities there is some varying degree of nematic order when the cluster contains a small number of particles. Once the particle number per cluster starts to increase, the nematic order in isotropic and liquid glass states starts to disappear quickly while the nematic order in the liquid crystalline states stays significant. This clearly proves the absence of compact nematic domains in liquid glass. For the nematic states (at ), there is a drop in when it is calculated in the total simulation box. This indicates some domain structure which would require even longer simulation runs to homogenize throughout the system; thus the value of for the eight-subbox system (average number of particles ) is used when comparing to and in Figs. 3 and 6, respectively.
V.3 MCT Analysis
Mode Coupling Theory (MCT) is the only microscopic theory to predict correctly many aspects of the structural relaxation close to the glass transition [19, 53, 8]. It is based on solving the equations of motions for the correlation functions describing the dynamics of molecular fluids. The main input of the theory is the static structure factor of the fluid under study. Here, we mention the parts of the theory most relevant to our work. According to Franosch et al. [53], the MCT predicts the time evolution of all correlation functions according to the following MCT solution
| (18) |
where the positive sign refers to a glassy state, e.g. the rotation dynamics in liquid glass, while the negative sign refers to a fluid one, e.g. the translation dynamics in liquid glass. The label becomes (which refers to a wavenumber) when considering the translation dynamics. It becomes the Legendre-polynomial degree when considering the rotation dynamics. The other quantities in Eq. (18) are the -scaling function , which obeys [19, 53]
| (19) | ||||
| (20) | ||||
| (21) |
for short and long rescaled times, respectively, and the correction functions
| (22) | ||||
| (23) |
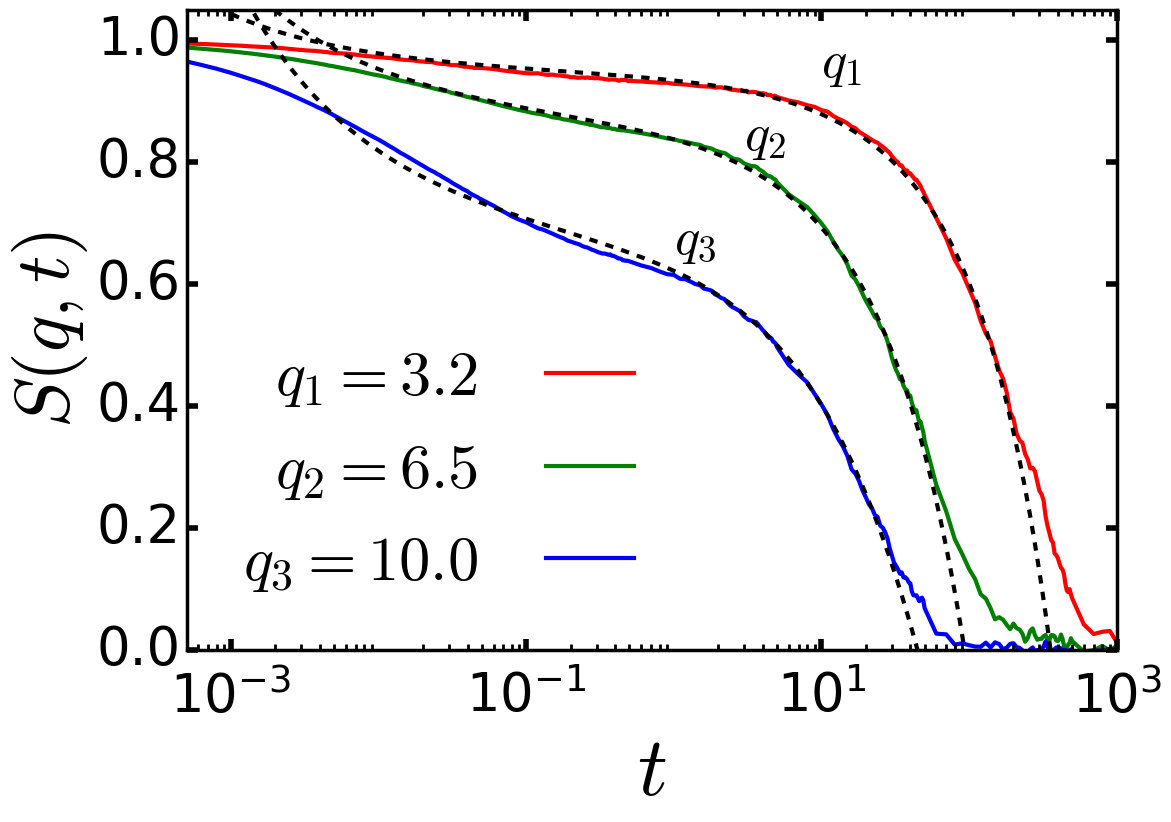
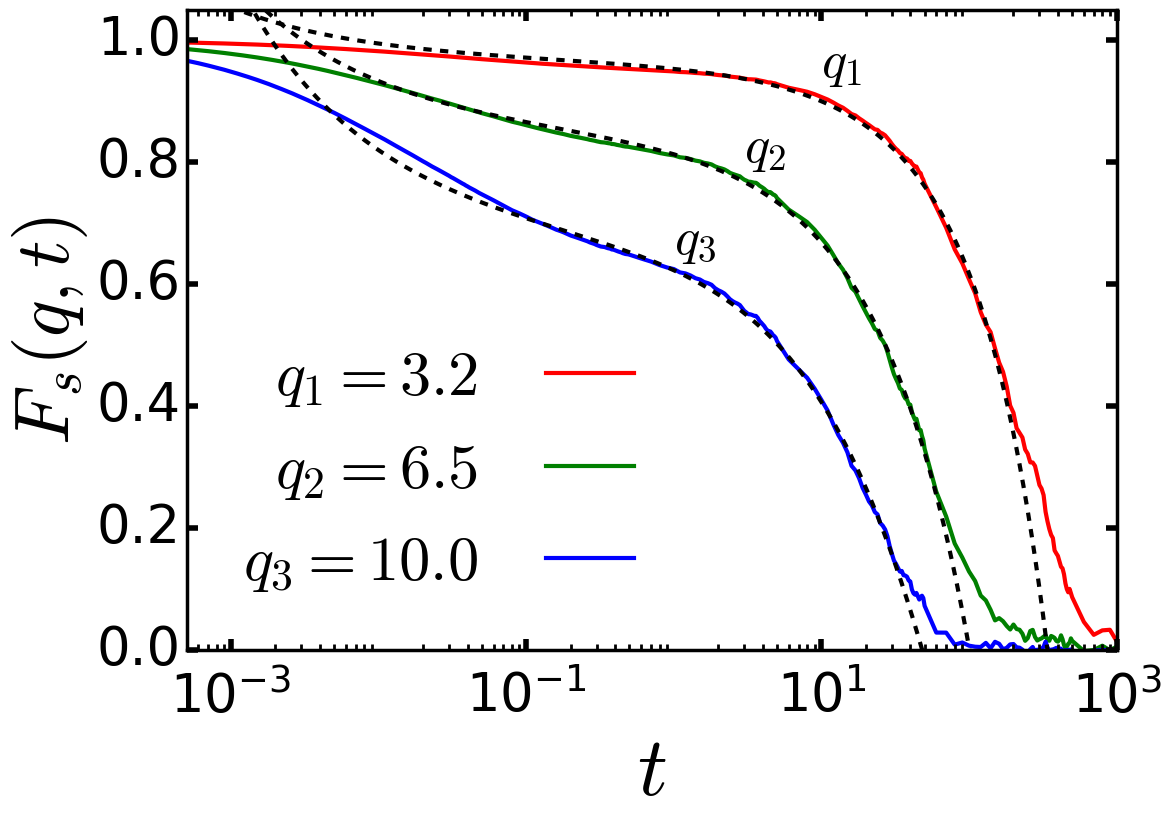
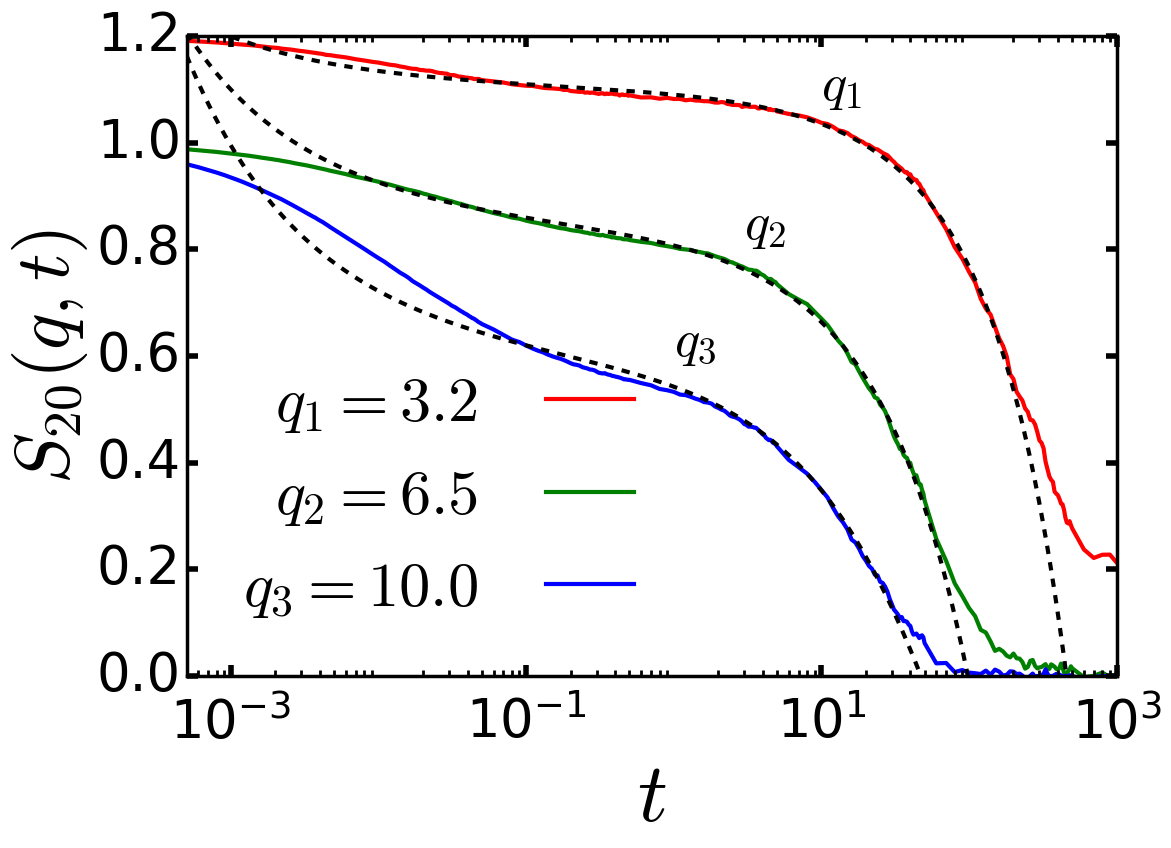
These functions and parameters depend on the specific glass transition considered and hold for all correlators [53]. The amplitudes and are -dependent. gives an approximate estimate for the nonergodicity parameter at the singularity point (the glass transition density) while estimates the tightness of the cage arresting the dynamics. As we have two types of dynamics, we assert that there are two singularity points. The first is the rotation glass-transition density (or the fluid to liquid-glass transition density) labeled as . The second singularity point is the translation glass-transition density labeled as ; it leads from liquid glass to (regular) glass [15]. According to MCT, using the density as a control parameter, the liquid glass appears before the translation glass (). We call all other parameters in the MCT solution, Eq. (18), the fitting parameters. The separation fitting parameter is defined as , where is a singularity point at which the MCT solutions bifurcate (). is some constant, and the scaling time is given by where is a system-specific cross-over time. The remaining parameters depend on the correlation function, and their values will be mentioned below. We implement the MCT analysis at the liquid glass density since it exhibits a time-dependence close to the experiments. Figure 16 shows the results of the best fits of the translation dynamics to the translation part of Eq. (18) at . Figure 17 shows the best fits of the orientation dynamics to the orientation part of Eq. (18) at the same density.
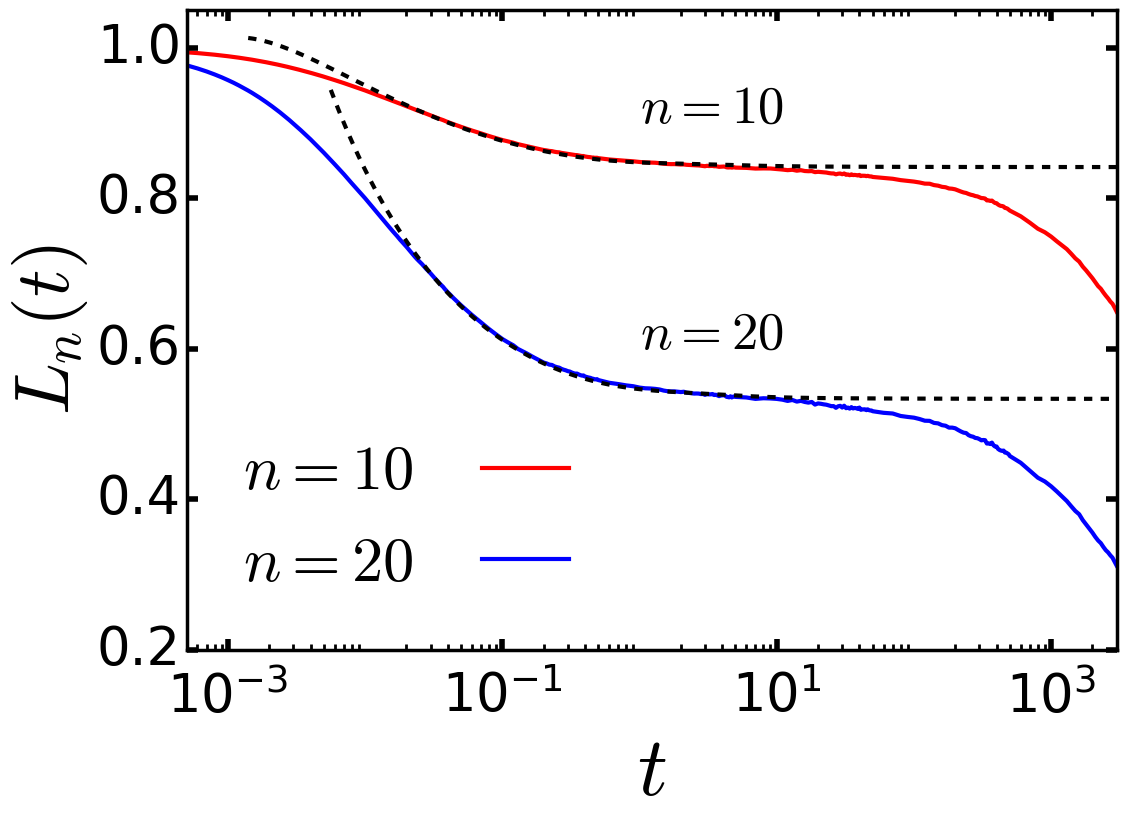
For analyzing the translation correlation functions, the fitting parameters are set equal to the ones for the supercooled hard-sphere fluid [53] except for the exponents ( and ) and the parameter , whose values are found to be different. Therefore, the translation-dynamics fitting parameters are , , , , (leading to ), , and (corresponding to according to the MCT exponent relation [19]). For the analysis of the rotation dynamics, the best fitting values are found to be , , , , and . For the rotation-dynamics analysis the value is still the values of the supercooled hard-sphere fluid. The amplitudes and in the MCT solution Eq. (18) are discussed in details below. On the other hand, the amplitude takes small values and contributes to the MCT fits by improving the values of the correlation-function plateaus by at most.
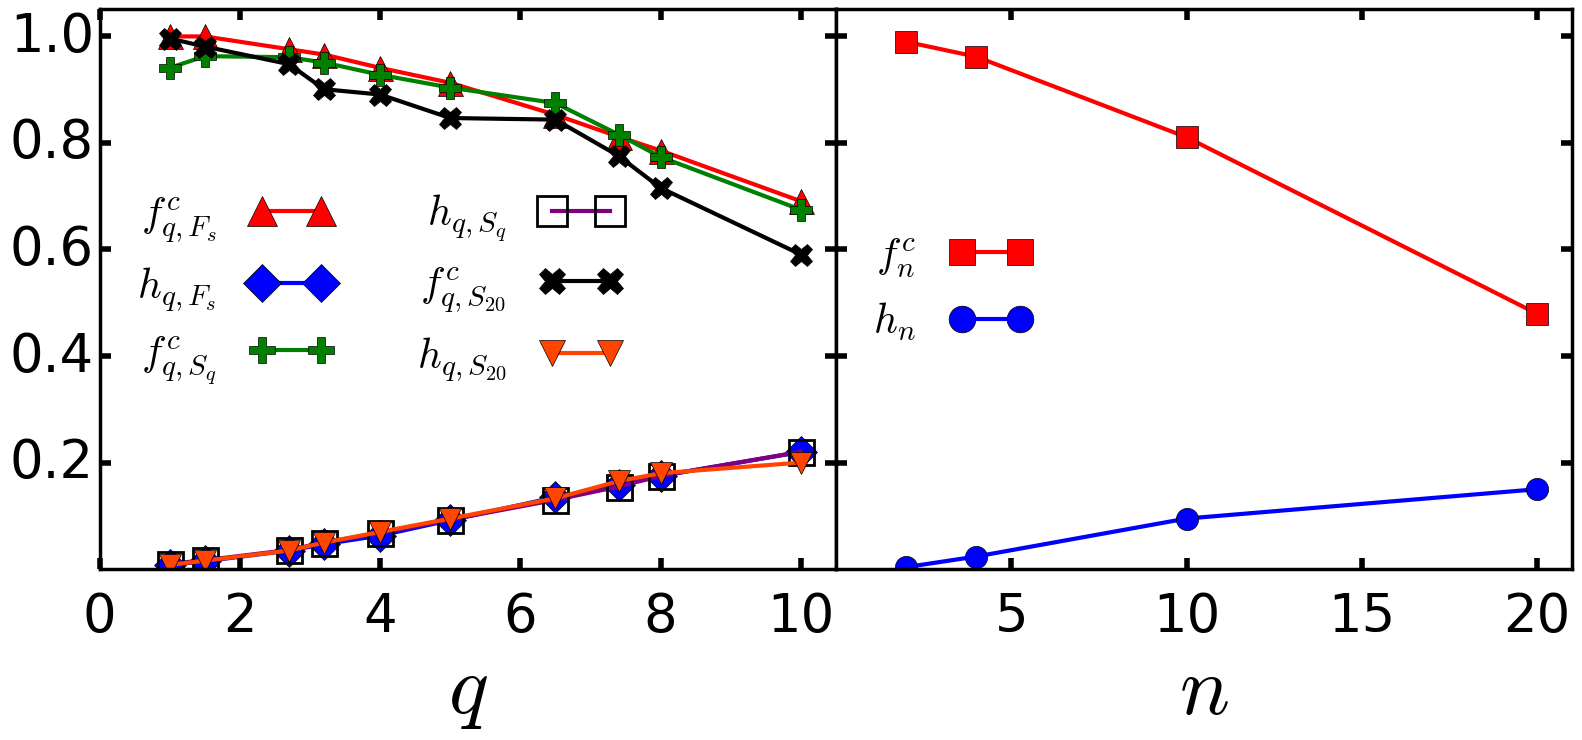
The exponents and are universal, meaning that they are the same at all length scales while fitting the translation correlation functions (Fig. 16). They are different for the orientation correlation functions but are constant at all Legendre orders while fitting the orientation correlation functions (Fig 17). From Fig 16 we can notice that the translation correlation functions show agreement with MCT predictions around the turning point at the end of the plateau region () until some late timescales in the relaxation regime, depending on the length scale we observe. Specifically, the MCT solution shows more agreement with the soft-ellipsoid translation dynamics at small wavevectors (note the curves at and in Fig. 16) than the translation dynamics at the large wavevectors (note the curve at in the same figure). The discrepancy between theory and simulations at the large wavevectors lies in the relaxation process. It is noteworthy that the long time decay in the translation dynamics is slower than predicted by MCT. It is expected that the discrepancies become smaller when the translation glass transition is approached, i.e. when moving closer to the translation bifurcation point of the MCT labeled as . The values of the nonergodicity parameters and the critical amplitudes at different length scales are shown in the left panel of Fig. 18. The nonergodicity parameter gives an estimate of the frozen-in amplitude in the respective translation correlation function at the translation-glass singularity . The decrease of values with the increase of the wavevectors indicates that the translation glass structure allows more motion at smaller length scale. The critical amplitudes for the three translation correlation functions are almost identical. This means that the tightness of the cage estimated by the three translation function at a certain wavevector is almost equivalent. The values increase as the wavevectors increase indicating that the glass structure of the ellipsoids gets arrested by a rather tight cage. Neglecting quantitative differences and because most of our fitting parameters were taken from the ones of the supercooled hard-sphere fluid, we find that the translation dynamics of the soft-ellipsoid liquid glass state behaves similarly to the translation dynamics of the supercooled hard-sphere fluid.
The fits of the orientation dynamics depicted by in Fig. 17 are discussed for two different orders and . The higher the order, the weaker the orientation correlation becomes with time (even in liquid glass). It is clear from the figure that the MCT solution agrees with the dynamics in the -relaxation regime. The solutions do not show any agreement with the curves in the region where the aging-relaxation starts (). The fact that at a comparable time for all no agreement between the MCT solution and the curves can be found any more, is a signal of the break-down of the theory. The simulations clearly showed the aging of the orientation dynamics; see Fig. 10. Here, we analytically assert that the cooperative rotations within their orientational cage in the liquid glass state at move according to the MCT intermediate-time dynamics of glass. The nonergodicity parameter and the critical amplitude are shown in the right panel of Fig. 18. The value of gives an approximate value for the parameter at the rotation singularity point . The values become smaller when the order increases. This tells that the orientation correlation becomes weaker when the rotation correlations are probed more locally. The critical amplitude illustrates how much the cage affects the orientation dynamics. At higher order , the orientation cage of the ellipsoids exhibits larger motional amplitudes.
VI Conclusions
We performed large scale Brownian dynamics simulations of ellipsoidal particles (at aspect ratio 3.5) including dense systems quenched into a partially arrested isotropic state. It is the first realization in simulations of the recently discovered liquid glass state. Based on our time- and wavevector-windows that appreciably extend the experimentally accessible ones, we tested the predicted decoupling of translation and orientation motion. Glassy arrest of the angular correlations was evidenced by observing aging, while translation correlations relaxed in (supercooled) equilibrium and at least a factor of one hundred faster. Our simulation results compare well to the experimentally measured structure and to the translation motion in the colloidal dispersions where liquid glass was first observed [15]. While the long-wavelength static orientational correlations agree between simulation and experiment, the local alignment of the elongated particles showed differences. Presumably as a consequence, the time-dependent orientational correlations agreed in their final relaxation or when arresting, but showed differences for shorter times. In the simulations, angular correlations remained higher for longer. By a detailed analysis of the power-law relaxation in the intermediate time dynamics, we tested whether mode coupling theory correctly describes the diffusion and orientation dynamics of the liquid glass state. Overall we found good agreement of the time-dependent structural functions over typically four orders in time-variation. (Note, that we ignored the failure of microscopic MCT that its glass transitions are rounded [19] and that translation motion in liquid glass exhibits a small non-ergodic amplitude [8].) In the orientational dynamics we could only test the decay onto an intermediate time plateau because the final aging-induced relaxation is beyond the theory. Quenching into metastable states did not allow us to explore the change of the dynamics inside the liquid glass states as predicted by theory. Quenching to final glass states at higher effective density did not slow down translation motion. Presumably, the system falls out off-equilibrium during the quenching process in a way not affected by the final density aimed for.
The strong orientational fluctuations that we recorded in the static angular structure factor support the prediction by Letz, Latz and Schilling [8], that liquid glass originates in nematic fluctuations, which become the entities of the mutual hindrance and of glassy arrest. During liquid glass formation, the local alignment of ellipsoids gets frustrated on intermediate length scales and gives ramified structures, viz. differently oriented clusters. The emerging nematic precursors contain more and more particles, and it is the mutual obstruction of such cooperative regions that leads to the formation of liquid glass. For future work it would be interesting to study larger simulation systems and and include hydrodynamic interactions in order to slow down the formation of global nematic order more so that the transition to the liquid glass state, where diffusion proceeds but angular motion freezes, can be studied in silico.
Acknowledgements.
We thank Aleena Laganapan for discussions and help in the initial stages of the project. The work was supported by the Deutsche Forschungsgemeinschaft (DFG) via SFB 1432 project C07.References
- Poon [2004] W. Poon, “Colloids as big atoms,” Science 304, 830–831 (2004).
- J.-L. Barrat et al. [2023] J.-L. Barrat et al., “Soft matter roadmap,” J. Phys.: Materials 7, 012501 (2023).
- Pfleiderer and Schilling [2007] P. Pfleiderer and T. Schilling, “Simple monoclinic crystal phase in suspensions of hard ellipsoids,” Phys. Rev. E 75, 2–5 (2007).
- Odriozola [2012] G. Odriozola, “Revisiting the phase diagram of hard ellipsoids,” J. Chem. Phys. 136, 134505 (2012).
- Donev et al. [2004] A. Donev, I. Cisse, D. Sachs, E. Variano, F. Stillinger, R. Connelly, S. Torquato, and P. Chaikin, “Improving the density of jammed disordered packings using ellipsoids,” Science 303, 990–993 (2004).
- Abritta and Hoy [2022] P. Abritta and R. S. Hoy, “Structure of saturated random-sequential-adsorption ellipse packings,” Phys. Rev. E 106 (2022), 10.1103/PhysRevE.106.054604.
- Rocks and Hoy [2023] S. Rocks and R. S. Hoy, “Structure of jammed ellipse packings with a wide range of aspect ratios,” Soft Matter 19, 5701–5710 (2023).
- Letz, Schilling, and Latz [2000] M. Letz, R. Schilling, and A. Latz, “Ideal glass transitions for hard ellipsoids,” Phys. Rev. E 62, 5173–5178 (2000).
- De Michele, Schilling, and Sciortino [2007] C. De Michele, R. Schilling, and F. Sciortino, “Dynamics of uniaxial hard ellipsoids,” Phys. Rev. Lett. 98, 265702 (2007).
- Pfleiderer, Milinkovic, and Schilling [2008] P. Pfleiderer, K. Milinkovic, and T. Schilling, “Glassy dynamics in monodisperse hard ellipsoids,” EPL 84, 16003 (2008).
- Chong et al. [2005] S.-H. Chong, A. J. Moreno, F. Sciortino, and W. Kob, “Evidence for the weak steric hindrance scenario in the supercooled-state reorientational dynamics,” Phys. Rev. Lett. 94, 215701 (2005).
- Weeks [2017] E. R. Weeks, “Introduction to the colloidal glass transition,” ACS Macro Lett. 6, 27–34 (2017).
- Gokhale, Sood, and Ganapathy [2016] S. Gokhale, A. K. Sood, and R. Ganapathy, “Deconstructing the glass transition through critical experiments on colloids,” Adv. Phys. 65, 363–452 (2016).
- Stillinger and Debenedetti [2013] F. H. Stillinger and P. G. Debenedetti, “Glass transition thermodynamics and kinetics,” Ann. Rev. Cond. Mat. Phys. 4, 263–285 (2013).
- Roller et al. [2021] J. Roller, A. Laganapan, J.-M. Meijer, M. Fuchs, and A. Zumbusch, “Observation of liquid glass in suspensions of ellipsoidal colloids,” Proc. Natl. Acad. Sci. USA 118, 2018072118 (2021).
- Schilling and Scheidsteger [1997] R. Schilling and T. Scheidsteger, “Mode coupling approach to the ideal glass transition of molecular liquids: Linear molecules,” Phys. Rev. E 56, 2932–2949 (1997).
- Schilling [2000] R. Schilling, “Mode-coupling theory for translational and orientational dynamics near the ideal glass transition,” J. Phys. Cond. Matt. 12, 6311–6322 (2000).
- Schilling [2002] R. Schilling, “Reference-point-independent dynamics of molecular liquids and glasses in the tensorial formalism,” Phys. Rev. E 65, 051206 (2002).
- Götze [2008] W. Götze, Complex Dynamics of Glass-Forming Liquids: A Mode-Coupling Theory (Oxford University Press, December 2008).
- Kang and Dhont [2013a] K. Kang and J. K. G. Dhont, “Glass transition in suspensions of charged rods: Structural arrest and texture dynamics,” Phys. Rev. Lett. 110, 015901 (2013a).
- Kang and Dhont [2013b] K. Kang and J. K. G. Dhont, “Structural arrest and texture dynamics in suspensions of charged colloidal rods,” Soft Matter 9, 4401–4411 (2013b).
- Crassous et al. [2014] J. J. Crassous, A. M. Mihut, E. Wernersson, P. Pfleiderer, J. Vermant, P. Linse, and P. Schurtenberger, “Field-induced assembly of colloidal ellipsoids into well-defined microtubules,” Nat. Comm. 5, 5516 (2014).
- Pal et al. [2018] A. Pal, T. Zinn, M. Kamal, T. Narayanan, and P. Schurtenberger, “Anomalous Dynamics of Magnetic Anisotropic Colloids Studied by XPCS,” Small 14, 1802233 (2018).
- Pal et al. [2020] A. Pal, V. A. Martinez, T. H. Ito, J. Arlt, J. J. Crassous, W. C. Poon, and P. Schurtenberger, “Anisotropic dynamics and kinetic arrest of dense colloidal ellipsoids in the presence of an external field studied by differential dynamic microscopy,” Sci. Adv. 6, eaaw9733 (2020).
- Pal, Kamal, and Schurtenberger [2022] A. Pal, M. A. Kamal, and P. Schurtenberger, “Structure and anisotropic dynamics of stimuli responsive colloidal ellipsoids at the nearest neighbor length scale,” J. Coll. Interf. Sci. 621, 352–359 (2022).
- Zheng et al. [2014] Z. Zheng, R. Ni, F. Wang, M. Dijkstra, Y. Wang, and Y. Han, “Structural signatures of dynamic heterogeneities in monolayers of colloidal ellipsoids,” Nat. Commun. 5, 3829 (2014).
- Zheng, Wang, and Han [2011] Z. Zheng, F. Wang, and Y. Han, “Glass transitions in quasi-two-dimensional suspensions of colloidal ellipsoids,” Phys. Rev. Lett. 107, 065702 (2011).
- Mishra et al. [2014] C. K. Mishra, K. Hima Nagamanasa, R. Ganapathy, A. K. Sood, and S. Gokhale, “Dynamical facilitation governs glassy dynamics in suspensions of colloidal ellipsoids,” Proc. Natl. Acad. Sci. USA 111, 15362–15367 (2014).
- Sokolowsky et al. [2016] K. P. Sokolowsky, H. E. Bailey, D. J. Hoffman, H. C. Andersen, and M. D. Fayer, “Critical slowing of density fluctuations approaching the isotropic-nematic transition in liquid crystals: 2D IR measurements and mode coupling theory,” J. Phys. Chem. B 120, 7003–7015 (2016).
- Wang, Zhang, and Ling [2022] H. Wang, Z. Zhang, and X. S. Ling, “2d phase behaviors of colloidal ellipsoids and rods,” Front. Phys. 10 (2022), 10.3389/fphy.2022.1043983.
- Donev [2005] A. Donev, “Neighbor list collision-driven molecular dynamics simulation for nonspherical hard particles. i. algorithmic details,” J. Comput. Phys. 202, 737–764 (2005).
- De Michele et al. [2006] C. De Michele, A. Scala, R. Schilling, and F. Sciortino, “Molecular correlation functions for uniaxial ellipsoids in the isotropic state,” J. Chem. Phys. 124, 104509 (2006).
- Scala, Voigtmann, and De Michele [2007] A. Scala, T. Voigtmann, and C. De Michele, “Event-driven Brownian dynamics for hard-spheres,” J. Chem. Phys. 126, 134109 (2007).
- De Michele [2010] C. De Michele, “Simulating hard rigid bodies,” J. Comput. Phys. 229, 3276–3294 (2010).
- Gay and Berne [1981] J. G. Gay and B. J. Berne, “Modification of the overlap potential to mimic a linear site–site potential,” J. Chem. Phys. 74, 3316–3319 (1981).
- Lange et al. [2009] E. Lange, J. B. Caballero, A. M. Puertas, and M. Fuchs, “Comparison of structure and transport properties of concentrated hard and soft sphere fluids,” J. Chem. Phys. 130,, 174903 (2009).
- Ilie, Briels, and den Otter [2015] I. M. Ilie, W. J. Briels, and W. K. den Otter, “An elementary singularity-free Rotational Brownian Dynamics algorithm for anisotropic particles,” J. Chem. Phys. 142 (2015), 10.1063/1.4914322.
- Berne and Pechukas [1972] B. J. Berne and P. Pechukas, “Gaussian model potentials for molecular interactions,” J. Chem. Phys. 56, 4213–4216 (1972).
- Berardi, Fava, and Zannoni [1995] R. Berardi, C. Fava, and C. Zannoni, “A generalized Gay-Berne intermolecular potential for biaxial particles,” Chem. Phys. Lett. 236, 462–468 (1995).
- Berardi, Fava, and Zannoni [1998] R. Berardi, C. Fava, and C. Zannoni, “A Gay–Berne potential for dissimilar biaxial particles,” Chem. Phys. Lett. 297, 8–14 (1998).
- Berardi, Muccioli, and Zannoni [2008] R. Berardi, L. Muccioli, and C. Zannoni, “Field response and switching times in biaxial nematics,” J. Chem. Phys. 128 (2008), 10.1063/1.2815804.
- Lennard-Jones [1931] J. E. Lennard-Jones, “Cohesion,” Proc. Phys. Soc. 43, 461 (1931).
- Adams, Luckhurst, and Phippen [1987a] D. Adams, G. Luckhurst, and R. Phippen, “Computer simulation studies of anisotropic systems,” Mol. Phys. 61 (1987a), https://doi.org/10.1080/00268978700102001.
- Chalam et al. [1991] M. K. Chalam, K. E. Gubbins, E. De Miguel, and L. F. Rull, “A molecular simulation of a liquid-crystal model,” Mol. Simul. 7, 357–385 (1991).
- Guevara-Rodríguez and Odriozola [2011] F. d. J. Guevara-Rodríguez and G. Odriozola, “Hard ellipsoids: Analytically approaching the exact overlap distance,” J. Chem. Phys. 135, 084508 (2011).
- Adams, Luckhurst, and Phippen [1987b] D. Adams, G. Luckhurst, and R. Phippen, “Computer simulation studies of anisotropic systems,” Mol. Phys. 61, 1575–1580 (1987b).
- Eppenga and D.Frenkel [1984] R. Eppenga and D.Frenkel, “Monte Carlo study of the isotropic and nematic phases of infinitely thin hard platelets,” Mol. Phys. 52, 1303–1334 (1984).
- Gray and Gubbins [1984] C. G. Gray and K. E. Gubbins, “Introduction,” in Theory of Molecular Fluids: I: Fundamentals (Oxford University Press, 1984).
- Hansen and McDonald [1986] J.-P. Hansen and I. R. McDonald, Theory of Simple Liquids, 2nd ed. (Academic Press, London, 1986).
- Berne and Pecora [1976] B. J. Berne and R. Pecora, Dynamic Light Scattering : With Applications to Chemistry, Biology, and Physics (Wiley, 1976).
- Thompson et al. [2022] A. P. Thompson, H. M. Aktulga, R. Berger, D. S. Bolintineanu, W. M. Brown, P. S. Crozier, P. J. in ’t Veld, A. Kohlmeyer, S. G. Moore, T. D. Nguyen, R. Shan, M. J. Stevens, J. Tranchida, C. Trott, and S. J. Plimpton, “LAMMPS - a flexible simulation tool for particle-based materials modeling at the atomic, meso, and continuum scales,” Comp. Phys. Comm. 271, 108171 (2022).
- Delong, Balboa Usabiaga, and Donev [2015] S. Delong, F. Balboa Usabiaga, and A. Donev, “Brownian dynamics of confined rigid bodies,” J. Chem. Phys. 143 (2015), 10.1063/1.4932062.
- Franosch et al. [1997] T. Franosch, M. Fuchs, W. Götze, M. R. Mayr, and A. P. Singh, “Asymptotic laws and preasymptotic correction formulas for the relaxation near glass-transition singularities,” Phys. Rev. E 55, 7153–7176 (1997).