Tracing the layers of Photodissociated gas in Trifid Nebula
Abstract
Photodissociated gas bears the signature of the dynamical evolution of the ambient interstellar medium impacted by the mechanical and radiative feedback from an expanding H ii region. Here we present an analysis of the kinematics of the young Trifid nebula, based on velocity-resolved observations of the far-infrared fine-structure lines of [C ii] at 158 µm and [O i] at 63 µm. The distribution of the photodissociated regions (PDRs) surrounding the nebula is consistent with a shell-like structure created by the H ii region expanding with a velocity of 5 km s-1. Comparison of ratios of [C ii] and [O i]63 µm intensities for identical velocity components with PDR models indicate a density of 104 cm-3. The red- and blue-shifted PDR shells with a combined mass of 516 have a kinetic energy of erg. This is consistent with the thermal energy of the H ii region as well as with the energy deposited by the stellar wind luminosity from HD 169442A, an O7 V star, over the 0.5 Myr lifetime of the star. The observed momentum of the PDR shell is lower than what theoretical calculations predict for the radial momentum due to the shell being swept up by an expanding H ii region, which suggests that significant mass loss has occurred in M20 due to the dispersal of the surrounding gas by the advancing ionization front.
1 Introduction
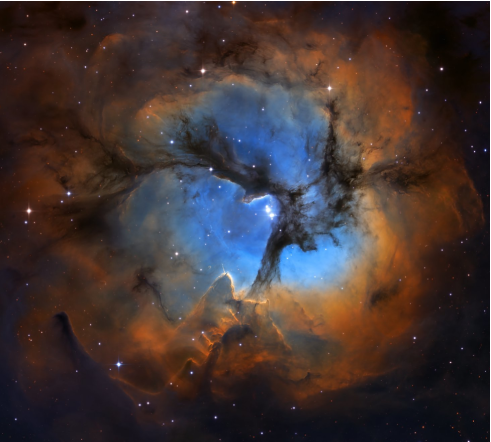
The Trifid nebula (M20) is an H ii region with an age of approximately 0.5 Myr (Lefloch & Cernicharo, 2000) ionized by the O7 V star HD164492A (Lynds et al., 1985) located in the Sagittarius spiral arm at a distance of 118025pc (Kuhn et al., 2021). Figure 1 shows a composite three-color optical image of M20 observed by Wolfgang Promper from his remote observatory in Namibia with narrowband filters, O III (), H () and S II (). The image shows both the large-scale filamentary dust feature and the denser gas towards the south-west that lie in front of the ionized gas in the H ii region created by HD 164492A.
The Infrared Space Observatory (ISO) and Hubble Space Telescope (HST) observations (Cernicharo et al., 1998; Lefloch & Cernicharo, 2000) show the Trifid to be a dynamic star-forming region containing young stellar objects (YSOs), many of them undergoing episodes of violent mass ejection or transferring mass and energy to the nebula in the form of jets. Comparison of a high-resolution radio continuum image at 20 cm and a CO map suggest that in its expansion the H ii region has encountered a large dense molecular cloud to the south-west (SW), possibly triggering the formation of new stars (Cernicharo et al., 1998). From the Spitzer Infrared Array Camera (Spitzer/IRAC) and Multi-Band Imaging Photometer for Spitzer (MIPS) images of the Trifid nebula (M20), Rho et al. (2006) identified about 160 YSOs at different evolutionary stages distributed around the whole nebula, and beyond. These cover all stages of proto-stellar evolution, from Class 0 protostars to more evolved young stellar objects (YSOs). The youngest (Class 0/I protostars TC0–TC8) of the sources in the region are located within the dense far-IR and millimetre cores identified in the 1.3 mm continuum map observed by Lefloch et al. (2002). In some of the dense cores evidence of jets originating from protostars have been discovered through narrow-band line imaging in the optical with the HST. Sticking out of the boundaries of one of the cores, TC2 is a 22-arcsec-long irradiated jet HH 399, ending close to a bow shock ′ away, in a low density environment (Cernicharo et al., 1998; Rosado et al., 1999; Yusef-Zadeh et al., 2005). Millimeter-wavelength molecular-line observations toward the nebula reveal several cloud components at velocities of v 2 km s-1 (corresponding to the dark lanes crossing the optical nebula), v km s-1 (corresponding to dark features at the edge of the optical nebula), and v km s-1 (Kuhn et al., 2022; Cernicharo et al., 1998; Torii et al., 2011, 2017). A bridging feature between the 2 and 8 km s-1 clouds is seen coincident with the optical nebula and indicates that these clouds are physically interacting and may have collided (Haworth et al., 2015; Torii et al., 2017; Kalari, 2021). Alternatively, the cloud kinematics could be interpreted as either an expanding H ii region or turbulence (Fukuda & Hanawa, 2000; Rho et al., 2008). Kuhn et al. (2022) used the 13CO(2–1) channel maps to suggest that the 18 km s-1 cloud which is of much larger spatial extent is likely to be in the background. Until now studies of photodissociated gas in M20 have only been for a small region around the TC2 globule using the far- and mid-infrared fine-structure lines detected with the LWS and SWS onboard ISO (Lefloch et al., 2002).
Here we present a study of the photodissociated gas in an approximately 400′400′ region using the far-infrared (FIR) lines of [C ii] at 158 m and [O i] at 63 µm that account for most of the cooling. The datasets used here not only cover a much larger area compared to that studied by Lefloch et al. (2002) but also have the advantage of having higher spatial and more importantly spectral resolution compared to the ISO data. Recent velocity-resolved studies of Galactic PDRs have shown that both the [C ii] and [O i]63 µm emission are often moderately optically thick and sometimes significantly self-absorbed (Graf et al., 2012; Mookerjea et al., 2018; Guevara et al., 2020; Mookerjea et al., 2021). We use the velocity-resolved [O i]63 µm and [C ii] spectra to characterize the properties and distribution of the PDR gas vis-a-vis location of these components with respect to the ionizing source by segregating the major velocity components of both the diffuse and the dense PDR gas.
2 Observational Datasets
For this work, we have used several sets of publicly available data, which are described below.
2.1 GREAT/SOFIA observations
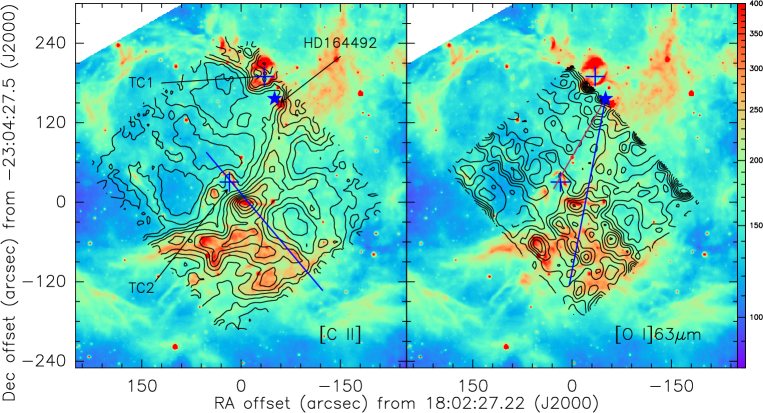
We have retrieved observations of the 2P3/22P1/2 fine structure transition of ionized carbon (C+) at 1900.5369 GHz (157.74 µm) and the 3PP0 transition of atomic oxygen, [O i]63 µm, at 4,744.77749 THz of a region centered at the location of the TC2 globule ((: , : 275) in M20 from the data archive of the Stratospheric Observatory for Infrared Astronomy (SOFIA; Young et al., 2012). The observations (Id: 06_0041; PI: M. Kaufman) were carried out using the German REceiver for Astronomy at Terahertz frequencies (GREAT; Heyminck et al., 2012) on 2018 June 08. The GREAT was in the Low Frequency Array/High Frequency Array (LFA/HFA) configuration with both arrays operating in parallel. The LFA was tuned to [C ii] and the HFA was tuned to [O i]63 µm. The beam sizes for the [C ii] and [O i]63 µm were 141 and 63 respectively. The [C ii] map extends over a region of 400″400″, while the usable part of the [O i]63 µm is closer to 300″ 300″. We used the Level 3b data available on the SOFIA archive for the region. All data were resampled to a spectral resolution of 0.5 km s-1 resulting in a median rms of 0.5 K for both [C ii] and [O i]63 µm data. The [O i]63 µm map was smoothed with a Gaussian kernel and regridded to the same spatial resolution as the [C ii] map, i.e. 141(Fig. 2).
2.2 12CO(3–2) and HCO+(4–3) & (1–0)
For comparison with our observations, we used maps of the =3–2 transition of 12CO at 345795.9899 MHz at and the =4–3 transition of HCO+ at 356734.2230 MHz, both observed with the James Clerk Maxwell Telescope (JCMT) using the Heterodyne Array Receiver Program (HARP) receiver with a beam size of 14″. The observations were performed as part of the proposal M07AH24A. The spectra were downloaded directly from the JCMT archive at the Canadian Astronomical Data Centre (CADC). The JCMT maps have a median rms of 0.3 K at a velocity resolution of 0.5 km s-1. Additionally, HCO+(1–0) spectra observed with the IRAM 30m telescope as part of the Large Programme (LP017) for Master2 internships from Grenoble University, available at https://www.iram.fr/ILPA/LP017/ were also used for comparison with the HCO+(4–3) data.
2.3 SEDIGISM
We have used the data cubes for =2–1 transition of 13CO and C18O at 220398.68 and 219560.36 MHz respectively, that were observed as a part of the large-scale (84 deg2) spectroscopic survey of the inner Galactic disk, named Structure, Excitation and Dynamics of the Inner Galactic Interstellar Medium (SEDIGISM; Schuller et al., 2021). These data were observed with the APEX telescope between 2013 and 2016 with an angular resolution of 30″ and a 1 sensitivity less than 1.0 K at 0.25 km s-1 velocity resolution. The SEGIDISM data were also used by Kuhn et al. (2022).
3 Molecular Gas Distribution in the region

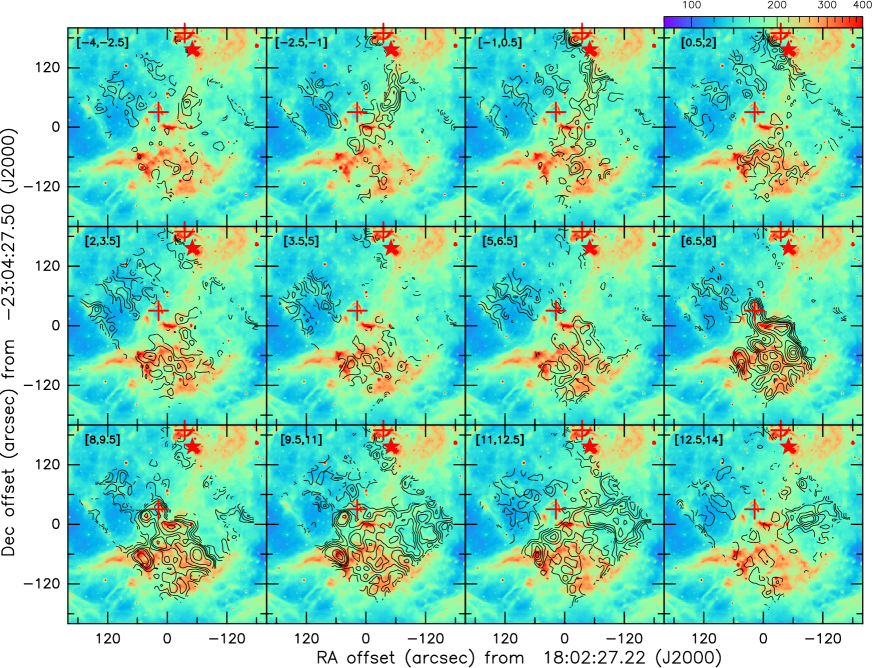
Figures 3 and 10 respectively, show the velocity-channel maps for the 13CO(2–1) and 12CO(3–2) emission in this region. The 13CO(2–1) channel maps show emission mainly from the rims of the nebula, from the pillar containing TC2 and at velocities 14 km s-1. The 12CO(3–2) channel map shows similar emission features except for the component beyond 14 km s-1. The 13CO(2–1) SEDIGISM channel maps were also analyzed by Kuhn et al. (2022), who write that the 13CO emission is seen at almost any velocity between -4 to 28 km s-1 but the emission does not necessarily originate from gas at the same distance. In the Galactic spiral arm model from Reid et al (2016), gas near the Sagittarius Arm is expected to have vLSR 8 km s-1 and gas in the near Scutum Arm would have vLSR 18 km s-1. Kuhn et al. (2022) argued that given the 18 km s-1 matches the expected velocity of the near Scutum Arm it is likely that the CO emission in the velocity range vLSR 13–28 km s-1 comes from a molecular cloud far behind Trifid. These authors concluded that the multiple peaks seen in the average spectrum of the region lying between 0 to 13 km s-1 are compatible with the acceleration of dense cloudlets during the shredding of the molecular cloud by the expanding H ii region created by the radiative feedback due to HD 164492. They further noted that the observed velocities and structure are comparable to those obtained from numerical simulations of cloud disruption by radiative feedback (Ali et al., 2018; Fukushima et al., 2020).
4 Velocity Distribution of Diffuse and Dense PDR Gas
The fine structure lines [C ii] at 158 µm and [O i] at 63 µm are widely regarded as the bona-fide tracers of the PDR gas. Owing to the significantly different excitation conditions, the two spectral lines are also useful to discriminate between the diffuse and dense PDR gas. The [C ii] at 158 µm with an upper energy level of 91 K and a critical density of 3000 cm-3 is easily excited under average Galactic ISM conditions in which C+ are found. The [O i]63 µm line has an upper energy level of 227.7 K and a critical density of 2 cm-3. Thus, although atomic oxygen is as abundant as carbon the [O i]63 emission arises primarily from high density PDRs. Utilising the velocity-resolved spectra for both tracers we attempt to localize the diffuse and dense PDR gas in a velocity-coherent manner.
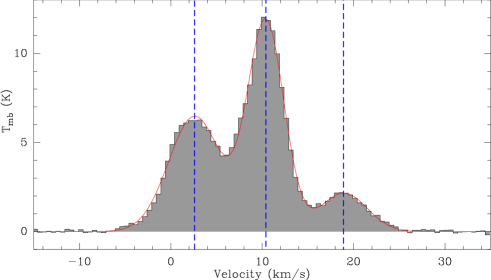
Figure 2 suggests an overall similarity between the distribution of the velocity-integrated emission of [C ii] and [O i]63 µm when both are integrated between -4 to 14 km s-1. Both intensity maps trace the southern part of the region hosting the pillar and the TC2 globule and part of the the dust lanes seen in the optical image across M20. In order to investigate the kinematics and distribution of the gas contributing to the emission of [C ii] we examine the [C ii] spectrum averaged over the entire mapped region (Fig. 4). Using a multi-component Gaussian fit to the average [C ii] spectrum we identify three distinct velocity components approximately centered at 2.6, 10.4 and 18.9 km s-1 – these components match well with the velocity components already identified in the molecular line data (Fig. 4).
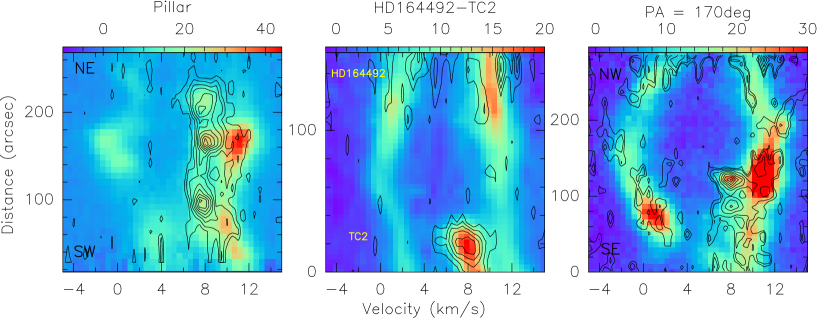
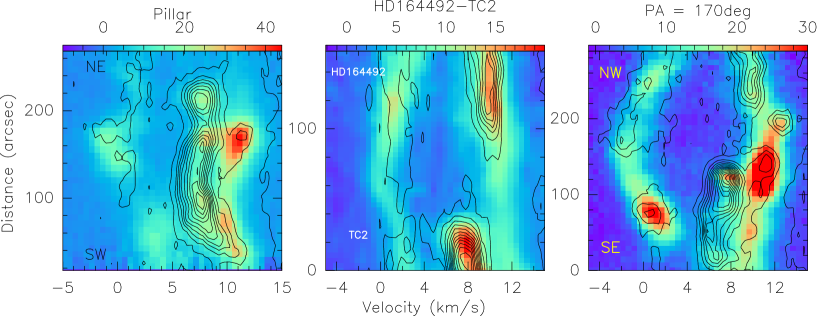
The distribution of the PDR gas is traced more clearly in the channel maps of [C ii] and [O i]63 µm (Fig. 5, 6). All the three velocity components are seen in the [C ii] map. The [O i]63 µm map primarily traces the emission of the 8 km s-1 component, but also shows some of the 2 km s-1 velocity component, in particular the PDR emission from the dark dust lane bisecting the image. This PDR emission stands out in both [C ii] and [O i]63 µm in the channels from -2.5 to +0.5 km s-1, in contrast to the 13CO(2–1) and 12CO(3–2) emission which show very little emission at velocities -1 km s-1. The velocity component at +18 km s-1 is strongly contaminated by telluric [O i] emission, which masks any [O i] emission in that velocity range. The northern ridge containing TC1 was only partially observed in the [O i]63 µm (Fig. 6). The 8 km s-1 component is clearly visible in [C ii], [O i]63 µm, 13CO(2–1) and 12CO(3–2) channel maps. Both [C ii] and [O i]63 µm emission trace the pillar-like structure, with the TC2 globule at its head, at velocities between 5 to 9.5 km s-1, whereas the emission from the velocities between 8 to 13 km s-1appear to be also tracing the denser gas located to the south-west of the map. The velocity-resolved observations suggest that the [C ii] and [O i]63 µm emission as a function of velocity resemble emission from different photo-irradiated layers of the molecular cloud impacted by the expanding H ii region. Such a scenario is further substantiated by the position-velocity (-v hereafter) diagrams for both [C ii] and [O i]63 µm (Fig. 7) along the three directions shown in the integrated intensity maps (Fig. 2). The clear circular shell generated in the [C ii] -v diagram by the 2 km s-1 and 8 km s-1 clouds is characteristic of the position-velocity diagram due to shell created by an expanding H ii region. Additionally we notice that for the direction along the pillar with TC2, while the [O i]63 µm emission is centered at 8 km s-1, the [C ii] emission shows two branches with the branch around 10 km s-1 being brighter. The 12CO(3–2)emission traces warmer and denser gas than the 13CO(2–1) emission and though the features seen in the position-velocity diagrams are closer to the structures seen in the [O i]63 µm, the blue-shifted half of the shell clearly detected in [C ii] is also partially detected in 12CO(3–2) (Fig. 11).
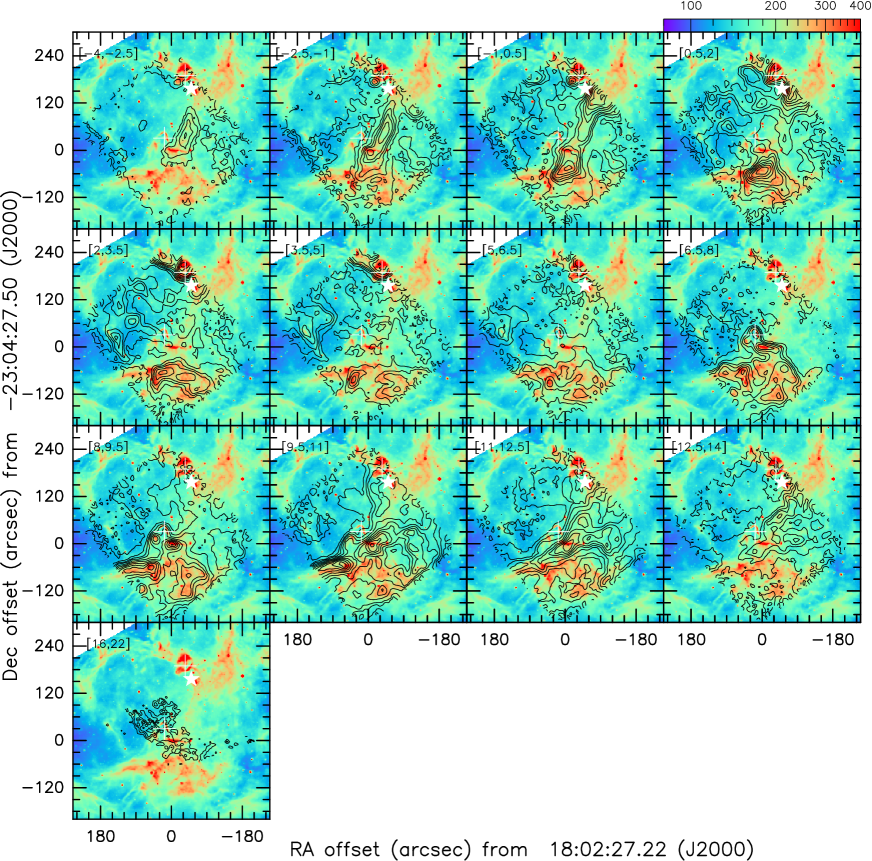
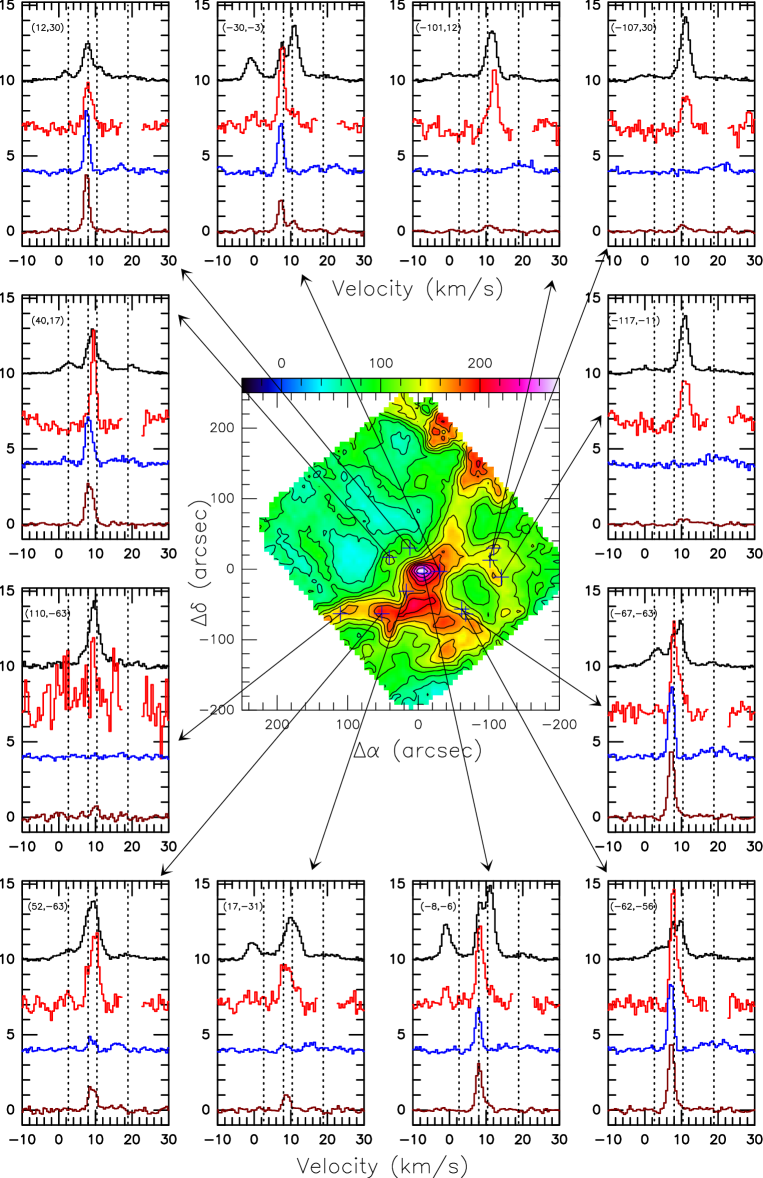
In order to explore whether the split in emission in the 8 km s-1 cloud seen in [C ii] close to the bright emission regions arises due to opacity effects, we compared the [C ii] and [O i]63 µm spectra with 13CO(2–1) SEDIGISM spectra and HCO+(1–0) spectra at twelve selected positions (Fig. 8). We find that at most positions where the [C ii] spectra are double-peaked in the 8 km s-1 component, the [O i]63 µm, 13CO(2–1) and HCO+ tend to align with one of the peaks and do not appear at the velocity where the [C ii] spectra show the dip. Although restricted by the noise level, the C18O(2–1) spectra at those positions also show the peak to be aligned with one of the peaks, thus indicating that the two peaks correspond to emission from clouds at two velocities. The overlapping but distinctly different structures which manifest in the velocity ranges 6.5 to 8 km s-1 and 9.5 to 11 km s-1 in the [C ii] channel map strongly suggest that the two peaks in the [C ii] spectrum arise from different layers of the PDR separated in velocity. Fitting the 8 km s-1 feature in the [C ii] spectra in this region using Gaussian components we obtain velocities around 8.2 and 11 km s-1 for the two components. The [O i]63 µm spectra at these positions also show two components centered around 7.8 and 10.8 km s-1 while the 13CO(2–1) profiles can be fitted with a single component lying between 7 and 8.2 km s-1 as the RA offset () changes from -42 to 28″. Of the two velocity components, the 7 km s-1 component appears to be due to denser gas, since it is detected in both [O i]63 µm and HCO+(1–0). The 11 km s-1 component in contrast is dominantly seen in the [C ii] emission and hence is likely to be from more diffuse PDR gas.
4.1 Gaussian Decomposition of Spectra
We attempt to identify velocity-coherent features associated with the primary velocity features in the [C ii], [O i]63 µm and CO datasets. For this purpose we chose to use [C ii] because of its sensitivity to both diffuse and dense PDR gas, hence tracing the overall kinematics better than the [O i]63 µm emission. We have used the FUNStools.Decompose 111https://github.com/radioshiny/funstools to decompose the [C ii] data cubes into multiple Gaussian components. The tool is based on an algorithm that primarily decides the number of components and their velocity positions in the smoothed spectrum using the first, second, and third derivatives based on the idea that a genuine velocity component is continuous with the surroundings. The results of the first fitting are given as the initial guess to a subsequent round of Gaussian fitting in an iterative manner. The outcome are the parameters such as the central velocity and the linewidth for each velocity component identified at each pixel in the [C ii] datacube. Subsequently, we identify coherent structures corresponding to each of the velocity components so identified by applying the friends-of-friends (FoF) technique to the central velocity of each of the components. The algorithm works in an iterative manner in which it first selects the decomposed Gaussian seed component with the maximum amplitude and gives the structure a number. Subsequently the other Gaussian components in the neighboring pixels whose pixel distance is less than from the seed component are selected, and the velocity differences of the seed and other components in the neighboring pixels are checked. If the the velocity difference between the seed and other components in the neighboring pixel is less than the velocity dispersion of the seed () the neighboring component is identified as a friend of the seed and assigned the same group number. If more than one velocity component in a neighboring pixel is within the range of velocity dispersion from the velocity of the seed, then only the closest one becomes the friend of the seed. In the next iteration the assigned friends of the seed become the seeds of the structure and the same procedure is repeated until there are no more friends to assign.
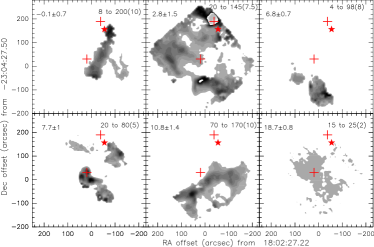
Using this method of identification of velocity-coherent structures in the [C ii] emission, we identify 5 main velocity components with velocities (in km s-1) centered at -0.10.7, 2.81.5, 6.80.7, 7.70.1, 10.81.4. Additionally we detect the component at 18.70.8 km s-1, which as mentioned earlier is unrelated to M20 and most probably associated with the Scutum arm. While the outcome is consistent with the channel maps, decomposition of the spectra into Gaussian components helps us to isolate the overlapping features. This is particularly true for the features with mean velocities at 6.8, 7.7 and 10.8 km s-1.
A combination of the features seen in the channel maps of [C ii], and [O i]63 µm and grouping of the components identified in the Gaussian decomposition of [C ii] spectra provides us with a three-dimensional view of the multiple layers of PDR shells associated with HD164492A.
5 Discussion
5.1 Properties of the PDR shells
The velocity-resolved spectra of [C ii] and [O i]63 µm have enabled us to identify the red- and blue-shifted parts of the far-ultraviolet (FUV; 6-13.6 eV) irradiated molecular shell created by the expanding H ii region in M20. The structure seen particularly in the [C ii] -v plots (Fig. 7) along selected directions suggests that the emission between -5 to 5 km s-1 belongs to the blue-shifted (foreground) part of the shell, while the 5 to 15 km s-1 emission corresponds to the red-shifted part. The Gaussian decomposition of the spectra followed by identification of velocity-coherent emission features identifies two and three sub-structures in the blue- and red-shifted parts of the shell, respectively (Fig. 9). The detection of brighter [O i]63 µm emission from the red-shifted part of the shell indicates that it has higher density than the blue-shifted part. Previous studies of Galactic PDRs have shown that the [C ii] emission is often optically thick, while the [O i]63 µm spectra are affected by foreground low-excitation gas with atomic oxygen. Since we did not detect [13C ii], which would have enabled us to the determine the optical depth of the [C ii] emission, we instead use the results from Lefloch et al. (2002), who estimated that the kinetic temperature of the PDR gas was 300 K, to derive the column density (C+). Since it is likely that the 5–15 km/s PDR emission has high density, for this part of the shell we adopt an optical depth of 2, a value typically seen in Galactic PDRs (Mookerjea et al., 2018). We assume the -5 to +5 km/s PDR emission to be optically thin. Equation (26) from Goldsmith et al. (2012) when modified for optically thick emission for the red-shifted shell, is as follows:
| (1) |
where = 2.3 s-1, is the gas kinetic temperature, the collision rate is = with being the collision rate coefficient with H2 or H0, which depends on , and is the volume density of H. Since the critical density of the [C ii] transition is =3000 cm-3, and since it is likely that most of the [C ii] detected could be at such densities along with some emission arising from clumps with densities exceeding 105 cm-3, we assume a density of 104 cm-3 to estimate the (C+) density distribution of the PDR gas. For this calculation we consider excitation of [C ii] due to C+–H2 collisions, with = 3.8 cm3 s-1. The value of (C+) estimated for the red-shifted shell is between (1–3) cm-2, while for the blue-shifted shell (C+) ranges between (2–9)cm-2. Based on LWS observations with a beam size of 45″ Lefloch et al. (2002) had estimated that (C+) in the PDR of the globule is around (4.5–5.7) cm-2, after subtracting a 30% contribution to [C ii] emission from the ionized gas in the H ii region. At TC2, we estimate a total (C+) of 1.2 cm-2 and if 30% of the [C ii] emission were to arise from the ionized gas, the contribution of the PDR will be cm-2. Within the limits of the uncertainties this estimate is consistent with the values determined by Lefloch et al. (2002).
In order to examine the properties of the PDRs created in the FUV irradiated parts of the red- and blue-shifted molecular shells we derive the [C ii]/[O i]63 µm intensity ratios for both components. The area over which the ratio can be determined is restricted by the usable pixels of the [O i]63 µm map. For the red and the blue-shells the [C ii]/[O i]63 µm intensity ratios (in energy units) vary between (0.8 to 2.5) and (1 to 1.5), respectively. Lefloch et al. (2002) estimated the FUV field intensity at the location of the globule TC2 due to HD 164492A to be . Comparison of the observed [C ii]/[O i]63 µm intensity ratios with the results of the Kaufman PDR model (Kaufman et al., 2006) for an FUV intensity of =1000 suggest densities of 4 and 500 cm-3 for the red and the blue-shifted shells. Based on the detection of [O i]63 µm emission, it appears that these densities are lower limits. The lower derived values of the density could be because the volume and hence beam-filling factor of the [C ii] emission is likely to be significantly larger than the [O i]63 µm emission that arise from high density PDRs and this could lead to higher values of observed [C ii]/[O i]63 µm intensity ratios, which imply lower densities. At the position corresponding to TC2 (40″, 17″) we have fitted the [O i]63 µm spectrum using a single velocity component Gaussian profile resulting in = 9.5 km s-1 and = 1.6 km s-1. The [C ii] spectrum at this position between -8 to 17 km s-1 shows three velocity components, hence we have fitted it with three Gaussians. While fitting the [C ii] profile we kept the center and the width of one of the components fixed at the fitted values obtained for the [O i]63 µm profile. Thus, for this velocity component, which is seen in both the [C ii] and [O i]63 µm emission, we estimate a [C ii]/[O i]63 µm intensity ratio (in energy units) of 0.2. For such a ratio and a G0 = 1000, the PDR models indicate a density of 104 cm-3.
5.2 Kinematics of the PDR shells
Based on the [C ii] intensities, we estimate the total integrated column densities ((C+)) of the blue- and the red-shifted shells to be 5.9 and 2.4 cm-2, respectively. Considering a C/H2 ratio of 1.5 at the distance of M20 (1180 pc), the masses of the blue- and red-shifted shells are estimated to be 100 and 416 , respectively. Based on the shells identified in the position-velocity plots of [C ii] (Fig. 7), we estimate the median expansion velocity of the shells to be km s-1. Thus the total kinetic energy of the PDR shells is approximately 1.3 erg. Chaisson & Willson (1975) derived a few parameters for the H ii region M20, created by the star HD169942A: it extends over 5364, which at a distance of 1180 pc corresponds to a size of 1.82.2 pc, has an average electron density () of 100-150 cm-3 and has an electron temperature () of 8150 K. García-Rojas et al. (2006) estimated the electron number density to be 270 cm-3. The total thermal energy of the H ii region written as , where is the radius of the H ii region and is the Boltzmann constant. Based on these parameters we estimate the total thermal energy of the H ii region to be 6 erg. Thus, subject to uncertainties of the electron density in the H ii region, the kinetic energy of the PDR shell is about two times the thermal energy of the H ii region.
The photoionized gas in the interior of an expanding H ii region exerts a pressure force and delivers outward radial momentum and kinetic energy to the swept-up shell. For a spherical H ii region the momentum delivered to the ambient medium is (Krumholz, 2017):
| (2) |
where nH is the number density of hydrogen in the ambient medium, is the electron temperature, is the Lyman continuum photon rate due to HD164492A and is the age of the H ii region. Lefloch & Cernicharo (2000) estimated the density of the shell to be 105 cm-3 and mean density of the cloud to be 2 cm-3. We note that the assumption of the H ii region expanding in a uniform density environment could lead to uncertainties in the determination of its age and subsequently in the value of the density as well. In order to include the effects of higher density material that the expanding H ii region would necessarily encounter in an otherwise clumpy molecular cloud, we assume the ambient density to be 104 cm-3. For HD 164492A, an O7V type star the Lyman continuum photon rate is s-1 (Martins et al., 2005). Using Eq. (2) for the estimated age of the M20 nebula of 0.5 Myr we estimate the total momentum of the PDR shell to be 2.8 km s-1. From the observations we estimate the momentum of the PDR shell with a mass of 516 moving with a velocity of 5 km s-1 to be km s-1, which is lower by a factor of 10 than the estimated from Eq.(2). This could be due to the molecular (and photodissociated) material which might have been dispersed, hence carrying away part of the momentum.
The kinetic energy of the swept up shell is given by (Krumholz, 2017):
| (3) |
The kinetic energy of the swept up shell estimated using Eq. (3) is 3.1 erg, which is much smaller than the observed value by a factor of more than 320. It is clear that a simplistic model of an H ii region expanding thermally in a uniform density environment cannot provide the observed kinetic energy of the shell. on the other hand, the wind luminosity from HD169942A is estimated to be 1.7 erg s-1 (Rho et al., 2008; Howarth & Prinja, 1989; Prinja et al., 1990), indicating that the wind has pumped in a total kinetic energy of 5.2 erg over the 0.5 Myr lifetime of the Trifid nebula. This number matches quite well with the observed kinetic energy of the PDR shells as well as with the thermal energy of the ionized gas in the nebula.
6 Summary & Conclusions
We have analysed the distribution of the PDR surfaces created by the FUV radiation from the O-type star HD 164492 that illuminates the H ii region associated with the M20 nebula based on decomposition of the [C ii] emission into velocity components. We disentangle the high density PDR material using the [O i]63 µm emission. The structure of the PDRs is consistent with shells created by the H ii region expanding approximately with a velocity of 5 km s-1. Based on the [C ii]/[O i]63 µm intensity ratios we estimate the densities of the red and the blue-shifted parts to be 4000 and 500 cm-3, which are likely to be the lower limits considering the possible mismatch between the beam-filling factors of the [C ii] and the [O i]63 µm emission. The ratio, when estimated by considering the intensities of velocity components seen in both the [C ii] and [O i]63 µm emission, suggest a density of 104 cm-3, which is consistent with the ambient PDR density determined by Lefloch et al. (2002). The total kinetic energy estimated for the shells, erg, is consistent with both the thermal energy of the H ii region as well as the total kinetic energy pumped in by the stellar wind during the lifetime (0.5 Myr) of the nebula. This is also an indirect confirmation of the age of the nebula. The total momenta of the detected parts of the shell is about 2.6 km s-1, which is about ten times less than the momentum that a spherical H ii region with the physical parameters of M20 can deliver. The presence of “holes” on either side of the dark lanes, which essentially are remnants of the blue-shifted part of the shell, also suggest that a significant part of this shell (molecular and/or PDR) has been blown away by the H ii region and by the stellar wind. The material thus lost would have carried with it significant momentum and hence explains the discrepancy between the measured momentum of the shell and the momentum that the H ii region is likely to deliver.
Radiative and mechanical feedback due to the massive stars both at the end of their lives (in the form of supernovae) and in their youth (as expanding H ii regions and stellar winds) influence the triggering and/or hindrance to the formation of new generation of stars. The relative importance of the H ii regions and the stellar winds in shaping the structure of the ambient interstellar medium is of interest in the context of the evolution of the Galactic interstellar medium and star formation scenario (cf. Pabst et al., 2020; Tiwari et al., 2021, and references therein). This work presented observational evidence of the role of the stellar winds in shaping the structure of the putative sites of triggered star formation in the Trifid nebula. The velocity information in the [C ii] data enabled us to quantitatively compare the stellar wind inputs with the kinetic energy of the PDR shells and confirm that in this case the stellar winds provide the energy for expansion rather than the thermal expansion of the H ii region. For a more comprehensive understanding of the kinematics of the M20 nebula, extending [C ii] map to the north and obtaining a larger [O i]63 µm map would enable a quantitative analysis of TC1 similar to the analysis done by Lefloch et al. (2002) for TC2. Such studies are crucial to obtain an improved understanding of the role of stellar feedback in determining the structure of the ambient medium that possibly trigger the formation of a new generation of stars in the region.
Appendix A Channel map and Position-Velocity Plots for 12CO(3–2)

IRSA, Spitzer, Herschel, SOFIA
References
- Ali et al. (2018) Ali, A., Harries, T. J., & Douglas, T. A. 2018, MNRAS, 477, 5422
- Cernicharo et al. (1998) Cernicharo, J., Lefloch, B., Cox, P., et al. 1998, Science, 282, 462
- Chaisson & Willson (1975) Chaisson, E. J., & Willson, R. F. 1975, ApJ, 199, 647
- Fukuda & Hanawa (2000) Fukuda, N., & Hanawa, T. 2000, ApJ, 533, 911
- Fukushima et al. (2020) Fukushima, K., Yamaguchi, H., Slane, P. O., et al. 2020, ApJ, 897, 62
- García-Rojas et al. (2006) García-Rojas, J., Esteban, C., Peimbert, M., et al. 2006, MNRAS, 368, 253
- Goldsmith et al. (2012) Goldsmith, P. F., Langer, W. D., Pineda, J. L., & Velusamy, T. 2012, ApJS, 203, 13
- Graf et al. (2012) Graf, U. U., Simon, R., Stutzki, J., et al. 2012, A&A, 542, L16
- Guevara et al. (2020) Guevara, C., Stutzki, J., Ossenkopf-Okada, V., & et al. 2020, A&A, 636, A16
- Haworth et al. (2015) Haworth, T. J., Tasker, E. J., Fukui, Y., et al. 2015, MNRAS, 450, 10
- Heyminck et al. (2012) Heyminck, S., Graf, U. U., Güsten, R., et al. 2012, A&A, 542, L1
- Howarth & Prinja (1989) Howarth, I. D., & Prinja, R. K. 1989, ApJS, 69, 527
- Kalari (2021) Kalari, V. M. 2021, ApJ, 921, 81
- Kaufman et al. (2006) Kaufman, M. J., Wolfire, M. G., & Hollenbach, D. J. 2006, ApJ, 644, 283
- Krumholz (2017) Krumholz, M. R. 2017, Star Formation, doi:10.1142/10091
- Kuhn et al. (2022) Kuhn, M. A., Hillenbrand, L. A., Feigelson, E. D., et al. 2022, ApJ, 937, 46
- Kuhn et al. (2021) Kuhn, M. A., Benjamin, R. A., Zucker, C., et al. 2021, A&A, 651, L10
- Lefloch & Cernicharo (2000) Lefloch, B., & Cernicharo, J. 2000, ApJ, 545, 340
- Lefloch et al. (2002) Lefloch, B., Cernicharo, J., Rodríguez, L. F., et al. 2002, ApJ, 581, 335
- Lynds et al. (1985) Lynds, B. T., Canzian, B. J., & Oneil, E. J., J. 1985, ApJ, 288, 164
- Martins et al. (2005) Martins, F., Schaerer, D., & Hillier, D. J. 2005, A&A, 436, 1049
- Mookerjea et al. (2018) Mookerjea, B., Sandell, G., Vacca, W., & et al. 2018, A&A, 616, A31
- Mookerjea et al. (2021) Mookerjea, B., Sandell, G., Veena, V. S., et al. 2021, A&A, 648, A40
- Pabst et al. (2020) Pabst, C. H. M., Goicoechea, J. R., Teyssier, D., et al. 2020, A&A, 639, A2
- Prinja et al. (1990) Prinja, R. K., Barlow, M. J., & Howarth, I. D. 1990, ApJ, 361, 607
- Rho et al. (2008) Rho, J., Lefloch, B., Reach, W. T., & Cernicharo, J. 2008, in Handbook of Star Forming Regions, Volume II, ed. B. Reipurth, Vol. 5, 509
- Rho et al. (2006) Rho, J., Reach, W. T., Lefloch, B., & Fazio, G. G. 2006, ApJ, 643, 965
- Rosado et al. (1999) Rosado, M., Esteban, C., Lefloch, B., Cernicharo, J., & García López, R. J. 1999, AJ, 118, 2962
- Schuller et al. (2021) Schuller, F., Urquhart, J. S., Csengeri, T., et al. 2021, MNRAS, 500, 3064
- Tiwari et al. (2021) Tiwari, M., Karim, R., Pound, M. W., et al. 2021, ApJ, 914, 117
- Torii et al. (2011) Torii, K., Enokiya, R., Sano, H., et al. 2011, ApJ, 738, 46
- Torii et al. (2017) Torii, K., Hattori, Y., Hasegawa, K., et al. 2017, ApJ, 835, 142
- Young et al. (2012) Young, E. T., Becklin, E. E., Marcum, P. M., et al. 2012, ApJ, 749, L17
- Yusef-Zadeh et al. (2005) Yusef-Zadeh, F., Biretta, J., & Wardle, M. 2005, ApJ, 624, 246