Non-Atomic Arbitrage in Decentralized Finance
Abstract
The prevalence of maximal extractable value (MEV) in the Ethereum ecosystem has led to a characterization of the latter as a dark forest. Studies of MEV have thus far largely been restricted to purely on-chain MEV, i.e., sandwich attacks, cyclic arbitrage, and liquidations. In this work, we shed light on the prevalence of non-atomic arbitrage on decentralized exchanges (DEXes) on the Ethereum blockchain. Importantly, non-atomic arbitrage exploits price differences between DEXes on the Ethereum blockchain as well as exchanges outside the Ethereum blockchain (i.e., centralized exchanges or DEXes on other blockchains). Thus, non-atomic arbitrage is a type of MEV that involves actions on and off the Ethereum blockchain.
In our study of non-atomic arbitrage, we uncover that more than a fourth of the volume on Ethereum’s biggest five DEXes from the merge until 31 October 2023 can likely be attributed to this type of MEV. We further highlight that only eleven searchers are responsible for more than 80% of the identified non-atomic arbitrage volume sitting at a staggering 132 billion US$ and draw a connection between the centralization of the block construction market and non-atomic arbitrage. Finally, we discuss the security implications of these high-value transactions that account for more than 10% of Ethereum’s total block value and outline possible mitigations.
1 Introduction
The introduction of decentralized exchanges (DEXes) has made the trading of cryptocurrencies a centerpiece of decentralized finance (DeFi). Today, a multitude of DEXes exist on several different chains. The prices on each of these DEXes are the product of previous transactions on the respective DEX and thus can differ from the prices quoted at a given time on centralized exchanges (CEX) or other DEXes. These differences represent an arbitrage opportunity, which a trader can exploit by buying the asset at the cheaper venue and selling it at the other. We refer to price differences between DEXes on the same chain as atomic arbitrage, since these arbitrages can be carried out within the same transaction, whereas non-atomic arbitrage stems from price discrepancies involving DEXes on two different chains or, presumably more common, centralized exchanges (CEX). The prior is known as cyclic arbitrage and has been extensively studied [1]. We focus on the latter, which is naturally more challenging to analyze as it involves actions outside the respective blockchain. We note that while non-atomic arbitrage opportunities exist on various chains we focus on Ethereum, as it is home to the by far largest portion of DeFi applications [2].
Non-atomic arbitrage opportunities existed ever since the launch of DEXes, as these naturally arise when you have two markets quoting prices for the same assets. However, Ethereum’s transition from Proof-of-Work (PoW) to Proof-of-Stake (PoS) in September 2022 marked a watershed moment, due to the changes in block building. On Ethereum PoS time is divided into slots with each slot being assigned to a single known validator, i.e., the PoS equivalent of a miner, who is responsible for proposing a block and extending the chain. While validators are assigned a slot, around 90% of blocks are no longer built by the validator themselves, but are instead outsourced through the novel proposer-builder separation (PBS) to a small set of specialized builders [3]. These builders bid to have their assembled block selected by the validator. The acquired block building right is valuable partly due to users paying tips for block inclusion, but, more importantly, due to maximal extractable value (MEV), i.e., the value that can be extracted by strategically ordering, including or excluding transactions. Trades exploiting non-atomic arbitrage opportunities make up a part of MEV as arbitrageurs want to be the first to exploit this opportunity, and therefore are keen to be included at the top of the block [4].
These changes have generally made it easier for sophisticated traders to extract value from non-atomic arbitrage opportunities. Firstly, whereas on Ethereum PoW the miner was a priori unknown, the advance knowledge of the validator is beneficial for the arbitrageurs as they can identify slots that have been assigned to validators open to external block builders, i.e., validators participating in PBS. Through PBS arbitrageurs have a scheme by which they can relay their transactions privately to the builder and do not risk being front-run in the mempool, i.e., the public waiting area for transactions. Secondly, block builders are incentivized to maximize MEV, with some even specializing in non-atomic arbitrage [4], institutionalizing it in block building.
In this work, we present the first in-depth analysis of non-atomic arbitrage on Ethereum DEXes to show that non-atomic arbitrage, a type of MEV, accounts for a significant proportion of the total DEX volume. We further identify alarming centralizing trends in the block-building market as a direct consequence of non-atomic arbitrage.
Contributions. We summarize our main contributions as follows:
-
•
We develop a model to quantify the profits from non-atomic arbitrageurs.
-
•
We perform the first in-depth measurement study of non-atomic arbitrage on DEXes and find that more than one-fourth of the volume on the five biggest DEXes on Ethereum is most likely non-atomic arbitrage.
-
•
Our work finds that two searchers account for nearly half the non-atomic arbitrage volume and highlights that several builders operate (subsidized) integrated searchers (i.e., the builder and searcher are controlled by the same entity) doing non-atomic arbitrage.
-
•
We show that non-atomic arbitrage is linked to times of high cryptocurrency price volatility and that during these times builders specializing in non-atomic arbitrage have higher chances of being selected – centralizing the block construction market.
-
•
We discuss the implication of non-atomic arbitrage on the ecosystem and point towards possible mitigations.
2 Background
In the following, we detail the relevant background of Ethereum PoS (cf. Section 2.1), PBS (cf. Section 2.2), DEXes (cf. Section 2.3), and MEV (cf. Section 2.4).
2.1 Ethereum Proof-of-Stake
Since the transition to PoS, Ethereum runs on two layers. The execution layer, largely taken over from the former PoW protocol, is tasked with validating and executing transactions. Conversely, the consensus layer, situated atop the beacon chain, is dedicated to reaching consensus among validators, i.e., the PoS equivalent of miners. To become a validator, one must lock, i.e., stake, 32 ETH in a specified smart contract.
Time is divided into slots, periods of twelve-second length, on the Beacon chain. In every slot, a single validator is responsible for proposing a block, i.e., being a proposer. Thus, there is a chance for a block to be proposed and for the blockchain to be extended in every slot. For building a block, a validator receives a fixed consensus layer block reward ( ETH). Additionally, the validator also receives a variable execution layer reward for building the block. This variable reward stems from fees being paid for transactions to be included in the block. These fees can be relayed to the proposer either directly through transaction fees or through direct payment (i.e., coinbase transfers). On average, these execution layer block rewards are around 0.12 ETH but vary significantly as we find.
2.2 Proposer Builder Separation
PBS is a novel scheme that was designed for Ethereum PoS [5] and through which the majority (around 90% [3]) of blocks are proposed. With PBS the previous roles of the block proposer are separated into two tasks, namely block building and block proposing. In short, specialized block builders are tasked with building high-value blocks. Amongst these blocks built by the builders, the validator is expected to choose the block with the highest bid, i.e., the amount the proposer would receive, and proposes the block to the network.
Figure 1 depicts the PBS scheme and we detail the roles of each of the players in the following:
Searchers scan the mempool and look for profitable (bundles of) transactions, generally these transactions involve MEV opportunities, such as sandwich attacks, arbitrage, or liquidations. They pass their bundles to builder(s) privately to avoid them being copied by predatory trading bots scanning the mempool.
Builders combine bundles received from searchers they are connected to, with private and public transactions to build high-value blocks. Once a block is built they forward the block to one or many relays along with how much they are willing to give the proposer to choose their block – the bid. In case their block is later chosen by the proposer, the builder’s profit is the difference between the block’s value and the bid.
Relays are connected to builders. When they receive blocks from builders, they check that the block is valid, that the payment to the proposer is as indicated in the bid, and that the block complies with any censoring filters implemented by the relay. They identify the block with the highest bid. Then, they send the block header, along with the size of the payment to the proposer.
Proposers request blocks from all relays they are connected to. They are expected to choose the block with the highest bid if the value of this bid exceeds the value of the block they built themselves. Once they have chosen a block, they sign the block header received from the relay which will prompt the relay to broadcast the block.
Note that in blocks built through PBS, the block builder is indicated as the fee recipient and the builder transfers the promised amount to the proposer in the block’s last transaction. We further highlight that one entity can play all the roles at once. For instance, if a builder also runs a searcher we would refer to this as an integrated seacher.
2.3 Decentralized Exchanges
DEXes are one of the most popular DeFi applications. They allow users to exchange cryptocurrencies on the blockchain without giving up custody of their assets. While traditional CEXes generally utilize a limit order book to match orders, most DEXes are constant function market makers (CFMM). With a CFMM, users execute their order against a liquidity pool holding reserves of two or more cryptocurrencies. Trades against the pool execute according to a pre-defined trading function specified in the pool’s smart contract, i.e., the pool only accepts trades that keep its trading function constant. Importantly, every trade that executes in a CFMM pool moves the pool’s price deterministically, dependent only on the pool’s reserves ahead of the trade and the trade’s input size. Consequently, if an arbitrage opportunity arises, the assets locked in the liquidity pool determine how large the arbitrage trade can be. Hence, the larger the liquidity pools, the larger the required arbitrage trades are to synchronize the prices across different trading venues.
2.4 Maximal Extractable Value
MEV refers to the profit that can be extracted through including, excluding, and reordering transactions in a block [6]. The most commonly observed and measured types of MEV on Ethereum are sandwich attacks, cyclic arbitrage, and liquidations. Succinctly, a sandwich attack has the attacker front- and back-running the victim’s transaction on a DEX for a profit. A cyclic arbitrage profits from price differences across DEXes. Liquiditations close under-collateralized loans on lending protocols. The liquidator can buy the collateral of a position at a discount, as a reward for repaying the debt. Oftentimes the liquidator then sells the collateral on a DEX[7].
3 Data Collection
To measure the prevalence and impact of non-atomic arbitrage trades on the Ethereum ecosystem, we collect four different types of data. Namely, we collect Ethereum blockchain (cf. Section 3.1), PBS relay data (cf. Section 3.2), Ethereum network data (cf. Section 3.3), and cryptocurrency price data (cf. Section 3.4). All data we collect from block 15,537,393, i.e., the block of the merge on Ethereum on 15 September 2022, to block 18,473,542, i.e., the last block on 31 October 2023. Thus, our data set covers the entire history of the Ethereum PoS up until 31 October 2023.
3.1 Ethereum Blockchain
Decentralized Exchange Trades. We collect data for all DEX trades on Uniswap V2, Uniswap V3, Curve, Balancer and Sushiswap. These five biggest DEXes in terms of total value locked (TVL) on the Ethereum blockchain [8]. In total, our data set comprises 77,019,583 swaps on DEXes. For each trade, we identify the pool in which the trade was executed as well as the amount of tokens exchanged. We further, record whether the trade was executed successfully, i.e., whether the execution of the transaction was successful.
Maximal Extractable Value. To differentiate HFT trades from types of MEV and to compare their respective prevalence on DEXes, we collect MEV transaction labels from zeromev [9]. These labels specify whether a transaction was part of a sandwich attack (i.e., victim and attacker transaction), performs a cyclic arbitrage, or a liquidation.
Rewards Data. We collect Ethereum execution layer reward data. In particular, for each block we calculate the rewards received by the block’s fee recipient: (1) priority gas fees, and (2) tips, i.e., direct transfers to the fee recipient address. Note that the execution layer rewards are also referred to as the block value. We, further, record information regarding the PBS scheme rewards. In the PBS scheme specification, the block builder is indicated as the block’s fee recipient and in the block’s last transaction transfers the agreed-upon value to the block proposer. Thus, for blocks that follow the PBS specification we record the amount transferred by the fee recipient to the block proposer.
3.2 PBS Relays
We collect data from eleven relays: Aestus, Agnostic, Blocknative, bloXroute (Ethical), bloXroute (Max Profit), bloXroute (Regulated), Eden, Flashbots, Manifold, Relayoor and UltraSound. The relays implement public APIs that give access to the blocks delivered by the relays to the proposers, as well as the bids received by the builders. We note that some relay APIs, namely Blocknative, bloXroute (Ethical), Eden, and Relayoor, are no longer reachable. For these, our data only extends to 31 April 2023, i.e., the last time we scraped the data. Further, bloXroute (Ethical), bloXroute (Max Profit), and bloXroute (Regulated) removed access for builder bids from their APIs. When querying the builder bids API for blocks that passed through the respective bloXroute relay, the response is consistently empty. Thus, for the three bloXroute relays the bid data only extends to 31 January 2023, i.e., the last time we scraped that data and received non-empty responses.
Importantly, the data by the relays is self-reported and thus requires some trust in the relays, as it cannot be fully verified. However, we combine our Ethereum blockchain reward data set with our PBS data set to verify that the block values reported by the relays correspond to those received by the validators. If this is not the case, we disregard any relay bid data for that block.
3.3 Ethereum Network
To obtain block times, i.e., the time at which a block was first seen in the network, and to identify private transactions we use Ethereum network data from the Mempool Guru project [10]. The Mempool Guru project runs geographically distributed Ethereum nodes. Each node records the timestamp at which it first saw any block or transaction. The projects data collection method is detailed in [11]. We take the earliest timestamp across the nodes operated by the Mempool Guru project as the block time and consider a transaction private if not one node saw the transaction before the block it is included in was seen in the network.
3.4 Cryptocurrency Price
We obtain historical cryptocurrency price data from Binance.com [12] and CoinMarketCap [13]. In particular, we obtain candlestick data from Binance.com with an interval of a second as well as aggregate trade data for ETH and BTC. We further obtain daily candlestick data from CoinMarketCap for 60 cryptocurrencies.
4 Non-Atomic Arbitrage on DEXes Model
We illustrate the process a non-atomic arbitrageur follows to get the on-chain leg of the trade included in Figure 2. Upon detecting an arbitrage opportunity, the searcher submits the desired transaction to the builder. The builder then builds their block and sends it together with their bid to the relay. Next, if requested, the relay sends the highest value block to the proposer who in turn picks the highest bidding block to propose to the network. Importantly, even though visualized separately one entity could for instance operate a builder and a searcher in this case we would refer to the latter as an integrated seacher.
4.1 Non-Atomic Arbitrageur Model
We develop a simple model for the profit of a non-atomic arbitrageur. We focus on two currencies and whose price on a DEX on Ethereum is and the off-chain price . As discussed in Section 2.3, most DEXes are a CFMM with the largest DEX being Uniswap [8]. Uniswap currently has two active versions, V2 [14] and V3 [15]. Here, we focus on the V2 version, which is also employed by the DEX Sushiswap [16], but the model also holds for V3 between two ticks.
The CFMM for Uniswap imposes, , where and stand for the number of - and -tokens locked in the liquidity pool, and is referred to as the liquidity. The (marginal) price for -tokens in terms of -tokens is given as . The reserves can be expressed in terms of the liquidity and price by solving for and , yielding , .
We denote the price difference between the off-chain and on-chain as . Without loss of generality, we assume the searcher discovers , i.e., the price of -tokens off-chain is higher such that the arbitrageur buys -tokens on the DEX. During the trade, they pay of which is paid in fees to the liquidity providers, where is the protocol fee. With this and the constant product , the amount of -tokens the trader receives is given by
As long as the price off-chain remains higher than the on-chain price received by the arbitrageurs, they can extract more value by buying more on the DEX. Thus, the arbitrageurs will trade the price on the DEX until the price they receive for the last unit of is . The pool’s marginal price at the end of the trade is then given by
Simultaneously, to this buy order, the arbitrageur sells the same amount of -tokens, through the off-chain exchanges at price 111We assume the price off-chain is not impacted by this arbitrage. . Thus, the arbitrageurs receives
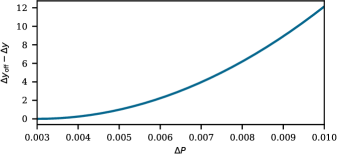
where we used the previous two equations. Finally, we can compute the arbitrageurs profit by solving for and inserting it in the above equation for which leads to
where we also expressed and in terms of and the starting on-chain price . Here, we ignored potential fees payable on the off-chain exchange as their fees for large traders is typically significantly lower than the Uniswap fee. The profit as a function of the price change is plotted in Figure 3. The profit becomes significant for larger price changes, showing that sufficient price difference will attract non-atomic arbitrage trades. Note that profitable arbitrage only exists for , as otherwise the fees paid to the liquidity pool exceed the price difference that can be profited from.
While an arbitrageur still needs to pay the builder to have their trade included, the result shows how valuable the arbitrage trade is for the searcher and limits the bid they would be willing to submit.
4.2 Case study of Block 18,360,789
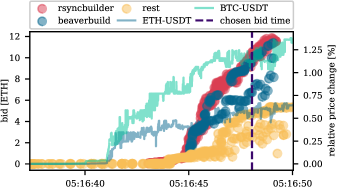
To provide a better understanding of non-atomic arbitrage, we go through a case study of block 18,360,789 – a block with a significant price change in the lead-up to the block, i.e., the time between the previous block proposal and the block proposal itself. In Figure 4, we plot the time of the and the value of bids from the builders. Note that we draw out bids from rsyncbuilder (shown in red) and beaverbuild (shown in blue), as these two builders were previously identified as having integrated searchers that perform these non-atomic arbitrage trades [4]. The bids from all remaining builders are shown in yellow. We further indicate the time of the bid corresponding to the block that was chosen by the proposer, i.e., the relays deliver the highest bid to the proposer when the proposer requests it. Finally, we also plot the relative price change of ETH-USDT and BTC-USDT on Binance.com during the same time. Recall that USDT is a stablecoin pegged to the US$.
One immediately notices that the time in the lead-up to the block is characterized by extremely high price volatility of both ETH and BTC in comparison to USDT. The relative price change exceeds 0.6% and 1.3% in less than ten seconds respectively. This price change creates an arbitrage opportunity, as the prices on DEXes do not move in-between blocks. Thus, as outlined in the previous section, the first transaction in a DEX pool can close this price difference and thereby profit from the arbitrage opportunity.
tx index searcher pool tokenIn tokenOut amount [US$] 0 rsyncsearcher3 0x88e6a...f5640 USDC ETH 2148195.308 1 rsyncsearcher3 0x99ac8...abc35 USDC BTC 659507.701 2 rsyncsearcher3 0x4585f...a20c0 ETH BTC 554524.411 3 rsyncsearcher3 0x9db9e...8425b USDT BTC 186858.044 4 rsyncsearcher3 0x11b81...697f6 USDT ETH 523225.597 5 rsyncsearcher3 0x4e68c...dfa36 USDT ETH 524150.487 6 rsyncsearcher3 0xcbcdf...d62ed ETH BTC 495617.185 8 searcher1 0x8ad59...6e6d8 USDC ETH 562787.652 9 rsyncsearcher3 0x60594...5a270 DAI ETH 116090.952 10 rsyncsearcher3 0xc2e9f...a25f8 DAI ETH 105871.055 12 searcher1 0xd51a4...aae46 USDT BTC 17463.007 14 rsyncsearcher3 0x391e8...86649 DAI BTC 9214.814 17 rsyncsearcher3 0x06da0...84553 USDT ETH 18283.993 18 rsyncsearcher3 0xc3d03...5882f DAI ETH 10533.977 19 rsyncsearcher3 0x397ff...7aca0 USDC ETH 14457.825 21 rsyncsearcher3 0xceff5...d3a58 ETH BTC 15450.829 22 rsyncsearcher3 0x824a3...c0673 ETH BLUR 11451.829 23 rsyncsearcher3 0x56534...a83b2 USDT BTC 4822.975 27 rsyncsearcher3 0xcbfb0...7ef3c USDC BTC 1538.249 28 rsyncsearcher3 0x290a6...f5b42 ETH MATIC 14629.722 31 searcher5 0xcd828...a9fbf FXS ETH 6247.832 33 rsyncsearcher3 0x919fa...daf79 ETH CRV 4954.943 35 rsyncsearcher3 0x34704...08d60 USDT UNI 1106.016 36 rsyncsearcher3 0xa3f55...dfd74 LDO ETH 9727.578 43 rsyncsearcher3 0x9febc...c82ae USDC 1INCH 516.780 44 rsyncsearcher3 0x1d420...bd801 ETH UNI 6336.821
Coming back to Figure 4, we can observe that around five seconds after the price starts to change on Binance.com the bids start to increase. At this point, the price difference appears to be big enough for non-atomic arbitrage to be profitable. Further, we find that bids from the builders that are associated with non-atomic arbitrage transactions are higher than those from the rest and that the bids continue to increase as the ETH and BTC prices on Binance.com increase. The block chosen by the proposer was built by rsyncbuilder and its bid, i.e., the value received by the proposer was a staggering 10.32 ETH ( 23,000 US$ at the time of this writing). In Table I, we take an in-depth look a the non-atomic arbitrage trades we identified with our heuristics that we will introduce in the following Section 5. In the block, there were 26 transactions with volume exceeding 6 million US$ that we identified as performing non-atomic arbitrage trades. Remarkably, all but three of these transactions were by the rsyncsearcher3 – a searcher we identified to be linked to the rsyncbuilder that won the block (cf. Section 6.3). Additionally, we highlight that the rsyncsearchers paid a remarkable 11.15 ETH (i.e., more than the PBS bid) for their transactions. Thus, the rsyncbuilder built a high-value block largely attributed to fees paid by trades we labeled as non-atomic arbitrage by its own integrated searcher.
Note that most of trades buy ETH or BTC for a stablecoin. As we saw in Figure 4 the prices of these two cryptocurrencies rose on Binance.com, and they were thus trading for cheaper on DEXes at the beginning of the block. For example, if we look at the price at the beginning of the block, we see that the price of the ETH-USDT Uniswap V3 pool was 1563.57, and at the end of the block, it was 1574.15. The Binance.com price was 1564.61 at the beginning of the block’s slot, while it rose to 1574.63 by the time the block was proposed. Notice that the arbitrageurs drove the price almost exactly to the off-chain price, as we show to be optimal in our previous analysis (cf. Section 4.1). Additionally, some transactions exchange cryptocurrencies for cryptocurrencies (i.e., no stablecoins), such as the transaction at index 2 and 6, which exchange ETH for BTC. Note that the relative price increase measured in USDT of BTC was higher than that of ETH. Thus, BTC relative to ETH was also available for cheaper on DEXes at the beginning of the block. Hence, the searcher also swaps ETH for BTC.
5 Identifying Non-Atomic Arbitrage Trades
With our acquired understanding of non-atomic arbitrage, we now describe our procedure to identify non-atomic arbitrage trades on the Ethereum blockchain. We start by noting that identifying this type of MEV transaction is more difficult and less clear-cut than other types of MEV such as sandwich attacks, cyclic arbitrage or liquidations previously measured on Ethereum blockchain [17, 18, 19, 1, 7]. All transactions related to these types of MEV can be found on the same blockchain. Importantly, we only observe one side of the arbitrage on the Ethereum blockchain and have practically no visibility into the other side of the arbitrage. Presumably, as mentioned previously the other side of the arbitrage executes on a CEX, as these have the most significant liquidity for cryptocurrency trading. Thus, we do not have access to de-anonymized data and the detail of data available also differs highly between CEX. Note, that it is also possible that the other side of the arbitrage executes on a different blockchain, but here we are also not able to link the identity of wallets on different chains.
However, we are still able to infer whether a transaction is likely to be a non-atomic arbitrage. The main assumption that guides are following heuristics is as follows:
Assumption. Non-atomic arbitrage transactions have a high value, i.e., a significant profit can be made. Thus, searchers performing these non-atomic arbitrages are likely to protect their transaction (i.e., submit it privately such that it cannot be copied) and pay suspicious amounts to have their “simple” swap included (i.e., tip the miner through significant priority fees or direct transfers).
Guided by this assumption we apply the following five heuristics to identify non-atomic arbitrage transactions.
Heuristic 1. The transaction is a simple swap, i.e., (1) executes exactly one swap in a DEX, (2) is not labeled as a sandwich attack (frontrun, backrun, or victim), a DEX arbitrage, or a liquidation, and (3) does not use more than 400,000 in gas.
Heuristic 2. The transaction is private, i.e., it did not enter the mempool before the block was propagated.
Heuristic 3. The transaction includes a coinbase transfer to the fee recipient or its priority fee exceeds 1 GWei.
Heuristic 4. The swap executed by the transaction is either the first swap that executes in the pool in its direction, or all preceding transactions had the same recipient.
Heuristic 5. The swap exchanges two established tokens, i.e., traded on CEXes (cf. Appendix E for a list).
Heuristic 1 ensures that the transaction only executes a “simple” swap on a DEX and that we do not mix it up with another type of high-value MEV transaction. Note, that we also limit the size of the transaction in units of gas to ensure that the transaction does not execute further complicated logic we have no insights into. Together, heuristics 2 and 3 allow us to identify that the transaction is valuable as it was submitted privately and tips the validator. With heuristic 4 we ensure that the transaction is the first transaction to execute in the respective direction in the pool. If this were not to be the case, the price in the pool would already have moved unfavorably for the transaction, and the sought-after arbitrage transaction might already have been closed. Finally, heuristic 5 ensures that there is likely to be another market for the trade executed, i.e., that it is possible to make the other side of the trade on a CEX for instance. Note that a transaction that violates heuristics 2, 3, 4, or 5 might still be a non-atomic arbitrage, but in that case, is likely to be a less sought-after opportunity. However, wherever possible we are conservative with what we label as non-atomic arbitrage. We also note that a transaction that does not perform any arbitrage could fulfill all our heuristics.
total swaps simple private first swap in pool top tokens coinbase transfer priority fee coinbase transfer or priority fee all heuristic 1 heuristic 2 heuristic 4 heuristic 5 heuristic 3 beaversearchers 1,188,696 0.982 0.815 0.826 0.822 0.608 0.313 0.917 0.580 rsyncsearchers 346,570 1.000 0.997 0.924 0.931 0.059 0.895 0.954 0.884 mantasearcher 60,813 0.999 0.941 0.921 0.955 0.940 0.057 0.977 0.879 overall 77,019,583 0.651 0.317 0.280 0.151 0.036 0.568 0.601 0.028
Thus, to test our heuristics we measure the proportion of transactions our heuristic applies to for integrated searchers previously identified to be performing non-atomic arbitrage on the Ethereum blockchain (e.g., searchers associated with beaverbuild, mantabuilder and rsyncbuilder) [4] and compare that figure to all transactions in our data collection period. In Table II, we record what proportion of transactions each of our heuristics applies to. The last column in Table II indicates what proportion of transactions from these integrated searchers as well as overall our heuristics capture. We find that our heuristics apply to 58.0%, 87.9%, and 88.4% of transactions from the integrated searchers associated with beaverbuild, mantabuild, and rsyncbuilder respectively, but only apply to 2.8% of transactions overall.
When considering the integrated searchers from the three builders known to perform non-atomic arbitrage, we notice that our heuristics apply to nearly 90% of transactions of mantasearcher and the rsyncsearchers, but only around 60% of transactions from the beaversearchers. More than 90% transactions from mantasearcher and rsynchsearchers meet each of our heuristics. Interestingly, mantasearcher tips through coinbase transfers whereas rsyncbuild tips through priority fees. For transactions from beaversearchers, our heuristics do not apply as commonly. They are especially less likely to be private (heuristic 2), the first swap that executes in a pool (heuristic 4), and less likely to swap two established tokens (heuristic 5). When analyzing transactions by beaverbuild that do not meet the heuristic, we find that sometimes it appears that they still perform the non-atomic arbitrages, but that these are less valuable, i.e., swap less known tokens and/or only transfer smaller volumes. Thus, in these cases, it might also be less important for beaverbuild to protect their transaction, i.e., do not send the transaction privately. In other cases, it appears that beaverbuild is not performing non-atomic arbitrages, failed at performing the non-atomic arbitrage or again only performs a less valuable non-atomic arbitrage, as at least one swap that moves the price in an unfavorable direction for beaverbuilds swap precedes it. Finally, we find that for one month, the beaversearchers were not paying tips, but were instead subsidized by the beaverbuilder (cf. Appendix A.2). Thus, exclusively for beaversearchers, we do not require them to fulfill heuristic 3, if the swap executes in a block built by the beaverbuilder. In doing so, 60.4% of swaps by the beaversearchers fulfill these tailored heuristics. We note that we likely do not capture all non-atomic arbitrage transactions from beaversearchers as our heuristics are potentially too strict, but stick to our heuristic to avoid overstating the prevalence of this type of arbitrage.
Finally, we note again that our heuristics apply to the (vast) majority of transactions from the previously identified seachers, but only to 2.8% of swaps overall. Further, half of these transactions are swaps that meet all heuristics from the searchers associated with beaverbuild, mantabuilder, and rsyncbuilder. Thus, we believe that our heuristics are well-tailored to identifying non-atomic arbitrage. We will further show in the following that eleven searchers are responsible for more than 80% of these identified non-atomic arbitrage trades, an additional indicator that our heuristics are well-suited to capture non-atomic arbitrage.
6 Analyzing Non-Atomic Arbitrage
In the following, we analyze the non-atomic arbitrage identified with our previously introduced heuristics.
6.1 Non-Atomic Arbitrage Trade Landscape
We start by providing a general overview of the non-atomic arbitrage on DEXes. On average, we identify 0.346 trades as non-atomic arbitrages per block during our data collection window that spans a little over a year. This figure is in comparison to 0.732 sandwich attacks, 0.175 cyclic arbitrage (i.e., atomic on-chain arbitrage), and 0.002 liquidations. Recall, that sandwich attacks, cyclic arbitrage, and liquidations are considered the most common and well-studied types of MEV. Thus, non-atomic arbitrage, in terms of the number of occurrences is the second most prevalent type of MEV out of these four on the Ethereum blockchain.
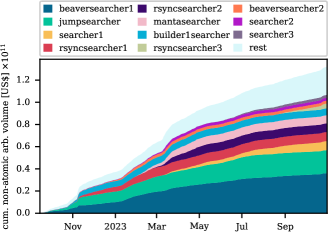
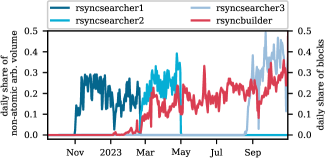
In Figure 5, we consider the cumulative volume of non-atomic arbitrage over time and highlight the eleven biggest searchers performing non-atomic arbitrage by volume. Note that we provide a mapping from searcher name to address in Appendix D. Further note that some searchers (beaversearcher1, beaverseacher2, rsyncseacher1, rsyncseacher2, rsyncseacher3, and mantaseacher) have names that suggest that they are linked to large builders in the PBS scheme (beaverbuild, rsyncbuilder and mantabuilder) [20]. We note here that this is due to our suspect that the respective builders and searchers are controlled by the same entities and we will detail our reasoning in Section 6.3.
Returning to Figure 5, in total, the volume of trades we identify as non-atomic arbitrage are responsible for 132 billion US$ on DEXes, e.g., Uniswap V2, Uniswap V3, Sushiswap, Curve, and Balancer. Startlingly, the total volume on these five DEXes in the same period of time is 460 billion US$ [21]. Thus, the identified non-atomic arbitrage accounts for nearly 30% of the total volume of the five biggest DEXes on the Ethereum blockchain.
We reiterate here that there is no clear-cut way of identifying non-atomic arbitrage, as we lack data transparency regarding the off-chain. However, the fact that merely eleven searchers are responsible for 80% of the non-atomic arbitrage volume identified in our analysis and that we identify the majority of their transaction as non-atomic arbitrage trades for all but one searcher (cf. Appendix C), leads us to believe that our heuristics are well-suited to identify non-atomic arbitrage transactions. Note that these eleven searchers can further be clustered into eight entities, three searchers associated with rsyncbuilder and the two searchers associated with beaverbuild (cf. Section 6.3 for a detailed description of the searcher/builder relationship identification). Thus, a very small number of entities is responsible for the vast majority of the non-atomic arbitrage volume on DEXes. In fact, the two biggest searchers, i.e., beaversearcher1 and jumpsearcher, account for 49.2% non-atomic arbitrage volume. We further point out that many of these large searchers (beaversearchers, jumpsearcher, rsyncsearchers, and mantasearcher) are rumored to be linked to HFT firms operating in traditional finance [4, 22], a further indicator that our heuristics capture non-atomic arbitrage as well as a sign that big players from traditional finance turning to DeFi for profits.
Finally, we highlight that two periods of time exhibit significant increases in the cumulative volume: (1) mid-November 2022, which is a period of time characterized by high volatility of cryptocurrencies during the FTX bankruptcy [23], and mid-March 2023, which corresponds to the USDC depeg and high cryptocurrency price volatility [24]. High cryptocurrency price volatility — leading to price differences between cryptocurrency markets — drives non-atomic arbitrage opportunities and these dramatic increases in non-atomic arbitrage volume during periods of high volatility are thus expected. We provide a more in-depth analysis of the correlation between price volatility and non-atomic arbitrage volume in Section 6.2.
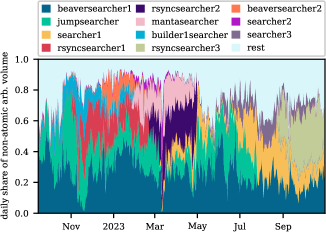
In regards to Figure 5, we conclude that the non-atomic arbitrage volume on DEXes is immense and controlled by a few large entities. To gain a better understanding of the evolution over time, we take a more in-depth look at the share of non-atomic arbitrage volume controlled by the large searchers in Figure 6. We start by noting that on nearly 75% of days, merely two searchers are responsible for 50% of the arbitrage volume – underlying the high concentration in the non-atomic arbitrage market. Interestingly, beaverseacher1, the biggest non-atomic arbitrage searcher, is the only major searcher operating through our entire data collection period. Generally, beaversearcher1 accounts for at least 10% of the volume except for during the two time periods characterized by very high cryptocurrency price volatility in the previous, i.e., mid-November 2022 and mid-March 2023. Potentially, the non-atomic arbitrage market becomes more competitive during days characterized by exceptional events in the blockchain ecosystem, and beaverseacher1 loses some market share as a result. The second biggest searcher, jumpsearcher, on the other hand, was operating since the merge but stopped in late July 2023, while searcher1, the third biggest searcher, only started operations in mid-March 2023 and from then on was operating throughout our entire data collection window. Interestingly, the three searchers associated with rsyncbuilder all operate during non-overlapping time windows, it appears that one searcher is replacing the other – potentially upgrades to the searcher smart contract. Furthermore, there was a period of time between May and September 2023, when no searcher we could associate with rsyncbuilder was operating.
beaversearcher1 jumpsearcher searcher1 rsyncsearcher1 rsyncsearcher2 mantasearcher builder1searcher rsyncsearcher3 beaversearcher2 searcher2 searcher3 proportion of trades 0.704 0.865 0.867 0.867 0.721 0.814 0.661 0.673 0.634 0.893 1.000 proportion of volume 0.916 0.901 0.933 0.922 0.898 0.937 0.813 0.855 0.912 0.973 1.000
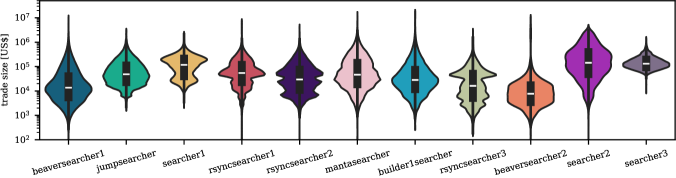
To get a better understanding of the differences in strategies utilized by the various searchers, we plot the distribution of trade sizes for each searcher as a violin plot in Figure 7. A violin plot includes a boxplot, which indicates the lower quantile, median, and upper quantile, as well as a kernel density plot to visualize the distribution of values. We observe clear differences in the trade size distribution between searchers (cf. Figure 7). For instance, beaversearcher1’s trade size distribution is quite smooth with the peak and median being around 10,000 US$ and trade sizes ranging from less than 100 US$ to more than 10 million US$. Interestingly, except beaverseacher2, all other major searchers have larger median trade sizes for their non-atomic arbitrage swaps. We further note that while their median trade sizes are slightly higher than that of beaverbuild, mantaseacher and builder1searcher exhibit similar trade size distributions to beaversearcher1. A couple of searchers (e.g., jumpsearcher, searcher1, searcher2, and searcher 3) appear to be specialized in high-volume non-atomic arbitrage trades. The median trade sizes of the former three all exceed 100’000 US$. Finally, we observe that the three rsyncbuilders tend to have several peaks in their trade size distributions, i..e, they seem to be biased towards several distinct trade sizes. Further, we observe that with each iteration of the rsyncsearcher, the median trade size declines. While we cannot be sure what the cause of this is, it could be a sign that with time rsync is turning towards smaller and likely less fought-after (as they are less valuable) non-atomic arbitrage transactions.
In Table III, we further analyze what proportion of non-atomic arbitrage volume and swaps by each of the largest eleven searchers are in pools between ETH, BTC, USDC, USDT, and DAI. These are the biggest cryptocurrencies on DEXes in terms of the number of swaps. One would assume that a significant proportion of volume is in such pools, given that these cryptocurrencies also have liquid markets on both DEXes and CEXes. We find that for all searchers but searcher3, who has exclusively had non-atomic arbitrage trades between these five tokens, the proportion of trades between these five tokens is smaller than the respective proportion of volume (cf. Table III). This discrepancy indicates that higher volume non-atomic arbitrage trades are executed between these five tokens, which is expected given that comparatively the DEX pools for these five tokens have higher liquidity. Therefore, it requires greater trade sizes to move the price as outlined in Section 4.1. Except for searcher3, we observe largely similar behavior in terms of the proportion of volume/trades executed between these five highly liquid tokens or otherwise for all searchers. Interestingly, we notice again that with each iteration of the rsyncsearchers, the proportion of trades/volume executed between the top five tokens drops. Thus, it again appears as if with time the rsyncbuilder is turning to potentially less fought-after non-atomic arbitrage transactions.
6.2 Drivers of Non-Atomic Trades
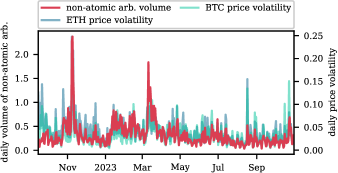
In the following, we investigate the drivers of non-atomic arbitrage trades on DEXes. Recall, that non-atomic arbitrage leverages price differences between two markets (likely an on-chain DEX and an off-chain CEX), and these are expected to be heightened in times of high cryptocurrency price volatility. In more detail, price volatility on CEXes can drive non-atomic arbitrage transactions, as it signals a divergence from the price at an on-chain DEX. Thus, we commence by investigating the relationship between the daily volume of trades we identified as non-atomic arbitrage trades and the daily price volatility of BTC and ETH in Figure 8. Note that we measure the BTC and ETH price volatility since the change in cryptocurrency prices is closely correlated to changes in the two [25]. We measure the daily volatility by where and are the daily high and low of the price respectively.
Looking at Figure 8, we observe that days with a high volume of non-atomic arbitrage trades tend to correspond to days with high BTC and ETH price volatility. We also observe again that the highest volume days correspond to two periods identified earlier: the FTX collapse in November 2022 and the USDC depeg in March 2023. We further note that the correlation between the daily ETH price volatility and the volume of non-atomic arbitrage is 0.725 with a p-value of – inferring extremely high statistical significance of the correlation. For the BTC price volatility, the correlation is even higher at 0.729 with a p-value of . Thus, price volatility of ETH and BTC on CEXes drives non-atomic arbitrage on DEXes.
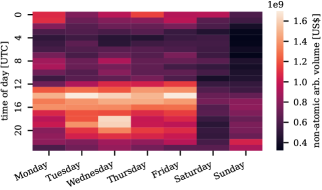
In Figure 9, we visualize the volume of non-atomic arbitrage trades by weekday and hour using UTC as the timezone. Observe that the highest volume in non-atomic arbitrage trades is seen Monday through Friday between 14:00 UTC and 21:00 UTC, which corresponds to US market openings. Especially US market opening at 14:30 UTC is associated with increased non-atomic arbitrage volume. An additional, less noticeable cluster of non-atomic arbitrage volume is observed Monday through Friday around 0:00 UTC, which corresponds to the opening of the Asian markets, and even less noticeable Monday through Friday at 8 am UTC – European market opening. This heightened volume during market hours and especially during the respective market openings is expected, as cryptocurrency prices are correlated with the US markets [26]. Thus, volatility in cryptocurrency prices is expected to increase during (US) market trading hours. Hence, we see a rise in the volume of non-atomic arbitrage trades during these times, as cryptocurrency prices are most volatile. We observe a final and interesting peak in non-atomic arbitrage volume on Wednesdays around 18:00 UTC. This corresponds to the time of the press conference following the Federal Open Market Committee Meeting at 19:00 UTC and the preceding release of notes at 18:30 UTC [27]. In this meeting decisions regarding the federal interest rate are made and they have led to significant market and cryptocurrency price movement [28].
To conclude, we identified the expected link between cryptocurrency price volatility and non-atomic arbitrage.
6.3 Integrated Seachers
As mentioned previously, the searchers looking for and executing non-atomic arbitrage opportunities and the builders in the PBS scheme building the block need not be separate entities. In fact, previous work [4] has demonstrated that three builders (i.e., beaverbuild, rsyncbuilder, and mantabuilder) are likely to operate their own non-atomic arbitrage searchers but did not establish links between these builders and specific searchers. These builders are referred to as HFT builders. We move to link non-atomic arbitrage searchers and builders in this section.
To start, we analyze what proportion of the non-atomic arbitrage volume by each of the biggest eleven searchers is included in blocks built by each of the biggest nine builders (cf. Figure 10). Note that we identify the biggest searchers and builders by the non-atomic arbitrage volume they traded and included in their blocks respectively. We further provide a mapping from searcher/builder name to their address/public key in Appendix D.
The darker the tone of blue in Figure 10, the larger the proportion of non-atomic arbitrage volume by the searcher in blocks by the corresponding builder. We, for instance, observe that more than half (i.e., 79% and 82% respectively) of the non-atomic arbitrage volume from beaverseacher1 and beaverseacher2 is in blocks by beaverbuild. Thus, it is likely that these two searchers are associated with beaverbuild and we name them accordingly. Additionally, we find evidence that beaverbuild was subsiding its integrated searchers for a month as we detail in Appendix A.2. This further shows that they are very likely to be the same entity.

Similarly, 83% of the non-atomic arbitrage volume of mantasearcher is found in blocks built by the mantabuilder, while 88% of volume from the rsyncsearcher2 and an astonishing 98% of volume from the rsyncsearcher3 is included in blocks by the rsyncbuilder. Note that there is no link between rsyncsearcher1 and rsyncbuilder in Figure 10 even though our naming suggests there to be a link. We are however, able to establish a link between rsyncsearcher1 and rsyncsearcher2, as the bytecode of their contracts is identical and they are thus likely to be the same entity as established in previous work [19]. We further comment that rsynbuilder was largely not operating at the same time as rsyncsearcher1 (cf. Figure 14(b)). Finally, we find a fourth, previously not identified, builder that is likely running an integrated non-atomic arbitrage builder: builder1. To be precise, 83% of the non-atomic arbitrage volume by builder1seacher is located in blocks built by builder1seacher.
Figure 10 allows us to observe ties between builders and searchers. However, at the same time, we also find that non-integrated searchers (e.g, jumpsearcher, searcher1, searcher2, and seacher3) have a harder time having their non-atomic arbitrage trades included in blocks by the four builders that have their own integrated builders, i.e., their non-atomic arbitrage trades are generally in blocks by flashbots, builder0x69, etc. Thus, it seems that either other searchers are less likely to submit their transactions to these four builders with integrated searchers or the four builders favor their integrated searchers.
We further take an in-depth look at the connections between HFT builders and their integrated searchers in Appendix A.1. Our analysis finds that for all builders the correlation between the share of daily blocks for which they won the PBS auction and the daily share of arbitrage volume by the respective integrated searcher is positive and the correlation is significant. Additionally, this correlation is slightly lower for beaverbuild and rsyncbuilder. This difference possibly stems from the fact that these builders also include significantly more sandwich attacks and cyclic arbitrage (i.e., common MEV types) than builder1 and mantabuilder. Thus, the value of their blocks is likely not solely driven by non-atomic arbitrage transactions.
6.4 Impact of Non-Atomic Arbitrage Trades
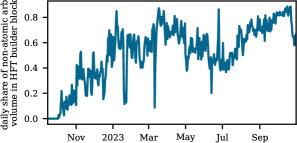
To conclude our analysis, we discuss the impact of non-atomic arbitrage and the vertical integration of searchers specializing in this arbitrage in the following. We start by noting that from 2023 onwards generally more than 50% of non-atomic arbitrage volume is found in HFT builder blocks (cf. Figure 11). Often this share rises to around 75%. Recall, that there are just four HFT builders, at no time were more than three of them in operation, and from May 2023 onwards only two were still operating (cf. Figure 14). Thus, we conclude that these builders have a grasp on the non-atomic arbitrage market.
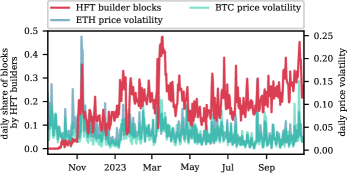
As we established in the previous section, cryptocurrency price volatility can drive non-atomic arbitrage transactions, as it signals a divergence from the price at an on-chain DEX. Thus, we analyze the relationship between ETH and BTC price volatility and the share of blocks won by HFT builders (cf. Figure 12). We notice both an increase in the daily share of HFT builder blocks over time but also a correlation between the share of blocks won by HFT builders and the price volatility. To be precise, in October 2023 the correlation between the share of blocks built by HFT builders and the Ethereum price volatility is 0.783 with a p-value of , whereas it is 0.650 for the BTC price volatility with a p-value of . Thus, we establish that on high volatility days, these HFT builders specialized in non-atomic arbitrage transactions are more likely to win blocks. This finding is in line with a previous analysis by Gupta et al. [4] that showed that between April and May 2023 beaverbuild, mantabuilder, and rsyncbuilder were more likely to win the PBS auction as the price volatility of the ETH-USD market on Binance.us increases.
To further investigate the effects of cryptocurrency price volatility and thereby non-atomic arbitrage on the system, we take a closer look at the volatility in the lead-up to a block, i.e., for block the price volatility between the time the block and block were first seen in the network. On average (if blocks are not missed) this is twelve seconds on Ethereum. Increased volatility during this time should lead to increasingly profitable and prevalent non-atomic arbitrage transactions.
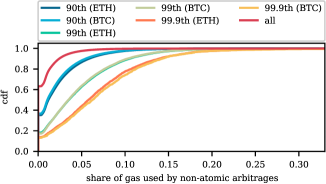
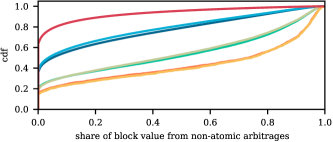
Figure 13 plots the cdf of gas usage and block value of non-atomic arbitrage depending on the ETH and BTC price volatility. Observe that the higher the BTC and ETH price volatility in the lead-up to the block, the larger the share of the block’s gas usage by non-atomic arbitrage trades. Note that this is in addition to already larger blocks during times of high volatility (cf. Appendix B). Thus, the increased prevalence of non-atomic arbitrage likely leads to increased block competition during times of high volatility. Importantly, this also leads to an increased base fee (i.e., the minimum fee required for block inclusion) for consecutive blocks as the base fee automatically increases based on the previous block size. Further, this increase in the price for transaction inclusion as well as the overfullness of the block likely leads to increased congestion in the mempool. Thus, the block space used by non-atomic arbitrage during times of high volatility impacts all Ethereum users.
We also analyze the share of block values (i.e., priority fees and direct transfers) that come from non-atomic arbitrage transactions in Figure 13(b). Again we find that the share of value from non-atomic arbitrage transactions increases with the volatility. In fact, in around 50 of blocks where the ETH and BTC volatility is in the 99.9 percentile, over 80 of the block value comes from non-atomic arbitrage transactions. Note again that not only the share of value from non-atomic arbitrage but also the block value increases in times of high volatility (cf. Appendix B). We further outline that the increased value from non-atomic arbitrage transactions in times of high volatility explains the higher likelihood that HFT builders to win blocks during times of high price volatility in ETH and BTC.
7 Discussion
In the following, we will highlight the implications of non-atomic arbitrage and hint at possible mitigation options.
7.1 Implication
The fees paid by non-atomic arbitrage transactions exceed current block rewards on the Ethereum PoS consensus layer repeatedly. For instance, their value exceeds the current consensus layer block reward by more than a factor of 10 in 15,360 blocks during our data collection period and we further note that their value measured in fees can be seen as a lower bound for the profit that can be extracted.
Previous works [6, 17] have demonstrated that MEV (i.e., high-value transactions) presents a risk to the consensus layer in PoW. To be exact, the consensus is vulnerable to time-bandit attacks, as it can be rational for the block proposer to fork the blockchain to exploit MEV in previous blocks themselves. Re-orgs, required by time-bandit attacks, have become harder in Ethereum PoS [29], but regardless such high-value transactions present a challenge to the consensus layers. For instance, an entity controlling a significant proportion of the staking power could purposefully withhold attestations blocks preceding its turn as block proposer to increase the chance of a possible re-org during its turn as proposer being successful. Note that the biggest staking pool currently controls around one-third of the staking power [30] and that the losses from missed attestations are minimal.
Additionally, we show that in times of high cryptocurrency price volatility, we observe spikes in non-atomic arbitrage transactions on the Ethereum blockchain. This increase in non-atomic arbitrage transactions leads to overfull blocks resulting in increased waiting times and increased fees for the remaining Ethereum users.
Centralization of Block Building. We further comment on the centralizing effects of non-atomic arbitrage in the block construction market. Gupta et al. [4] have shown that HFT builders (i.e., builders with integrated non-atomic arbitrage searchers) are more likely to win blocks during times of high cryptocurrency for a one-month period in early 2023. We extend these findings to the entire history of Ethereum PoS until the end of October 2023 and highlight the relationships between builders and their integrated searchers. Our work further establishes a direct tie between the likelihood of these HFT builders winning the PBS auction and the volume of non-atomic arbitrage by their integrated searchers. As a result, during times of high cryptocurrency price volatility block building is largely left to two remaining HFT builders – a worrying centralization of the block construction market.
7.2 Mitigation
We delve into possible mitigations to non-atomic arbitrage and its centralizing effects in the following.
Separating Top of Block. One possible avenue to work against these centralizing effects of non-atomic arbitrage suggested by Gupta et al. [4] is to separate top-of-block extractions, i.e., non-atomic arbitrage that generally takes place top-of-block as these swaps wish to be the first to execute in the respective pools, and block-body extraction. By unbundling the PBS auction as outlined, the HFT builders specialized in non-atomic arbitrage would still dominate the top-of-block opportunities in times of high volatility, but would minder the effects on the rest of the block body. While we believe that this would be a step in the right direction, some problems remain. For one, the size of the top-of-block would likely have to be limited as otherwise, these top-of-block opportunities are likely to take up more than half the block space in times of high volatility. Additionally, while this approach would limit the centralizing effects of non-atomic arbitrage, it would not target the security implications (i.e., time-bandit attacks) outlined previously.
Reduction of Block Time. A further possible mitigation is block time (i.e., time between two consecutive blocks) reduction. This reduction would lead to less profitable non-atomic arbitrage opportunities as the expected price change would be reduced as we show in Section 4.1 and is also discussed by Milionis et al. [31, 32]. If these arbitrage opportunities are less profitable their impact on the ecosystem should naturally lessen. Note that the possible ramifications of block time reduction on the consensus layer should not be underestimated, but another possible avenue would be to move the DEX volume to Layer 2s such as Arbitrum and Optimism which already have much shorter block times.
8 Related Work
Maximal Extractable Value. An active line of research is devoted to describing and measuring MEV on the Ethereum blockchain. Blockchain front-running attacks were first systematized by Eskandari et al. [33] and the term MEV was introduced by Daian et al. [6] in an early description of front-running on decentralized exchanges. Our work studies a new form of MEV, i.e., non-atomic arbitrage, that was not previously investigated in depth.
Comprehensive measurements of MEV on the Ethereum blockchain were subsequently performed by Zhou et al. [18], Ferreira et al. [19], and Qin et al. [17]. An in-depth study of liquidations was presented by Qin et al. [7], whereas Wang et al. [1] carried out a measurement study focused on cyclic arbitrage. In this work, we perform a measurement study of non-atomic arbitrage on DEXes, a type of MEV prevalent in Ethereum PoS, that is not included in existing MEV measurements.
A related line of research is devoted to preventing front-running on the blockchain [34, 35, 36, 37, 38, 39, 40, 41, 42, 43, 44, 45, 46, 47, 48, 49, 50, 51, 52, 53, 54], and a comprehensive overview of these approaches is provided by Heimbach et al. [55]. Of these approaches, only those that focus on ensuring that transactions are included first in, first out are still applicable to the non-atomic arbitrage we describe.
Liquidity Providers on Decentralized Exchanges. Multiple works study the risks of liquidity providers on DEXes. Traditionally these risks have been measured in what is known as impermanent loss [56, 57]. More recently, Milionis et al. [31, 32] introduced the concept of loss-versus-rebalancing (LVR) to quantify the losses of DEX liquidity providers, which can be thought of as the expected profit of non-atomic arbitrage. Their works analytically quantify the expected profit of non-atomic arbitrage. In this work, on the other hand, we empirically study the prevalence of non-atomic arbitrage on DEXes and discuss its ramifications beyond liquidity providers.
Proposer Builder Separation. Given the immense impact of PBS on Ethereum’s block construction market, multiple works [11, 20, 58, 59, 60] investigate this novel scheme. These works investigate the block value distribution between builders and proposers, censorship resistance, and highlight the increase in centralization in the block construction market under PBS. Gupta et al. [4] further study HFT builders, i.e., builders known to perform non-atomic arbitrage, in the PBS scheme. Their work shows that these builders are more likely to win blocks during periods characterized by high cryptocurrency price volatility. Our work, on the other hand, studies HFT builders performing non-atomic arbitrage in detail. In comparison to this work, we take a broader view, i.e., identifying all swaps that are likely to be non-atomic arbitrage, and analyzing the prevalence of such trades, how they are distributed between searchers and builders, and their impact on the ecosystem.
9 Conclusion
With this work, we uncover the prevalence, centralizing effects, and implications of non-atomic arbitrage. Our measurement study highlights that more than one-fourth of DEX volume is likely to be non-atomic arbitrage and that HFT builders specialized in non-atomic arbitrage have an advantage in the PBS auction in times of high volatility. Besides highlighting the centralizing effects of non-atomic arbitrage on the block construction market, we also discuss its security implications as well as effects on the broader Ethereum ecosystem and its users. Finally, we point at possible mitigations and hope that the insights from our work positively affect future developments.
References
- [1] Y. Wang, Y. Chen, H. Wu, L. Zhou, S. Deng, and R. Wattenhofer, “Cyclic Arbitrage in Decentralized Exchanges,” in Companion Proceedings of the Web Conference 2022. ACM, 4 2022, pp. 12–19.
- [2] “Total Value Locked,” https://defillama.com/chains.
- [3] “MEV-Boost Dashboard,” https://mevboost.pics/.
- [4] T. Gupta, M. M. Pai, and M. Resnick, “The centralizing effects of private order flow on proposer-builder separation,” in 5th Conference on Advances in Financial Technologies, 10 2023.
- [5] “Proposer-Builder Separation,” https://ethereum.org/roadmap/pbs/.
- [6] P. Daian, S. Goldfeder, T. Kell, Y. Li, X. Zhao, I. Bentov, L. Breidenbach, and A. Juels, “Flash boys 2.0: Frontrunning in decentralized exchanges, miner extractable value, and consensus instability,” in 2020 IEEE Symposium on Security and Privacy (SP), 5 2020, pp. 910–927.
- [7] K. Qin, L. Zhou, P. Gamito, P. Jovanovic, and A. Gervais, “An empirical study of defi liquidations: incentives, risks, and instabilities,” in Proceedings of the 21st ACM Internet Measurement Conference. ACM, 11 2021, pp. 336–350.
- [8] “DefiLlama,” https://defillama.com/protocols/dexes/Ethereum.
- [9] “Zeromev,” https://zeromev.org/.
- [10] Mempool Guru, “Mempool Guru,” https://mempool.guru/, 2023.
- [11] S. Yang, F. Zhang, K. Huang, X. Chen, Y. Yang, and F. Zhu, “SoK: MEV Countermeasures: Theory and Practice,” arXiv preprint arXiv:2212.05111, 2023.
- [12] Binance, “Historical Market Data,” https://www.binance.com/en/landing/data, 2023.
- [13] “Today’s cryptocurrency prices by market cap,” 2023. [Online]. Available: https://coinmarketcap.com/
- [14] H. Adams, N. Zinsmeister, and D. Robinson, “Uniswap v2 core,” 2020.
- [15] H. Adams, N. Zinsmeister, M. Salem, R. Keefer, and D. Robinson, “Uniswap v3 core,” 2021.
- [16] Sushiswap, “Be a Crypto Chef with Sushi,” https://docs.sushi.com/pdf/whitepaper.pdf, 2023.
- [17] K. Qin, L. Zhou, and A. Gervais, “Quantifying blockchain extractable value: How dark is the forest?” in 2022 IEEE Symposium on Security and Privacy (SP). IEEE, 5 2022, pp. 198–214.
- [18] L. Zhou, K. Qin, C. F. Torres, D. V. Le, and A. Gervais, “High-Frequency Trading on Decentralized On-Chain Exchanges,” in 2021 IEEE Symposium on Security and Privacy (SP). IEEE, 5 2021, pp. 428–445.
- [19] C. F. Torres, R. Camino, and R. State, “Frontrunner Jones and the Raiders of the Dark Forest: An Empirical Study of Frontrunning on the Ethereum Blockchain,” in 30th USENIX Security Symposium, 8 2021, pp. 1343–1359.
- [20] L. Heimbach, L. Kiffer, C. Ferreira Torres, and R. Wattenhofer, “Ethereum’s Proposer-Builder Separation: Promises and Realities,” in 2023 ACM Internet Measurement Conference (IMC), Montreal, QC, Canada, Oct. 2023.
- [21] “DefiLlama API,” https://defillama.com/docs/api.
- [22] “Jump Etherscan,” https://etherscan.io/address/0x9507c04b10486547584c37bcbd931b2a4fee9a41, 2023.
- [23] Investopedia, “The Collapse of FTX: What Went Wrong With the Crypto Exchange?” https://www.investopedia.com/what-went-wrong-with-ftx-6828447, 2023.
- [24] Cointelegraph, “TUSDC depegs as Circle confirms $3.3B stuck with Silicon Valley Bank,” https://cointelegraph.com/news/usdc-depegs-as-circle-confirms-3-3b-stuck-with-silicon-valley-bank, 2023.
- [25] Blockworks, “The Investor’s Guide to Crypto Correlation,” https://blockworks.co/news/the-investors-guide-to-crypto-correlation, 2023.
- [26] K. Q. Nguyen, “The correlation between the stock market and bitcoin during covid-19 and other uncertainty periods,” Finance Research Letters, vol. 46, p. 102284, 2022. [Online]. Available: https://www.sciencedirect.com/science/article/pii/S1544612321003238
- [27] “Meeting calendars, statements, and minutes (2018-2024),” https://www.federalreserve.gov/monetarypolicy/fomccalendars.html, 2023.
- [28] “How the fed impacts stocks, crypto and other investments,” https://www.bankrate.com/investing/federal-reserve-impact-on-stocks-crypto-other-investments/#crypto, 2023.
- [29] G. Konstantopoulos and V. Buterin, “Ethereum Reorgs After The Merge,” https://www.paradigm.xyz/2021/07/ethereum-reorgs-after-the-merge, 2021.
- [30] D. Grandjean, L. Heimbach, and R. Wattenhofer, “Ethereum Proof-of-Stake Consensus Layer: Participation and Decentralization,” arXiv preprint arXiv:2306.10777, 2023.
- [31] J. Milionis, C. C. Moallemi, T. Roughgarden, and A. L. Zhang, “Automated Market Making and Loss-Versus-Rebalancing,” arXiv preprint arXiv:2208.06046, 2022.
- [32] J. Milionis, C. C. Moallemi, and T. Roughgarden, “Automated Market Making and Arbitrage Profits in the Presence of Fees,” arXiv preprint arXiv:2305.14604, 2023.
- [33] S. Eskandari, S. Moosavi, and J. Clark, “SoK: Transparent Dishonesty: Front-Running Attacks on Blockchain,” in Financial Cryptography and Data Security, vol. 11599. Springer International Publishing, 2020, pp. 170–189.
- [34] I. Bentov, Y. Ji, F. Zhang, L. Breidenbach, P. Daian, and A. Juels, “Tesseract: Real-time cryptocurrency exchange using trusted hardware,” in Proceedings of the 2019 ACM SIGSAC Conference on Computer and Communications Security, ser. CCS ’19, 2019, p. 1521–1538.
- [35] C. Stathakopoulou, S. Rüsch, M. Brandenburger, and M. Vukolić, “Adding Fairness to Order: Preventing Front-Running Attacks in BFT Protocols using TEEs,” in 2021 40th International Symposium on Reliable Distributed Systems (SRDS). IEEE, 2021, pp. 34–45.
- [36] M. Kelkar, F. Zhang, S. Goldfeder, and A. Juels, “Order-Fairness for Byzantine Consensus,” in Annual International Cryptology Conference. Springer, 2020, pp. 451–480.
- [37] L. Baird, “The Swirlds Hashgraph Consensus Algorithm: Fair, Fast, Byzantine Fault Tolerance,” Swirlds Tech Reports SWIRLDS-TR-2016-01, Tech. Rep, 2016.
- [38] K. Kursawe, “Wendy, the Good Little Fairness Widget: Achieving Order Fairness for Blockchains,” in Proceedings of the 2nd ACM Conference on Advances in Financial Technologies, 2020, pp. 25–36.
- [39] Y. Zhang, S. Setty, Q. Chen, L. Zhou, and L. Alvisi, “Byzantine Ordered Consensus Without Byzantine Oligarchy,” in 14th USENIX Symposium on Operating Systems Design and Implementation (OSDI 20), 2020, pp. 633–649.
- [40] M. Kelkar, S. Deb, and S. Kannan, “Order-Fair Consensus in the Permissionless Setting,” IACR Cryptol. ePrint Arch., vol. 2021, p. 139, 2021.
- [41] M. Kelkar, S. Deb, S. Long, A. Juels, and S. Kannan, “Themis: Fast, Strong Order-Fairness in Byzantine Consensus,” Cryptology ePrint Archive, Report 2021/1465, 2021.
- [42] C. Cachin, J. Mićić, and N. Steinhauer, “Quick Order Fairness,” in Financial Cryptography and Data Security (FC), Grenada, 2022.
- [43] M. K. Reiter and K. P. Birman, “How to Securely Replicate Services,” ACM Transactions on Programming Languages and Systems (TOPLAS), vol. 16, no. 3, pp. 986–1009, 1994.
- [44] A. Miller, Y. Xia, K. Croman, E. Shi, and D. Song, “The Honey Badger of BFT Protocols,” ser. CCS ’16, 2016, p. 31–42.
- [45] A. Asayag, G. Cohen, I. Grayevsky, M. Leshkowitz, O. Rottenstreich, R. Tamari, and D. Yakira, “A Fair Consensus Protocol for Transaction Ordering,” in 2018 IEEE 26th International Conference on Network Protocols (ICNP), 2018.
- [46] A. Orda and O. Rottenstreich, “Enforcing Fairness in Blockchain Transaction Ordering,” Peer-to-peer Networking and Applications, vol. 14, no. 6, pp. 3660–3673, 2021.
- [47] H. Zhang, L.-H. Merino, V. Estrada-Galinanes, and B. Ford, “Flash freezing flash boys: Countering blockchain front-running,” in 2022 IEEE 42nd International Conference on Distributed Computing Systems Workshops (ICDCSW). IEEE, 2022, pp. 90–95.
- [48] A. Constantinescu, D. Ghinea, L. Heimbach, Z. Wang, and R. Wattenhofer, “A Fair and Resilient Decentralized Clock Network for Transaction Ordering,” in 27th International Conference on Principles of Distributed Systems (OPODIS), Tokyo, Japan, Dec. 2023.
- [49] P. Momeni, S. Gorbunov, and B. Zhang, “Fairblock: Preventing Blockchain Front-Running with Minimal Overheads,” in Security and Privacy in Communication Networks: 18th EAI International Conference, SecureComm 2022, Virtual Event, October 2022, Proceedings. Springer, 2023, pp. 250–271.
- [50] A. Tatabitovska, O. Ersoy, and Z. Erkin, “Mitigation of Transaction Manipulation Attacks in UniSwap,” 2021.
- [51] L. Breidenbach, P. Daian, F. Tramèr, and A. Juels, “Enter the Hydra: Towards Principled Bug Bounties and Exploit-Resistant Smart Contracts,” in 27th USENIX Security Symposium, 2018, pp. 1335–1352.
- [52] Y. Doweck and I. Eyal, “Multi-Party Timed Commitments,” arXiv preprint arXiv:2005.04883, 2020.
- [53] L. Heimbach and R. Wattenhofer, “Eliminating Sandwich Attacks with the Help of Game Theory,” in ACM Asia Conference on Computer and Communications Security (ASIA CCS), Nagasaki, Japan, Jun. 2022.
- [54] L. Zhou, K. Qin, and A. Gervais, “A2MM: Mitigating Frontrunning, Transaction Reordering and Consensus Instability in Decentralized Exchanges,” 2021.
- [55] L. Heimbach and R. Wattenhofer, “SoK: Preventing Transaction Reordering Manipulations in Decentralized Finance,” in 4th ACM Conference on Advances in Financial Technologies (AFT), Cambridge, MA, USA, Sep. 2022.
- [56] L. Heimbach, Y. Wang, and R. Wattenhofer, “Behavior of Liquidity Providers in Decentralized Exchanges,” in 2021 Crypto Valley Conference on Blockchain Technology (CVCBT), Rotkreuz, Switzerland, Oct. 2021.
- [57] L. Heimbach, E. Schertenleib, and R. Wattenhofer, “Risks and Returns of Uniswap V3 Liquidity Providers,” in 4th ACM Conference on Advances in Financial Technologies (AFT), Cambridge, MA, USA, Sep. 2022.
- [58] A. Wahrstätter, J. Ernstberger, A. Yaish, L. Zhou, K. Qin, T. Tsuchiya, S. Steinhorst, D. Svetinovic, N. Christin, M. Barczentewicz, and A. Gervais, “Blockchain Censorship,” arXiv preprint arXiv:2305.18545, 2023.
- [59] A. Wahrstätter, L. Zhou, K. Qin, D. Svetinovic, and A. Gervais, “Time to Bribe: Measuring Block Construction Market,” arXiv preprint arXiv:2305.16468, 2023.
- [60] C. Schwarz-Schilling, F. Saleh, T. Thiery, J. Pan, N. Shah, and B. Monnot, “Time is Money: Strategic Timing Games in Proof-of-Stake Protocols,” arXiv preprint arXiv:2305.09032, 2023.
Appendix A HFT Builders
In the following, we provide an in-depth analysis of the ties between HFT builders and integrated searchers.
A.1 Searcher - Builder Ties
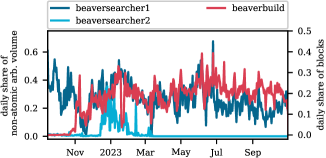
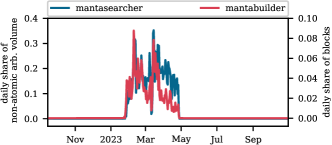
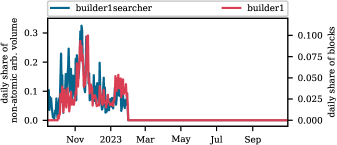
In Figure 14 we plot the daily share of blocks on the Ethereum network they built against the daily share of the non-atomic arbitrage volume executed by their integrated searchers for each HFT builder. Interestingly, both beaverbuild (cf. Figure 14(a)) and rsyncbuilder (cf. Figure 14(b)) were active as searchers, before their builders started to be active. For beaverbuild the delay is around one and a half months whereas it is around two months for rsyncbuilder. Additionally, there was a period where the rsyncbuilder was operating from May to September 2023 but we could associate no searcher with rsyncbuilder during that time window. However, during times when at least one integrated searcher and the builders were operating we find that there is a correlation between the share of non-atomic arbitrage volume swapped by the integrated searchers and the share of blocks won by the respective builders. We find that the correlation between the share of non-atomic arbitrage volume by beaversearcher1 and beaversearcher2 and the share of block won by beaverbuild is 0.244 with a p-value of – indicating very high statistical significance even though the correlation is relatively small. During the operation of rsynsearcher2, the correlation between the share of non-atomic arbitrage volume by rsyncseracher2 and the share of block won by rsyncbuilder is 0.805 with a p-value of , whereas it correlation is 0.502 with a p-value of during lifetime of rsyncseacher3.
Turing to mantabuilder (cf. Figure 14(c)) and builder1 (cf. Figure 14(d)), we observe for both of them the searcher and builder are operating for the same period. During that time the correlation between the share of volume by the searcher and the share of blocks won by the builder is higher than 0.7. We further note that interestingly, mantabuilder comes into operation with its searcher just as builder1 closes operation.
beaverbuild rsyncbuilder builder1 mantabuilder sandwich attacks per block 0.041 0.043 0.000 0.001 cyclic arbitrage per block 0.008 0.006 0.003 0.001
To explain the lower correlation between the market shares of beaverbuild and its searchers in comparison to the other HFT builders, we take a look at the number of sandwich attacks and cyclic arbitrage transactions these builders include in their blocks. In Table IV find that beaverbuild and rsyncbuilder, where we also saw a lower correlation during the operation of rsyncseacher3, are much more likely to include sandwich attacks and cyclic arbitrage in their blocks, than builder1 and mantabuilder. Thus, we believe that the block value of beaverbuild and rsyncbuilder blocks also come from other types of MEV. Therefore, it is not only the non-atomic arbitrage volume that determines the value of their blocks even though it is a very significant driver.
A.2 Beaverbuild
Next, we further cement the relationship between beaverbuild and its integrated searchers by highlighting that beaverbuild was likely subsidizing its searchers for around a month. Figure 15 shows beaverbuild’s daily profit (i.e., the difference between priority fees and direct transfers from transactions and the payment to the proposer) and we observe that it is consistently negative between 3 February and 14 March 2023 (from block 16,544,549 to 16,822,491). Thus, during this time beaverbuild was offering proposers a higher bid than what transactions in the blocks have paid in fees. For example, in block 16,627,349 these fees amounted to 56.18 ETH even though the total amount received in fees was 0.059 ETH. Hence, it is very likely that beaverbuild has another source of income, whereby they can afford to pay the proposers such large fees. We note that these suspicious negative profits were also identified by Heimbach et al. [20], but no further explanation was given.
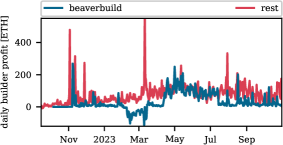
We find that the beaverbuild was in all likelihood subsidizing its own builder. In the following, we check whether the large fees could be explained by the prevalence of these searchers within blocks that offer a higher bid. For this, we look at all blocks that were built by beaverbuild during this time, and which blocks offered larger bids than what they earned in transaction fees.
During this time beaverbuild built 48,606 blocks, with 35,584 (73.2%) blocks offering the proposer a value larger than the fee that they received. We find that 34,682 blocks (around 97.46% of blocks) had at least one transaction from either beaversearcher1 or beaversearcher2. Furthermore, in the remaining 13,022 blocks only 2,802 blocks (around 21.5%) had at least one transaction from either searcher. During this time beaverbuild received a total of 1,941.1 ETH in fees but paid proposers 6,620.94 ETH. This corresponds to a loss of over 4,679.84 ETH. This is further evidence of integrated builder searchers and points to the fact that these searchers are run by beaverbuild themselves. Furthermore, this makes our claim stronger that builders themselves profit from non-atomic arbitrage since beaverbuild had a loss of over 3,195.76 ETH on-chain. For all the non-beaverbuild blocks over this time, we find that out of 211,960 only 17,378 blocks (7.6%) offer bids to proposers that are larger than what they received in fees from transactions. There was a total of 31,954.07 ETH paid in fees by transactions, and 28,245.00 ETH being paid to proposers.
Appendix B Effects on Volatility
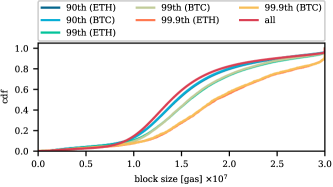
We analyze the effects of high cryptocurrency price volatility on the block sizes and block value (i.e., priority fees and direct transfers) in Figure 16. First, we note blocks with high cryptocurrency price volatility tend to be fuller as we see in Figure 16(a). Note that in Ethereum the target size for a block is , while the maximum block size is . For blocks in the 99.9 percentile in terms of price volatility only around 20% of them are at target size or smaller, whereas around 50% of overall blocks are no larger than target size.
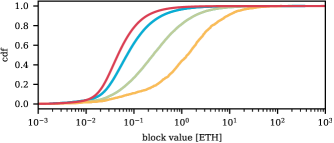
Additionally, we find that blocks built during periods of high volatility are more valuable (cf. Figure 16(b)). For instance for blocks in the 99.9 percentile in terms of price volatility, more than half of them are at least worth 1 ETH, in comparison to less than 1% overall.
total swaps simple private first swap in pool top tokens coinbase transfer priority fee coinbase transfer or priority fee all heuristic 1 heuristic 2 heuristic 4 heuristic 5 heuristic 3 beaversearchers 1,188,696 0.982 0.815 0.826 0.822 0.608 0.313 0.917 0.580 rsyncsearchers 346,570 1.000 0.997 0.924 0.931 0.059 0.895 0.954 0.884 jumpsearcher 232,226 1.000 0.956 0.986 0.989 0.000 1.000 1.000 0.943 builder1searcher 86,709 0.999 0.881 0.895 0.926 0.853 0.138 0.989 0.805 mantasearcher 60,813 0.999 0.941 0.921 0.955 0.940 0.057 0.977 0.879 searcher1 57,824 0.978 0.996 0.990 0.993 0.000 1.000 1.000 0.963 searcher2 46,878 0.441 0.999 0.700 0.479 0.075 0.424 0.499 0.174 searcher3 16,201 1.000 0.998 0.989 1.000 1.000 0.000 1.000 0.988 overall 77,019,583 0.651 0.317 0.280 0.151 0.036 0.568 0.601 0.028
Appendix C Heuristics
To further ensure the validity of our heuristics, we investigate for each of the largest eleven searchers identified what proportion of their transactions we flag as non-atomic arbitrage in Table V. The previously identified non-atomic arbitrage searchers that we studied to develop these heuristics are included for completeness but marked in bold. We further note that these searchers are implemented as smart contracts and are likely to specialize in one profitable type of transaction. Thus, if we identify the majority of a searcher’s transactions as non-atomic arbitrage it is very likely that this classification is accurate. Turning to Table V, we notice that for all newly identified searcher except one (i.e., seacher2), more than 80% of their transactions fulfill all our five heuristics. This leads us to conclude that these searchers are in fact performing non-atomic arbitrage. We believe that we are more likely to undercount non-atomic arbitrage as the remaining swaps from these wallets are also likely to be (failed) non-atomic arbitrage swaps (i.e., they tend to be simple transfers and the first in the pool). However, we do not include these in our analysis to avoid overstating the volume of non-atomic arbitrage. Finally, we note that for searcher2 our heuristics only apply to 17% of swaps on DEXes. While the swaps we identify as non-atomic arbitrage appear to be exactly that this searcher also appears to perform other types of high-value transactions given that less than half of its swaps classify as simple.
Appendix D Builder and Seacher Addresses
We provide a mapping from searcher name to their address in Table VI, as well as mapping from builder names to their address(es) and public key(s) in Table VII.
| name | address |
|---|---|
| beaversearcher1 | 0xa69babef1ca67a37ffaf7a485dfff3382056e78c |
| beaversearcher2 | 0xa57bd00134b2850b2a1c55860c9e9ea100fdd6cf |
| builder1searcher | 0x57c1e0c2adf6eecdb135bcf9ec5f23b319be2c94 |
| jumpsearcher | 0x9507c04b10486547584c37bcbd931b2a4fee9a41 |
| rsyncsearcher1 | 0x0087bb802d9c0e343f00510000729031ce00bf27 |
| rsyncsearcher2 | 0x280027dd00ee0050d3f9d168efd6b40090009246 |
| rsyncsearcher3 | 0x51c72848c68a965f66fa7a88855f9f7784502a7f |
| mantasearcher | 0xf8b721bff6bf7095a0e10791ce8f998baa254fd0 |
| searcher1 | 0xe8cfad4c75a5e1caf939fd80afcf837dde340a69 |
| searcher2 | 0x00000000008c4fb1c916e0c88fd4cc402d935e7d |
| searcher3 | 0xd7f3fbe8c72a961a5515203eada59750437fa762 |
| searcher4 | 0x000000000dfde7deaf24138722987c9a6991e2d4 |
| searcher5 | 0x98c3d3183c4b8a650614ad179a1a98be0a8d6b8e |
name address public key beaverbuild 0x95222290dd7278aa3ddd389cc1e1d165cc4bafe5 0x96a59d355b1f65e270b29981dd113625732539e955a1beeecbc471dd0196c4804574ff871d47ed34ff6d921061e9fc27 0xb5d883565500910f3f10f0a2e3a031139d972117a3b67da191ff93ba00ba26502d9b65385b5bca5e7c587273e40f2319 0x8dde59a0d40b9a77b901fc40bee1116acf643b2b60656ace951a5073fe317f57a086acf1eac7502ea32edcca1a900521 0xaec4ec48c2ec03c418c599622980184e926f0de3c9ceab15fc059d617fa0eafe7a0c62126a4657faf596a1b211eec347 0xacb407cfb554255db2fbbb320f79bb7f1cc1e8d2dc43324e8e31baafd0836340d49c43eebc51828f53bf6d364f9ac207 0xa21a2f4807a2bcb6b07c10cea241322e0910c30869c1e4eda686b0d69bdcb74d2a140ef994afcf0bb38e0b960df4d2ee bloXrouteM 0xf2f5c73fa04406b1995e397b55c24ab1f3ea726c 0x94aa4ee318f39b56547a253700917982f4b737a49fc3f99ce08fa715e488e673d88a60f7d2cf9145a05127f17dcb7c67 0x976e63c505050e25b70b39238990c78ddf0948685eb8c5687d17ba5089541f37dd3c45999f2db449eac298b1d4856013 0x8b8edce58fafe098763e4fabdeb318d347f9238845f22c507e813186ea7d44adecd3028f9288048f9ad3bc7c7c735fba 0xaa1488eae4b06a1fff840a2b6db167afc520758dc2c8af0dfb57037954df3431b747e2f900fe8805f05d635e9a29717b 0xafc9274fe595e8cff421ab9e73b031f0dff707ea1852e2233ff070ef18e3876e25c44a9831c4b5f802653d4678ccc31f bloXrouteR 0x199d5ed7f45f4ee35960cf22eade2076e95b253f 0x80c7311597316f871363f8395b6a8d056071d90d8eb27defd14759e8522786061b13728623452740ba05055f5ba9d3d5 0xb9b50821ec5f01bb19ec75e0f22264fa9369436544b65c7cf653109dd26ef1f65c4fcaf1b1bcd2a7278afc34455d3da6 0x965a05a1ba338f4bbbb97407d70659f4cea2146d83ac5da6c2f3de824713c927dcba706f35322d65764912e7756103e2 blocknative 0xbaf6dc2e647aeb6f510f9e318856a1bcd66c5e19 0x8000008a03ebae7d8ab2f66659bd719a698b2e74097d1e423df85e0d58571140527c15052a36c19878018aaebe8a6fea 0x9000009807ed12c1f08bf4e81c6da3ba8e3fc3d953898ce0102433094e5f22f21102ec057841fcb81978ed1ea0fa8246 0xa66f3abc04df65c16eb32151f2a92cb7921efdba4c25ab61b969a2af24b61508783ceb48175ef252ec9f82c6cdf8d8fd 0xa00000a975dffbd1ef61953ac6c90b52b70eb0188eb9d030774346c9248f81e875f7e8bc56c4bbbda297a9543cfa051d builder0x69 0x690b9a9e9aa1c9db991c7721a92d351db4fac990 0x8bc8d110f8b5207e7edc407e8fa033937ddfe8d2c6f18c12a6171400eb6e04d49238ba2b0a95e633d15558e6a706fbe4 0xb194b2b8ec91a71c18f8483825234679299d146495a08db3bf3fb955e1d85a5fca77e88de93a74f4e32320fc922d3027 0xa971c4ee4ac5d47e0fb9e16be05981bfe51458f14c06b7a020304099c23d2d9952d4254cc50f291c385d15e7cae0cf9d 0xa4fb63c2ceeee73d1f1711fadf1c5357ac98cecb999d053be613f469a48f7416999a4da35dd60a7824478661399e6772 0xb8fceec09779ff758918a849bfe8ab43cea79f6a98320af0af5b030f6a7850fcc5883cb965d02efb10eed1ffa987e899 builder1 0x473780deaf4a2ac070bbba936b0cdefe7f267dfc 0xa1daf0ab37a9a204bc5925717f78a795fa2812f8fba8bda10b1b27c554bd7dedd46775106facd72be748eea336f514e9 0x89783236c449f037b4ad7bae18cea35014187ec06e2daa016128e736739debeafc5fe8662a0613bc4ca528af5be83b3c flashbots 0xb64a30399f7F6b0C154c2E7Af0a3ec7B0A5b131a 0xdafea492d9c6733ae3d56b7ed1adb60692c98bc5 0x81babeec8c9f2bb9c329fd8a3b176032fe0ab5f3b92a3f44d4575a231c7bd9c31d10b6328ef68ed1e8c02a3dbc8e80f9 0x81beef03aafd3dd33ffd7deb337407142c80fea2690e5b3190cfc01bde5753f28982a7857c96172a75a234cb7bcb994f 0xa1dead01e65f0a0eee7b5170223f20c8f0cbf122eac3324d61afbdb33a8885ff8cab2ef514ac2c7698ae0d6289ef27fc mantabuiler 0x5f927395213ee6b95de97bddcb1b2b1c0f16844f 0xa0d0dbdf7b5eda08c921dee5da7c78c34c9685db3e39e81eb91da94af29eaa50f1468813c86503bf41b4b51bf772800e 0xb1b734b8dd42b4744dc98ea330c3d9da64b7afc050afed96875593c73937d530a773e35ddc4b480f9d2e1d5ba452a469 0xb5a688d26d7858b38c44f44568d68fb94f112fc834cd225d32dc52f0277c2007babc861f6f157a6fc6c1dc25bf409046 rsyncbuilder 0x1f9090aae28b8a3dceadf281b0f12828e676c326 0x978a35c39c41aadbe35ea29712bccffb117cc6ebcad4d86ea463d712af1dc80131d0c650dc29ba29ef27c881f43bd587 0x83d3495a2951065cf19c4d282afca0a635a39f6504bd76282ed0138fe28680ec60fa3fd149e6d27a94a7d90e7b1fb640 0xacfdcf458829f4693168a57d0659253069d687682bc64ec130d935ecb6e05ccfb80c138bd3cf53546c86715696612ec8 0x945fc51bf63613257792926c9155d7ae32db73155dc13bdfe61cd476f1fd2297b66601e8721b723cef11e4e6682e9d87 0x8aab0ed724d2c7f94af139bd2249ab511f08474ac69e761e56918403c81c358f5f8a6d61c62a86dc4cd7bcad935f49d9 0x8e6df6e0a9ca3fd89db2aa2f3daf77722dc4fbcd15e285ed7d9560fdf07b7d69ba504add4cc12ac999b8094ff30ed06c
Appendix E Cryptocurrencies
We provide a list of the 60 cryptocurrencies tracked in this study in Table VIII chosen based on most interactions on DEXes as well as price information on CEXes.
| name | address |
| USDC | 0xa0b86991c6218b36c1d19d4a2e9eb0ce3606eb48 |
| USDT | 0xdac17f958d2ee523a2206206994597c13d831ec7 |
| (W)ETH | 0xc02aaa39b223fe8d0a0e5c4f27ead9083c756cc2 |
| DAI | 0x6b175474e89094c44da98b954eedeac495271d0f |
| (W)BTC | 0x2260FAC5E5542a773Aa44fBCfeDf7C193bc2C599 |
| LDO | 0x5a98fcbea516cf06857215779fd812ca3bef1b32 |
| LINK | 0x514910771af9ca656af840dff83e8264ecf986ca |
| UNI | 0x1f9840a85d5af5bf1d1762f925bdaddc4201f984 |
| PEPE | 0x6982508145454ce325ddbe47a25d4ec3d2311933 |
| CRV | 0xd533a949740bb3306d119cc777fa900ba034cd52 |
| APE | 0x4d224452801aced8b2f0aebe155379bb5d594381 |
| AAVE | 0x7fc66500c84a76ad7e9c93437bfc5ac33e2ddae9 |
| MATIC | 0x7d1afa7b718fb893db30a3abc0cfc608aacfebb0 |
| MKR | 0x9f8f72aa9304c8b593d555f12ef6589cc3a579a2 |
| SHIB | 0x95ad61b0a150d79219dcf64e1e6cc01f0b64c4ce |
| QNT | 0x4a220e6096b25eadb88358cb44068a3248254675 |
| RPL | 0xd33526068d116ce69f19a9ee46f0bd304f21a51f |
| COMP | 0xc00e94cb662c3520282e6f5717214004a7f26888 |
| ENS | 0xc18360217d8f7ab5e7c516566761ea12ce7f9d72 |
| SUSHI | 0x6b3595068778dd592e39a122f4f5a5cf09c90fe2 |
| SYN | 0x0f2d719407fdbeff09d87557abb7232601fd9f29 |
| LQTY | 0x6dea81c8171d0ba574754ef6f8b412f2ed88c54d |
| ILV | 0x767fe9edc9e0df98e07454847909b5e959d7ca0e |
| SNX | 0xc011a73ee8576fb46f5e1c5751ca3b9fe0af2a6f |
| ALCX | 0xdbdb4d16eda451d0503b854cf79d55697f90c8df |
| CVX | 0x4e3fbd56cd56c3e72c1403e103b45db9da5b9d2b |
| dYdX | 0x92d6c1e31e14520e676a687f0a93788b716beff5 |
| 1INCH | 0x111111111117dc0aa78b770fa6a738034120c302 |
| AGIX | 0x5b7533812759b45c2b44c19e320ba2cd2681b542 |
| FXS | 0x3432b6a60d23ca0dfca7761b7ab56459d9c964d0 |
| SPELL | 0x090185f2135308bad17527004364ebcc2d37e5f6 |
| YFI | 0x0bc529c00c6401aef6d220be8c6ea1667f6ad93e |
| BAT | 0x0d8775f648430679a709e98d2b0cb6250d2887ef |
| GALA | 0x15d4c048f83bd7e37d49ea4c83a07267ec4203da |
| WLD | 0x163f8c2467924be0ae7b5347228cabf260318753 |
| CREAM | 0x2ba592f78db6436527729929aaf6c908497cb200 |
| REN | 0x408e41876cccdc0f92210600ef50372656052a38 |
| FTM | 0x4e15361fd6b4bb609fa63c81a2be19d873717870 |
| RNDR | 0x6de037ef9ad2725eb40118bb1702ebb27e4aeb24 |
| OGN | 0x8207c1ffc5b6804f6024322ccf34f29c3541ae26 |
| NEXO | 0xb62132e35a6c13ee1ee0f84dc5d40bad8d815206 |
| PERP | 0xbc396689893d065f41bc2c6ecbee5e0085233447 |
| IMX | 0xf57e7e7c23978c3caec3c3548e3d615c346e79ff |
| MANA | 0x0f5d2fb29fb7d3cfee444a200298f468908cc942 |
| KP3R | 0x1ceb5cb57c4d4e2b2433641b95dd330a33185a44 |
| YGG | 0x25f8087ead173b73d6e8b84329989a8eea16cf73 |
| ID | 0x2dff88a56767223a5529ea5960da7a3f5f766406 |
| SAND | 0x3845badade8e6dff049820680d1f14bd3903a5d0 |
| BLUR | 0x5283d291dbcf85356a21ba090e6db59121208b44 |
| OCEAN | 0x967da4048cd07ab37855c090aaf366e4ce1b9f48 |
| stETH | 0xae7ab96520de3a18e5e111b5eaab095312d7fe84 |
| FET | 0xaea46a60368a7bd060eec7df8cba43b7ef41ad85 |
| PRIME | 0xb23d80f5fefcddaa212212f028021b41ded428cf |
| HFT | 0xb3999f658c0391d94a37f7ff328f3fec942bcadc |
| BAND | 0xba11d00c5f74255f56a5e366f4f77f5a186d7f55 |
| GRT | 0xc944e90c64b2c07662a292be6244bdf05cda44a7 |
| GALA | 0xd1d2eb1b1e90b638588728b4130137d262c87cae |
| ZRX | 0xe41d2489571d322189246dafa5ebde1f4699f498 |
| GALA | 0xd1d2eb1b1e90b638588728b4130137d262c87cae |
| ENJ | 0xf629cbd94d3791c9250152bd8dfbdf380e2a3b9c |
| HEX | 0x2b591e99afe9f32eaa6214f7b7629768c40eeb39 |