HAAQI-Net: A non-intrusive neural music quality assessment model for hearing aids
Abstract
This paper introduces HAAQI-Net, a non-intrusive deep learning model for music quality assessment tailored to hearing aid users. In contrast to traditional methods like the Hearing Aid Audio Quality Index (HAAQI), HAAQI-Net utilizes a Bidirectional Long Short-Term Memory (BLSTM) with attention. It takes an assessed music sample and a hearing loss pattern as input, generating a predicted HAAQI score. The model employs the pre-trained Bidirectional Encoder representation from Audio Transformers (BEATs) for acoustic feature extraction. Comparing predicted scores with ground truth, HAAQI-Net achieves a Longitudinal Concordance Correlation (LCC) of , Spearman’s Rank Correlation Coefficient (SRCC) of , and Mean Squared Error (MSE) of . Notably, this high performance comes with a substantial reduction in inference time: from seconds (by HAAQI) to seconds (by HAAQI-Net), serving as an efficient music quality assessment model for hearing aid users.
Index Terms— Non-intrusive Music Quality Assessment; HAAQI; Hearing aids; HAAQI-Net; BEATs.
1 Introduction
Despite advancements in audio coding technology, music perception remains a complex challenge for individuals using hearing aids [1]. In audiology, hearing aids are tailored to the specific hearing loss characteristics of each user [2]. Given the subjective nature of music perception, objective measurement methods are urgently needed to ensure reliable assessment. Numerical methods such as mean squared error (MSE), signal-to-noise ratio (SNR), and signal-to-distortion ratio (SDR), while providing quantitative metrics, often fail to align closely with human auditory perception [3]. The Hearing Aid Audio Quality Index (HAAQI) [4] provides a music quality score that is more congruent with human perception. Unfortunately, HAAQI are (i) intrusive; (ii) computationally complex; (iii) non-differentiable. These properties limit its applicability in many practical scenarios, such as when (i) there is no ground truth signal, (ii) the assessment must be performed in real-time, and (iii) it is used as a loss function to train an upstream deep learning model. In this paper, we propose HAAQI-Net, a deep learning-based neural counterpart of HAAQI, which is a (i) non-intrusive, (ii) efficient, and (iii) differentiable method for evaluating HAAQI scores.
Literature Review: A concise review of important literature on music quality assessment, particularly in the context of hearing aid applications, is provided next. Although there are many speech quality assessment metrics, such as Mean Opinion Score (MOS) [5], Perceptual Evaluation of Speech Quality (PESQ) [6], and Short-Time Objective Intelligibility (STOI) [7], there are relatively few dedicated measures for music quality assessment, especially for hearing aids. Music (and various other audio) quality measurement is broadly divided into intrusive and non-intrusive methods. Intrusive methods involve comparing a corrupted or processed signal to be evaluated with the original signal. Common intrusive methods include PEAQ [8], PEMO-Q [9], and HAAQI [4]. PEAQ and PEMO-Q do not take hearing loss into account, whereas HAAQI is designed to predict music quality for hearing aid users. While compensating for hearing loss, hearing aids pose distinct challenges, such as degradation of sound quality due to factors such as nonlinear processing and amplification. HAAQI utilizes an auditory model attuned to impaired hearing. It then assesses the quality by comparing the outputs of this auditory model for both the degraded signal and the reference signal. By evaluating differences in signal characteristics, such as envelope modulation and temporal fine structure, HAAQI addresses challenges associated with background noise, nonlinear processing, and varied listening environments of hearing aid users. Traditional non-intrusive assessment methods of audio quality include 3SQM and ITU-T Recommendation P.563 [10]. A learning-to-rank (LTR) method for music quality assessment is proposed in [11]. Recently, non-intrusive neural models for speech quality assessment have been proposed based on deep learning architectures, such as BLSTM [12], CNN [13], CNN-BLSTM [14], and Transformer [15]. To the best of our knowledge, there are no neural models specifically designed for non-intrusive music quality assessment for hearing aid users.
Contributions: To overcome the limitations of HAAQI, we propose HAAQI-Net, a novel DNN-based non-intrusive method for assessing music audio quality in hearing aid users. HAAQI-Net serves as a non-intrusive neural counterpart to HAAQI and is trained to predict the HAAQI score based on a given piece of music and a specified pattern of hearing loss. Our approach involves a BLSTM model followed by an attention mechanism. Additionally, we utilize BEATs [16] to extract acoustic features as input to our model. When designing HAAQI-Net, we focused on three key properties that achieve significant improvements over HAAQI:
-
1.
non-intrusive: HAAQI-Net predicts HAAQI scores based on corrupted signals and does not require clean references.
-
2.
computationally efficient: Since HAAQI-Net is implemented using a simple neural network, its quality predictions can be computed in linear time.
-
3.
differentiable: Since HAAQI-Net is implemented using a neural network, it can be incorporated into the loss function to train deep learning models for upstream tasks.
Through extensive experiments, we demonstrate that HAAQI-Net effectively achieves these goals while maintaining robust prediction performance. Compared with conventional HAAQI, HAAQI-Net under different settings significantly reduces the runtime.
2 HAAQI-Net
This section introduces the model architecture and training objective of the proposed HAAQI-Net, as well as the BEATs features used in the model.
2.1 Network Architecture
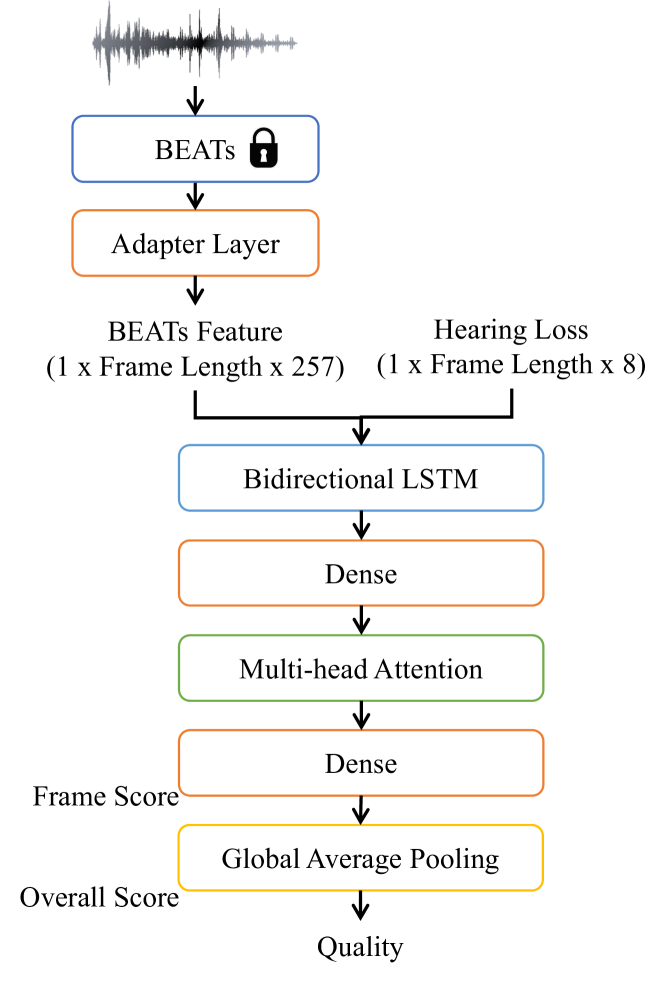
Figure 1 illustrates the overall architecture of HAAQI-Net. The input waveform is passed throuth the pre-trained BEATs model to obtain audio features. An adapter layer implemented as a dense layer is used to adapt these features specifically for music quality assessment. This adaptation enhances the model’s ability to learn more compact and salient feature representations and capture intricate relationships in the data. The input to HAAQI-Net includes the adapted BEATs features and the hearing loss pattern. The core of HAAQI-Net consists of a layer BLSTM that captures the unique time-varying characteristics of music signals. The model processes input tensors with dimensions , where denotes the batch size, is the frame number per music clip, and is the dimension of the feature vector. The BLSTM layers are followed by a fully connected layer with nodes activated by the Rectified Linear Unit (ReLU). A multi-head attention mechanism with heads captures temporal dependencies in the data. A linear layer followed by a sigmoid activation produces frame-level scores. The frame-level scores are then aggregated by a Global Average Pooling layer to form an overall clip quality assessment.
The objective function for each training music clip is the sum of the clip-level loss and the averaged frame-level loss. The overall objective function is as follows:
| (1) |
where denotes the number of training music clips; and represent the true and estimated clip-level quality scores for the -th music clip, respectively; is the frame number in the -th music clip, and denotes the estimated frame-level quality score of the -th frame of the -th music clip.
2.2 BEATs
BEATs [16] is a pre-trained framework that addresses key challenges in audio processing with its innovative acoustic tokenizer and audio Self-Supervised Learning (SSL) model. This framework iteratively enhances performance by using an acoustic tokenizer for generating discrete labels from unlabeled audio and optimizing the audio SSL model with masking and a discrete label prediction loss. The knowledge distillation of the SSL model further improves the tokenizer’s ability to grasp the semantics of the audio. Experimental results highlight the efficacy of its acoustic tokenizer in producing semantically rich discrete labels. Moreover, this audio SSL model achieves state-of-the-art performance on various audio classification benchmarks, surpassing predecessors that utilize broader training data and larger model parameters.
In our model architecture, we utilize BEATs as the feature extractor. The process starts with preprocessing to extract Mel-Frequency Cepstral Coefficients (MFCCs). Subsequently, it employs patch-based embedding through a convolutional layer, followed by normalization. Processed through a Transformer encoder, these embedded features are adept at capturing both local and global dependencies. The whole process is expressed as:
| (2) |
where TE denotes the Transformer encoder, LN is LayerNorm, PE stands for PatchEmbedding, Prep represents the Preprocess operation, and X is the input waveform. The output of BEATs will be processed by the adapter layer before being input to our HAAQI-Net model.
3 Experiments
This section presents a detailed account of the experiments conducted, covering aspects such as data preparation, experimental setups, and the obtained results.
3.1 Data preparation
Before delving further into the evaluation of HAAQI-Net, we first explain how music samples are (i) selected, (ii) processed, and (iii) how hearing loss patterns are generated.
Music Sample Dataset: The music dataset is based on the small split of the FMA (FMA-small) dataset [17] and MTG Jamendo [18]. FMA-small is a balanced dataset for genre classification. From the eight genres available in FMA-small, we selected five genres: hip-hop, instrumental, international, pop, and rock. Considering that people with hearing loss are more likely to be older adults who often listen to classical music and orchestral music [19], we added additional music samples of these two genres from the MTG-Jamendo dataset. Through random selection, we collected 600 mono-audio samples from different genres, each lasting 30 seconds.
Sample Processing: We processed these music samples following the method of Arehart et al. [20]. More precisely, the music samples were processed through a total of processing conditions: (i) types of noise addition and nonlinear processing, (ii) types of linear filtering, and (iii) combinations of noise addition and nonlinear processing with linear filtering. The final dataset contains both unprocessed clean and processed music clips.
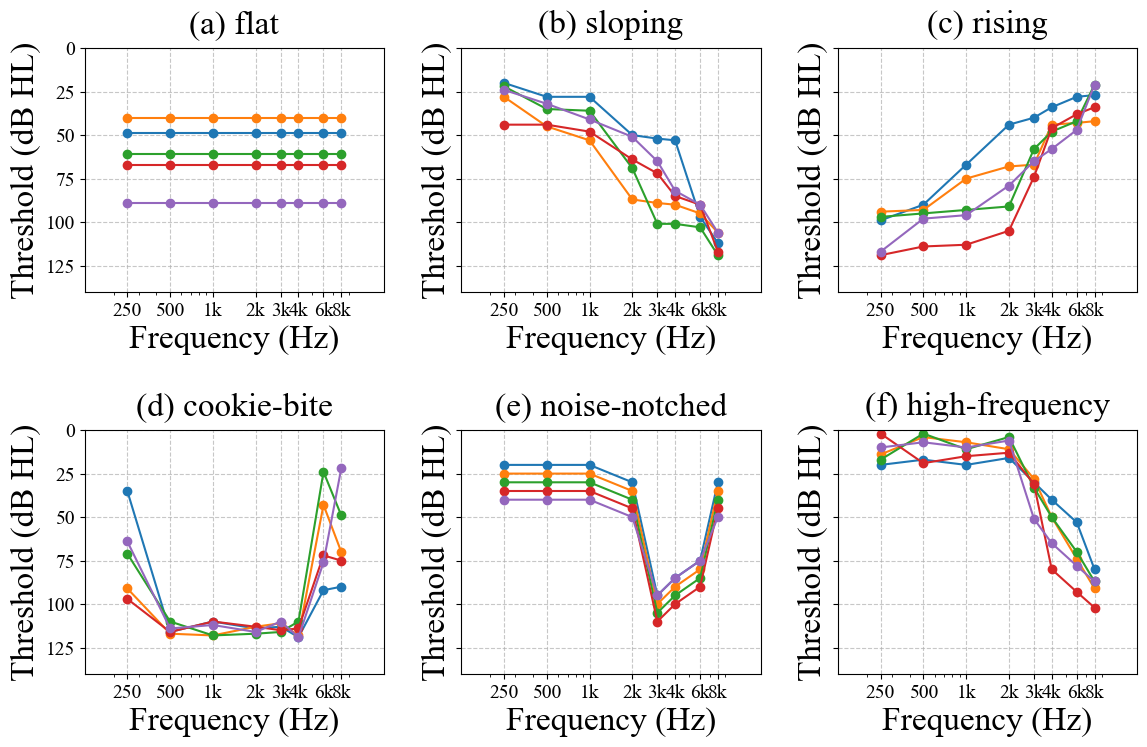
Hearing Loss Patterns: In generating hearing loss patterns, we followed the approach of Alshuaib et al. [21]. Hearing loss is described through an audiogram, which is a graphical display showing the degrees of hearing loss in different frequency regions, as shown in Fig. 2. A threshold above dB at any frequency is considered hearing loss. We represent a specific hearing loss pattern using a -dimensional vector, where each dimension represents the threshold at that specific frequency. The eight frequencies used are , , , , , , , and Hz. Audiograms are categorized into types: flat, sloping, rising, cookie-bite, noise-notched, and high-frequency as illustrated in Fig. 2. In total, we established hearing loss patterns, with patterns per hearing loss category. The patterns of each category were divided into two groups, with patterns for training and the remaining patterns for testing.
| Genre | Training Data | Testing Data | |
|---|---|---|---|
| Seen | Unseen | ||
| Hip-hop | 3,048 | 552 | 116 |
| Instrumental | 3,890 | 538 | 104 |
| International | 3,368 | 484 | 104 |
| Pop | 3,632 | 496 | 110 |
| Rock | 4,644 | 396 | 74 |
| Classical | 3,830 | 206 | 82 |
| Orchestral | 3,388 | 768 | 130 |
| Total | 25,800 | 3,440 | 720 |
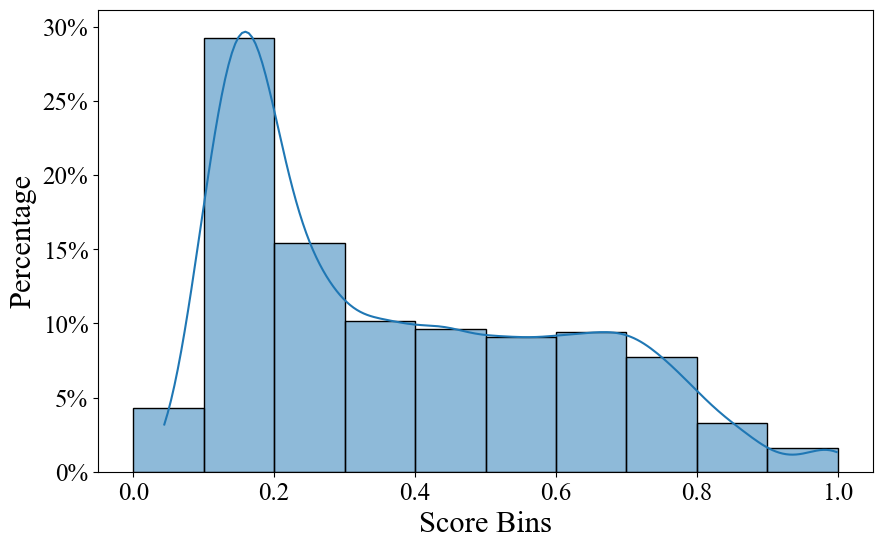
A summary of the dataset used to evaluate HAAQI-Net is shown in Table 1. Each music sample is paired with a randomly selected hearing loss pattern. The test set is divided into seen and unseen subsets, where “seen” means the processing type is seen in training. Note that the hearing loss patterns in testing is always unseen in training, as explained above. The distribution of HAAQI scores for all music samples across different data processing conditions and patterns of hearing loss is provided in Fig. 3.
3.2 Experimental Setup
In this section, we explore the experimental setups, detailing input configurations and various experimental scenarios.
Inputs and Configurations: In our experiments, we explored different setups to identify the most effective features for music quality prediction. First, power spectral features are used as input, extracted via a -point short-time Fourier transform (STFT) with a Hamming window size of 512 points and a hop size of points, resulting in a -dimensional magnitude spectrum. The sampling rate for this input is kHz. The second input is obtained using the BEATs feature extractor (explained in Section 2.1), with an original dimension of and a default sampling rate of kHz. The third input is the lower-dimensional BEATs features obtained through window moving average. This is done to maintain the same dimensionality as the spectral feature. We average every three feature elements until we obtain average features. The last input utilizes an adapter (i.e., a dense layer) to reduce the dimensionality of the BEATs features to . This adapter also has the effect of adapting BEATs features to music quality assessment tasks.
Each type of input is concatenated with the hearing-loss pattern to form the final input to HAAQI-Net. The corresponding ground-truth quality score is calculated by HAAQI, with indicating poor quality and representing perfect quality. The stimuli were amplified using the National Acoustics Laboratories revised (NAL-R) [22] linear fitting prescriptive formula based on individual hearing-loss patterns. We trained HAAQI-Net using the Adam optimizer with a learning rate of and an early stopping technique. To evaluate the performance, three criteria are used, namely mean squared error (MSE), linear correlation coefficient (LCC), and Spearman’s rank correlation coefficient (SRCC).
Experimental Scenarios: We explored two scenarios to evaluate the generalization ability of HAAQI-Net: the seen set and the unseen set. The seen set contains data with the same music processing conditions as the training set, while the unseen set contains data with different music processing conditions than the training set. We selected conditions for the seen set, leaving conditions exclusive for the unseen set. The unseen set comprises conditions such as “compression + babble”, “compression + spectral subtraction + babble”, “multiple resonance peaks + low pass filter”, “babble + compression + high pass filter”, “babble + compression + low pass filter”, “babble + compression + positive spectral tilt”, “babble + compression + negative spectral tilt”, “babble + compression + single resonance peak”, and “babble + compression + multi-resonance peak”. The distribution of training and testing data for each genre, as well as the seen and unseen sets, are summarized in Table 1. The training data is divided into for training and for validation.
Input Features All Seen Unseen Spectrogram (257) 0.0301 0.6701 0.7084 0.0298 0.6848 0.7106 0.0314 0.5999 0.6612 BEATs Original Feature (768) 0.0071 0.9274 0.9342 0.0081 0.9234 0.9332 0.0026 0.9014 0.8762 BEATs Feature + Window Avg (257) 0.0123 0.8765 0.8908 0.0135 0.8724 0.8879 0.0061 0.8119 0.8275 BEATs Feature + Adapter (257) 0.0064 0.9368 0.9486 0.0073 0.9327 0.9455 0.0024 0.9282 0.9188
Hearing loss type Spectrogram (257) BEATs Original Feature (768) BEATs + Window Avg (257) BEATs + Adapter (257) Flat 0.0407 0.6129 0.6445 0.0074 0.9320 0.9387 0.0130 0.8884 0.9064 0.0054 0.9503 0.9552 Sloping 0.0332 0.6520 0.6919 0.0072 0.9263 0.9373 0.0097 0.9046 0.9252 0.0080 0.9234 0.9424 Rising 0.0175 0.7104 0.7432 0.0056 0.9174 0.9248 0.0212 0.7145 0.7537 0.0050 0.9279 0.9501 Cookie-bite 0.0111 0.7192 0.7401 0.0058 0.8101 0.8169 0.0068 0.7760 0.7730 0.0039 0.8791 0.8547 Noise-notched 0.0278 0.6439 0.6726 0.0057 0.9350 0.9479 0.0067 0.9218 0.9305 0.0064 0.9326 0.9494 High-frequency 0.0400 0.5864 0.5862 0.0090 0.9149 0.9263 0.0111 0.8951 0.9063 0.0068 0.9401 0.9432
3.3 Experimental Results
For a thorough grasp of the model’s performance, we analyze (i) overall performance, (ii) scenario-based performance, and (iii) efficiency.
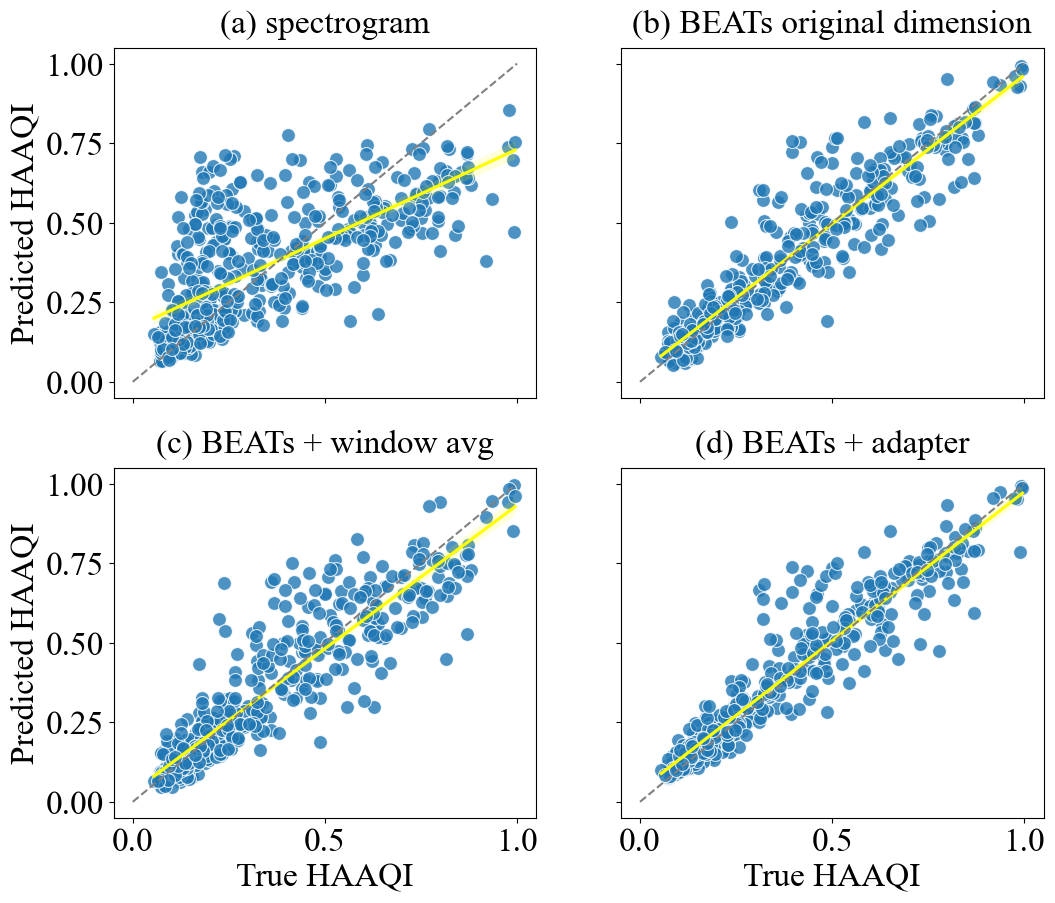
Overall Performance Evaluation: The performance of music quality prediction of HAAQI-Net using different input features under both seen and unseen conditions is shown in Table 2. In terms of overall performance, HAAQI-Net with “BEATs Feature + Adapter (257)” outperforms other input configurations, achieving an LCC of and SRCC of . Its MSE is , slightly higher than that of HAAQI-Net with “BEATs Original Feature (768)”. This result highlights the efficacy of the integrated adapter layer in aligning the BEATs features with the requirements of the music quality assessment task. The adapter layer effectively captures important features while effectively reducing dimensionality. As a bridge between the general acoustic features from BEATs and the specific requirements of music quality assessment, it enhances the model’s ability to handle variations in input data, proving valuable for diverse music samples and different hearing loss patterns. In contrast, simple dimension reduction methods like window moving average may inadvertently omit important features, resulting in less representative features for a specific upstream task. Fig. 4 displays a scatter plot illustrating the performance of HAAQI-Net under each input configuration.
Scenario-Based Performance Evaluation: To comprehensively assess the generalization ability of HAAQI-Net, we conducted evaluations on both the seen and unseen test sets. Remarkably, HAAQI-Net with ”BEATs Feature + Adapter (257)” exhibits robust performance on unseen data comparable to its performance on seen data. This achievement comes without any compromise in its performance on seen data. This enhancement significantly bolsters the model’s ability to generalize across different datasets without sacrificing performance on familiar data.
Next, we conduct a thorough analysis across different types of hearing loss in Table 3. The result reveals that HAAQI-Net with “BEATs Original Feature (768)” performs well in predicting music quality for most hearing loss types. However, upon closer examination, it encounters challenges in covering cookie-bite hearing loss, achieving an LCC of , an SRCC of , and a MSE of , comparatively lower than its performance for other hearing loss types.
On the other hand, HAAQI with “BEATs Feature + Adapter (257)” demonstrates robust performance across all types of hearing loss, including cookie-bite. While it performs slightly worse on cookie-bite than other hearing loss types, it still achieves commendable metrics with an LCC of , an SRCC of , and a MSE of . In addition, this configuration also outperforms “BEATs Original Feature (768)” in flat, rising, and high-frequency types, while maintaining comparable performance for sloping and noise-notched types.
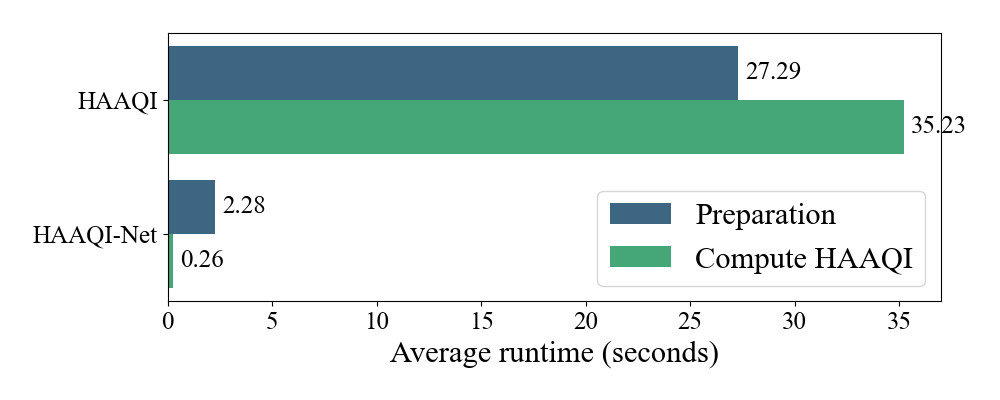
Efficiency Evaluation: To demonstrate HAAQI-Net’s efficiency, Fig. 5 compares runtimes on an NVIDIA GeForce RTX 2080 12GB GPU. For the conventional HAAQI method, preprocessing takes seconds, and calculation of HAAQI scores takes an additional seconds. In contrast, HAAQI-Net excels in speed, with an average of seconds for feature extraction per audio and seconds for HAAQI score prediction. Overall, HAAQI-Net predicts scores in seconds, while conventional HAAQI takes seconds, showcasing the efficiency gain of HAAQI-Net.
4 Conclusion
This paper presents HAAQI-Net, a DNN-based model tailored for music quality assessment for individuals using hearing aids. The main goal was to overcome the limitations of existing methods that rely on clean music as a reference for music quality assessment. Through systematic exploration of four different input features, our experimental results show that leveraging “BEATs Features + Adapter” outperforms other inputs, achieving notable performance with an LCC of , an SRCC of , and a MSE of . Furthermore, a comparative computing time analysis of DNN-based HAAQI-Net and traditional HAAQI demonstrates the superior efficiency of HAAQI-Net, producing predicted quality scores in approximately seconds per 30-second audio, while HAAQI requires seconds. This highlights the efficacy of HAAQI-Net as a fast and accurate music quality predictor, opening avenues for further advancements in the field of hearing aid audio quality assessment. Future investigations will focus on evaluating HAAQI-Net’s performance in mimicking human perception and rating.
References
- [1] M. C. Leal, Y. J. Shin, M. Laborde, M. Calmels, S. Verges, S. Lugardon, S. Andrieu, O. Deguine, and B. Fraysse, “Music perception in adult cochlear implant recipients,” Acta otolaryngologica, vol. 123, no. 7, pp. 826–835, 2003.
- [2] B. Edwards, “The Future of Hearing Aid Technology,” Trends in Amplification, vol. 11, no. 1, pp. 31–45, 2007.
- [3] E. Vincent, R. Gribonval, and C. Févotte, “Performance measurement in blind audio source separation,” IEEE Transactions on Audio, Speech, and Language Processing, vol. 14, no. 4, pp. 1462–1469, 2006.
- [4] J. M. Kates and K. H. Arehart, “The Hearing-Aid Audio Quality Index (HAAQI),” IEEE/ACM Transactions on Audio, Speech, and Language Processing, vol. 24, no. 2, pp. 354–365, 2015.
- [5] P ITU, “800: Methods for subjective determination of transmission quality,” Recommendation ITU-T, 1996.
- [6] ITU-T Recommendation, “Perceptual Evaluation of Speech Quality (PESQ): An Objective Method for End-to-End Speech Quality Assessment of Narrow-Band Telephone Networks and Speech Codecs,” Rec. ITU-T P. 862, 2001.
- [7] C. H. Taal, R. C. Hendriks, R. Heusdens, and J. Jensen, “An algorithm for intelligibility prediction of time–frequency weighted noisy speech,” IEEE Transactions on Audio, Speech, and Language Processing, vol. 19, no. 7, pp. 2125–2136, 2011.
- [8] T. Thiede, W. C. Treurniet, R. Bitto, C. Schmidmer, T. Sporer, J. G. Beerends, and C. Colomes, “PEAQ-The ITU Standard for Objective Measurement of Perceived Audio Quality,” Journal of the Audio Engineering Society, vol. 48, no. 1/2, pp. 3–29, 2000.
- [9] R. Huber and B. Kollmeier, “PEMO-Q—A New Method for Objective Audio Quality Assessment Using a Model of Auditory Perception,” IEEE Transactions on Audio, Speech, and Language Processing, vol. 14, no. 6, pp. 1902–1911, 2006.
- [10] H. Gamper, C. K. A. Reddy, R. Cutler, I. J. Tashev, and J. Gehrke, “Intrusive and Non-Intrusive Perceptual Speech Quality Assessment Using a Convolutional Neural Network,” in 2019 IEEE Workshop on Applications of Signal Processing to Audio and Acoustics (WASPAA), 2019, pp. 85–89.
- [11] Z. Li, J. C. Wang, J. Cai, Z. Duan, H. M. Wang, and Y. Wang, “Non-Reference Audio Quality Assessment for Online Live Music Recordings,” in Proceedings of the 21st ACM international conference on Multimedia, 2013, pp. 63–72.
- [12] S. W. Fu, Y. Tsao, H. T. Hwang, and H. M. Wang, “Quality-Net: An End-to-End Non-intrusive Speech Quality Assessment Model Based on BLSTM,” in Proc. Interspeech 2018, 2018, pp. 1873–1877.
- [13] G. Mittag, B. Naderi, A. Chehadi, and S. Möller, “NISQA: A Deep CNN-Self-Attention Model for Multidimensional Speech Quality Prediction with Crowdsourced Datasets,” in Proc. Interspeech 2021, 2021, pp. 2127–2131.
- [14] R. E. Zezario, S. W. Fu, F. Chen, C. S. Fuh, H. M. Wang, and Y. Tsao, “Deep Learning-based Non-Intrusive Multi-Objective Speech Assessment Model with Cross-Domain Features,” IEEE/ACM Transactions on Audio, Speech, and Language Processing, vol. 31, pp. 54–70, 2022.
- [15] A. Vaswani, N. Shazeer, N. Parmar, J. Uszkoreit, L. Jones, A. N. Gomez, L. Kaiser, and I. Polosukhin, “Attention is all you need,” Advances in neural information processing systems, vol. 30, 2017.
- [16] S. Chen, Y. Wu, C. Wang, S. Liu, D. Tompkins, Z. Chen, W. Che, X. Yu, and F. Wei, “BEATs: Audio Pre-Training with Acoustic Tokenizers,” in Proceedings of the 40th International Conference on Machine Learning. 2023, ICML’23, JMLR.org.
- [17] M. Defferrard, K. Benzi, P. Vandergheynst, and X. Bresson, “FMA: A dataset for music analysis,” in International Society for Music Information Retrieval Conference, 2016.
- [18] D. Bogdanov, M. Won, P. Tovstogan, A. Porter, and X. Serra, “The MTG-Jamendo Dataset for Automatic Music Tagging,” in Machine Learning for Music Discovery Workshop, International Conference on Machine Learning, Long Beach, CA, United States, 2019.
- [19] A. R. Bonneville, P. J. Rentfrow, M. K. Xu, and J. Potter, “Music Through the Ages: Trends in Musical Engagement and Preferences from Adolescence Through Middle Adulthood,” Journal of Personality and Social Psychology, vol. 105, pp. 703–717, 2013.
- [20] K. H. Arehart, J. M. Kates, and M. C. Anderson, “Effects of noise, nonlinear processing, and linear filtering on perceived speech quality,” Ear and hearing, vol. 31, no. 3, pp. 420–436, 2010.
- [21] W. B. Alshuaib, J. M. Al-Kandari, and S. M. Hasan, “Classification of hearing loss,” Update On Hearing Loss, vol. 4, pp. 29–37, 2015.
- [22] D. Byrne and H. Dillon, “The National Acoustic Laboratories’(NAL) New Procedure for Selecting the Gain and Frequency Response of a Hearing Aid,” Ear and hearing, vol. 7, no. 4, pp. 257–265, 1986.