AliFuse: Aligning and Fusing Multi-modal Medical Data for Computer-Aided Diagnosis
Abstract
Medical data collected for making a diagnostic decision are typically multi-modal and provide complementary perspectives of a subject. A computer-aided diagnosis system welcomes multi-modal inputs; however, how to effectively fuse such multi-modal data is a challenging task and attracts a lot of attention in the medical research field. In this paper, we propose a transformer-based framework, called Alifuse, for aligning and fusing multi-modal medical data. Specifically, we convert images and unstructured and structured texts into vision and language tokens, and use intramodal and intermodal attention mechanisms to learn holistic representations of all imaging and non-imaging data for classification. We apply Alifuse to classify Alzheimer’s disease and obtain state-of-the-art performance on five public datasets, by outperforming eight baselines. The source code will be available online later.
Index Terms— Vision-Language Model (VLM), Computer-Aided Diagnosis (CAD), Alzheimer’s Disease (AD), Aligning and Fusing.
1 Introduction
Recent advances in deep neural networks (DNNs) have significantly impacted the field of medical image analysis, leading to remarkable success in various medical research areas, including computer-aided diagnosis (CAD) [1], especially medical-image-based CAD [2, 3]. Although medical images play an essential role in clinical diagnosis, medical data for diagnosis commonly exhibits a multi-modal nature, including both medical images and non-imaging data, e.g., patient demographic information and laboratory test results. In practice, both imaging and non-imaging data are often desired for a clinician to make a diagnostic decision, such as diagnosing Alzheimer’s Disease (AD). However, how to fuse these different types of clinical data in CAD is a challenging task. A typical way adopted by most recent works [4, 5, 6] is extracting features for imaging and non-imaging data separately and then fusing them for diagnostic classification. However, multi-model features are often located in different high-dimensional spaces. Alignment will bring them into a common space for fusion, which has the potential to achieve more accurate CAD results.
Recently, large vision language pre-training (VLP) models, e.g., CLIP [7], ALBEF [8], BLIP [9], have shown promising performance in many computer vision (CV) downstream applications, including classification [10] and segmentation [11]. These VLP models learn multi-modal representations from large image and text datasets, by aligning their features into a common space. Researchers adopt these techniques to generate medical reports [12], where the texts are descriptions of medical images. Unlike medical reports, the non-imaging data for clinical diagnosis is not perfectly paired with medical images but provides complementary diagnostic information about a patient. A recent work, MedCLIP [13], aligns imaging data to the text space of the non-imaging data and fuses them simply using a large language model.
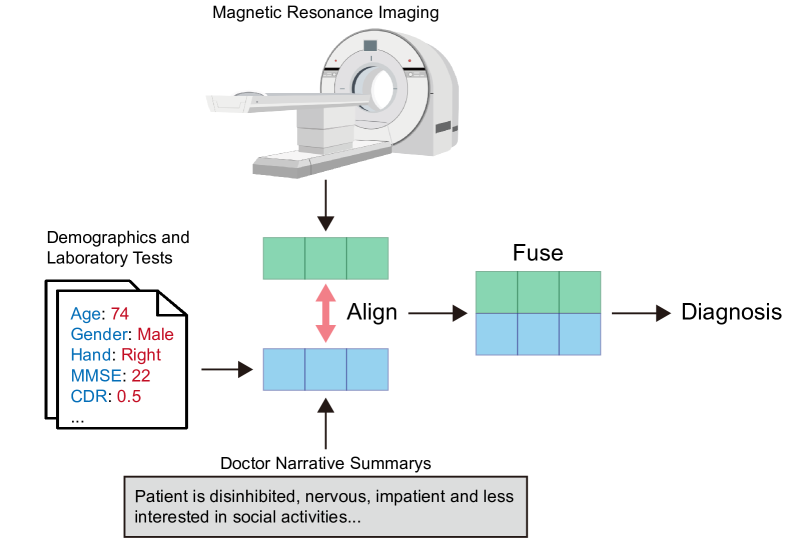
In this paper, we consider another scenario where images and texts provide complementary information, that is, texts include additional information except for medical scans, e.g., the demographics, laboratory test results, and doctor’s narrative summary of a subject, to make an informed diagnosis decision. Our goal is to learn a VLM that suits this scenario, as shown in Fig. 1, which has multi-modal intelligence to align and fuse different types of medical data, e.g., 3D medical scans and texts that contain complementary information to images.
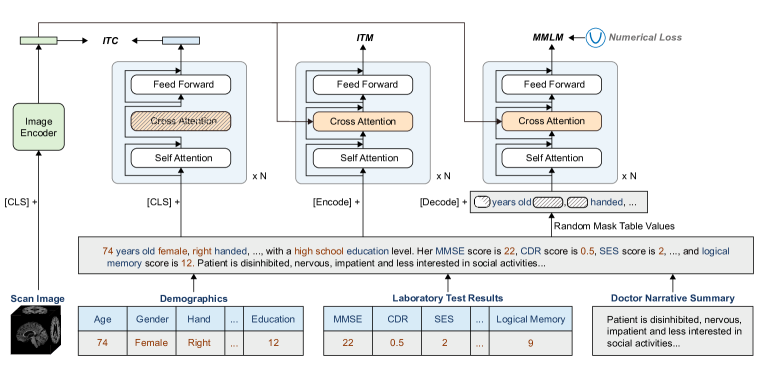
Inspired by BLIP [9], we propose a CAD model called Alifuse, which explicitly aligns and fuses feature embeddings for both imaging and non-imaging data, as shown in Fig. 2. Alifuse aligns image features extracted from image volumes with text features from non-imaging data, e.g., demographics and lab results. Alifuse is a transformer-based framework that implements feature alignment via image-text contrastive learning and feature fusion via cross attention. Since current text encoders have difficulty handling numbers, we make a special treatment to improve their sensitivity to numbers.
We apply Alifuse to separate AD and mild cognitive impairment (MCI) subjects from normal controls (NC), using both imaging and non-imaging data. We have collected 27.8K medical image volumes and other clinical data from five public multi-modal AD datasets, i.e., ADNI [14], NACC [15], OASIS [16], AIBL [17], and MIRIAD [18], to train and evaluate our Alifuse model. We also compare Alifuse with eight baselines to demonstrate the effectiveness of our method. Overall, our contributions in this paper are summarized as follows:
-
•
We propose a uniform CAD framework, Alifuse, which aligns and fuses multi-modal medical inputs, including both imaging and non-imaging data. Our framework provides a way to integrate all available information for making an informative diagnostic decision.
-
•
To our best knowledge, our model is trained and evaluated on the largest set for studying AD and achieves the SOTA performance in AD classification. Besides, Alifuse takes raw images without complex pre-processing as inputs, which makes it easy to use in practice.
The framework of our model is general and has the potential to incorporate more modalities and study diseases beyond AD.
2 Related Works
Vision-Language Model (VLM). Vision-language representation learning aims to jointly encode vision and language in a fusion model, which has been demonstrated to learn uni-modal and multi-modal representations with superior performance on downstream tasks [7, 8]. CLIP [7] and ALIGN [19] are dual-encoder models, which are pre-trained with contrastive objectives on image-text pairs. They learn strong image and text unimodal representations with simple interaction, which is not enough to handle tasks that require complex reasoning. ALBEF [8], CoCa [20], and BLIP [9] promote a deeper interaction of images and text using a deep fusion encoder with cross-modal attention. These models achieve better performance for vision-language classification by learning efficient multi-modal representations. Medical image-text representation learning is investigated based on contrastive learning as well, such as MedCLIP [13], CheXZero [21], and MedViLL [22].
Multi-Modal Medical Diagnosis. In medical diagnosis, fully leveraging multiple modalities of medical data becomes a popular choice, since from them machine learning models can more easily identify patterns of diseases, compared to using a single modality. For instance, Kim et al. [4] propose a heterogeneous graph learning method to fuse the multi-modal medical data. Zhou et al. [5] introduces the IRENE model based on Transformers, which fused representations among modality-specific low-level embeddings for diagnosis. Also, multi-modal data like images and genomes have been used in the diagnosis of breast cancer [6]. All these studies indicate that multi-modal-based CAD is a promising research direction. However, existing methods lack the flexibility to handle incomplete or unpaired data, which is common in medical scenarios. Also, these works focus on multi-modal fusion, losing sight of the importance of aligning multi-model features before fusion.
3 Methodology
Figure 1 presents the overview framework of our proposed model, Alifuse. In this paper, we apply it to classifying Alzheimer’s Disease (AD). With diagnosing AD as our main application, Figure 2 describes a detailed architecture of our model used for pretraining before classification.
3.1 Multi-Modal Data Collection
This study collects multi-modal data for Alzheimer’s Disease from five public datasets as mentioned before. The various modalities include imaging data, i.e., structural MRIs, unstructured non-imaging data (e.g., doctor’s narrative summary and diagnosis), and structured non-imaging data (e.g., demographics and laboratory test results). The combination of these clinical records and imaging data allows a model to learn comprehensively about the AD characteristics of a subject.
To process the unstructured doctor’s narrative summary, we set the maximum length to 40 words. If a summary has more than 40 words, we simply take the first 40; otherwise, zero padding is used to meet the length requirement. For structured clinical information, we argue that its contained digital numbers and categories are more meaningful in the text context. Therefore, we create a text representation for each data sample using the information contained in the tables of raw data. For example, if a patient has an MMSE (Mini-Mental State Examination) score of 29, a corresponding sentence is written as “the MMSE score is 29”. As shown in Fig. 2, we convert all non-imaging data into text representations as inputs.
3.2 Model Architecture
As illustrated in Fig. 2, Alifuse contains an image encoder and a multi-task text encoder, which aligns and fuses image and text features during pre-training. When fine-tuning, a classification head based on fused features is trained for prediction.
Image Encoder. We employ a 3D vision Transformer [23] as our image encoder, which divides an input image volume into cubes and encodes them as a sequence of embeddings, with an additional token to represent the global image feature. Compared to using traditional CNN-based encoders for visual feature extraction, using a ViT is more suitable for multi-modal fusion and is adopted by most recent methods [8, 9].
Image-Text Alignment and Fusion. Inspired by training a unified model with multi-task understanding capabilities [9], we employ a BERT-based multi-task model that operates in the following three functionalities:
(1) Unimodal text encoder. The text encoder extracts features from the non-imaging data, using BERT [24]. At the beginning of the text input, we have a token to summarize the sentence. To align the imaging and non-imaging features from the image and text encoders, respectively, we adopt the Image-Text Contrastive Loss (ITC) as in [8].
(2) Image-grounded text encoder. At this branch, we fuse the aligned image features with text features. In particular, we inject visual features by inserting a cross-attention layer between the self-attention layer and the feed-forward layer for each transformer block of the text encoder. A token is located at the beginning of the text, and the output embedding of is used as the multi-modal representation of the vision-language pair. In this way, the imaging and non-imaging features are fused. After pretraining, this branch will output the classification label after fine-tuning. Following [8], we use Image-Text Matching (ITM) as the loss function for this branch, which is an effective objective for improving vision and language understanding [7, 8, 9].
This image-grounded text encoder shares weights with the above unimodal text encoder, except for the cross-attention layer, which does not exist in the unimodal text encoder.
(3) Image-grounded text decoder. To enhance the understanding of images in the text environment, we have an additional task of predicting the masked words. Also, non-imaging data contains many digital numbers like those included in lab results. This branch utilizes both the image and contextual text to predict the masked information, including both words and numbers. A token is used to signal the beginning of a sequence. We use the following loss for learning.
Modified Masked Language Modeling Loss (MMLM). We randomly mask out the tabular value tokens with a probability of 15% and replace them with the special token . Let denote a masked text, and denote the predicted probability of our model for a masked token. We first employ standard masked language modeling loss by minimizing a cross-entropy loss:
| (1) |
where is a one-hot vocabulary distribution where the ground-truth token has a probability of 1.
Since language models probably may not help discover implicit regression correlation between medical numerical features, we introduce the following regression objective to handle digital numbers:
| (2) |
where is the number of numerical values in the text of the non-imaging data, is the true value, and is the prediction.
4 Experiments
| Datasets | #Img. | #Demogr. | #LabRes. | Dr.Sum. | #CLS |
|---|---|---|---|---|---|
| ADNI [14] | 10387 | 3 | 3 | ✓ | 3 |
| NACC [15] | 15343 | 4 | 3 | ✗ | 3 |
| AIBL [17] | 1002 | 2 | 3 | ✗ | 3 |
| OASIS2 [16] | 373 | 3 | 3 | ✗ | 2 |
| MARIAD [18] | 708 | 2 | 2 | ✗ | 2 |
4.1 Experimental Setup and Results
Datasets. To evaluate our proposed method, we conduct experiments on five multi-modal public datasets for studying AD/Dementia and evaluate our model on separating subjects with AD or mild cognitive impairment (MCI) from normal controls (NC). The detailed statistics of these datasets are summarized in Table 1. In total, we have 27.8K image volumes, most of them have demographics and laboratory test results, but only the ADNI dataset has doctor’s narrative summary. Since these images have varying volume sizes and spacing, we simply pad each image to a cube shape and then scale it to a unified size of as inputs. The intensity of an image volume is normalized into [0, 1].
We subject-wisely split the data from ADNI and NACC into the training/validation/test sets of 70/10/20%, which provides 20K samples for training. Apart from testing on ADNI and NACC, we have OASIS2, AIBL and MIRIAD datasets for zero-shot testing. Our evaluation metrics include accuracy and AUC (area under the ROC curve) for classification.
Baselines. We compare Alifuse to three groups of methods. (1) the image-only group. We choose four recent baselines that are commonly used, including 3D ResNet50 [25], MedicalNet [26], 3D Vit [23], M3T [27]. (2) The text-only group. To our best knowledge, there are no current studies use medical non-imaging data for diagnosis; therefore, we choose BERT [24] as our text-only baseline. (3) the multi-modal group. We have three baselines, i.e., GIT [28], Preciver [29], and IRENE [5]. They are recent transformer-based models that fuse multi-modal information for classification.
Experimental Settings. We use ViT [23] as our backbone image encoder and BERT [24] as our backbone text encoder. For the input image with a size of , the patch size and the stride are both set as 32, resulting in image features with the size of . For the text encoder, the maximum length of text is set to 70 and the number of the hidden layers is set to 12. Our model is trained on a single NVIDIA RTX 3090 GPU with a batchsize of 40. We use the AdamW optimizer with a learning rate of 5e-3.
| Methods | ADNI-test1 | NACC-test1 | AIBL1 | OASIS22 | MIRIAD2 | ||||||
|---|---|---|---|---|---|---|---|---|---|---|---|
| ACC | AUC | ACC | AUC | ACC | AUC | ACC | AUC | ACC | AUC | ||
| Image-only | 3D ResNet50 [25] | 65.22% | 73.91% | 68.18% | 76.14% | 30.29% | 47.72% | 63.64% | 72.73% | 62.50% | 71.88% |
| MedicalNet [26] | 69.57% | 77.17% | 71.67% | 77.25% | 39.64% | 54.73% | 65.83% | 73.75% | 73.68% | 80.26% | |
| 3D ViT [23] | 70.83% | 78.13% | 76.19% | 82.14% | 45.54% | 59.15% | 69.57% | 77.17% | 77.27% | 82.95% | |
| M3T [27] | 74.77% | 81.08% | 75.47% | 81.60% | 59.83% | 69.87% | 69.09% | 76.82% | 75.21% | 81.40% | |
| Text-only | BERT [24] | 81.80% | 86.35% | 80.18% | 85.14% | 80.64% | 85.48% | 89.02% | 91.76% | 71.68% | 78.76% |
| Multi-modal | Perceiver [29] | 73.91% | 80.43% | 72.73% | 79.55% | 74.48% | 78.51% | 82.57% | 86.93% | 72.73% | 79.55% |
| GIT [28] | 82.46% | 86.84% | 79.65% | 84.73% | 77.90% | 82.14% | 84.21% | 88.16% | 77.68% | 83.26% | |
| Irene [5] | 83.48% | 87.61% | 80.95% | 85.71% | 82.30% | 86.73% | 89.29% | 91.06% | 79.02% | 84.27% | |
| Alifuse (ours) | 87.93% | 90.95% | 82.18% | 86.63% | 85.56% | 89.17% | 92.36% | 94.27% | 85.31% | 88.99% | |
-
•
1 Three-label classification: for NC, MCI, and AD/Dementia. 2 Binary classification: NC and Alzheimer’s sufferers (including MCI and AD/Dementia).
| Row | Image | Text | Align | ACC | AUC | |||
|---|---|---|---|---|---|---|---|---|
| Demogr. | LabRes. | Dr.Sum. | ||||||
| 0 | ✓ | ✓ | ✓ | ✓ | ✓ | ✓ | 87.93% | 90.95% |
| 1 | ✓ | ✓ | ✓ | ✓ | ✓ | 86.21% | 89.66% | |
| 2 | ✓ | ✓ | ✓ | ✓ | 84.71% | 88.29% | ||
| 3 | ✓ | 70.83% | 81.08% | |||||
| 4 | ✓ | ✓ | ✓ | 81.80% | 86.35% | |||
| 5 | ✓ | ✓ | ✓ | ✓ | ✓ | 83.56% | 87.17% | |
| 6 | ✓ | ✓ | ✓ | ✓ | ✓ | 82.14% | 86.61% | |
| 7 | ✓ | ✓ | ✓ | ✓ | ✓ | 87.09% | 90.32% | |
Experimental Results. Table 2 reports the experimental results of Alifuse and other baseline methods on five datasets for classifying Alzheimer’s disease. As shown in Table 2, on all datasets Alifuse significantly outperforms the image-only model, the text-only model, and three recent state-of-the-art transformer-based multi-modal methods. Take ADNI for example, Alifuse achieves the highest accuracy of 0.879, over 13% higher than the image-only model that only takes structural MRIs as input. In comparison with the text-only method, Alifuse maintains an advantage of over 6% improvement. Comparing Alifuse to GIT, we observe an advantage of over 5%. Even when compared to Irene, the transformer-based multi-modal classification model, Alifuse still delivers competitive results, surpassing Irene by over 4%. We speculate that we are more flexible in handling missing data than Irene which fills in missing positions with -1 for structural data.
4.2 Ablation Study and Model Analysis
Impact of Different Modules in Alifuse. We conduct ablative experiments to investigate the contribution of each module, which is reported in Table 3. From row 0 to row 3, we gradually remove the numerical loss on digital numbers, all alignment loss functions, and the non-imaging data represented in the text, resulting in the image-only model. The gradually reduced classification performance demonstrates that all these components are desired. Also, the alignment and our special treatment of digits bring more than 3% accuracy improvement.
From row 2 to row 4, the ablation study demonstrates the multi-modal design outperforms the unimodal one, showing the necessity of using both imaging and non-imaging data for AD diagnosis. Compared to imaging data, the non-imaging data is more effective in classifying AD. Therefore, we further study which type of non-imaging data contributes most, as reported in rows 5-7. With row 0 as the reference, the lab results make the largest impact on the classification performance, compared to demographics and doctor’s narrative summary.
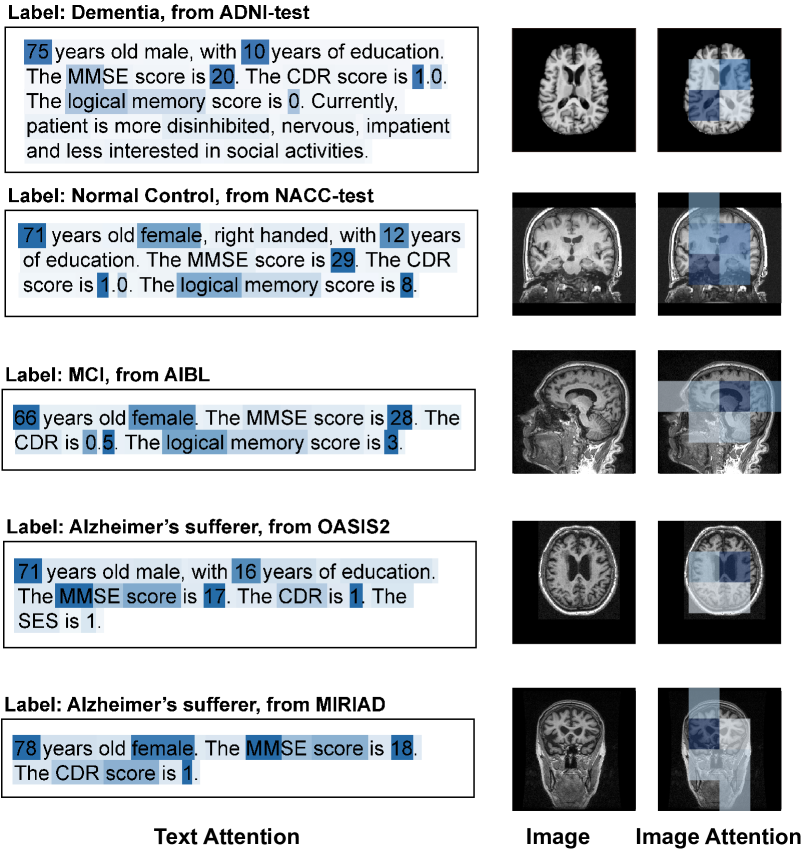
Attention Visualization. Figure 3 visualizes the text and image tokens that have the highest similarity score with the token of multi-modal embedding. Particularly, the text attention map is generated from the self-attention layer, while the image attention map is from the cross-attention layer. Regarding texts, Alifuse presents more attention to the values of ‘age’ and ‘education level’. Compared to the word ‘male’, Alifuse pays more attention to ‘female’, which meets our expectations since women are more likely to suffer from AD. Among the lab results, Alifuse presents more attention on ‘MMSE’, ‘CDR’, and ‘logical memory’, compared to ‘SES’ which exists only in OASIS2. Regarding images, Alifuse shows more attention to brain structures like the ventricle and cortex, which are essential in AD diagnosis.
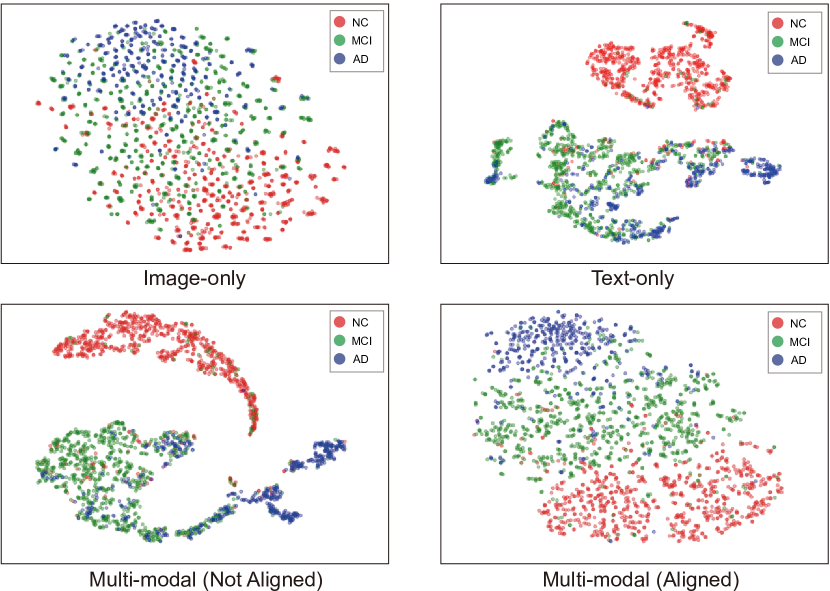
Figure 4 visualizes t-SNEs of four different feature embeddings, i.e., image-only, text-only, and multi-modal with and without alignment. Compared to image-only, the text-only t-SNE presents a better separation among different groups; however, many MCIs are mixed with NC or AD. This situation is alleviated by combining image and text features. Without alignment, text features dominate the diagnosis, resulting in a model lacking the discriminative ability to separate different categories with the same text. The multi-modal t-SNE with alignment shows a good distinction with dispersed features.
5 Conclusion
In this paper, we propose a novel framework that aligns and fuses medical multi-modal data in the form of images and texts. By training and evaluating our model Alifuse on multiple AD study datasets, we demonstrate its effectiveness in classifying NC, MCI, and AD, which outperforms eight baselines on all datasets. Currently, we only consider MRIs; in future work, more image modalities like PET will be included as well. Another extension is the incorporation of longitudinal data, which can further improve the diagnosis accuracy.
References
- [1] Heang-Ping Chan, Lubomir M Hadjiiski, and Ravi K Samala, “Computer-aided diagnosis in the era of deep learning,” Medical physics, vol. 47, no. 5, pp. e218–e227, 2020.
- [2] Zihao Zhao, Sheng Wang, Qian Wang, and Dinggang Shen, “Mining gaze for contrastive learning toward computer-assisted diagnosis,” 2023.
- [3] Xiaoman Zhang, Chaoyi Wu, Ziheng Zhao, Weixiong Lin, Ya Zhang, Yanfeng Wang, and Weidi Xie, “Pmc-vqa: Visual instruction tuning for medical visual question answering,” arXiv:2305.10415, 2023.
- [4] Sein Kim, Namkyeong Lee, Junseok Lee, Dongmin Hyun, and Chanyoung Park, “Heterogeneous graph learning for multi-modal medical data analysis,” in Proceedings of the AAAI Conference on Artificial Intelligence, 2023, vol. 37, pp. 5141–5150.
- [5] Hong-Yu Zhou, Yizhou Yu, Chengdi Wang, Shu Zhang, Yuanxu Gao, Jia Pan, Jun Shao, Guangming Lu, Kang Zhang, and Weimin Li, “A transformer-based representation-learning model with unified processing of multimodal input for clinical diagnostics,” Nature Biomedical Engineering, pp. 1–13, 2023.
- [6] Itai Guez, Gili Focht, Mary-Louise C Greer, Ruth Cytter-Kuint, Li-Tal Pratt, Denise A Castro, Dan Turner, Anne M Griffiths, and Moti Freiman, “Development of a multimodal machine-learning fusion model to non-invasively assess ileal crohn’s disease endoscopic activity,” Computer Methods and Programs in Biomedicine, vol. 227, pp. 107207, 2022.
- [7] Alec Radford, Jong Wook Kim, Chris Hallacy, Aditya Ramesh, Gabriel Goh, Sandhini Agarwal, Girish Sastry, Amanda Askell, Pamela Mishkin, et al., “Learning transferable visual models from natural language supervision,” in International conference on machine learning. PMLR, 2021, pp. 8748–8763.
- [8] Junnan Li, Ramprasaath Selvaraju, Akhilesh Gotmare, Shafiq Joty, Caiming Xiong, and Steven Chu Hong Hoi, “Align before fuse: Vision and language representation learning with momentum distillation,” Advances in neural information processing systems, vol. 34, pp. 9694–9705, 2021.
- [9] Junnan Li, Dongxu Li, Caiming Xiong, and Steven Hoi, “Blip: Bootstrapping language-image pre-training for unified vision-language understanding and generation,” in International Conference on Machine Learning. PMLR, 2022, pp. 12888–12900.
- [10] Hangbo Bao, Wenhui Wang, Li Dong, Qiang Liu, Owais Khan Mohammed, Kriti Aggarwal, Subhojit Som, Songhao Piao, and Furu Wei, “Vlmo: Unified vision-language pre-training with mixture-of-modality-experts,” Advances in Neural Information Processing Systems, vol. 35, pp. 32897–32912, 2022.
- [11] Mengde Xu, Zheng Zhang, Fangyun Wei, Yutong Lin, Yue Cao, Han Hu, and Xiang Bai, “A simple baseline for zero-shot semantic segmentation with pre-trained vision-language model,” arXiv:2112.14757, 2021.
- [12] Bin Yan and Mingtao Pei, “Clinical-bert: Vision-language pre-training for radiograph diagnosis and reports generation,” in Proceedings of the AAAI Conference on Artificial Intelligence, 2022, vol. 36, pp. 2982–2990.
- [13] Zifeng Wang, Zhenbang Wu, Dinesh Agarwal, and Jimeng Sun, “Medclip: Contrastive learning from unpaired medical images and text,” arXiv:2210.10163, 2022.
- [14] Ronald Carl Petersen, Paul S Aisen, Laurel A Beckett, Michael C Donohue, Anthony Collins Gamst, Danielle J Harvey, Clifford R Jack, William J Jagust, Leslie M Shaw, et al., “Alzheimer’s disease neuroimaging initiative (adni): clinical characterization,” Neurology, vol. 74, no. 3, pp. 201–209, 2010.
- [15] Duane L Beekly, Erin M Ramos, William W Lee, Woodrow D Deitrich, Mary E Jacka, Joylee Wu, Janene L Hubbard, Thomas D Koepsell, John C Morris, Walter A Kukull, et al., “The national alzheimer’s coordinating center (nacc) database: the uniform data set,” Alzheimer Disease & Associated Disorders, vol. 21, no. 3, pp. 249–258, 2007.
- [16] Daniel S Marcus, Tracy H Wang, Jamie Parker, John G Csernansky, John C Morris, and Randy L Buckner, “Open access series of imaging studies (oasis): cross-sectional mri data in young, middle aged, nondemented, and demented older adults,” Journal of cognitive neuroscience, vol. 19, no. 9, pp. 1498–1507, 2007.
- [17] Kathryn A Ellis, Ashley I Bush, David Darby, Daniela De Fazio, Jonathan Foster, Peter Hudson, Nicola T Lautenschlager, Nat Lenzo, Ralph N Martins, Paul Maruff, et al., “The australian imaging, biomarkers and lifestyle (aibl) study of aging: methodology and baseline characteristics of 1112 individuals recruited for a longitudinal study of alzheimer’s disease,” International psychogeriatrics, vol. 21, no. 4, pp. 672–687, 2009.
- [18] Ian B Malone, David Cash, Gerard R Ridgway, David G MacManus, Sebastien Ourselin, Nick C Fox, and Jonathan M Schott, “Miriad—public release of a multiple time point alzheimer’s mr imaging dataset,” NeuroImage, vol. 70, pp. 33–36, 2013.
- [19] Chao Jia, Yinfei Yang, Ye Xia, Yi-Ting Chen, Zarana Parekh, Hieu Pham, Quoc Le, Yun-Hsuan Sung, Zhen Li, and Tom Duerig, “Scaling up visual and vision-language representation learning with noisy text supervision,” in International Conference on Machine Learning. PMLR, 2021, pp. 4904–4916.
- [20] Jiahui Yu, Zirui Wang, Vijay Vasudevan, Legg Yeung, Mojtaba Seyedhosseini, and Yonghui Wu, “Coca: Contrastive captioners are image-text foundation models,” arXiv:2205.01917, 2022.
- [21] Ekin Tiu, Ellie Talius, Pujan Patel, Curtis P Langlotz, Andrew Y Ng, and Pranav Rajpurkar, “Expert-level detection of pathologies from unannotated chest x-ray images via self-supervised learning,” Nature Biomedical Engineering, pp. 1–8, 2022.
- [22] Jong Hak Moon, Hyungyung Lee, Woncheol Shin, Young-Hak Kim, and Edward Choi, “Multi-modal understanding and generation for medical images and text via vision-language pre-training,” IEEE Journal of Biomedical and Health Informatics, vol. 26, no. 12, pp. 6070–6080, 2022.
- [23] Alexey Dosovitskiy, Lucas Beyer, Alexander Kolesnikov, Dirk Weissenborn, Xiaohua Zhai, Thomas Unterthiner, Mostafa Dehghani, Matthias Minderer, Georg Heigold, Sylvain Gelly, et al., “An image is worth 16x16 words: Transformers for image recognition at scale,” arXiv:2010.11929, 2020.
- [24] Jacob Devlin, Ming-Wei Chang, Kenton Lee, and Kristina Toutanova, “Bert: Pre-training of deep bidirectional transformers for language understanding,” arXiv:1810.04805, 2018.
- [25] Kaiming He, Xiangyu Zhang, Shaoqing Ren, and Jian Sun, “Deep residual learning for image recognition,” in Proceedings of the IEEE conference on computer vision and pattern recognition, 2016, pp. 770–778.
- [26] Sihong Chen, Kai Ma, and Yefeng Zheng, “Med3d: Transfer learning for 3d medical image analysis,” arXiv:1904.00625, 2019.
- [27] Jinseong Jang and Dosik Hwang, “M3t: three-dimensional medical image classifier using multi-plane and multi-slice transformer,” in Proceedings of the IEEE/CVF conference on computer vision and pattern recognition, 2022, pp. 20718–20729.
- [28] Jianfeng Wang, Zhengyuan Yang, Xiaowei Hu, Linjie Li, Kevin Lin, Zhe Gan, Zicheng Liu, Ce Liu, and Lijuan Wang, “Git: A generative image-to-text transformer for vision and language,” arXiv:2205.14100, 2022.
- [29] Andrew Jaegle, Felix Gimeno, Andy Brock, Oriol Vinyals, Andrew Zisserman, and Joao Carreira, “Perceiver: General perception with iterative attention,” in International conference on machine learning. PMLR, 2021, pp. 4651–4664.