Polycyclic aromatic hydrocarbon (PAH) luminous galaxies in JWST CEERS data
Abstract
It has been an unanswered question how many dusty galaxies have been undetected from the state-of-the-art observational surveys. JWST enables us to detect faint IR galaxies that have prominent polycyclic aromatic hydrocarbon (PAH) features in the mid-IR wavelengths. PAH is a valuable tracer of star formation and dust properties in the mid-infrared wavelength. The JWST Cosmic Evolution Early Release Science (CEERS) fields provide us with wavelength coverage from 7.7 to 21 m using six photometric bands of the mid-infrared instrument (MIRI). We have identified galaxies dominated by mid-IR emission from PAHs, termed PAH galaxies. From our multi-band photometry catalogue, we selected ten PAH galaxies displaying high flux ratios of . The SED fitting analysis indicates that these galaxies are star-forming galaxies with total IR luminosities of at z . The morphology of PAH galaxies does not show any clear signatures of major merging or interaction within the MIRI resolution. The majority of them are on the star-formation main sequence at . Our result demonstrates that JWST can detect PAH emissions from normal star-forming galaxies at , in addition to ultra-luminous infrared galaxies (ULIRGs) or luminous infrared galaxies (LIRGs).
keywords:
galaxies: photometry, galaxies: star formation, infrared: galaxies1 Introduction
Polycyclic aromatic hydrocarbons (PAHs) are chemical compounds based on the Benzene structure (, ‘aromatic ring’) composed of hydrogen and carbon atoms (Candian et al., 2018). These molecules are known to absorb UV/optical light and re-emit infrared (IR) photons via vibration modes, which produce broad features at 3.3, 6.2, 7.7, 8.6, 11.3, 12.7 and 17 m in the IR spectrum of local galaxies (Tielens, 2008; Li, 2020; Kwok, 2022). Due to this property, PAHs serve as good tracers for star formation rate (SFR) (Rigopoulou et al., 1999; Peeters et al., 2003, 2006). Consequently, it is expected that galaxies with high SFRs will exhibit luminous PAH features. PAH luminous galaxies are expected to have SFRs (Desai et al., 2007; Elbaz et al., 2011; Takagi et al., 2011; Kim et al., 2019; Armus et al., 2020), as the overall strength of the PAH emission features is a good tracer of the star-formation activity in galaxies. However, at a redshift of , the PAH features shift to 6.6, 12.4, 15.4, 17.2, 22.6, 25.4 and 34 m, respectively, resulting in a photometric excess in the mid-IR band, which has a high flux density ratio between observation filters such as . The James Webb Space Telescope (JWST) is a state-of-the-art infrared (IR) telescope with a 6.5-meter mirror (Gardner et al., 2006; Kalirai, 2018; McElwain et al., 2023; Wright et al., 2023; Gardner et al., 2023), possessing high sensitivity and spatial resolution. As such, it presents a unique opportunity to select fainter and more distant galaxies displaying mid-IR excess compared to the AKARI and Spitzer telescopes. In particular, recent studies (Ling et al., 2022; Wu et al., 2023; Hsiao et al., 2023a, b) have demonstrated the potential for JWST observations to provide improved insight into the nature of galaxies.
The majority of PAH galaxies suffer from statistical bias towards more luminous populations, e.g., luminous IR galaxies (LIRGs, ), and ultra-luminous IR galaxies (ULIRGs, ) (Elbaz et al., 2005, 2007), up to peak of the star-formation rate density (SFRD) (Weedman & Houck, 2008; Shipley et al., 2016). The majority of these galaxies are star-forming galaxies on the main sequence (MS) with a smaller fraction of starbursts (SB) above the MS at different redshifts (Elbaz et al., 2007, 2011; Whitaker et al., 2012; Pearson, W. J. et al., 2018; Popesso et al., 2023). However, research on less luminous sources with , such as normal/faint galaxies at similar/higher redshifts, is limited. In this work, we aim to identify and investigate the properties of such galaxies, including their star formation rates, stellar masses and morphology.
JWST is a game changer which has opened up a new era and enables us to observe faint IR galaxies that were beyond the detection limits of previous generation space telescopes such as AKARI and Spitzer. With JWST, we are now able to peer/select normal/faint IR galaxies that have prominent PAHs even at z . In this work, we show one of the first such analyses using the JWST early release observations.
This paper is organised as follows: In Section 2 we present the properties of JWST CEERS field data and spectral energy distribution (SED) model. In Section 3, we show the SED fitting results by CIGALE (Boquien et al., 2019), and we compare the physical properties of PAH luminous galaxies to the literature in Section 4. Finally, our conclusion is given in Section 5. A flat cosmology with H0 = 70 km s-1 Mpc-1, and is used. All magnitudes are given in the AB system.
2 Data and Methods
2.1 Data
We utilise the JWST MIRI 6 bands observations at 7.7, 10.0, 12.8, 15.0, 18.0, and 21.0 m (F770W, F1000W, F1280W, F1500W, F1800W, and F2100W) in the Cosmic Evolution Early Release Science (CEERS) fields (Finkelstein et al., 2017). We used the two sub-fields of CEERS (i.e., jw01345-o001 and jw01345-o002) which cover 2 arcmin2 each and 4 arcmin2 in total. The detection limits in these 6 bands are 0.20, 0.40, 0.79, 1.3, 4.0, and 10 Jy from F770W to F2100W, respectively. The details for source extraction are described in (Wu et al., 2023). We cross-match JWST sources to the Cosmic Assembly Near-infrared Deep Extragalactic Legacy Survey (CANDELS) Extended Groth Strip (EGS) field (Stefanon et al., 2017). The CANDELS-EGS survey gathered multi-wavelength photometric data ranging from ultraviolet to infrared wavelengths, observed using six different instruments. The UV data (, , , , ) were obtained through Canada–France–Hawaii Telescope (CFHT) MegaCam observations, while the NOAO Extremely Wide-Field Infrared Imager (NEWFIRM) Medium-Band Survey (NMBS) provided additional photometry. The NIR band (, , and ) data were acquired through CFHT Wide-field InfraRed Camera (WIRCam) observations, while the Hubble Space Telescope (HST) Advanced Camera for Surveys (ACS) and HST Wide Field Camera 3 (WFC3) provided 5 bands of photometry from optical to NIR. Finally, Spitzer IRAC observations provided 4 bands of photometry from 3 to 8 m, detail of the catalogue is described in Stefanon et al. (2017). In Table 1, we present the main properties of the 21 bands data set which we used to perform the SED fitting.
2.2 Sample selection
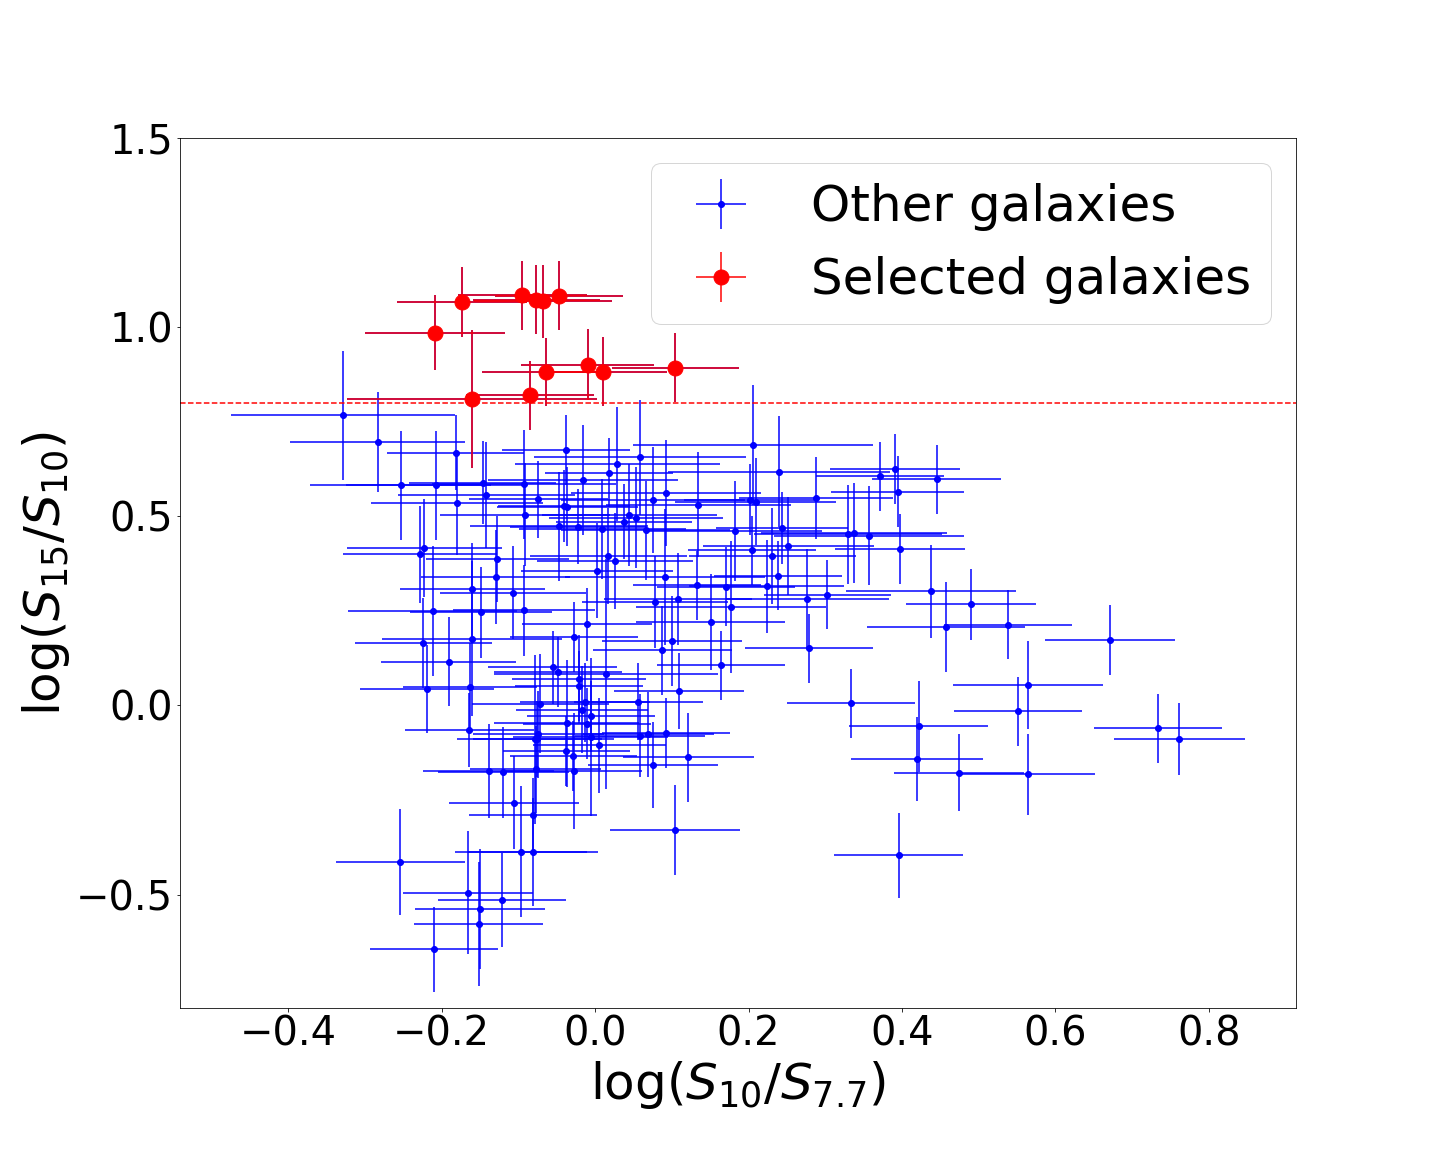
In Fig. 1, we show the colour-colour plot between and . We select sources based on detection in 3 MIRI bands F770W, F1000W, and F1500W. There are 155 sources in these three bands. We utilise the method from Takagi et al. (2010) to select 15 m flux density excess sources that are likely PAH galaxies. The selection criterion for the sample is the ratio of flux density between 15-to-10 m greater than 0.8 (dex), or from (Takagi et al., 2010), indicated by the red dashed line in Fig. 1. In total, we identify 12 galaxies that meet the selection criteria.
| Band | Instrument | Wavelength (m) | Depth 5 (mag) | Reference |
| CFHT/MegaCam | 0.383 | 27.1 | Gwyn (2012) | |
| CFHT/MegaCam | 0.489 | 27.3 | Gwyn (2012) | |
| CFHT/MegaCam | 0.625 | 27.2 | Gwyn (2012) | |
| CFHT/MegaCam | 0.769 | 27.0 | Gwyn (2012) | |
| CFHT/MegaCam | 0.888 | 26.1 | Gwyn (2012) | |
| F606W | HST/ACS | 0.596 | 28.8 | Koekemoer et al. (2011) |
| F814W | HST/ACS | 0.809 | 28.2 | Koekemoer et al. (2011) |
| F125W | HST/WFC3 | 1.250 | 27.6 | Koekemoer et al. (2011) |
| F140W | HST/WFC3 | 1.397 | 26.8 | Brammer et al. (2012); Skelton et al. (2014) |
| F160W | HST/WFC3 | 1.542 | 27.6 | Koekemoer et al. (2011) |
| WIRCam | 1.254 | 24.4 | Bielby, R. et al. (2012) | |
| WIRCam | 1.636 | 24.5 | Bielby, R. et al. (2012) | |
| WIRCam | 2.159 | 24.3 | Bielby, R. et al. (2012) | |
| IRAC1 | 3.6 | 21.8 | Ashby et al. (2015) | |
| IRAC2 | 4.5 | 22.4 | Ashby et al. (2015) | |
| F770W | JWST/MIRI | 7.7 | 25.4 | Wu et al. (2023) |
| F1000W | JWST/MIRI | 10.0 | 24.6 | Wu et al. (2023) |
| F1280W | JWST/MIRI | 12.8 | 24.0 | Wu et al. (2023) |
| F1500W | JWST/MIRI | 15.0 | 23.5 | Wu et al. (2023) |
| F1800W | JWST/MIRI | 18.0 | 22.7 | Wu et al. (2023) |
| F2100W | JWST/MIRI | 21.0 | 22.1 | Wu et al. (2023) |
2.3 CIGALE SED fitting
We utilise the Code Investigating GALaxy Emission (CIGALE, Boquien et al., 2019) to fit the spectral energy distribution (SED) of galaxies. In the energy balance principle, the stellar light emitted in UV/optical is absorbed by dust and re-emitted in the mid- to far-IR. CIGALE fits the multi-wavelength band photometric data based on the energy balance principle using various modules (e.g., Boquien et al., 2019; Wang et al., 2020; Santos et al., 2021). We utilise CIGALE version 2020.0 to fit the SEDs with models in Table 2 such as star formation history (SFH), attenuation law, dust emission, and single stellar population (SSP). Important quantities obtained by CIGALE such as the photometric redshift, total infrared luminosity, and star formation rate (SFR) are presented in Table 3. We utilise the delayed SFH optional exponential burst from Boquien et al. (2019). We adopt the stellar templates from Bruzual & Charlot (2003) with the initial mass function Salpeter (1955). The dust attenuation model follows Charlot & Fall (2000) with additional flexibility. The attenuation law model is contributed by the birth cloud and the interstellar medium (ISM) with two power laws (Lo Faro et al., 2017) and (Buat et al., 2018), and we set slope flexibility. In addition, we parameterised the ISM V-band attenuation () and the based on (Malek, K. et al., 2018). The dust absorbed from UV/optical and re-emitted into IR is modelled from dust templates of (Draine et al., 2014). Finally, we incorporated the AGN emission model module proposed by Fritz et al. (2006), which employs a radiative transfer model incorporating three key components: (1) the primary source of radiation situated within the torus, (2) the scattered emission by dust, and (3) the thermal dust emission, as described by Boquien et al. (2019). Compared to (Santos et al., 2021), we tried a slightly larger number of parameters (e.g., 0.1 for optical depth; 0.0 for beta in gas density; 0.0 for gamma in gas density; 60 for opening angle; 0.001 for the angle between equatorial axis and line of sight). The redshifting module contains the K-correction to estimate the photometric redshift (Boquien et al., 2019). The photometric redshift is a free parameter in the SED fitting with an interval of 0.01 for , and 0.1 for .
| Parameters | Value |
| Delayed SFH with optional exponential burst (Boquien et al., 2019) | |
| e-folding time of the main stellar population [ yr] | 2000.0, 5000.0, 10000.0 |
| Age of the galaxy’s main stellar population [ yr] | 1000.0, 2000.0, 5000.0, 10000.0 |
| e-folding time of the late starburst population [ yr] | 200.0, 500.0, 2000.0, 20000.0 |
| Age of the late burst [ yr] | 10.0, 20.0 |
| Mass fraction of the late burst population | 0.00, 0.01, 0.05, 0.1 |
| multiplicative factor controlling the amplitude of SFR if normalisation is True | 1.0 |
| SSP (Bruzual & Charlot, 2003) | |
| Initial mass function | Salpeter (1955) |
| Metallicity | 0.02 |
| Age of separation between the young and old star populations | 10.0 |
| Dust attenuation (Charlot & Fall, 2000) | |
| Logarithm of the V-band attenuation in the ISM | 0.1, 0.17, 0.28, 0.46, 0.77, 1.29, 2.15, 3.59, 5.99, 10.0 |
| Ratio of V-band attenuation from old and young stars | 0.44 |
| Power-law slope of the attenuation in the ISM | -10.0, -5.0, -1, -0.9,-0.7,-0.5,-0.1 |
| Power-law slope of the attenuation in the birth cloud | -10.0, -5.0, -3.0, -1.3, -1.0, -0.7 |
| Dust emission (Draine et al., 2014) | |
| Mass fraction of PAH | 0.47, 1.12, 1.77, 2.5, 3.19, 3.9, 4.58, 5.26, 5.95, 6.63, 7.32 |
| Minimum radiation field () | 0.1, 1.0, 10.0 |
| Power-law slope () | 1.0, 3.0 |
| Fraction illuminated from to | 0.01, 0.05, 0.1 |
| AGN emission (Fritz et al., 2006) | |
| Ratio of the maximum and minimum torus radii | 60.0 |
| Optical depth at 9.7 m | 0.1, 0.3,6.0 |
| Value of in gas density gradient along the | |
| radial and polar distance coordinates (Eq. 3 in Fritz et al., 2006) | 0.0, -0.5 |
| Value of in gas density gradient along the | |
| radial and polar distance coordinates (Eq. 3 in Fritz et al., 2006) | 0.0, 4 |
| Opening angle of the torus | 60.0, 100 |
| Angle between equatorial axis and line of sight | 0.001, 60.1,89.99 |
| AGN contribution fraction () | 0.025 for 0.0 - 0.7 |
| Redshifting (Boquien et al., 2019) | |
| Redshift | 0.01 for , and 0.1 for |
3 Results
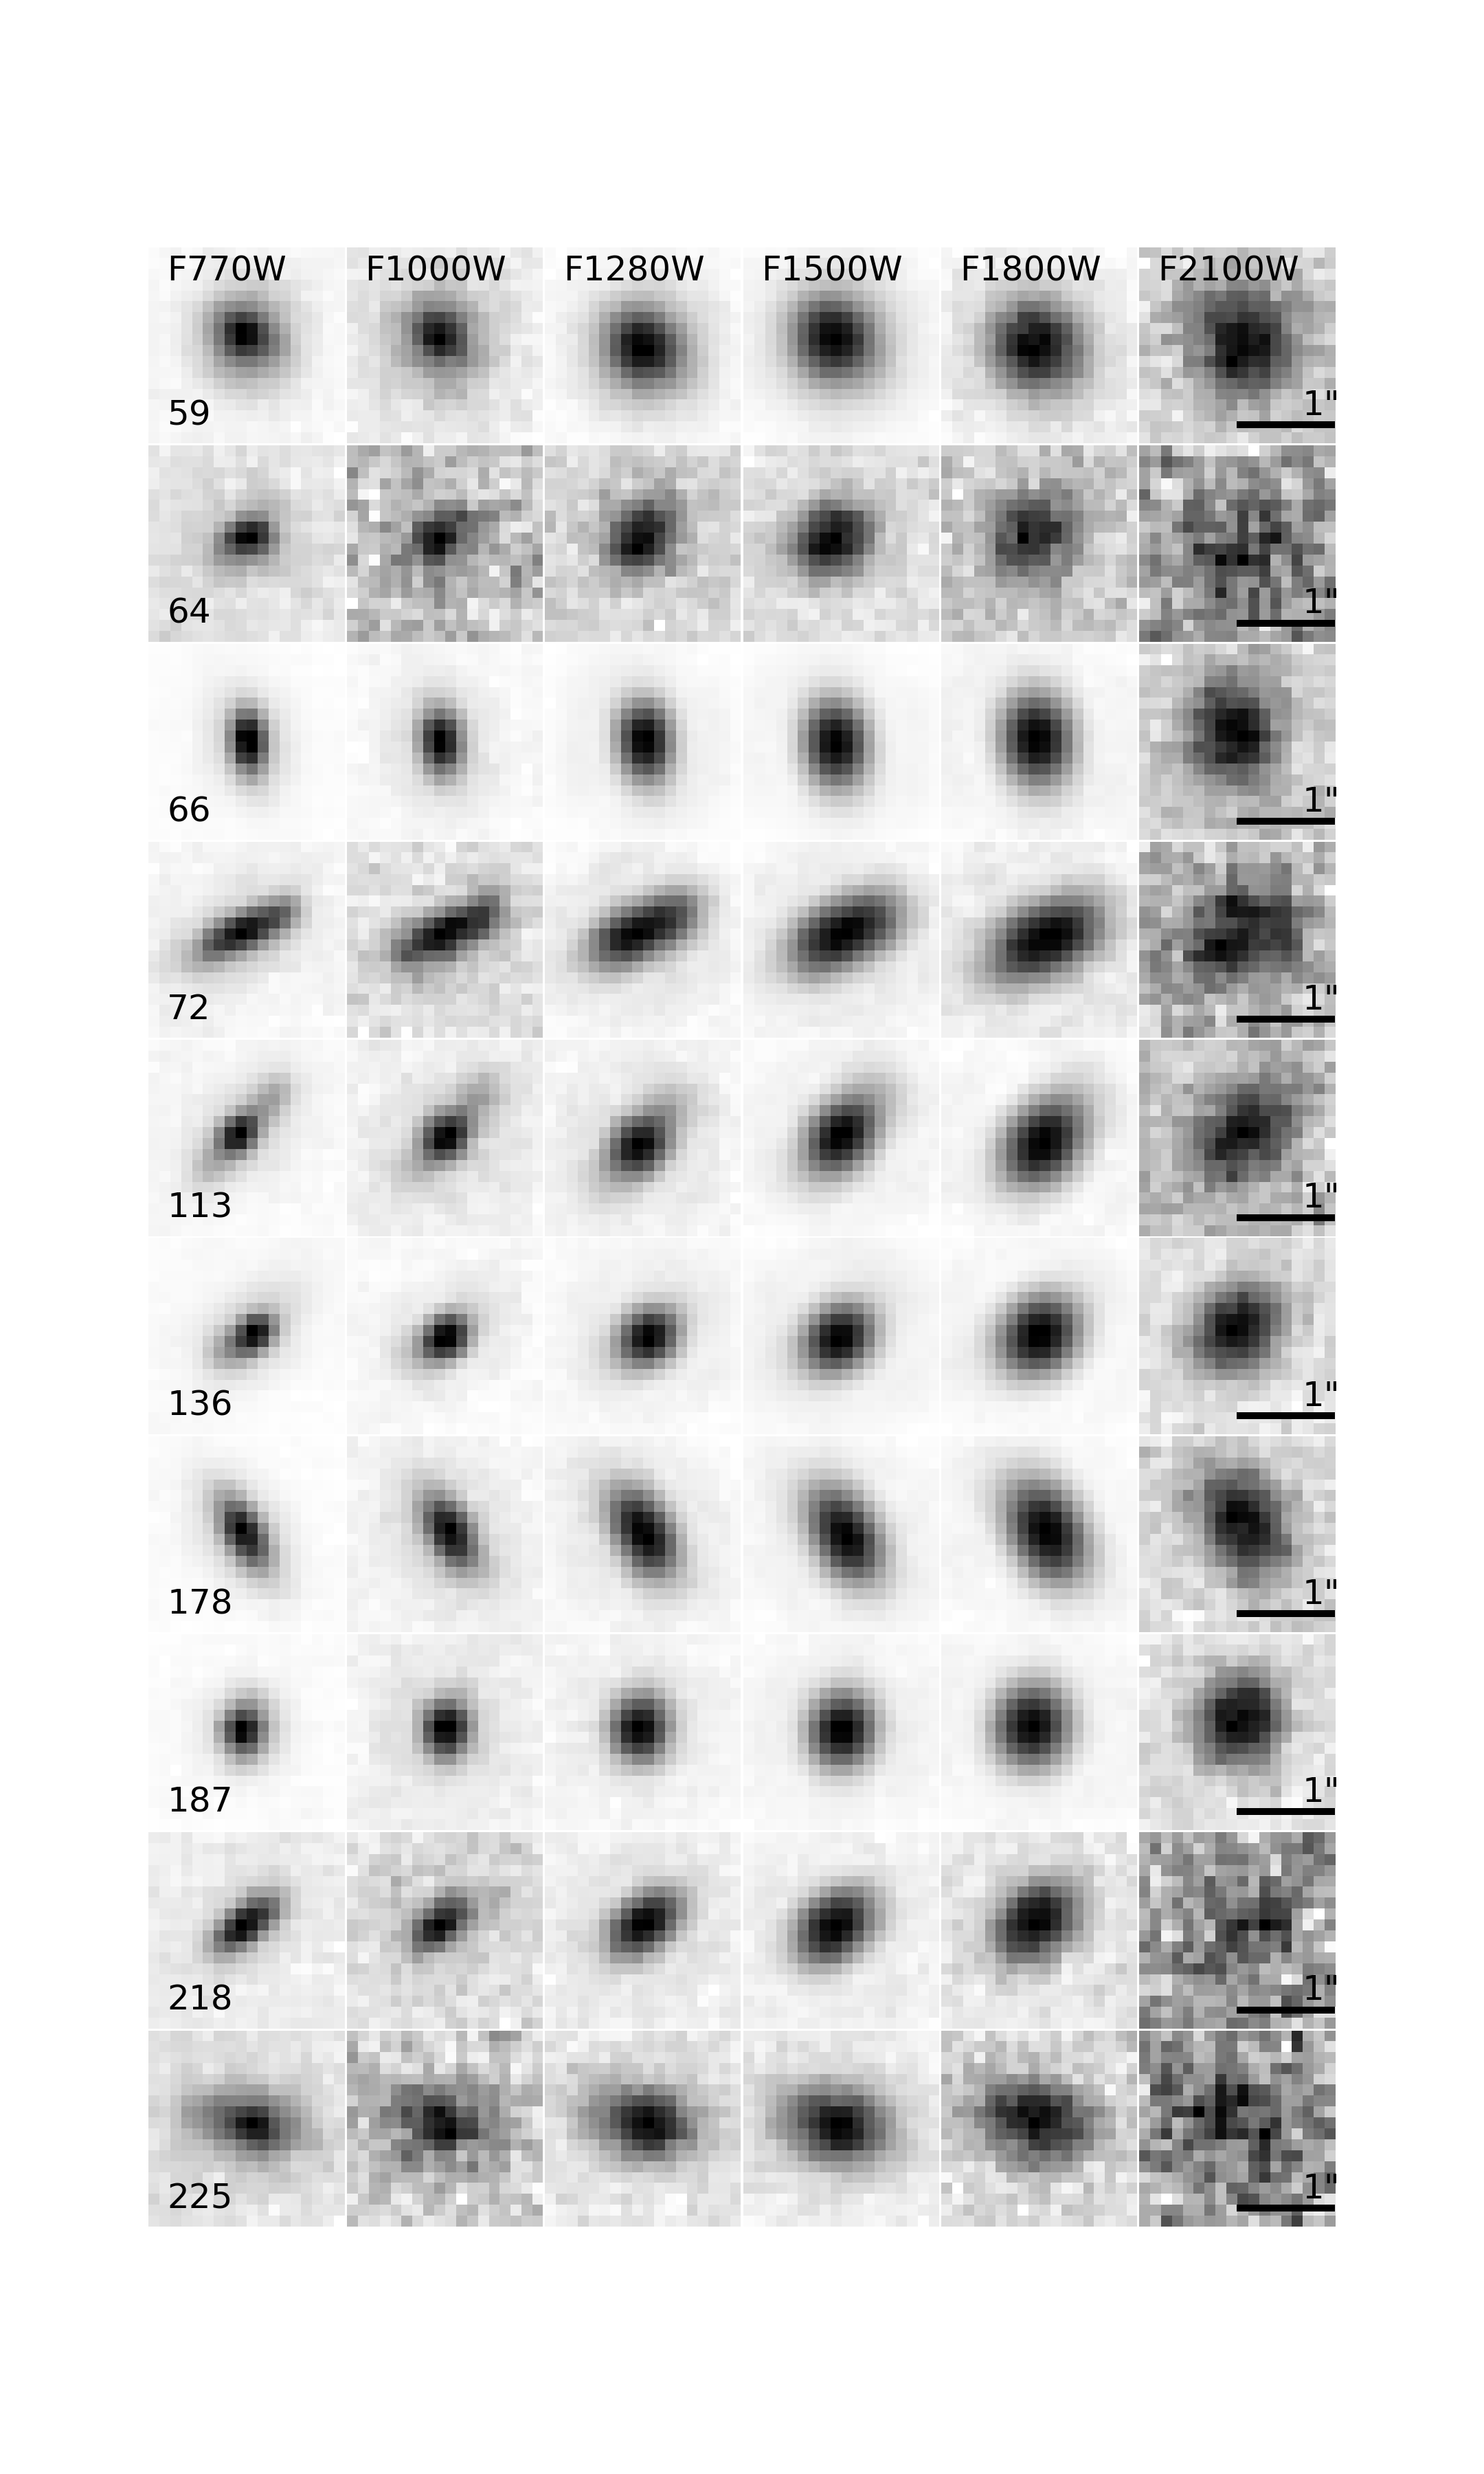
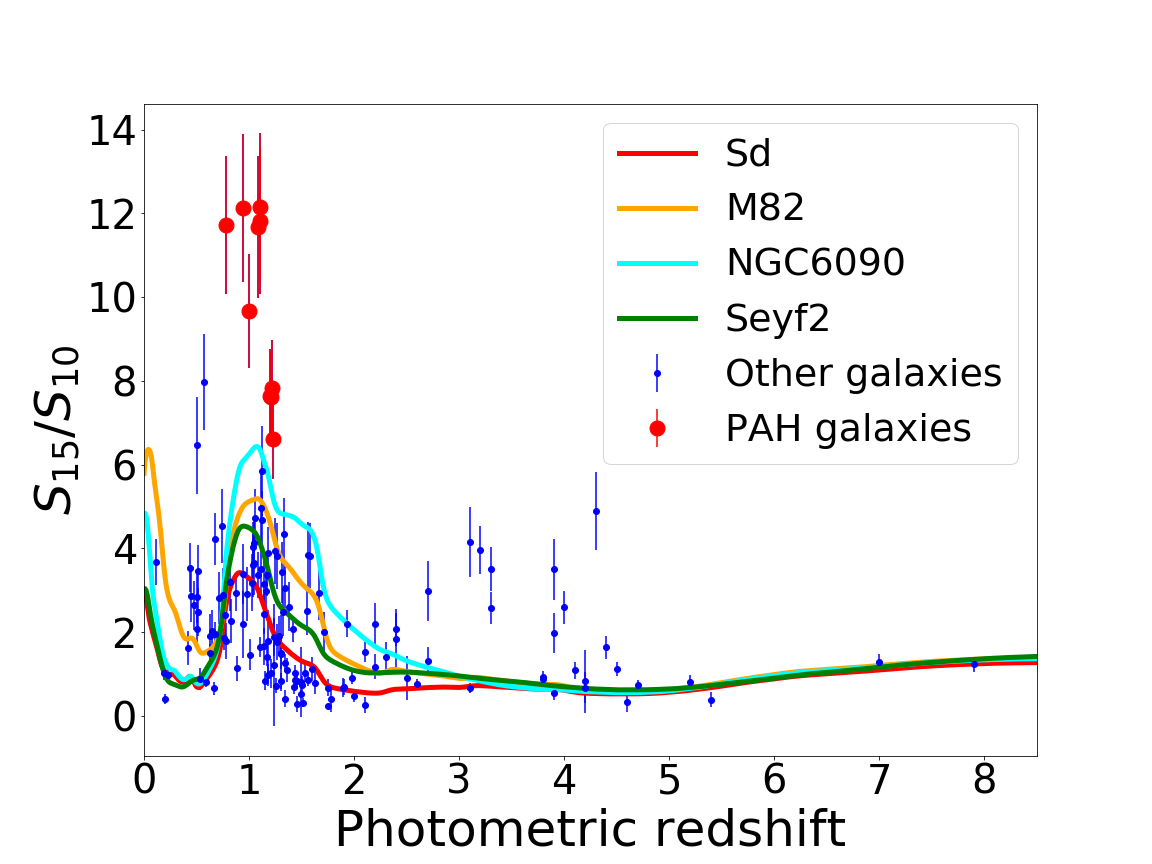
We identify a subsample of 10 PAH luminous galaxies through SED fitting using CIGALE. These galaxies are selected based on a reduced chi-square () less than 6 to ensure reliable fitting results. Two galaxies which do not meet the criterion are excluded, as shown in Fig. 19, 20. The estimated physical properties of the galaxies are listed in Table 3. The AGN contribution obtained from CIGALE is zero for these ten sources, and ID 66 and 136 have 0.025. Since AGN contribution is very small (less than 2.5%), we regard dust luminosity from CIGALE as total infrared luminosity. In Fig. 2, we show cutout images (2"2") at six MIRI bands of our ten PAH-selected galaxies, and the pixel scale is 0.11". These are classified as extended sources with CLASS_STAR in the EGS catalogue (Stefanon et al., 2017). We note that our MIRI imaging does not provide the required resolution to conclude if these galaxies are interacting systems. As reported by Huang et al. (2023, Fig.1) NIRCam imaging can provide the necessary resolution at to analyse the detailed morphologies of these galaxies. In Fig. 3, we present an example (ID59 in the Table 3) of the SED fitting result from CIGALE. The model spectrum (black solid line) is mainly composed of two primary components: stellar emission (blue dashed line) and dust emission (red solid line). We also analyse the photometric redshift and the reduced chi-square (). In Fig. 4, we show the redshift against the flux density ratio between and for all sources in the JWST CEERS field. Using galaxy SED models from Polletta et al. (2007), we show how of typical galaxy types evolve as a function of redshift, presenting a comparison with the observed data points. The SED model templates used here are a spiral galaxy (Sd) as a normal star-forming galaxy (SFG), M82 as a starburst, NGC6090 (similar to M82 but showing much stronger PAHs), and Seyfert type2 as a composite. It shows that our sample galaxies are located much higher than what we can expect from the galaxy types we know. The red points, representing the PAH luminous galaxies, are located around . As the rest-frame PAH 7.7 m features shift to 15.4m at , this is expected by selecting 15m excess sources.
| ID | RA | DEC | reduced chi-square() | photometric redshift | () | SFR () | M () |
|---|---|---|---|---|---|---|---|
| 59 | 215.16776 | 53.051688 | 5.17 | 0.94 | 5.11 3.05 | 12.67 5.63 | 2.86 0.56 |
| 64 | 215.158128 | 53.046943 | 1.37 | 1.0 | 20.72 18.4 | 57.95 53.22 | 0.71 0.28 |
| 66 | 215.159489 | 53.048452 | 3.94 | 1.1 | 38.92 2.0 | 49.12 3.27 | 12.31 0.74 |
| 72 | 215.160424 | 53.051557 | 2.75 | 1.1 | 2.99 0.84 | 5.31 1.31 | 2.53 0.25 |
| 113 | 215.16312 | 53.064216 | 4.29 | 1.2 | 11.39 5.32 | 16.45 14.37 | 3.91 0.5 |
| 136 | 215.145024 | 53.058089 | 3.26 | 1.22 | 9.54 3.53 | 15.85 6.07 | 6.31 0.79 |
| 178 | 215.094758 | 52.983213 | 5.05 | 1.23 | 43.5 12.45 | 62.92 21.31 | 6.7 1.04 |
| 187 | 215.075643 | 52.973745 | 1.76 | 1.21 | 15.88 2.71 | 21.09 4.83 | 6.93 0.8 |
| 218 | 215.084489 | 52.990326 | 2.33 | 1.09 | 6.3 3.69 | 10.14 6.54 | 1.62 0.5 |
| 225 | 215.068587 | 52.98334 | 4.75 | 0.78 | 27.04 5.31 | 75.92 15.49 | 0.79 0.16 |

4 Discussion
4.1 Colour Selection
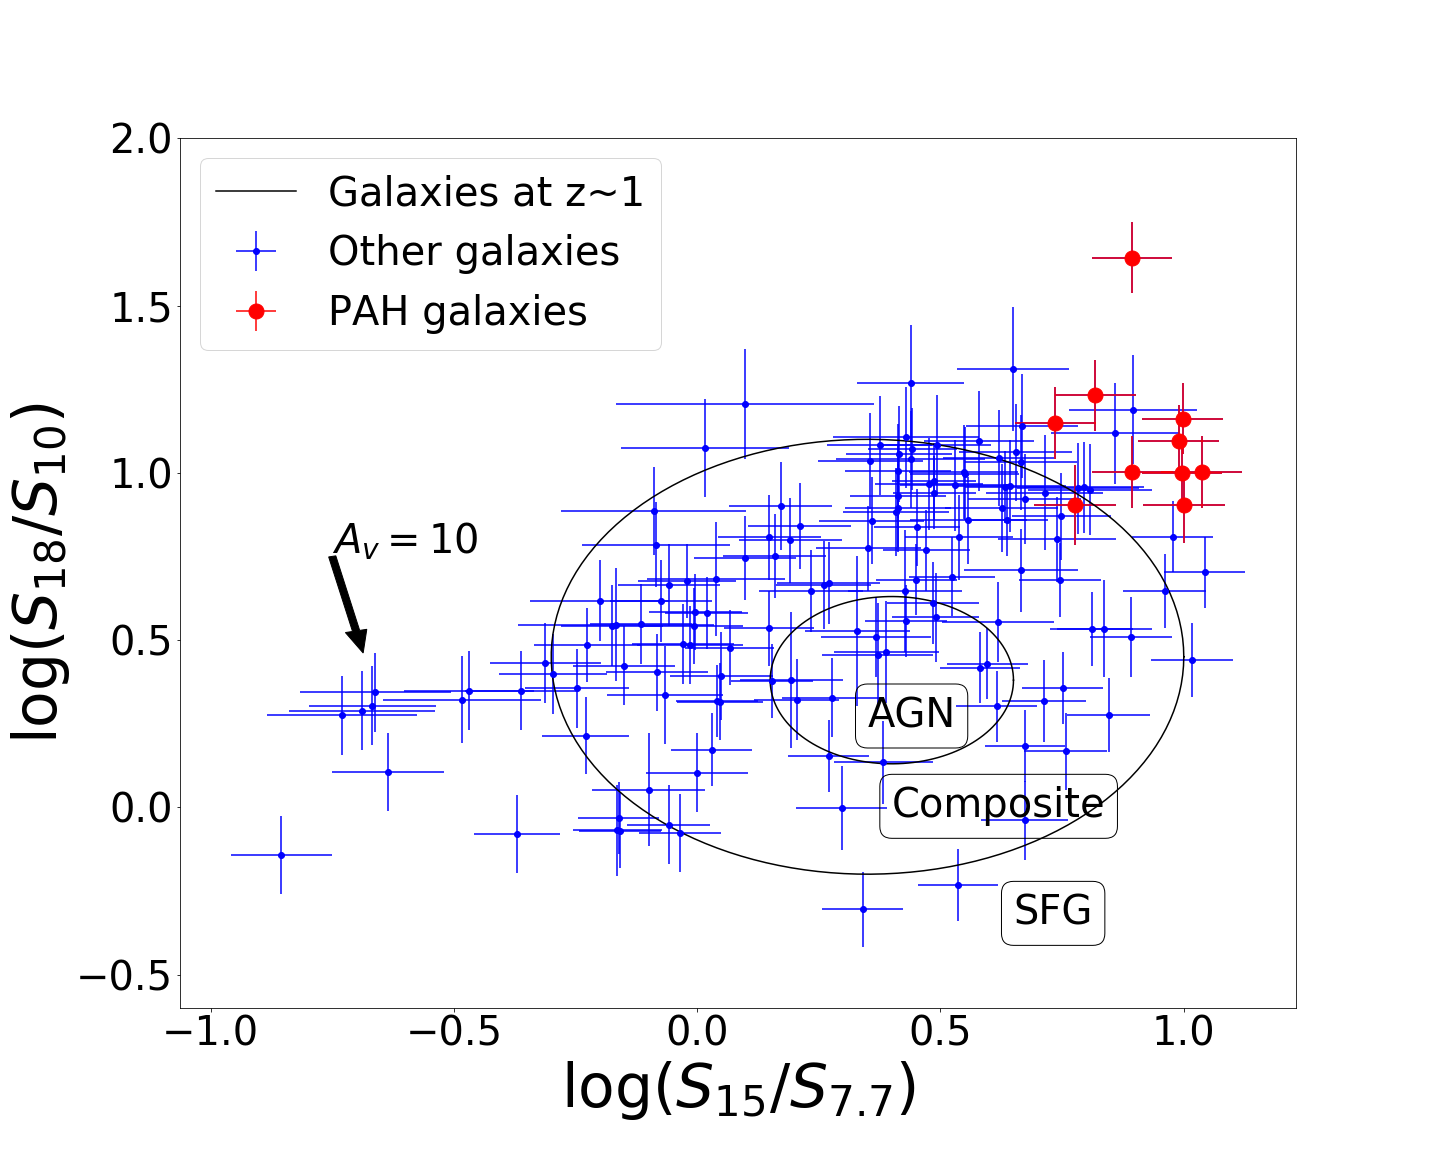
Kirkpatrick et al. (2017) generated the synthetic galaxies from a MIR-based template library (Kirkpatrick et al., 2015). The template library comprises 11 templates derived from spectroscopic sources observed with Spitzer and Herschel. Kirkpatrick et al. (2017) utilised 5500 synthetic galaxies to establish JWST MIRI colour combination criteria for three distinct populations AGNs, Composite, and SFGs for galaxies within the redshift range of 1 to 2. In Fig. 5, - colour-colour plot for JWST sources, and two black contours indicate the selection criteria at from Kirkpatrick et al. (2017, Eq.1). AGNs are located inside the small circle, composites are located between the two circles, and SFGs are located outside the big circle. Red dots represent our ten PAH luminous galaxies, with 9 of 10 sources located in the SFG region, and one source located in the composite region. Note, however, that these boundaries are not clear cuts, but rather a transitional area, where galaxies can mix in and out. None of the PAH galaxies we have selected is in their AGN circle, indicating that our criteria have successfully selected star-forming galaxies without significant contamination from AGN.
4.2 Obscured AGN or Compact obscured nuclei
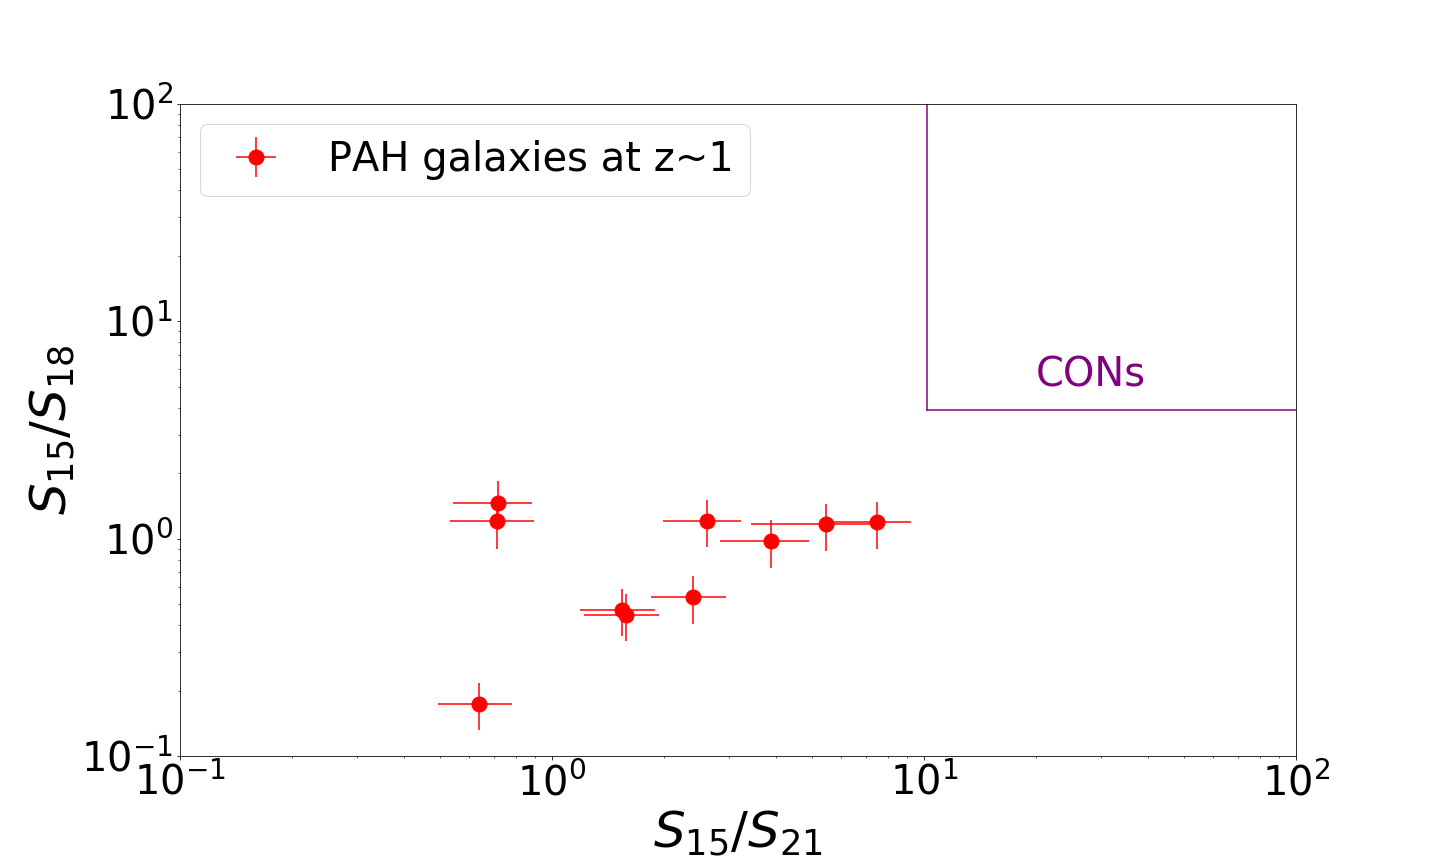
Falstad et al. (2021) discussed the compact obscured nuclei (CON) with identifications of HCN molecule emission lines in the spectrum. García-Bernete et al. (2022b) discussed CONs with the PAH 6.2, 11.3 and 12.7 m equivalent width (EW) ratio and 9.7 m silicate absorption line, and performed the CONs criteria for the JWST MIR photometry observation at redshift from 0 to 1.5. In Fig. 6, we show the criteria from (García-Bernete et al., 2022b) given the CON-dominated regions on the colour-colour plot. We found none of our PAH galaxies are located in the CON region. In Sec.4.1, we compared the distribution of our sample with the colour criteria from Kirkpatrick et al. (2017) which classify their sample into AGN, composite, and SFG. Where should deep obscured AGN locate on the colour-colour plot? In Fig. 5, we calculate the dust extinction from (Gordon et al., 2023), and we show the extinction arrow at . Due to the 9.7 m silicate absorption, colour at becomes bluer by adding more extinction. If our sources experience heavy dust attenuation, after the correction, the sources will shift in the top left direction, the opposite of the arrow direction. Therefore, in this colour, the selected PAH galaxies are not consistent with the AGN and the composite even after possible extinction correction, except for one galaxy that is already in the composite region.
4.3 Emission lines contribution to the F1000W and F1500W filters
We utilised the 15 m excess to select the PAH luminous galaxies. However, in García-Bernete et al. (2022a, c); Rich et al. (2023) discussed that the emission line gives the contribution to the photometry observation. Chastenet et al. (2023a, b) discuss the CO, HI, and H emission lines contribution. Rich et al. (2023) said that the AGN-dominated star-forming region shows extremely low 3.3 and 6.2 m PAH equivalent width, and there are strong Pfund emission lines at 7.46m. The excess in the photometry has the probability of contributing to the emission line. The JWST F1000W, F1500W filters have bandwidths of 1.8, 2.92 m, respectively. The half-power wavelengths, where the transmission falls to 50% of its peak value, range from 9.023 to 10.891m and 13.527 to 16.664m (Rieke et al., 2015). It is a concern that hydrogen emission lines might contribute to the flux in these filters, while our main focus is to estimate the effect of the PAH emissions. For galaxies at , five hydrogen emission lines fall into F1000W or F1500W filter broadband. In the F1500W filter at , two emission lines are observed, Pfund at 7.46 m, and Humphreys at 7.49 m. In the F1000W filter, three emission lines could contribute, Pfund at 4.65 m, and Humphreys (10-6) and (11-6) at 5.13 and 4.67 m. We estimate the contributions by utilising the SFR calculated by CIGALE as listed in Table 3. Following the Kennicutt (1998) Eq.2, we determined the . We estimate contributions from the Pfund and Humphreys , assuming the CASE B recombination at , (Hummer & Storey, 1987). Our calculations revealed that the emission lines in the F1000W filter have contributions ranging from 0.01-2.4% for Pfund and 0.006-1.15%, 0.005-0.88% for Humphreys (10-6), (11-6), respectively. In the F1500W filter, the contributions are 0.006-0.7% for Pfund , and 0.001-0.2% for Humphreys . Overall, the hydrogen recombination emission lines contribute less than 5% to the JWST F1000W, F1500W filters.
4.4 Star Formation Main Sequence
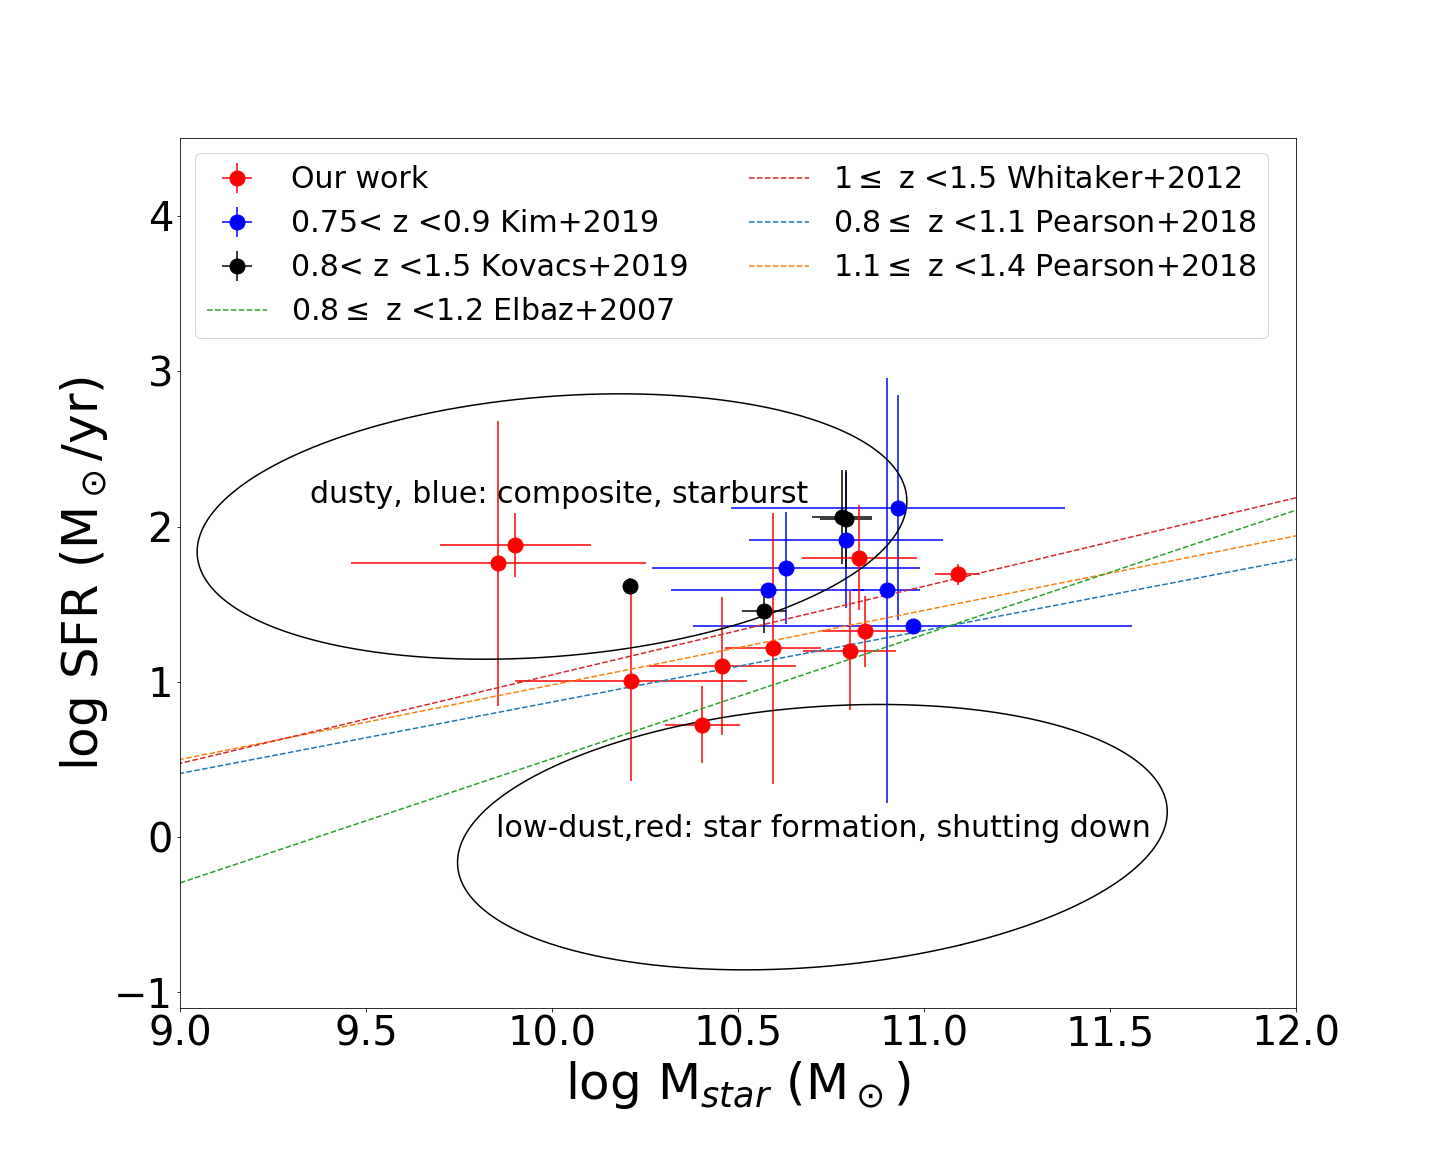
The main sequence (MS) is a correlation between SFR and stellar mass (M) of star-forming galaxies. MS evolution as a function of redshift is shown and discussed recently (Elbaz et al., 2007; Whitaker et al., 2012; Pearson, W. J. et al., 2018; Popesso et al., 2023). We calculated the SFR and M from CIGALE, listed in Table 3, and compared the results at the similar redshift bin with literature. In Fig. 7, Pearson, W. J. et al. (2018) gives MS in , , and Elbaz et al. (2007) gives . Whitaker et al. (2012) gives , and the outlier regions with other type galaxies. We over-plot four galaxies between from the AKARI catalogue in (Kovács et al., 2019). Our samples plotted in red are mostly located in the main sequence, except for two galaxies in the upper left region as starbursts or composite. One of the two objects is the composite in Fig. 5. However, both have the AGN fraction=0 in CIGALE SED fitting. Note that CIGALE SED fitting utilises 21 available filters, in contrast to the colour-colour diagram which relies on only 4 filters. Therefore, we regard the CIGALE SED fitting as more informative. It is promising that even though Fig. 5 only utilises 4 colours, we have obtained consistent results from the remaining sources. Compared to previous data from the AKARI, and Spitzer telescope, JWST observed galaxies with less massive and smaller total IR luminosity.
4.5 PAH luminosity
At a redshift of z 1, the PAH 7.7 m feature in galaxies shifts to 15.4 m, leading to a 15m-excess, which we used to identify PAH luminous galaxies (Takagi et al., 2010). To quantify the strength of PAH features in these galaxies, we employed a relation between PAH peak luminosity and total infrared luminosity for starburst, as established by (Houck et al., 2007; Weedman & Houck, 2008). The equation is given as,
| (1) |
is the PAH 7.7 m peak luminosity which indicates the strength of PAH features in the galaxies, and is total IR luminosity. In our work, we computed from CIGALE SED fitting results shown in Table 3. We follow Houck et al. (2007); Kennicutt (1998) to estimate the PAH 7.7 m peak luminosity at rest frame from CIGALE SED fitting results, the equation given as,
| (2) |
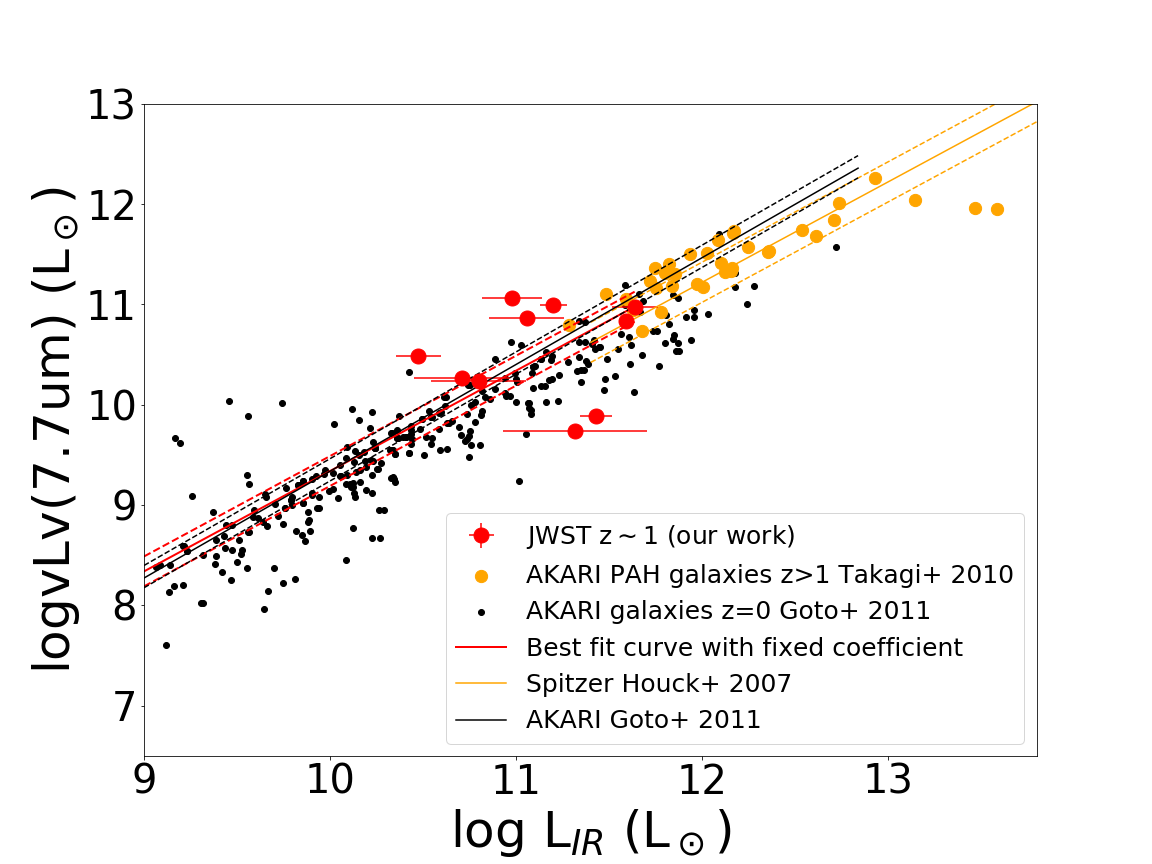
is the rest-frame wavelength, here is 7.7 m. is the observed flux density, here is 15 m flux density. is light speed. is a photometric redshift. is the flux density of the PAH 15 m peak value in the black line, shown in Fig. 3, and is the luminosity distance calculated from photometric redshift within the cosmological model. Takagi et al. (2010) provided PAH-selected galaxies, which are LIRGs/ULIRGs, the orange points shown in Fig. 8, out of all the galaxies at z in the AKARI catalogue. In Fig. 8, we have the galaxies which have the one order fainter than those in the AKARI sample from (Takagi et al., 2010). We performed a least square fit in our work with the same coefficient, and the result is given as,
| (3) |
Compared with (Houck et al., 2007; Weedman & Houck, 2008) and (Takagi et al., 2010) observed galaxies by AKARI at 1, our result(red solid line) is located within 1-sigma(orange dashed line). Therefore, statistically, the correlations are consistent between our work and literature on the to plane. In Fig. 8, we also compare with the local IR galaxies which are shown in black points and to relation (Goto et al., 2011). Compared with all galaxies in our work, there are no significant differences between the two relations, which indicates the to relation does not change significantly in these redshift and luminosity ranges.
Since PAH is a good tracer of the star-forming region in the Universe, there is a relation between PAH luminosity and SFR, which in turn relates SFR and for SFGs. Numerous studies support this relationship, as evidenced by galaxy samples and observations at high redshift (Pope et al., 2008; Riechers et al., 2014; Shipley et al., 2016; Spilker et al., 2023). Pope et al. (2008) presented PAH luminosity as a proxy for the SFR in the submillimeter galaxies (SMGs) from redshift 1 to 2.5 and Riechers et al. (2014) presented one SMG at have a consistent correlation between strong PAH features and the SFR. In recent JWST observation results, the galaxy at also presents strong PAH emission lines (Spilker et al., 2023). Shipley et al. (2016) gave a relation between the PAH peak luminosity and the star formation rate from Spitzer observations as follows:
| (4) |
and Kovács et al. (2019) gives a correlation from AKARI:
| (5) |
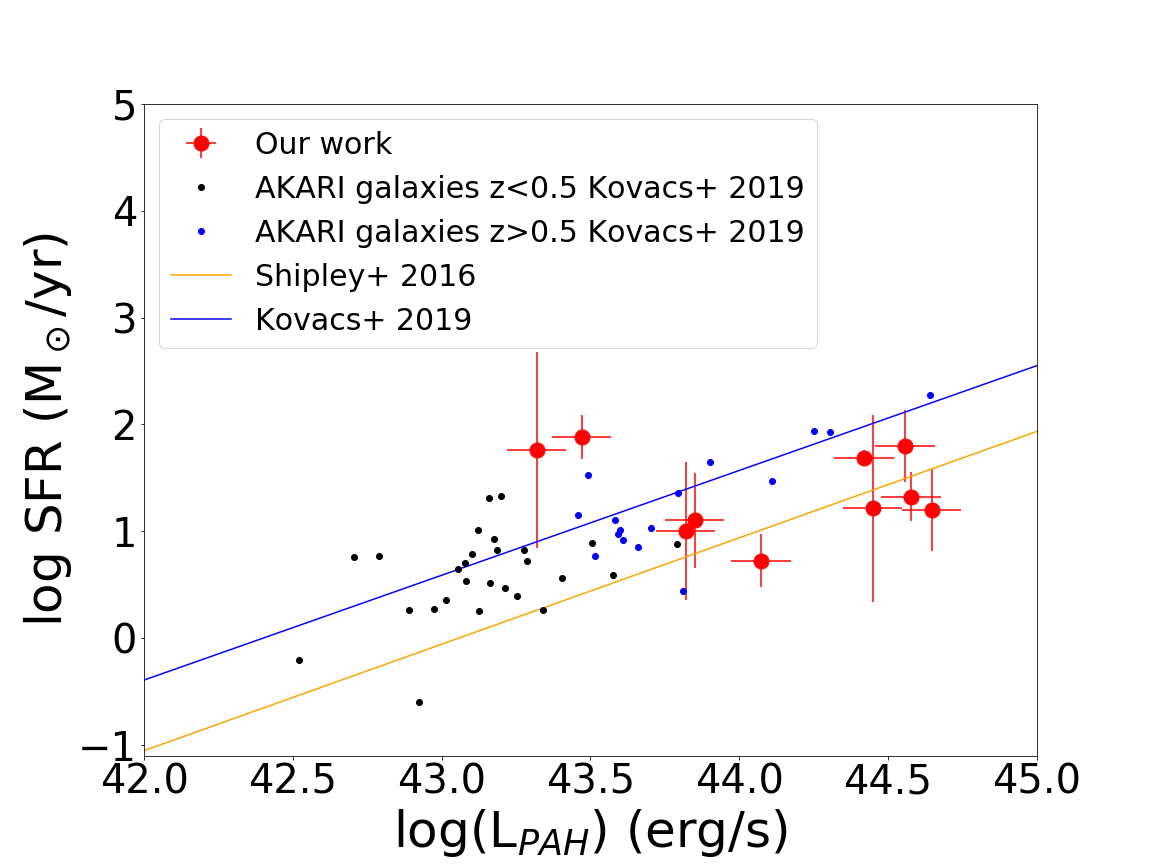
is the PAH peak luminosity in Eq. 2 from (Kovács et al., 2019), the red points are our work in which the SFRs are calculated by CIGALE SED fitting. In Fig. 9, we present the and SFR calculated from CIGALE SED fitting for PAH luminous galaxies. In our work, the relation suggests a correlation between PAH luminosity and SFR, and the results are similar to Eq. 5 from (Shipley et al., 2016). However, there is no clear difference for the lower and fainter galaxies at redshift 1 compared to previous literature.
5 Conclusions
We utilise the JWST MIRI multi-wavelength photometry and the CANDELS EGS survey to select less luminous infrared galaxies that display prominent MIR PAHs beyond the reach of previous IR telescopes. We discover 10 PAH luminous galaxies out of a sample of 155 galaxies in the two CEERS fields with . We perform SED fitting on these galaxies using CIGALE models and 21 broad-band photometry from optical to mid-infrared. All of them have a good SED fitting result with a reduced chi-square () < 6. These galaxies are located at z 1, and four of them are < 1011 . All the properties of the selected PAH galaxies suggest that they are normal star-forming galaxies, rather than U/LIRGs. Our findings are summarised below.
-
•
PAH galaxies we selected at redshift 1 in Table 3 have infrared luminosity lower than < 1012. JWST provides us with the opportunity to investigate faint/normal PAH galaxies, rather than ULIRGs/LIRGs at z1.
-
•
The selected PAH galaxies fall into the star-forming regions according to criteria from Kirkpatrick et al. (2017) in the - colour space.
-
•
The selected PAH galaxies lie on the SF main sequence at z 1, with a stark contrast to ULIRGs, which often lie above the main sequence.
-
•
The versus in Fig. 8 shows a consistent relation with the known work for ULIRGs. This may indicate that the redshift and luminosity do not impact the PAH luminosity and strength. However, it is important to use a statistical sample to make the conclusion.
As we have shown a glimpse, the JWST has opened a new window to investigate faint/normal PAH galaxies at z 1. With more JWST observations in the near future, the nature of PAH emissions in normal star-forming galaxies will be revealed further.
Acknowledgements
The authors express their gratitude to the anonymous referee for providing numerous constructive comments that have significantly enhanced the quality of this paper. TG acknowledges the support of the National Science and Technology Council of Taiwan through grants 108-2628-M-007-004-MY3, 111-2112-M-007 -021. and 112-2112-M-007 -013, and 112-2123-M-001 -004. TH acknowledges the support of the National Science and Technology Council of Taiwan through grants 110-2112-M-005-013-MY3, 110-2112-M-007-034-, and 112-2123-M-001 -004 -. SH acknowledges the support of The Australian Research Council Centre of Excellence for Gravitational Wave Discovery (OzGrav) and the Australian Research Council Centre of Excellence for All Sky Astrophysics in 3 Dimensions (ASTRO 3D), through project number CE17010000 and CE170100013, respectively. This work used high-performance computing facilities operated by the Center for Informatics and Computation in Astronomy (CICA) at National Tsing Hua University. This equipment was funded by the Ministry of Education of Taiwan, the National Science and Technology Council of Taiwan, and National Tsing Hua University.
Data Availability
Early Release Observations obtained by JWST MIRI are publicly available at https://www.stsci.edu/jwst/science-execution/approved-programs/webb-first-image-observations.
References
- Armus et al. (2020) Armus L., Charmandaris V., Soifer B. T., 2020, Nature Astronomy, 4, 467
- Ashby et al. (2015) Ashby M. L. N., et al., 2015, The Astrophysical Journal Supplement Series, 218, 33
- Bielby, R. et al. (2012) Bielby, R. et al., 2012, A&A, 545, A23
- Boquien et al. (2019) Boquien M., Burgarella D., Roehlly Y., Buat V., Ciesla L., Corre D., Inoue A. K., Salas H., 2019, A&A, 622, A103
- Brammer et al. (2012) Brammer G. B., et al., 2012, The Astrophysical Journal Supplement Series, 200, 13
- Bruzual & Charlot (2003) Bruzual G., Charlot S., 2003, MNRAS, 344, 1000
- Buat et al. (2018) Buat V., Boquien M., Małek K., Corre D., Salas H., Roehlly Y., Shirley R., Efstathiou A., 2018, A&A, 619, A135
- Candian et al. (2018) Candian A., Zhen J., Tielens A. G. G. M., 2018, Physics Today, 71, 38
- Charlot & Fall (2000) Charlot S., Fall S. M., 2000, ApJ, 539, 718
- Chastenet et al. (2023a) Chastenet J., et al., 2023a, The Astrophysical Journal Letters, 944, L11
- Chastenet et al. (2023b) Chastenet J., et al., 2023b, The Astrophysical Journal Letters, 944, L12
- Desai et al. (2007) Desai V., et al., 2007, ApJ, 669, 810
- Draine et al. (2014) Draine B. T., et al., 2014, ApJ, 780, 172
- Elbaz et al. (2005) Elbaz D., Le Floc’h E., Dole H., Marcillac D., 2005, A&A, 434, L1
- Elbaz et al. (2007) Elbaz D., et al., 2007, A&A, 468, 33
- Elbaz et al. (2011) Elbaz D., et al., 2011, A&A, 533, A119
- Falstad et al. (2021) Falstad N., et al., 2021, A&A, 649, A105
- Finkelstein et al. (2017) Finkelstein S. L., et al., 2017, The Cosmic Evolution Early Release Science (CEERS) Survey, JWST Proposal ID 1345. Cycle 0 Early Release Science
- Fritz et al. (2006) Fritz J., Franceschini A., Hatziminaoglou E., 2006, MNRAS, 366, 767
- García-Bernete et al. (2022a) García-Bernete I., Rigopoulou D., Alonso-Herrero A., Pereira-Santaella M., Roche P. F., Kerkeni B., 2022a, MNRAS, 509, 4256
- García-Bernete et al. (2022b) García-Bernete I., Rigopoulou D., Aalto S., Spoon H. W. W., Hernán-Caballero A., Efstathiou A., Roche P. F., König S., 2022b, A&A, 663, A46
- García-Bernete et al. (2022c) García-Bernete I., et al., 2022c, A&A, 666, L5
- Gardner et al. (2006) Gardner J. P., et al., 2006, Space Sci. Rev., 123, 485
- Gardner et al. (2023) Gardner J. P., et al., 2023, Publications of the Astronomical Society of the Pacific, 135, 068001
- Gordon et al. (2023) Gordon K. D., Clayton G. C., Decleir M., Fitzpatrick E. L., Massa D., Misselt K. A., Tollerud E. J., 2023, ApJ, 950, 86
- Goto et al. (2011) Goto T., et al., 2011, MNRAS, 410, 573
- Gwyn (2012) Gwyn S. D. J., 2012, AJ, 143, 38
- Houck et al. (2007) Houck J. R., Weedman D. W., Floc’h E. L., Hao L., 2007, The Astrophysical Journal, 671, 323
- Hsiao et al. (2023a) Hsiao T. Y.-Y., et al., 2023a, arXiv e-prints, p. arXiv:2305.03042
- Hsiao et al. (2023b) Hsiao T. Y.-Y., et al., 2023b, ApJ, 949, L34
- Huang et al. (2023) Huang J. S., et al., 2023, ApJ, 949, 83
- Hummer & Storey (1987) Hummer D. G., Storey P. J., 1987, Monthly Notices of the Royal Astronomical Society, 224, 801
- Kalirai (2018) Kalirai J., 2018, Contemporary Physics, 59, 251
- Kennicutt (1998) Kennicutt Robert C. J., 1998, ARA&A, 36, 189
- Kim et al. (2019) Kim S. J., et al., 2019, PASJ, 71, 11
- Kirkpatrick et al. (2015) Kirkpatrick A., Pope A., Sajina A., Roebuck E., Yan L., Armus L., Díaz-Santos T., Stierwalt S., 2015, The Astrophysical Journal, 814, 9
- Kirkpatrick et al. (2017) Kirkpatrick A., et al., 2017, The Astrophysical Journal, 849, 111
- Koekemoer et al. (2011) Koekemoer A. M., et al., 2011, The Astrophysical Journal Supplement Series, 197, 36
- Kovács et al. (2019) Kovács T. O., Burgarella D., Kaneda H., Molnár D. C., Oyabu S., Pinter S., Toth L. V., 2019, PASJ, 71, 27
- Kwok (2022) Kwok S., 2022, Ap&SS, 367, 16
- Li (2020) Li A., 2020, Nature Astronomy, 4, 339
- Ling et al. (2022) Ling C.-T., et al., 2022, Monthly Notices of the Royal Astronomical Society, 517, 853
- Lo Faro et al. (2017) Lo Faro B., Buat V., Roehlly Y., Alvarez-Marquez J., Burgarella D., Silva L., Efstathiou A., 2017, Monthly Notices of the Royal Astronomical Society, 472, 1372
- Malek, K. et al. (2018) Malek, K. et al., 2018, A&A, 620, A50
- McElwain et al. (2023) McElwain M. W., et al., 2023, Publications of the Astronomical Society of the Pacific, 135, 058001
- Pearson, W. J. et al. (2018) Pearson, W. J. et al., 2018, A&A, 615, A146
- Peeters et al. (2003) Peeters E., Tielens A. G. G. M., Allamandola L. J., Bauschlicher C. W., Boogert A. C. A., Hayward T. L., Hudgins D. M., Sandford S. A., 2003, in Witt A. N., ed., Astrophysics of Dust. p. 42
- Peeters et al. (2006) Peeters E., Mattioda A. L., Kemper F., Hudgins D. M., Allamandola L. J., 2006, in Armus L., Reach W. T., eds, Astronomical Society of the Pacific Conference Series Vol. 357, The Spitzer Space Telescope: New Views of the Cosmos. p. 95 (arXiv:astro-ph/0507008), doi:10.48550/arXiv.astro-ph/0507008
- Polletta et al. (2007) Polletta M., et al., 2007, ApJ, 663, 81
- Pope et al. (2008) Pope A., et al., 2008, ApJ, 675, 1171
- Popesso et al. (2023) Popesso P., et al., 2023, MNRAS, 519, 1526
- Rich et al. (2023) Rich J., et al., 2023, ApJ, 944, L50
- Riechers et al. (2014) Riechers D. A., et al., 2014, ApJ, 786, 31
- Rieke et al. (2015) Rieke G. H., et al., 2015, Publications of the Astronomical Society of the Pacific, 127, 584
- Rigopoulou et al. (1999) Rigopoulou D., Spoon H. W. W., Genzel R., Lutz D., Moorwood A. F. M., Tran Q. D., 1999, AJ, 118, 2625
- Salpeter (1955) Salpeter E. E., 1955, ApJ, 121, 161
- Santos et al. (2021) Santos D. J. D., et al., 2021, MNRAS, 507, 3070
- Shipley et al. (2016) Shipley H. V., Papovich C., Rieke G. H., Brown M. J. I., Moustakas J., 2016, The Astrophysical Journal, 818, 60
- Skelton et al. (2014) Skelton R. E., et al., 2014, The Astrophysical Journal Supplement Series, 214, 24
- Spilker et al. (2023) Spilker J. S., et al., 2023, Nature, 618, 708
- Stefanon et al. (2017) Stefanon M., et al., 2017, The Astrophysical Journal Supplement Series, 229, 32
- Takagi et al. (2010) Takagi T., et al., 2010, A&A, 514, A5
- Takagi et al. (2011) Takagi T., Matsuhara H., Wada T., Ohyama Y., 2011, Proceedings of the International Astronomical Union, 7, 456–459
- Tielens (2008) Tielens A. G. G. M., 2008, ARA&A, 46, 289
- Wang et al. (2020) Wang T.-W., et al., 2020, MNRAS, 499, 4068
- Weedman & Houck (2008) Weedman D. W., Houck J. R., 2008, The Astrophysical Journal, 686, 127
- Whitaker et al. (2012) Whitaker K. E., van Dokkum P. G., Brammer G., Franx M., 2012, The Astrophysical Journal Letters, 754, L29
- Wright et al. (2023) Wright G. S., et al., 2023, Publications of the Astronomical Society of the Pacific, 135, 048003
- Wu et al. (2023) Wu C. K. W., et al., 2023, MNRAS, 523, 5187
Appendix A SED result
In Sec.3, we present the SED fitting result in Fig. 3. We present other SED fit results in 10-20. In Table 4, we present six photometric data from JWST MIRI observation.


| ID | Name in CANDELS_EGS | F770W | F1000W | F1280W | F1500W | F1800W | F2100W | ||||||
|---|---|---|---|---|---|---|---|---|---|---|---|---|---|
| 59 | CANDELS_EGS_F160W_J142040.3+530306.6 | 3.45 | 0.30 | 3.10 | 0.33 | 23.65 | 2.88 | 37.55 | 3.92 | 31.14 | 4.39 | 14.41 | 1.94 |
| 64 | CANDELS_EGS_F160W_J142037.9+530249.5 | 1.20 | 0.11 | 0.74 | 0.09 | 3.46 | 0.43 | 7.20 | 0.76 | 5.97 | 0.91 | 10.12 | 1.49 |
| 66 | CANDELS_EGS_F160W_J142038.3+530254.9 | 11.93 | 1.03 | 10.00 | 1.05 | 50.01 | 6.08 | 118.25 | 12.33 | 99.52 | 14.00 | 15.86 | 2.10 |
| 72 | CANDELS_EGS_F160W_J142038.5+530306.1 | 2.93 | 0.25 | 2.36 | 0.25 | 13.92 | 1.69 | 28.60 | 2.98 | 29.40 | 4.15 | 7.39 | 1.23 |
| 113 | CANDELS_EGS_F160W_J142039.1+530351.7 | 4.70 | 0.41 | 4.82 | 0.51 | 13.58 | 1.65 | 36.80 | 3.84 | 211.84 | 29.79 | 57.72 | 7.08 |
| 136 | CANDELS_EGS_F160W_J142034.8+530329.6 | 7.93 | 0.69 | 10.09 | 1.06 | 28.72 | 3.49 | 78.93 | 8.23 | 146.53 | 20.61 | 33.05 | 4.11 |
| 178 | CANDELS_EGS_F160W_J142022.8+525859.5 | 8.14 | 0.70 | 6.70 | 0.70 | 20.89 | 2.54 | 44.31 | 4.62 | 94.34 | 13.27 | 28.74 | 3.60 |
| 187 | CANDELS_EGS_F160W_J142018.2+525825.4 | 7.38 | 0.64 | 6.38 | 0.67 | 18.66 | 2.27 | 48.55 | 5.06 | 108.60 | 15.27 | 30.71 | 3.84 |
| 218 | CANDELS_EGS_F160W_J142020.3+525925.1 | 2.49 | 0.22 | 1.67 | 0.18 | 10.17 | 1.24 | 19.46 | 2.03 | 16.74 | 2.38 | 3.56 | 0.96 |
| 225 | CANDELS_EGS_F160W_J142016.5+525859.9 | 1.02 | 0.09 | 0.87 | 0.10 | 4.50 | 0.56 | 10.22 | 1.08 | 7.00 | 1.04 | 14.32 | 1.93 |
| 145 | CANDELS_EGS_F160W_J142033.6+530323.4 | 1.23 | 0.11 | 1.20 | 0.13 | 7.49 | 0.91 | 9.57 | 1.01 | 3.88 | 0.64 | 3.68 | 0.95 |
| 250 | CANDELS_EGS_F160W_J142017.0+525938.8 | 0.69 | 0.06 | 3.98 | 0.42 | 3.99 | 0.49 | 3.24 | 0.37 | 3.64 | 0.61 | 5.97 | 1.10 |