- MIMO
- multiple-input, multiple-output
- AWGN
- additive white Gaussian noise
- CU
- central unit
- KPI
- key performance indicator
- KPIs
- key performance indicators
- D2D
- device-to-device
- PAPR
- peak-to-average power ratio
- ISAC
- integrated sensing and communication
- DFRC
- dual-functional radar and communication
- AoA
- angle of arrival
- AoAs
- angles of arrival
- ToA
- time of arrival
- ToAs
- times of arrival
- CFO
- carrier frequency offset
- STO
- sampling time offset
- RF
- radio frequency
- URLLC
- ultra-reliable low latency communications
- mMTC
- massive machine type communications
- QCQP
- quadratic constrained quadratic programming
- BnB
- branch and bound
- SER
- symbol error rate
- LFM
- linear frequency modulation
- BS
- base station
- UE
- user equipment
- DL
- deep learning
- CS
- compressed sensing
- PR
- passive radar
- PRs
- passive radars
- LMS
- least mean squares
- NLMS
- normalized least mean squares
- RIS
- reconfigurable intelligent surface
- RISs
- reconfigurable intelligent surfaces
- IRS
- intelligent reflecting surface
- IRSs
- intelligent reflecting surfaces
- LISA
- large intelligent surface/antennas
- LISs
- large intelligent surfaces
- OFDM
- orthogonal frequency-division multiplexing
- EM
- electromagnetic
- MSE
- mean squared error
- SNR
- signal-to-noise ratio
- SRP
- successful recovery probability
- CDF
- cumulative distribution function
- ULA
- uniform linear array
- RSS
- received signal strength
- LoS
- line of sight
- AoD
- angle of departure
- AP
- access point
- ML
- maximum likelihood
- FIM
- Fisher information matrix
- ZC
- Zadoff-Chu
- CAZAC
- constant amplitude zero autocorrelation
- DAC
- digital to analog converter
- ADC
- analog to digital converter
- UE
- user equipment
- UEs
- user equipments
RIS-Enabled Integrated Sensing and Communication for 6G Systems
Abstract
The following paper proposes a new target localization system design using an architecture based on reconfigurable intelligent surfaces (RISs) and passive radars (PRs) for integrated sensing and communications systems. The preamble of the communication signal is exploited in order to perform target sensing tasks, which involve detection and localization. The RIS in this case can aid the PR in sensing targets that are otherwise not seen by the PR itself, due to the many obstacles encountered within the propagation channel. Therefore, this work proposes a localization algorithm tailored for the integrated sensing and communications RIS-aided architecture, which is capable of uniquely positioning targets within the scene. The algorithm is capable of detecting the number of targets along with estimating the position of targets via angles and times of arrival. Our simulation results demonstrate the performance of the localization method in terms of different localization and detection metrics and for increasing RIS sizes.
Index Terms:
integrated sensing and communications (ISAC), reconfigurable intelligent surfaces (RIS), 6G, localization, passive radarI Introduction
ISAC has been proposed to be one of the key and challenging pillars for 6G [1], where both information for sensing and communications can be carried by the same waveform. It is reasonable to believe that following the mass potential deployment of technologies such as haptic medicine, extended reality, holographic teleportation, terahertz bands, and Internet of things devices, a bandwidth-hungry world will be the main concern for 6G researchers and engineers [2]. ISAC, fortunately, allows for shared spectrum as well as improved efficiency in both processing power and hardware, which is one of the main ways to alleviate this limitation imposed on bandwidth. Conventionally, we can distinguish between three categories of ISAC: joint-design [3], which compromises both sensing and communications; radar-centric ISAC, which focuses on carrying information onto radar signals; while the last one, communication-centric ISAC, the focus of this work, which aims at performing sensing using communication waveforms. Moreover, existing and widely used waveforms can also save costs on equipment, installation, and maintenance.
Fortunately in communications, the preamble is such a widely used deterministic sequence. Hence, although they are intended to identify the cell identity of a base station (BS) and synchronize the user equipments (UEs) in the cell with the BS, they are also strong candidates for target localization. It is also worth noticing that to perform target localization, having line of sight (LoS) between the targets and the passive radar (PR) is optimal but not necessarily guaranteed. However, reconfigurable intelligent surfaces (RISs), [4], which are large surfaces that can self-readjust its reflection properties and hence the channel properties as a whole, have drawn considerable attention in the past few years. By easily spreading over a large area, paths with LoS are more easily guaranteed.
There are myriad pieces of research that investigate RIS-assisted ISAC for sensing. However, some work such as [5] designs the reflection matrices, i.e. the settings of the phase shifters on the RIS, through channel estimation or user equipment (UE) feedback. Moreover, in works such as [6], the separation of paths from different targets is done by precoding instead of exploiting the spatial filtering properties of the RIS. In [7], the scheme depends on active elements which lead to increased power, noise, and complexity. In addition, in [8] and [9], only one-dimensional estimation of the angle of arrivals is done.
In this paper, we introduce a novel reconfigurable intelligent surface (RIS)-enabled system model employing a PR, as well as an access point (AP) dedicated to communication-only tasks. The model accommodates a passive RIS covering the entire view of the environment, which has the benefit of sensing reflections of the targets, then re-directing it back to the PR. Indeed, due to obstacles, such as buildings, there may not be a LoS component between the target and the PR. Furthermore, we propose a novel target localization algorithm for joint time of arrival (ToA) and AoA estimation of the targets, even when the number of targets is unknown, and even when no LoS exists between the PR and the target. The algorithm is also able to discriminate between targets located at the same direction, relative to the RIS. Numerical simulations show that under very low signal-to-noise ratio (SNR), we can achieve a mean absolute error of about 30 cm in a 1000 m 1000 m cell using 64 RIS elements.
The paper is organized in the following manner. Section II describes the system model, including the transmitted signal, the channel and received signal, the beamforming of the PR, and mapping the AoA-ToA pairs to Cartesian coordinates. Section III describes the localization scheme for finding the AoA and ToA for each target through a step-by-step explanation. Section IV describes the environment, test metrics, and test parameters used in simulating the system and outlines the simulation results. Section V outlines the conclusions of this work and proposes potential future directions.
Notation: Upper-case and lower-case boldface letters denote matrices and vectors, respectively. , , and represent the transpose, the conjugate and the transpose-conjugate operators. Furthermore, the set of all complex-valued matrices is . The entry of vector is denoted as . To index the entry of , we use . Its row and column are indexed as and , respectively. Moreover, denotes an angle. Also, is used to denote the set . The diagonal operator is . The Kronecker product is . An all-ones vector of size is denoted as . Also, indicates finding the arguments that produce the local maxima of the function subject to constraint .
II System Model
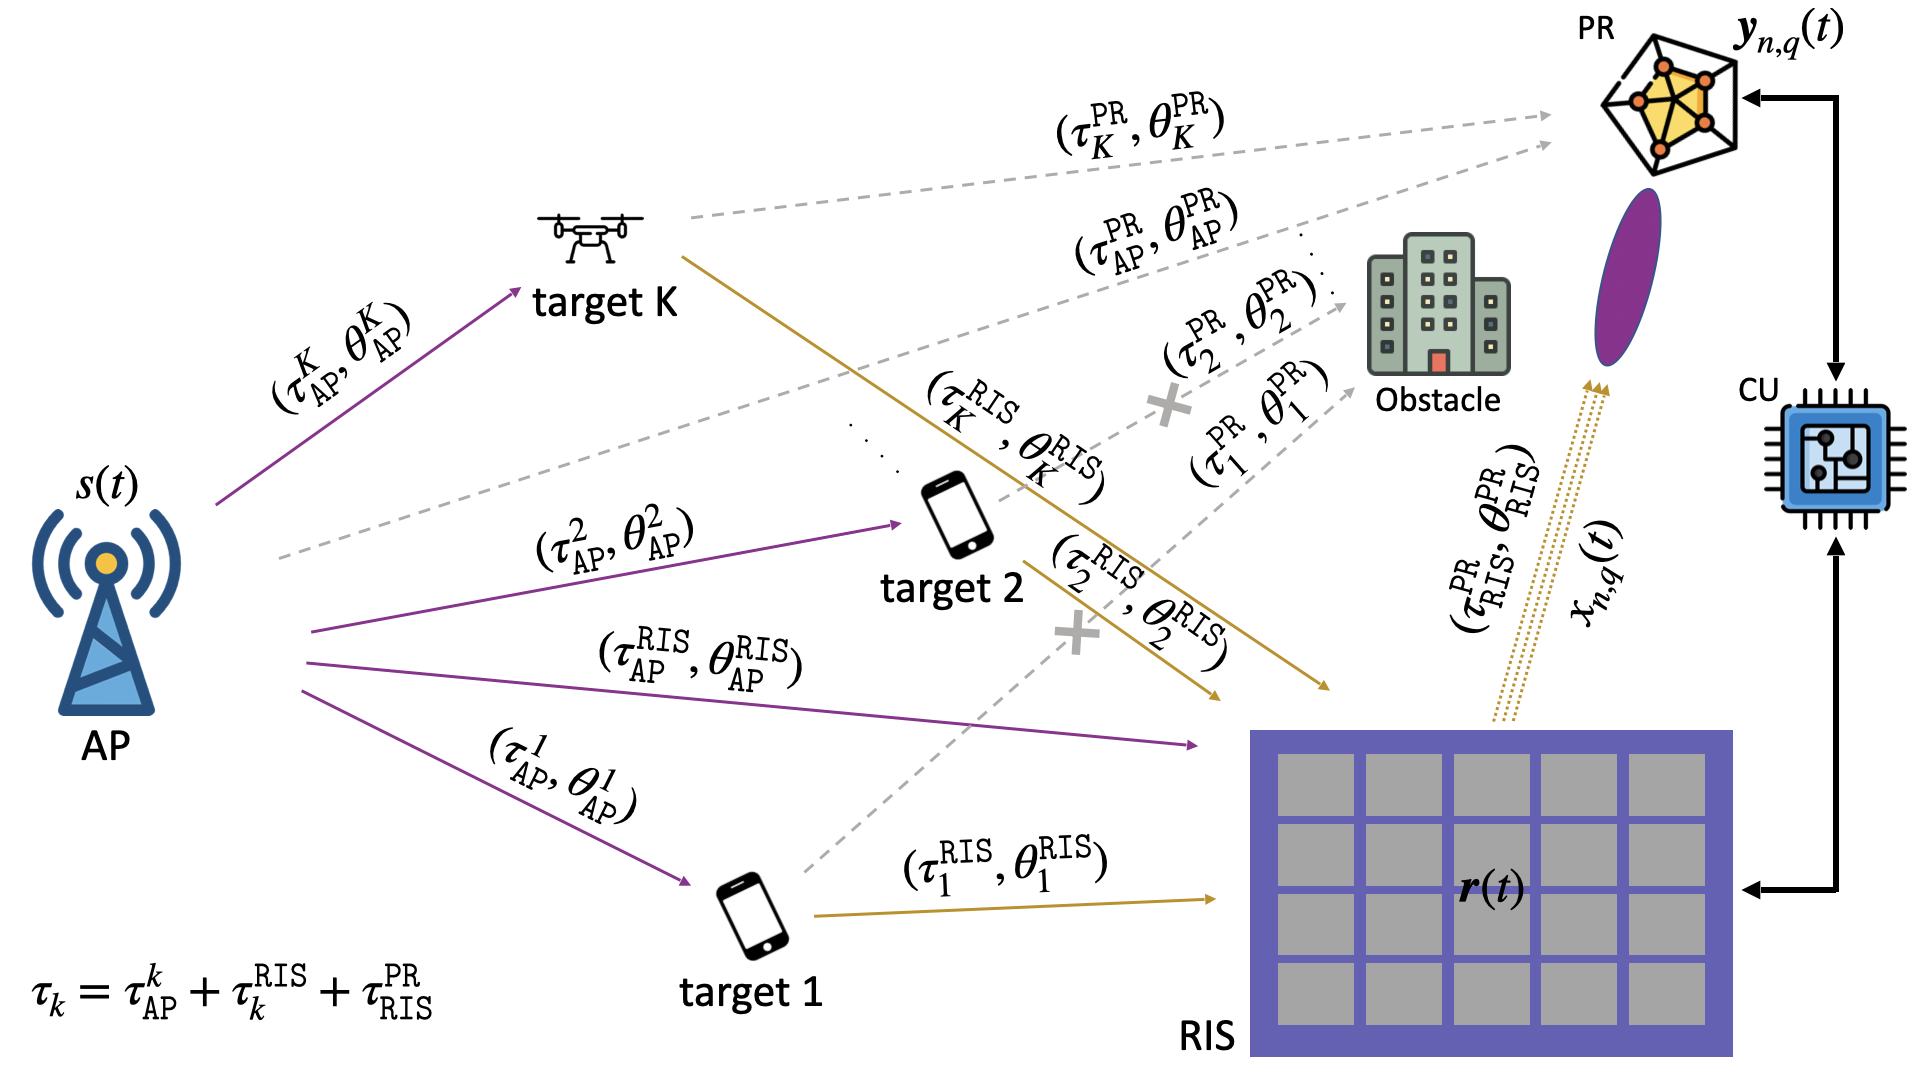
We consider a scenario where the transmitted signal from the AP hits targets, where is unknown. We focus on the part that bounces off from the targets toward the RIS, as well as the direct path from the AP to the RIS. Thanks to the reconfigurable behavior of the RIS, the received signal at the RIS can be beamformed towards the PR. After the PR properly beamformers towards the RIS, it estimates the angles of arrival (AoAs) () and times of arrival (ToAs) () based on the received signal from the RIS. Then, the two-dimensional Cartesian coordinates of each target , , are determined from the two sensing parameters. We do not rely on the direct LoS path between the AP and the PR and those between the targets and the PR. For those paths, there exists a higher possibility that LoS is not guaranteed, especially in dense environments such as cities or forests. On the other hand, the paths that pass through the RIS are less subject to blockage since RISs can easily span a large area such as the facades of buildings, [10].
In this work, the system considers a rectangular cell with a specified width and height. One AP operating with existing communication standards such as 5G-NR, one PR with antenna elements, and one RIS with elements are specified with known - and - Cartesian coordinates , respectively. In Section II-B, we characterize the location of different nodes in terms of their AoA and ToA and in Section II-C, we map these sensing parameters to positions . To this end, our system model is depicted in Fig. 1. We note that the RIS and PR can be connected to a central unit (CU), in which all the computations and adjustments of RIS phases are computed and controlled.
II-A Transmitted Signal
Among the deterministic communication preambles, Zadoff-Chu (ZC) sequences are used in synchronization signals in 4G LTE and 5G NR, and they are repeated twice for each communication frame[11]. They are known for their constant amplitude zero autocorrelation (CAZAC) property [12]. The constant amplitude property ensures that ZC sequences are less prone to distortion when passed through elements, such as amplifiers with nonlinear gain. At the same time, the zero cyclic auto-correlation indicates that when a ZC sequence is correlated with its cyclically shifted version, the output remains below noise level except for the timestamp of the cyclic shift compared to the original sequence. Moreover, since covariance is a bi-linear operation, multiple peaks can be resolved for the sum of different cyclically shifted versions of the same ZC sequence. The transmitted signal hence takes the form of the ZC sequence defined as below
| (1) |
where is the length of the sequence, is the root index and should be relatively prime with , and is the discrete time index, [12]. During a supposed communication event, ZC sequences with the same specified length and root index are repeatedly transmitted from the AP.
II-B Channel and Received Signal
For simplicity, suppose that the signal is generated from a ZC sequence using an ideal digital to analog converter (DAC), the signal is transmitted from the AP without beamforming, an -element RIS is used, and there are targets, the received signal at the RIS is
| (2) |
where is the steering matrix resulting from the steering vectors of each path between the targets and the RIS antennas manifold, namely
| (3) |
where is the steering vector of the -element RIS, and is the AoA at from , where and are either the AP, RIS, PR, or targets. On the other hand, contains the delayed and scaled versions of , where its entry is
| (4) |
where is the channel gain of the path via target . Also, is the delay from node to . Note that and are either the AP, RIS, PR, or targets. The reflected signal from RIS is
| (5) |
where is the phase shifts due to the reflecting elements of the RIS at the epoch within the phase and is the angle of departure (AoD) from RIS to PR. We define an epoch as a collection of samples of in (2), and we define a phase as a collection of epochs. The received signal at the PR at epoch and phase is
| (6) |
where . The first three terms correspond to the information reflected from the RIS, direct LoS propagation from the AP, and bounce-off from the targets. The last term is additive white Gaussian noise (AWGN). The terms and are binary random variables that equal 0 when the LoS is blocked and 1 otherwise. Sampling at time instances, we have the sampled data matrix
| (7) |
Moreover, the PR collects in (7) and beamforms as
| (8) |
where is a function of , the reflection matrix of the RIS given the time slot , where is the number of estimated directions. The details of how changes is further outlined in Section III-C. Then, from equation (6), the useful part of the received signal looking at the direction of can be represented as whose power can be maximized, under a norm-constraint, by adjusting [13]
| (9) |
II-C Mapping to
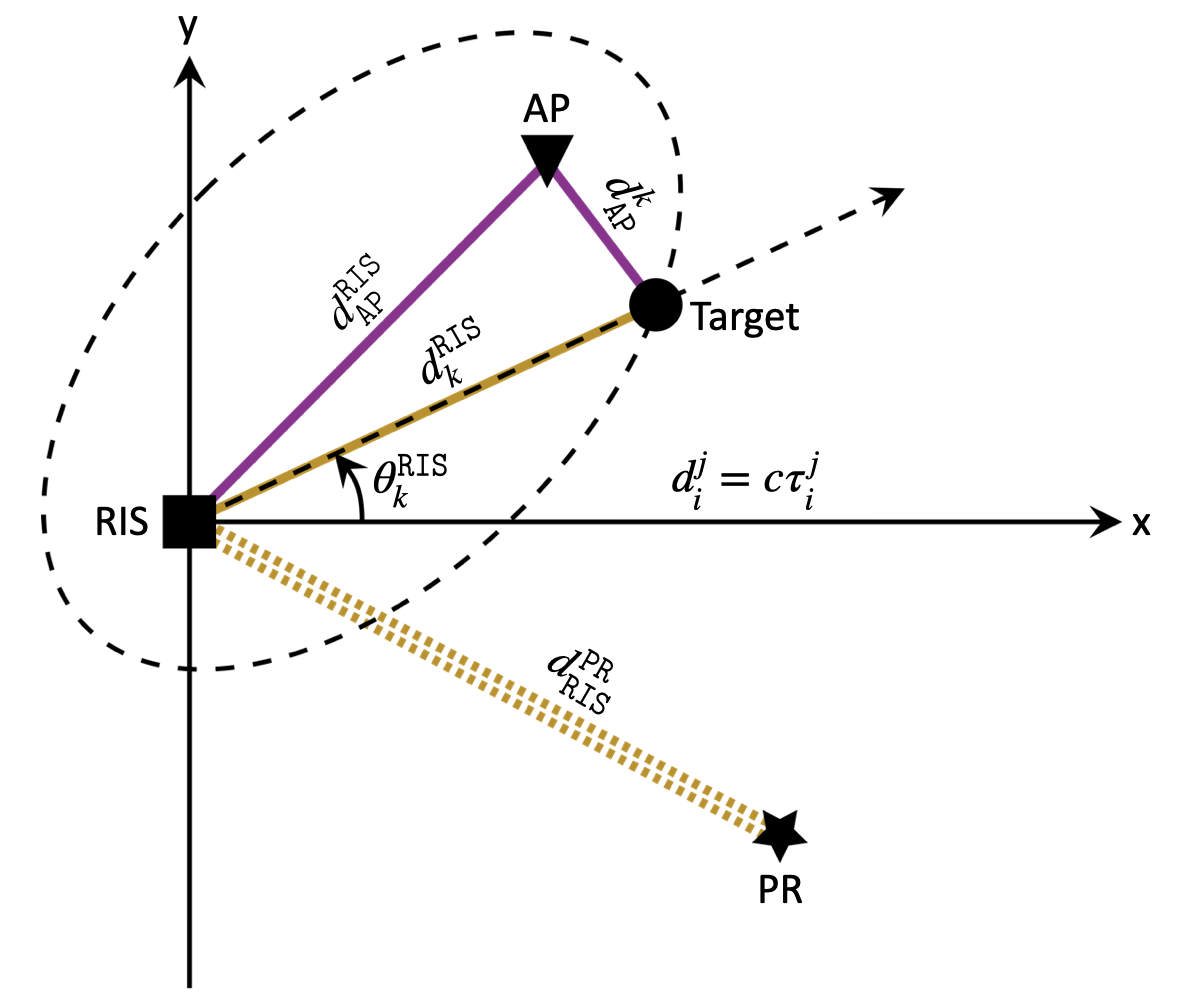
Once and are determined, the problem of finding is equivalent to finding an intersection of a secant line through an ellipse given that the target is not in the LoS between the AP and RIS. The scenario is depicted in Fig. 2. First, it is easy to see that
| (10) |
where and are either the AP, RIS, PR, or targets, is the distance between and , and is the speed of light, the propagation velocity of the signal. Since the positions of the AP, RIS, and PR are known, and can be found by the Pythagorean theorem . As we now know , , and , we can conclude that the target lies on the ellipse whose foci are the AP and the RIS, whose semi-major axis is and whose semi-minor axis is . Additionally, we can easily see that the target also lies on the line in the direction . Next, we first consider the case when the ellipse is not tilted and centered at the origin. Here, the line can be written as , where and are the slope and y-intercept, respectively, and the ellipse can be written in its standard equation . Plugging the ellipse relation into the line one, we can solve the quadratic equation
| (11) |
to deduce the coordinates under this reference frame. Performing a rotation by and translation via , the center of the ellipse, we can recover the absolute Cartesian coordinates. Usually, there exist two solutions for this kind of problem. Nonetheless, since we specify that , the solution on the left side of the RIS can be easily eliminated and is hence the other one. Moreover, it is obvious that such a map is bijective, meaning that the one pair corresponds uniquely to a and vice versa. We can now state our problem: Based on , estimate the target locations , where is unknown.
III Target Localization
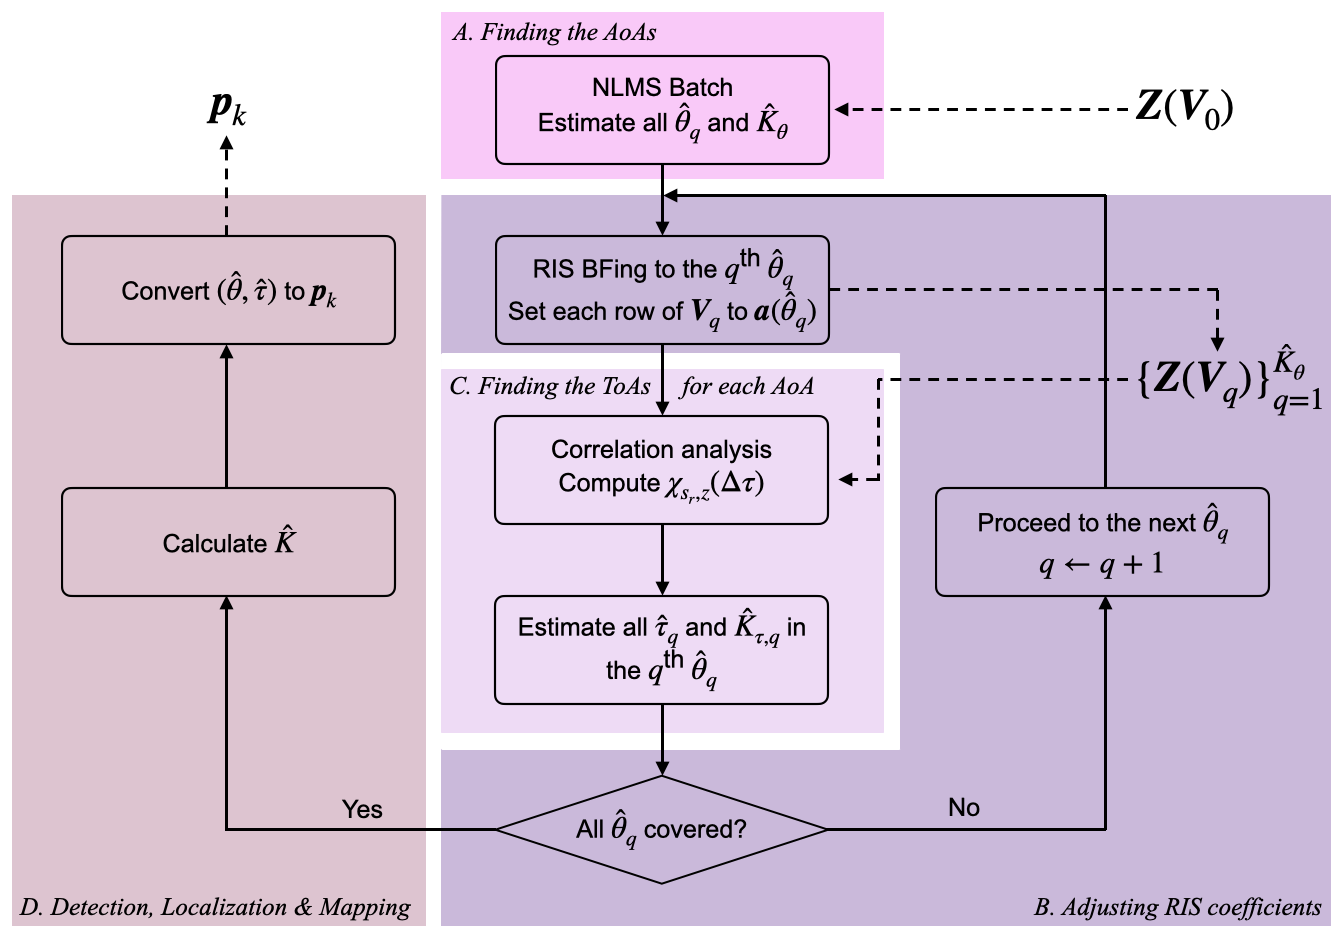
The target localization process is illustrated in Fig. 3. The AoAs are estimated through an NLMS batch algorithm [13], and the ToAs are derived from analyzing the cross-correlation between the transmitted and received sequences. To associate each target with a unique AoA-ToA pair, the ToA analysis is performed for each estimated AoA. This is accomplished by changing the RIS reflection properties. For this reason, the initial phase, i.e. , performs AoA-only estimation. Then, the phase performs ToA estimation per estimated AoA.
III-A Finding the AoAs (Phase )
Initially, our goal is to maximize the power collected from the targets at the RIS and minimize the power of all other directions, which in this case is due to AP. We optimize for the aforementioned criterion while maintaining the constraint of unity gain () for the passive RIS. The solution of the unconstrained version of the optimization problem from our work [13] is
| (12) |
and to satisfy the constant modulus constraint, we calculate our initial RIS reflection matrix as
| (13) |
where is a random matrix drawn from a standard Gaussian distribution and . The AoAs and the number of distinct directions are then estimated111As an example, if targets are present at the same angle relative to RIS, then , otherwise . through the NLMS batch algorithm described in our previous work [13]. Note that the true value is upper-bounded by . We distinguish between two extreme cases: (i) all targets reside in the same angle , which means , and (ii) when all the AoAs are distinct, i.e. for all . In this case, . As we shall proceed, we rely on the temporal aspect of the ZC sequence in order to separate the targets in time domain.
III-B Adjusting RIS coefficients (Phase )
Using the solution given by (9), but this time at the RIS, spatial filtering towards each estimated direction is accomplished by beamforming the RIS towards that direction by changing each row of the RIS reflection matrix , to for all , i.e.
| (14) |
This allows the RIS to select targets that are located at direction so as to estimate each of their ToAs, separately.
III-C Finding the ToAs for each AoA (Phase )
Correlation Analysis
Exploiting the CAZAC property of ZC sequences and the bi-linearity of the covariance operation, we employ a correlator to deduce the ToAs. To consider all epochs, the test sequence is the average of over all rows, namely
| (15) |
where . Next, suppose that and an ideal analog to digital converter (ADC) is used so that the PR and AP are perfectly synchronized with no sampling frequency () or phase offsets, the magnitude of the discrete cross-correlation between the original and test sequences can be calculated by
| (16) |
where is the correlation shift in number of samples and is related to by a factor of . Furthermore, is a centered time-series generated simply by centering .
Estimate ToAs and Number of Targets residing in
Thanks to the association scheme, the correlator performs a correlation analysis for each estimated direction. The ToAs are determined from a peak-finding search of the normalized correlation output of that direction. We define a threshold, say , for determining if a peak qualifies as an estimated target. For the estimated direction, the ToAs can be estimated as
| (17) |
where is the normalized . The number of targets estimated in direction is hence the number of all qualifying peaks, and it is denoted as . Therefore, the targets residing in angle are . To this end, steps and are repeated until covers all directions.
III-D Detection, Localization & Mapping
Once we have all the estimated AoA/ToA pairs, we proceed to the last step, herein, in order to detect the number of targets, then perform localization by mapping their AoA/ToA pairs to a Cartesian coordinate. Regarding detection, the total number of targets is estimated by summing the number of targets in each estimated direction, namely
| (18) |
Moreover, the Cartesian coordinates of the targets can be found from the pairs through the mapping mechanism described in Section II-C.
IV Simulation Results
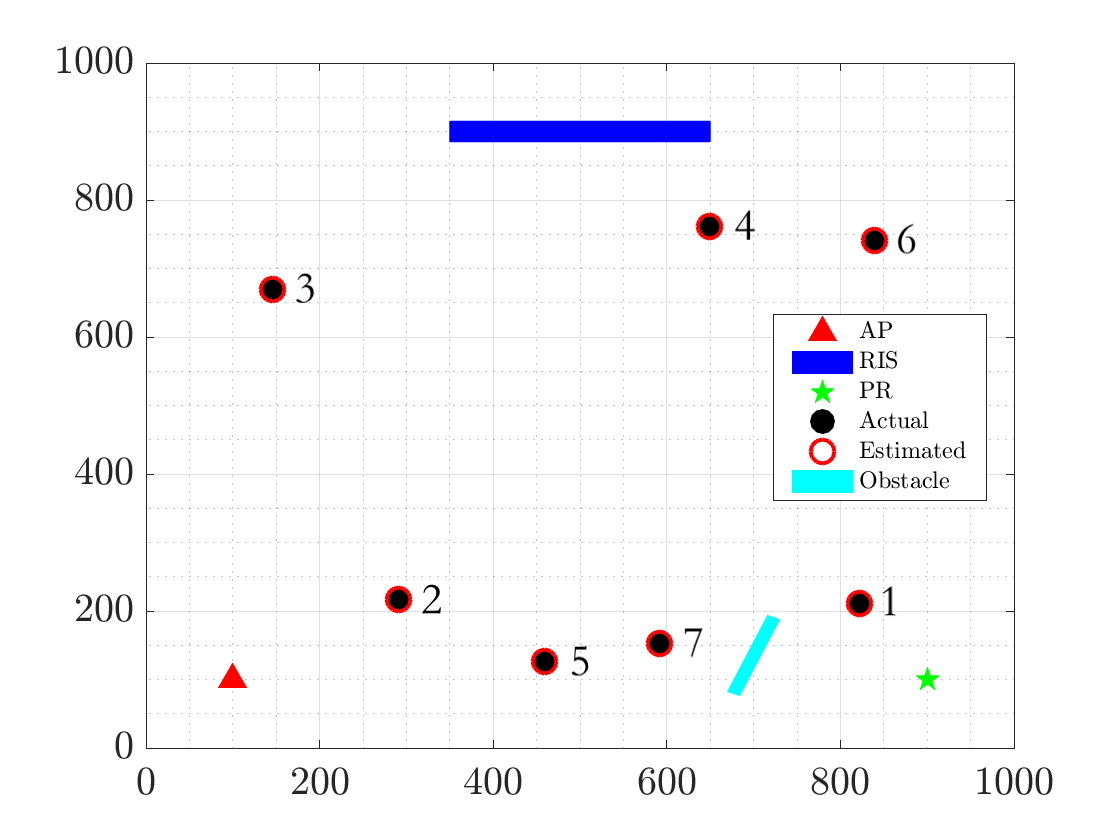
Fig. 4 depicts the wireless environment, where multiple targets (black dots) are randomly placed in a rectangular cell. The AP, RIS, and PR are placed in a way that the obstacle blocks the LoS between three targets and the PR. The number of antennas at PR is ; the used ZC index is ; and the length of the used ZC sequence is . Through exhaustive simulations, we find that the values of both ToA and AoA thresholds are .
IV-A Test Metrics
Mean Squared Error (MSE)
It is the average squared distances between the estimated targets and the corresponding actual targets. This is a factor only related to estimation. Since we only consider the targets that are actually estimated, and the estimated number of targets, , may be above or below the actual number of targets, , we introduce the factor
| (19) |
We then choose the pairs of actual and estimated targets that have the lowest distances for computation, which is
| (20) |
where is the number of Monte-Carlo simulations.
Probability of Detection,
In order to show how well our target detector performs, we study the probability of detection, which is defined as
| (21) |
Successful Recovery Probability (SRP)
It is a factor related to both detection and estimation and is defined by
| (22) |
where is the error allowed for an estimation to be counted as a successful recovery of the original target coordinates. In this cell case, we set .
IV-B MSE analysis as a function of number of RIS elements
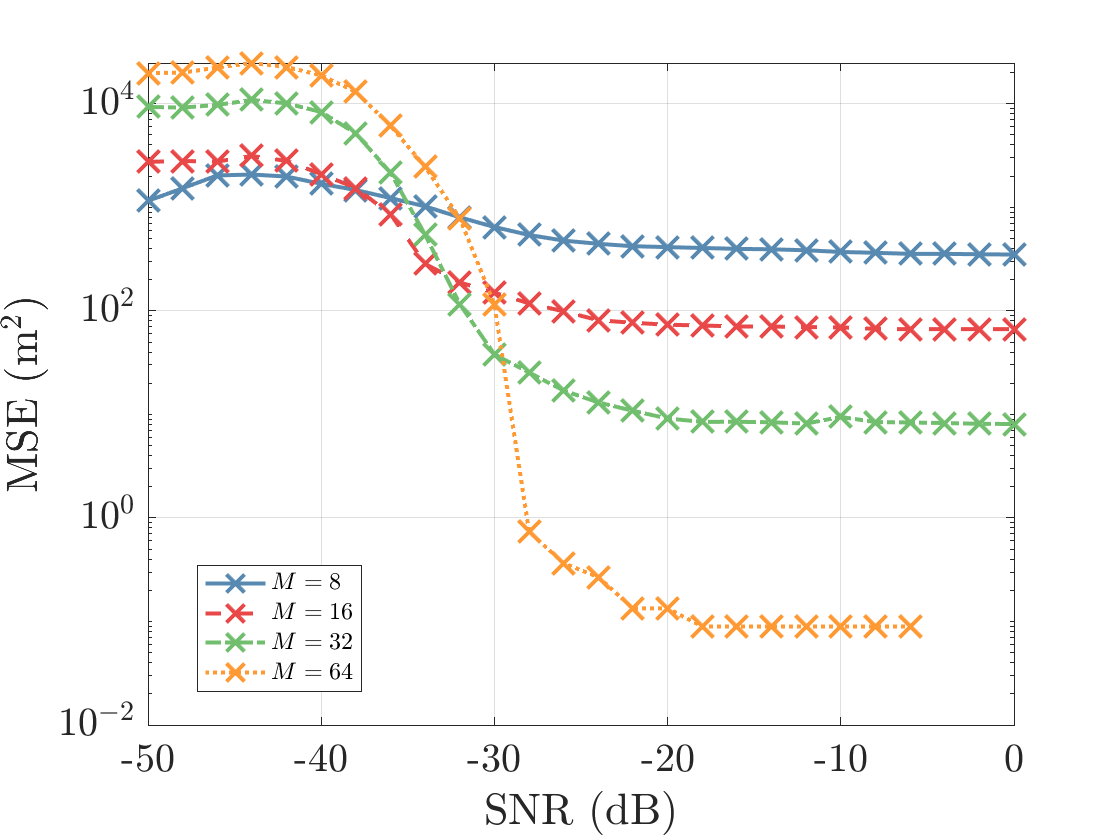
In Fig. 5, we plot the MSE performance as a function of SNR for different values of RIS elements, . For a fixed , we observe that the MSE always decays with increasing SNR. The rate of decrease is observed to be comparatively drastic between and . As we increase the number of RIS elements, we see a significant drop in MSE at . The case can achieve MSE floor of about m2, indicating a mean absolute error at about cm. In addition, at a fixed desired MSE of m2, we can see that doubling the RIS elements from to contributes to a gain of about . This means that more RIS elements improve the target location accuracy, as can be observed via MSE, as well as mean absolute error, improvements.
IV-C Probability of detection gains
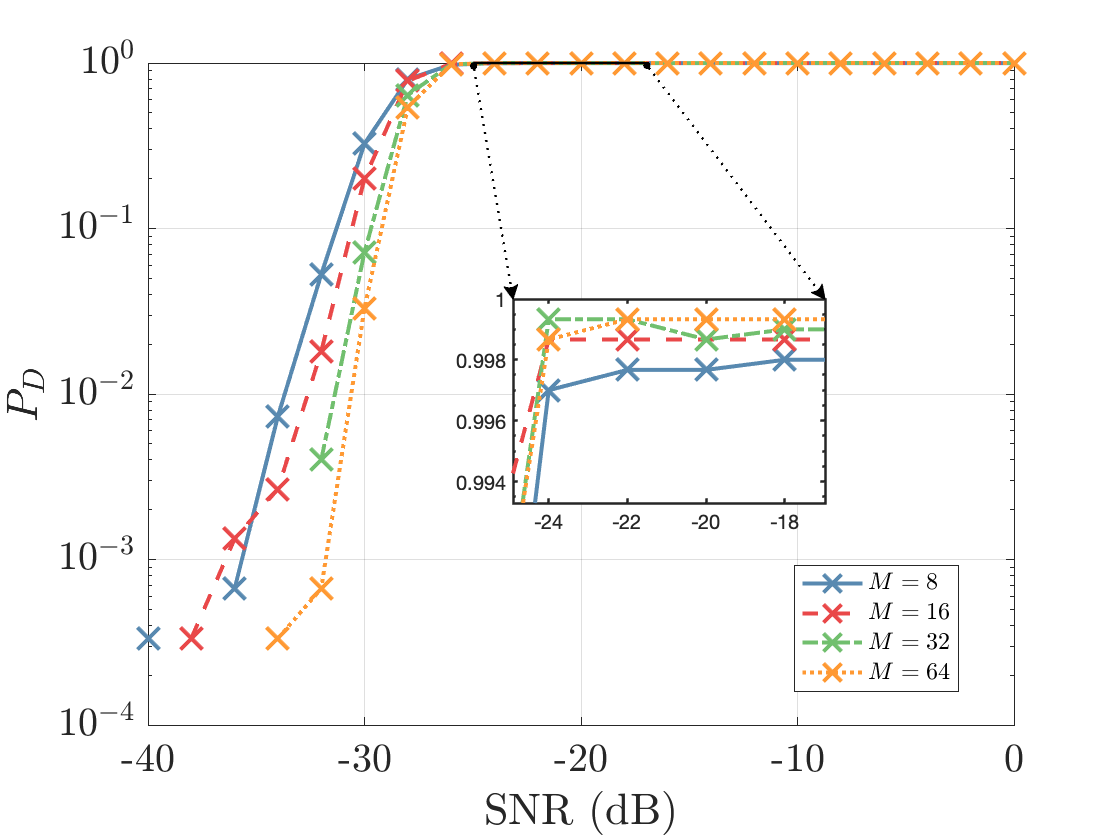
In Fig. 6, as SNR increases, the probability of detection drastically grows and approaches 1 at around . Upon trespassing this SNR, the probability of detection stabilizes around , indicating successful detection for nearly all Monte-Carlo simulations at those SNR levels. Setting a desired probability of detection level to , we can observe a gain of about , when comparing with .
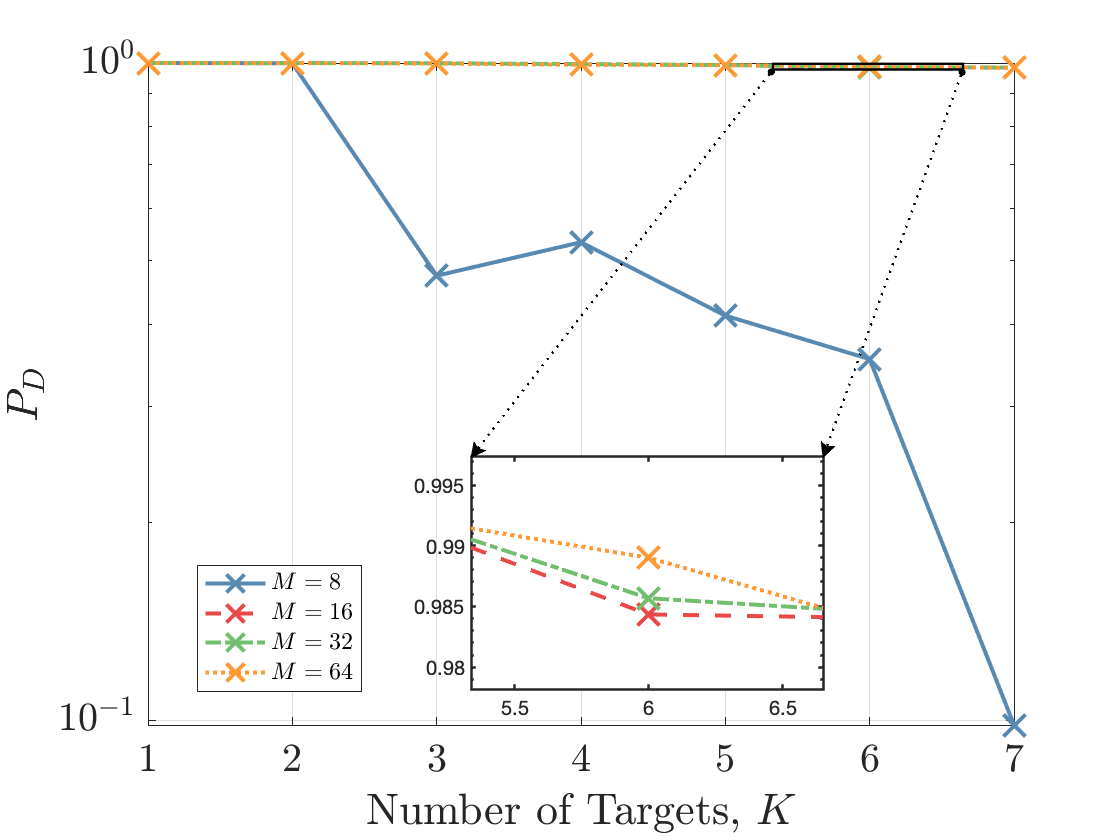
In Fig. 7, we study the detection probability as a function of the number of targets found in the scene. We observe that the probability of detection exceeds when starting from RIS elements, whereas the case can achieve this resolution only when targets. It can be concluded that the number of RIS elements is positively correlated with the detection capabilities of the overall proposed RIS-aided architecture.
IV-D SRP gains with increasing
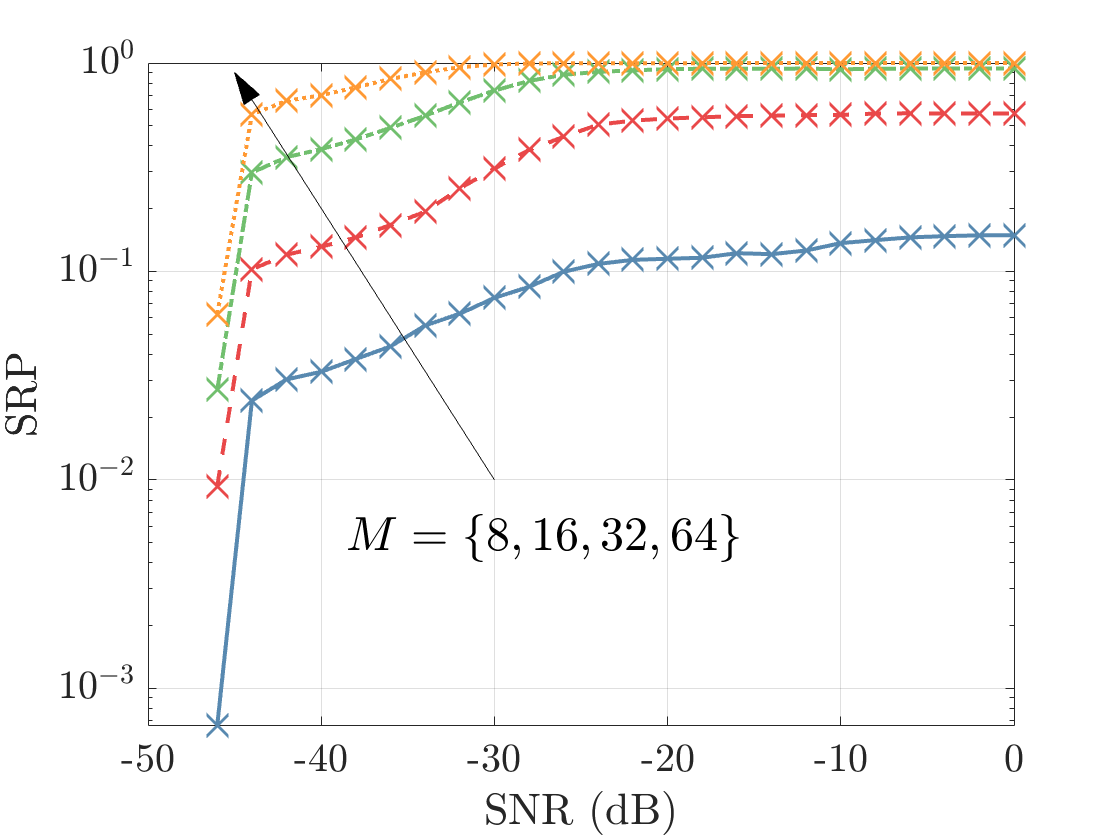
In Fig. 8, we can see the positive impact of increasing the number of RIS elements from an SRP perspective. At , the case gives SRP approaching 1, the case achieves SRP up to around , while the case has an successful recovery probability (SRP) cap at around . Moreover, for the case, the SRP is below and its trend does not have an observable ceiling. This can be explained by the fact that more RIS elements can offer better resolution capabilities and a better view of the environment so as to maximize the overall recovery probability of the system.
V Conclusions and Future Insights
In this paper, we propose a new RIS-PR based architecture for target localization in integrated sensing and communication (ISAC) for future 6G systems, which exploits already available signals used as part of a communication standard, like ZC sequences. Indeed, increasing the number of RIS elements has a favorable impact on localization accuracy, and target detection, as we can observe from the simulation results when utilizing the proposed localization method for simultaneous detection and localization. To further develop the comprehensiveness of this scheme, Doppler shift estimation can be investigated, which is interesting for target tracking applications. Moreover, more sophisticated algorithms should be aware of radio frequency impairments [14], such as carrier frequency offset and sampling time offset. Next, we consider improving the accuracy and coverage by using multiple RISs and/or APs. For instance, this prevents the inability to solve the case when the target is in the LoS between the AP and the RIS. Different scenes such as 3D environments and various channels are also considered as part of future work.
References
- [1] M. Chafii, L. Bariah, S. Muhaidat, and M. Debbah, “Twelve Scientific Challenges for 6G: Rethinking the Foundations of Communications Theory,” IEEE Communications Surveys & Tutorials, vol. 25, no. 2, pp. 868–904, 2023.
- [2] W. Saad, M. Bennis, and M. Chen, “A Vision of 6G Wireless Systems: Applications, Trends, Technologies, and Open Research Problems,” IEEE Network, vol. 34, no. 3, pp. 134–142, 2019.
- [3] A. Bazzi and M. Chafii, “On Outage-Based Beamforming Design for Dual-Functional Radar-Communication 6G Systems,” IEEE Transactions on Wireless Communications, vol. 22, no. 8, pp. 5598–5612, 2023.
- [4] M. D. Renzo, M. Debbah, D.-T. Phan-Huy, A. Zappone, M.-S. Alouini, C. Yuen, V. Sciancalepore, G. C. Alexandropoulos, J. Hoydis, H. Gacanin, J. de Rosny, A. Bounceur, G. Lerosey, and M. Fink, “Smart Radio Environments Empowered by Reconfigurable AI Meta-Surfaces: An idea whose Time has Come,” EURASIP Journal on Wireless Communications and Networking, vol. 2019, no. 1, pp. 1–20, 2019.
- [5] R. Wang, F. Xia, J. Huang, X. Wang, and Z. Fei, “CAP-Net: A Deep Learning-Based Angle Prediction Approach for ISAC-Enabled RIS-Assisted V2I Communications,” in 2022 IEEE 22nd International Conference on Communication Technology (ICCT), 2022, pp. 1255–1259.
- [6] H. Kim, A. Fascista, H. Chen, Y. Ge, G. C. Alexandropoulos, G. Seco-Granados, and H. Wymeersch, “RIS-Aided Radar Sensing and Object Detection with Single and Double Bounce Multipath,” 2022.
- [7] M. A. Haider, Y. D. Zhang, and E. Aboutanios, “ISAC system assisted by RIS with sparse active elements,” EURASIP Journal on Advanced Signal Processing, vol. 2023, no. 20, 2023.
- [8] J. Zuo, Y. Liu, C. Zhu, Y. Zou, D. Zhang, and N. Al-Dhahir, “Exploiting NOMA and RIS in Integrated Sensing and Communication,” IEEE Transactions on Vehicular Technology, pp. 1–14, 2023.
- [9] J. He, A. Fakhreddine, and G. C. Alexandropoulos, “Joint Channel and Direction Estimation for Ground-to-UAV Communications Enabled by A Simultaneous Reflecting and Sensing RIS,” 2022.
- [10] S. Kisseleff et al., “Reconfigurable Intelligent Surfaces for Smart Cities: Research Challenges and Opportunities,” IEEE Open Journal of the Communications Society, vol. 1, pp. 1781–1797, 2020.
- [11] A. Omri, M. Shaqfeh, A. Ali, and H. Alnuweiri, “Synchronization Procedure in 5G NR Systems,” IEEE Access, vol. 7, pp. 41 286–41 295, 2019.
- [12] J. G. Andrews, “A Primer on Zadoff-Chu Sequences,” arXiv preprint arXiv:2211.05702, 2023.
- [13] A. Bazzi and M. Chafii, “RIS-enabled Passive Radar towards Target Localization,” arXiv preprint arXiv:2210.11887, 2022.
- [14] ——, “On Integrated Sensing and Communication Waveforms with Tunable PAPR,” IEEE Transactions on Wireless Communications, pp. 1–1, 2023.