Gas-phase molecules in protoplanetary nebulae with the 21 m emission feature
Abstract
It has been more than 30 years since the enigmatic 21 m emission feature was first discovered in protoplanetary nebulae (PPNs). Although dozens of different dust carrier candidates have been proposed, there is as yet no widely accepted one. We present the results of molecular observations toward 21 m objects using the 10 m Submillimeter Telescope of Arizona Radio Observatory at the 1.3 mm band and the 13.7 m telescope of Purple Mountain Observatory at the 3 mm band, aiming to investigate whether the gas-phase environments of these unusual sources have some peculiarities compared to normal PPNs. We detect 31 emission lines belonging to seven different molecular species, most of which are the first detection in 21 m PPNs. The observations provide clues on the identification of the 21 m feature. We report a correlation study between the fractional abundance of gas-phase molecules and the strengths of the 21 m emission. Our study shows that given the small sample size, the 21 m feature has weak or no correlations with the gas-phase molecules. Future radio observations of high spatial and spectral resolution toward a large sample are desirable to elucidate the 21 m emission phenomena.
1 Introduction
Low- and intermediate-mass (0.8–8.0 ) stars eject material into the interstellar medium (ISM) during their evolution from the asymptotic giant branch (AGB) to the white-dwarf phase, creating circumstellar envelopes (CSEs, see, e.g., Höfner & Olofsson, 2018). CSEs can serve as a natural chemical laboratory and play a significant role on cosmic gas/dust cycle. However, we are still far from fully understanding circumstellar chemistry (see, e.g., Ziurys, 2006; Cernicharo et al., 2011). The chemical processes in the protoplanetary nebula (PPN) phase that is a transition phase from the AGB to white-dwarf stages with a timescale of about 103 yr (Herwig, 2005) are particularly unclear. A PPN consists of a post-AGB star with a effective temperature of less than K and a separated shell. The central star is not hot enough to ionize the shell, but the growing ultraviolet (UV) radiation field could process the dust and gas in PPNs and stimulate photochemistry.
Protoplanetary nebule exhibit various infrared (IR) unidentified features, among which the so-called 21 m emission feature is one of the most intriguing enigmas (Kwok, 2021). This feature was first discovered in four PPNs by Kwok et al. (1989) from the Low-Resolution Spectrometer (LRS) database. Subsequent studies of Volk et al. (1999) expanded the sample of 21 m feature objects and show that this feature has a consistent line profile from source to source and actually peaks at 20.1 m. The objects with the 21 m feature are rare, suggesting that this feature may arise from a transient molecule (Kwok et al., 1989). So far, this feature has been unambiguously detected only in 18 and 9 PPNs in the Galaxy and the Large/Small Magellanic Clouds, respectively (Cerrigone et al., 2011; Volk et al., 2011), suggesting that it must be a transient phenomenon. Accurate identification of its carrier is crucial for understanding circumstellar chemistry, but is a subject of considerable debate (see Volk et al. 2020 for a recent review).
Proposed carriers of the 21 m feature include SiS2, FemOn, TiC, thiourea, hydrogenated fullerenes, polycyclic aromatic hydrocarbons, hydrogenated amorphous carbon, nano-diamonds, etc. (see, e.g., Volk et al., 2020, and references therein). No definite consensus has been reached. Zhang et al. (2009) conducted a quantitative investigation for nine kinds of inorganic candidates, including TiC nanoclusters, fullerenes coordinated with Ti atoms, SiS2, doped-SiC, SiO2-coated SiC dust, carbon and silicon mixtures, nano FeO, Fe2O3, and Fe3O4 dust, and concluded that the cold FeO dust, which was first suggested by Posch et al. (2004), is a feasible candidate for the 21 m emission feature carrier. However, the laboratory studies of Koike et al. (2017) suggested that the IR spectra of FeO vary depending on defects and disorders and the synthesis of FeO is sensitive to surrounding conditions, disfavoring FeO as the carrier of the 21 m feature. Fullerenes have recently been discovered in circumstellar environments (Cami et al., 2010), which has renewed interest in the idea that hydrogenated fullerenes might be the 21 m feature carrier (Zhang, 2020a, b; Zhang et al., 2020). These fullerene derivatives may partly survive, be transferred into more complex compounds during the dispersion of CSEs, and finally contribute to other unidentified spectral features such as anomalous microwave emission (Iglesias-Groth, 2006) and diffuse interstellar bands (Omont, 2016). According to Mishra et al. (2016), there is a strong correlation between the mass-loss rates in the AGB phase and the flux of the 21 m feature. They proposed that its carrier has been formed in the AGB phase but is unable to be excited by sufficient UV photons until the PPN phase.
It is established that the gas-phase chemistry and the dust processes depend on the physical conditions and the evolutionary stages of CSEs. Different astronomical environments are characterized by different gas-phase molecular patterns (e.g., Cernicharo et al., 2011; Aladro et al., 2015; Jørgensen et al., 2020; Taniguchi et al., 2023). Therefore, it is instructive to statistically investigate the gas-phase molecules in 21 m sources, which could presumably provide some clues on the origin of the 21 m feature. Such studies have been rather scarce because the molecular lines in 21 m sources are typically very faint. The majority of earlier investigation were focused on CO only (e.g., Woodsworth et al. 1990; Hrivnak & Bieging 2005; Nakashima et al. 2012). Zhang (2020a) reported a line survey of the 21 m source IRAS 22272+5435 at 3 and 1.3 mm bands, which resulted in the detection of ten molecules and three isotopologues. A large sample is still required to obtain statistically meaningful results.
In this paper, we present observations of gas-phase molecules in six 21 m sources, aiming to investigate the relation between the 21 m feature and the gas-phase molecules. The paper is organized as follows. In Sect. 2, we present the sample, observations, and data reduction. In Sect. 3, we present the observation results as well as the calculations of column densities, fractional abundances, and isotopic ratios. In Sect. 4, we discuss the correlations between the strengths of the 21 m emission feature and the measurements of the molecular lines in our sample.
2 Sample, Observations, and Data Reduction
2.1 Description of the sample
The sample of 21 m sources is listed in Table 1. They were chosen for observation because of their comparatively strong CO emission. The properties of the sample are described below.
IRAS 06530-0213: Its central star is an F5 I spectral type supergiant with an effective temperature of 6 900 K (Hrivnak & Reddy, 2003). The star is strongly carbon-enriched with a C/O abundance ratio of 2.8 and has a sub-solar metallicity with [Fe/H] = (Reyniers et al., 2004). The significantly enhanced -process elements indicate that the star has experienced a strong third dredge-up (Reyniers et al., 2004). The optical image taken by the Hubble Space Telescope (HST) shows an elliptical nebula (2 1) with limb-brightened bipolar lobes (Ueta et al., 2000).
IRAS 07134+1005: This PPN, also named HD 56126 or SAO 96709, has an elliptical morphology with an extended circular reflection nebula (Ueta et al., 2000). It is the biggest 21 m source, with an optical size of , according to the HST image. A two-peaked, limb-brightened dust torus is plainly seen in the mid-IR (MIR) image (Meixner et al., 1997). Its central supergiant star has a variability period of 12.1 days with an effective temperature of 7 250 K and a spectral class of F5 Iab (Bakker et al., 1997; Ueta et al., 2000). The [Fe/H] and C/O ratio are and 1.2, respectively (Reddy et al., 2002; Reyniers et al., 2004). It is one of the four sources in which the 21 m emission feature was first discovered (Kwok et al., 1989).
IRAS 19500+1709: This PPN, also named HD 187885 or SAO 163075, has a central star with an effective temperature of 8 000 K and an optical spectral type of F2–6 Ia, a metallicity of [Fe/H] = to , and a C/O ratio of 1.1 (Hrivnak et al., 1989; Van Winckel & Reyniers, 2000; Reddy et al., 2002; Reyniers et al., 2004). It is an intrinsically polarized bipolar reflection nebula with a size of 36 22 at the near-IR (NIR) band, consisting of two lobes divided by a dark lane that is perpendicular to the major axis (Gledhill et al., 2001). The 21 m emission feature in IRAS 19500+1709 was first detected by Justtanont et al. (1996) using the United Kingdom Infrared Telescope (UKIRT).
IRAS 22272+5435: This PPN, also named HD 235858 or SAO 34504, is one of the four sources in which the 21 m emission feature was first reported (Kwok et al., 1989). It has a G5 Ia central star with an effective temperature of 6 500 K. Optical and IR observations reveal an elliptically elongated nebula (Ueta et al., 2000; Gledhill et al., 2001) with a dust torus (16 diameter at 11.8 m, Meixner et al. 1997). The [Fe/H] and C/O ratio of this PPN is to and 1.6–1.8, respectively (Reddy et al., 2002; Začs et al., 2016).
IRAS 23304+6147: This PPN is one of the four 21 m objects first reported by Kwok et al. (1989). It is a quadrupolar shaped nebula (about 55 at the NIR band) with two pairs of unevenly spaced lobes (Sahai et al., 2007). The [Fe/H] and C/O ratio is and 2.9–3.2, respectively (Van Winckel & Reyniers, 2000; Reddy et al., 2002; Reyniers et al., 2004). The central star is G2 Ia type and has an effective temperature of 6 750 K.
IRAS Z02229+6208: The HST NIR image of this PPN reveals an elliptical nebula with a size of about 2 1 (Ueta et al., 2005). Its 21 m feature was first discovered by Volk et al. (1999) based on the Infrared Space Observatory (ISO) data. The central star is assigned as G8-K0 0-Ia type (Hrivnak & Kwok, 1999) and has an effective temperature of 5 500 K (Reddy et al., 1999). It has a sub-solar metalicity ([Fe/H] = ) and is overabundant with C, N, and -process elements (Reddy et al., 1999). Based on the Na i absorption spectra, Reddy et al. (1999) proposed that IRAS Z02229+6208 has an intermediate-mass progenitor star (3 ).
2.2 SMT 10 m Observations
Five 21 m sources were observed in the 1.3 mm window with the Arizona Radio Observatory 10 m Submillimeter Telescope111https://aro.as.arizona.edu/?q=facilities/submillimeter-telescope (SMT) at Mt. Graham on 2014 April 21–26 and 2015 April 15–21. The study is complemented by the 1.3 mm spectra of IRAS 22272+5435 reported by Zhang (2020a). We used the 2048-channel acousto-optical spectrometer and the 1024-channel Forbes Filterbanks simultaneously with a frequency channel spacing of 500 kHz and 1 MHz, respectively, to cover the frequency range from 216–273 GHz with several gaps. The selections of these frequency scans are based on the relatively strong lines discovered in IRC+10216 and CRL 2688 (He et al., 2008; Zhang et al., 2013). As the 21 m sources are much fainter, it is reasonable to suppose that no line in the frequency gaps is detectable with our instrumental sensitivity. The half-power beam widths (HPBW) are in the range of 277–348, which are larger than the source sizes derived from their mid-IR images. The standard wobbler switching mode was carried out with an azimuth beam throw of 2. The on-source times of each band are about 1–3 hours. The dual-channel superconductor-insulator-superconductor (SIS) receivers in single-sideband dual polarization mode were applied. The typical system temperatures are about 200–500 K. Pointing and focus were checked every 2 hours with nearby planets.
2.3 PMO 13.7 m Observations
We also observed the the lines from CO, 13CO, and C18O toward the six 21 m sources by using the Purple Mountain Observatory (PMO) 13.7 m millimeter telescope222http://www.dlh.pmo.cas.cn/wyjsbjs/hmbwyj at Delingha in China. The observations were performed during May 11–20 2022. A supplementary observation toward IRAS 06530-0213 was carried out on November 9 2023. The on-source time of each band is 0.5–1 hour. The receiver used is a two-sideband SIS mixer. The spectrometer backends for each sideband utilize a Fast Fourier Transform Spectrometer (FFTS) with a bandwidth of about 1 GHz including 16384 channels and a frequency resolution of 61 kHz. The corresponding velocity resolution is 0.16 km s-1 for the CO line at the rest frequency of 115 GHz. The two-sideband SIS receiver was designed to cover the CO line at the upper sideband and the transitions of 13CO and C18O at the lower sideband simultaneously with a specific local oscillator (LO) frequency (Shan et al., 2012). The observations were made using a beam switch method. Regular pointing checks were made with a precision better than 5. The HPBWs of this telescope are about 55 and 52 at 110 and 115 GHz, respectively. All sources are thus unresolved.
2.4 Data reduction
The spectral data were reduced by using the Grenoble Image and Line Data Analysis Software (GILDAS) of the Continuum and Line Analysis Single-dish Software (CLASS) package333https://www.iram.fr/IRAMFR/GILDAS/ (Pety, 2005). Bad scans caused by bad atmospheric conditions and receiver instabilities were discarded. The artificial features at the edge of each band were removed. A low-order polynomial baseline subtraction was carried out for each scan. The scans were co-added by using the inverse noise as the weight. The antenna temperature () is converted to the main-beam temperature () following the expression of , where is the main beam efficiency of 0.7 and 0.6 for the SMT 10 m and PMO 13.7 m telescopes, respectively. To further increase the signal-to-noise ratio, we smoothed the spectra over several channels using the ‘boxcar’ method. The resultant root mean square (RMS) levels and velocity resolutions of the transitions are listed in Tables 2–7.
3 Results
The spectra for the whole frequency range covered by our observations are shown in Figs. 1 and 2, where for a better view of the detected lines against the noise we have binned several adjacent channels. Thirty-one emission lines assigned to seven molecular species and isotopologues, including CO, 13CO, HCN, H13CN, HNC, CN, and HC3N, are detected. Figs. 3–8 display the profile of each line separately. SiS and SiO are marginally detected in a few sources. The density of the detected lines is about one line per GHz. Except for IRAS 22272+5435, none of the 21 m sources display SiC2, a compound that is frequently detected in C-rich CSE. In previous work, CO, 13CO, and HCN were the only molecules detected in these sources. The velocity-integrated intensities of strong lines are obtained through the stellar-shell model fitting using the CLASS package (Pety, 2005). The fitting function of the stellar-shell model is
| (1) |
where is the integrated intensity in K MHz, and are the middle frequency and full width at zero level in MHz. dictates the Horn/Center parameter, which represents the edge-to-center intensity ratio, with the expression of = . As a result, we can estimate the expanding velocity by = with the light speed. The faint lines and the blended CN fine structures cannot be fitted by the stellar-shell model. Tables 2–7 present the fitting results, where the rest frequency, molecular species, upper and lower energy levels, expanding velocity (), Horn/Center parameter (), intensity at the line center (), velocity-integrated intensity (), RMS of the baseline, line center velocity (), velocity resolution (Dv), HPBW of the telescope at the corresponding frequency are listed. In the following, the observational results of each source are reported.
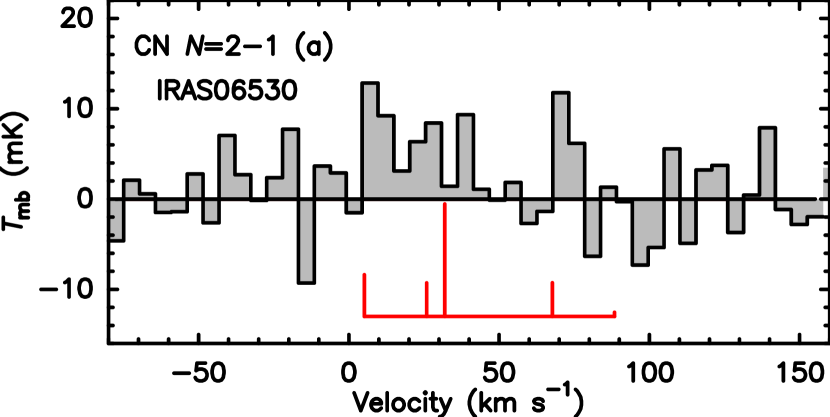
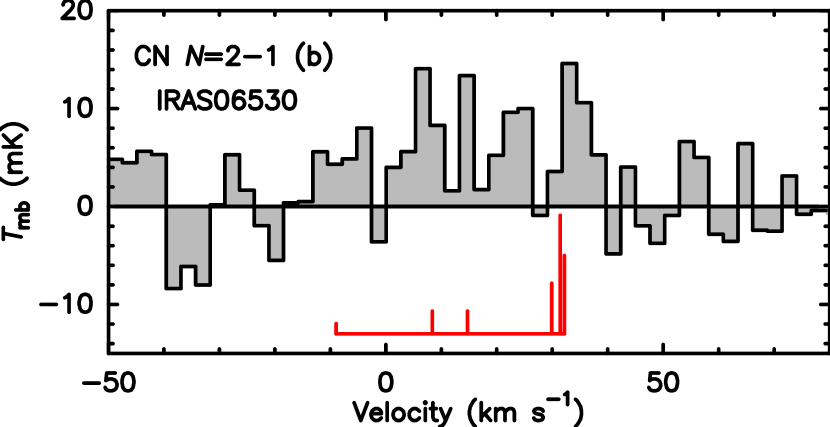
3.1 IRAS 06530-0213
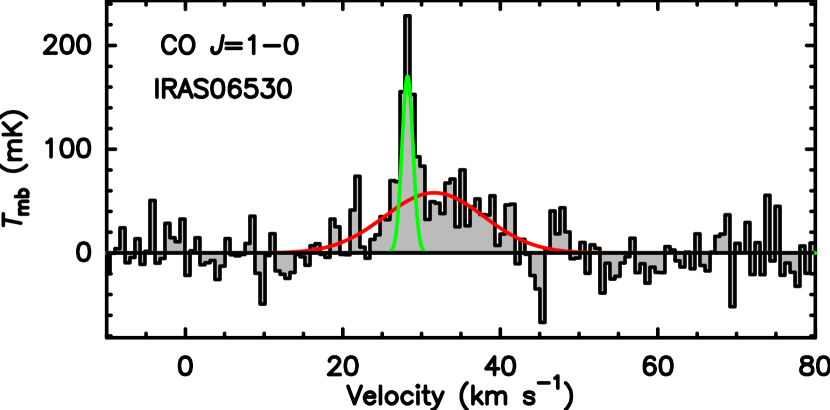
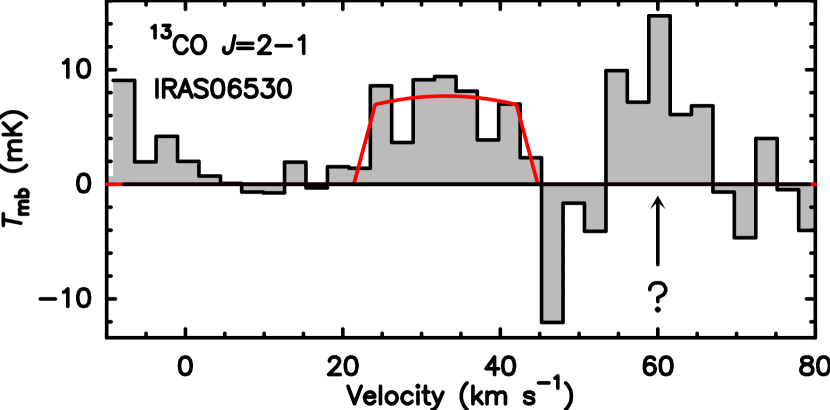
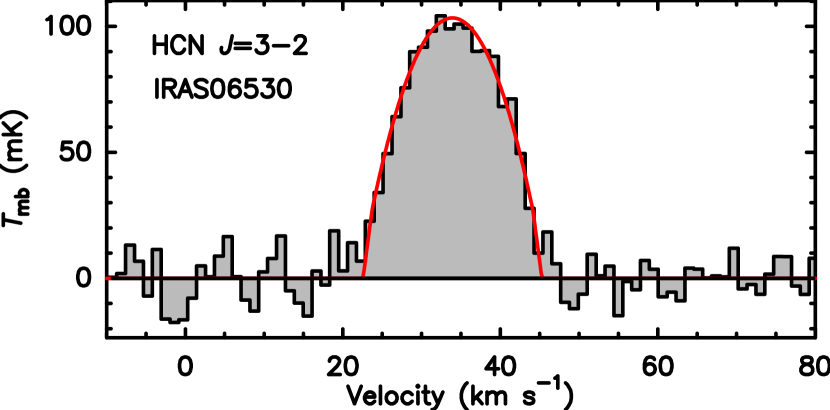
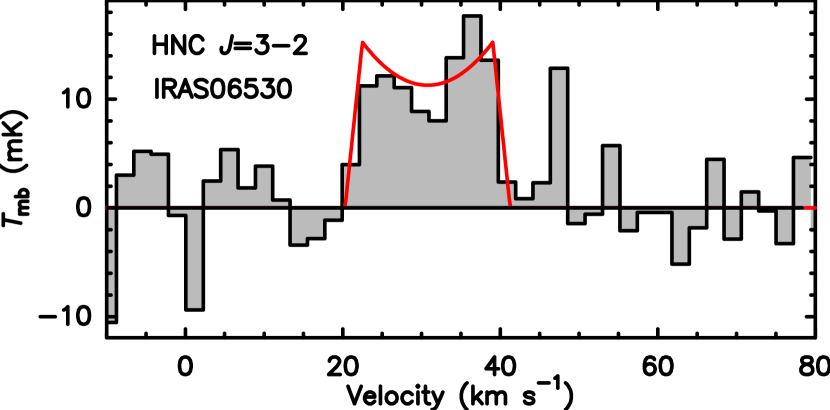
The CO line in this object was previously reported by Hrivnak & Bieging (2005) using the 10 m diameter single dish Heinrich Hertz Submillimeter Telescope (HHT), which exhibits a slightly asymmetric double-peak profile. In this work, we detect five emission lines from gas-phase molecules, including the CO and 13CO lines, the transitions of HCN and HNC, and the CN line, as shown in Fig. 3. A narrow feature with a width of 2 km s-1 is visible at the blue side of the CO line. Based on the Herschel archive data and CO map of the Milk Way (Dame et al., 2001), it is likely to be a contamination from a nearby interstellar cloud lying within the telescope beam. The broad CO feature and the HCN line show a parabolic profile, suggesting that they are optically thick. The CO and 13CO lines exhibit a prominent absorption at about 45 km s-1, which has also been seen in the CO line (Hrivnak & Bieging, 2005). The 13CO line shows an emission feature at 55–70 km s-1, which is not detected in the other transitions. The mean line width of CO , 13CO , and the transitions of HCN and HNC indicate an expansion velocity of 9.7 0.5 km s-1. The HNC line shows an asymmetric double-peak profile with a stronger red peak.
The HC3N species are marginally detected through the transition. The transitions of 13CO and C18O, SO , SiO , SiS and , and SiC2 lines lie within our frequency coverage but are not seen.
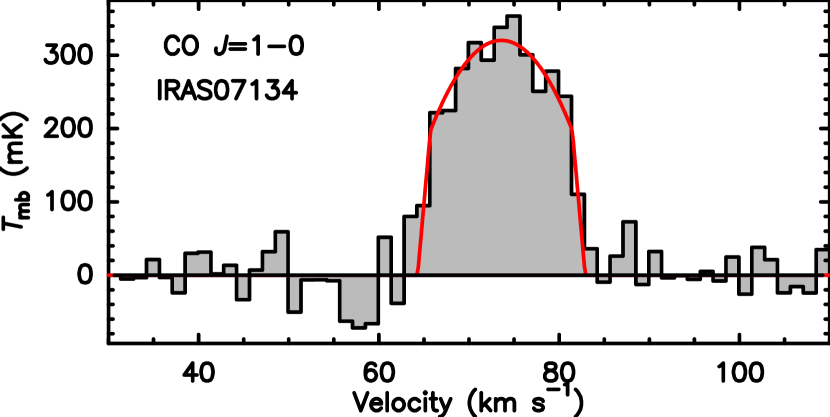
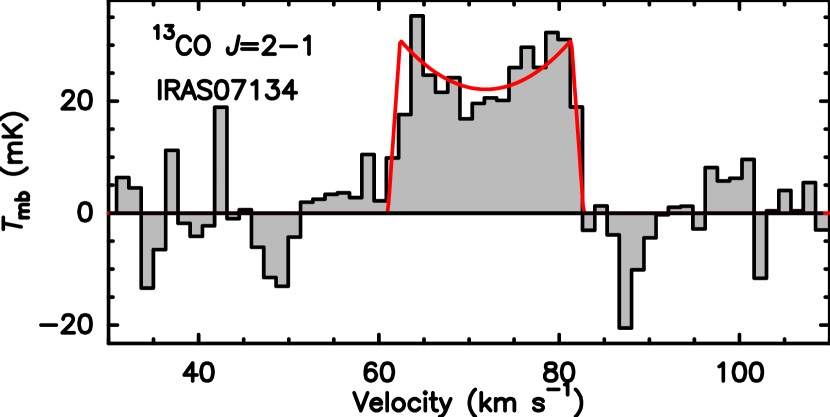
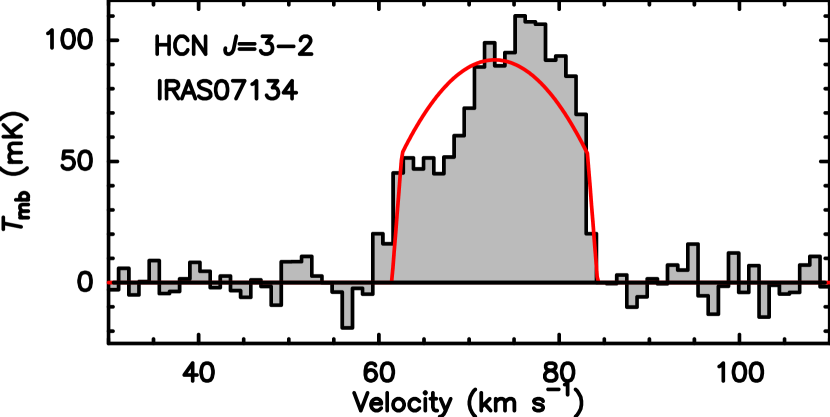
3.2 IRAS 07134+1005
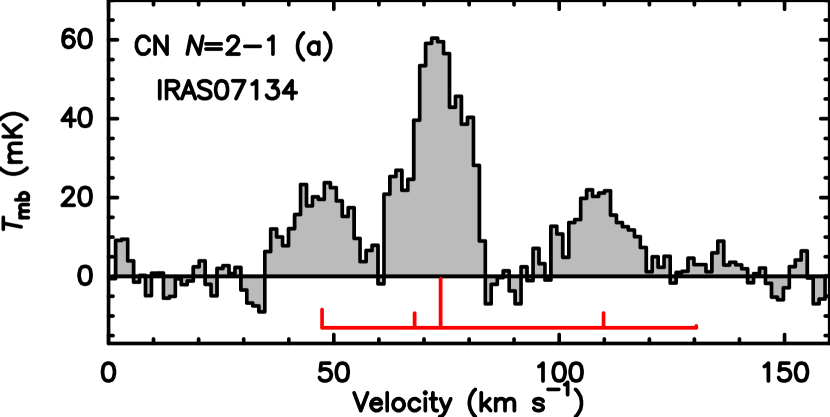
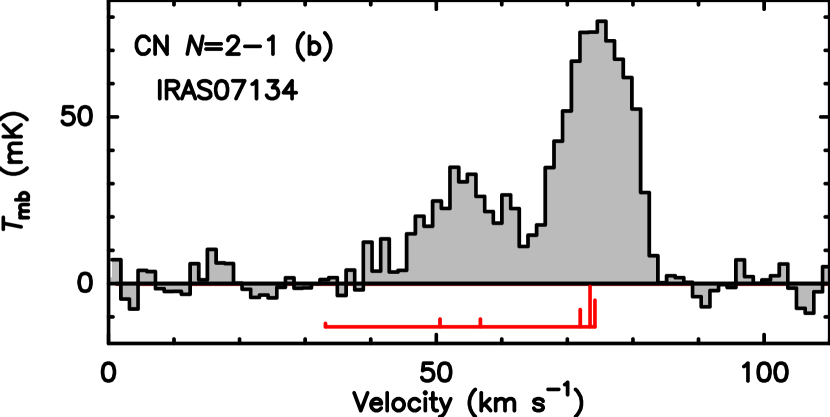
The first detection of CO in this object was made by Zuckerman et al. (1986) using the Five College Radio Astronomy Observatory (FCRAO) 14 m telescope through the transition. The CO , , and , 13CO , and HCN transitions were previously detected in this object by Caltech Submillimeter Observatory (CSO) 10.4 m telescope, Institut de Radioastronomie Millimétrique (IRAM) 30 m telescope, and HHT (Bujarrabal et al., 1992; Omont et al., 1993; Knapp et al., 1998, 2000; Hrivnak & Bieging, 2005). The HCO+ line was possibly detected by Bujarrabal et al. (1992) using the IRAM 30 m telescope. As shown in Fig. 4, our observations clearly show the presence of CO , 13CO , HCN , and CN lines. The profiles of the CO and 13CO transitions show a smoothed parabolic and a double-peaked profile, corresponding to optically thick and thin cases, respectively. Bujarrabal et al. (1992) found that the HCN line, in spite of the poor signal-to-noise ratio, seems to be shifted to the red side, which can be ascribed to self-absorption. Our higher signal-to-noise ratio observations show that the HCN line clearly has a stronger emission at the red side, supporting the result of Bujarrabal et al. (1992). Based on an interferometric observation of the Berkeley-Illinois-Maryland-Association (BIMA) millimeter array, Meixner et al. (2004) found that IRAS 07134+1005 is a low-mass clumpy PPN with a size extending to about 7 in radius. Nakashima et al. (2009) constructed a morphokinematic model based on the Submillimeter Array (SMA) interferometric observations of the CO line, which indicates the presence of a central torus with an inner and outer radius of 12 and 30, respectively. The mean width of the CO , 13CO , and HCN lines in our spectra suggests an expansion velocity of 9.9 0.2 km s-1.
The HNC and HC3N lines are marginally detected. The transitions of 13CO and C18O, H13CN , SO , SiO , SiS and , SiC2 , and HC3N lines, which are frequently detected in CSEs and lie within our observational frequency range, are not detected. The non-detection of SiO has also been reported by Bujarrabal et al. (1992).
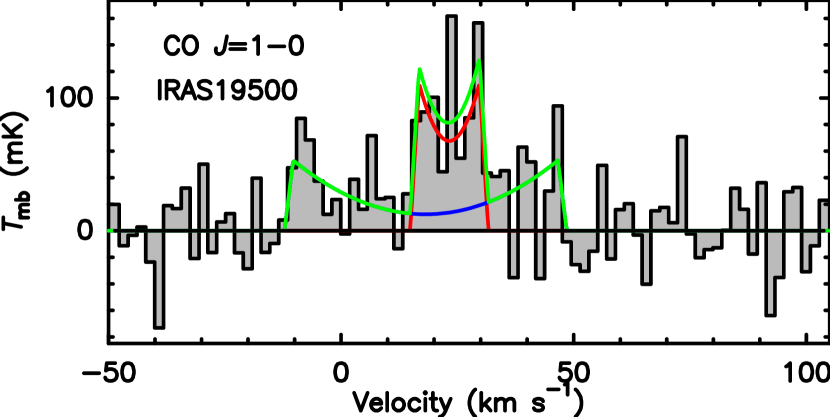
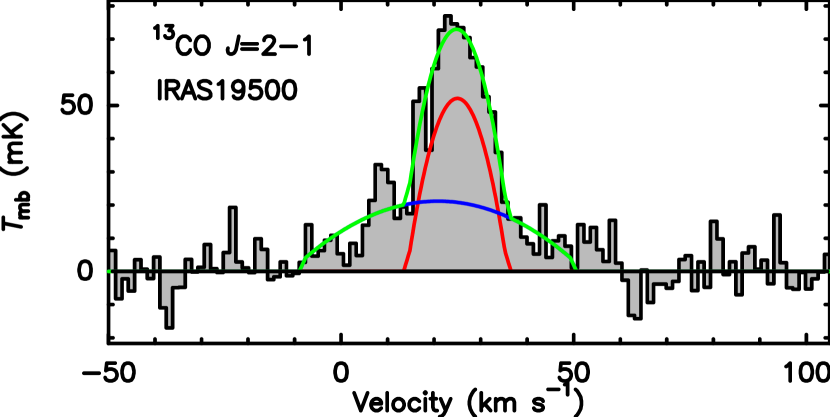
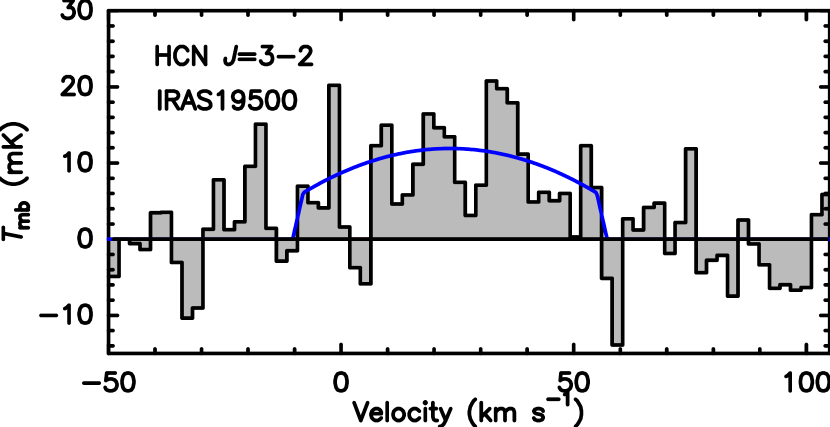
3.3 IRAS 19500-1709
The first detection of CO species in IRAS 19500-1709 was made by Likkel et al. (1987) in a survey of the CO line toward the coldest IRAS objects performed with the IRAM 30 m telescope. They found that IRAS 19500-1709 has the lowest circumstellar expansion velocity (11 km s-1) among their sample. Subsequent observations of higher- CO transitions indicate the existence of a speedy outflow with a velocity of 30 km s-1 (Knapp et al., 1989; Likkel et al., 1991; Bujarrabal et al., 1992; Omont et al., 1993; Hrivnak & Bieging, 2005). The 13CO and HCN species have also been detected in previous observations (Bujarrabal et al., 1992). The CO , 13CO , HCN , and CN transitions, are visible in our spectra (Fig. 5). The CO and 13CO lines show broad and narrow components. Their peak velocities show a small offset (5.2 km s-1 for CO and 4.2 km s-1 for 13CO). This is primarily due to the rather sensitive dependence of the fitting on the faint broad wing, and cannot be considered as real. Nevertheless, the broad component suggests a outflow velocity of 29–33 km s-1, which is consistent with previous results. The two components are not distinct for the HCN line due to low signal-to-noise ratio. An inspection of the Fig. 5 clearly indicates that the stellar-shell fitting for the HCN line is unreliable. We thus mark it as an uncertain measurement, and assume a 50 uncertainty for the analysis. Bujarrabal et al. (1992) discovered a CO absorption at 13 km s-1, and ascribed this to a slow envelope. Such an absorption feature is also detected in our 13CO spectrum. Differing from Bujarrabal et al. (1992), we discover a 13CO emission component at 10 km s-1. The mean line widths suggest the expansion velocities of the broad and narrow components to be 9.2 0.5 and 30.0 1.8 km s-1, respectively.
The transitions of HNC , SiO , and SiS , are marginally detected. The 13CO and C18O , H13CN , SO , SiC2 , and HC3N and transitions lie within the frequency range, but are not visible.
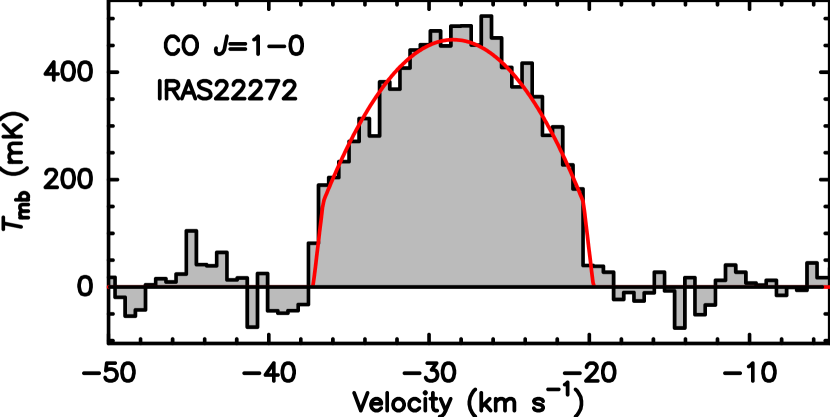
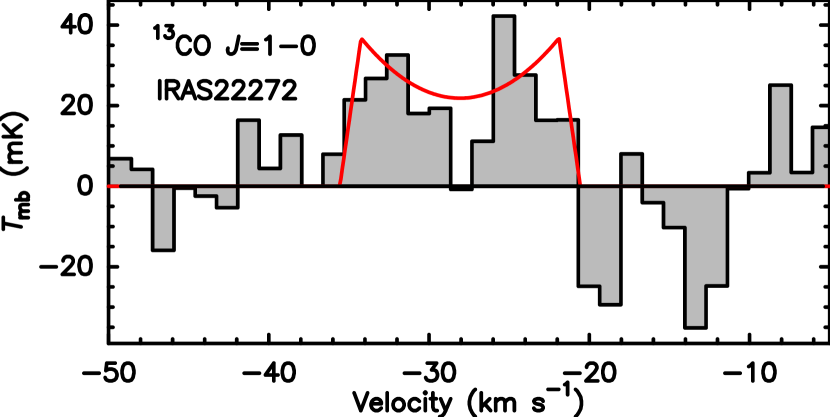
3.4 IRAS 22272+5435
The detection of CO in IRAS 22272+5435 was first reported by Woodsworth et al. (1990) through the transition using the JCMT. Bujarrabal et al. (2001) observed the and lines of CO and 13CO using the IRMA 30 m telescope. The CO and lines were detected by Hrivnak & Bieging (2005) using the HHT. We observe the transitions of CO and 13CO, which yield an expansion velocity of 7.5 0.7 km s-1. As shown in Fig. 6, their line profiles are smoothed parabolic and double-peaked, respectively, corresponding to optically thick and thin cases, respectively. Interferometric observations toward IRAS 22272+5435 have been carried out by Fong et al. (2006) using the BIMA array in the CO line and by Nakashima et al. (2012) using the Combined Array for Research in Millimeter-wave Astronomy (CARMA) in the CO line. The morphologies of the CO and transitions appear to be different. The CO mapping shows a roughly spherical envelope with a size of about 20 and some unusual protrusions. The CO image clearly resolves the central structure, which exhibits two intensity peaks with a distance of about 14 and that their connecting line is almost in the vertical direction of the two 12.5 m peaks of Ueta et al. (2001). Thus far, the detected molecules in this object include C2H, C4H, HC3N, SiC2, CS, C34S, CO, 13CO, CN, CH3CN, HCN, H13CN, and HNC (see the details in Zhang 2020a).
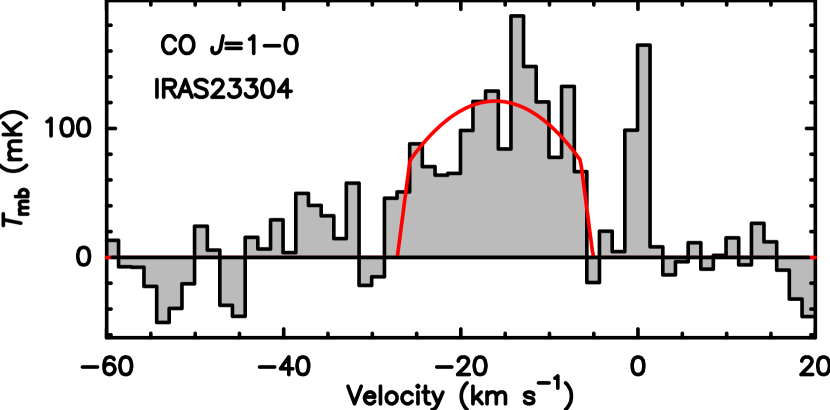
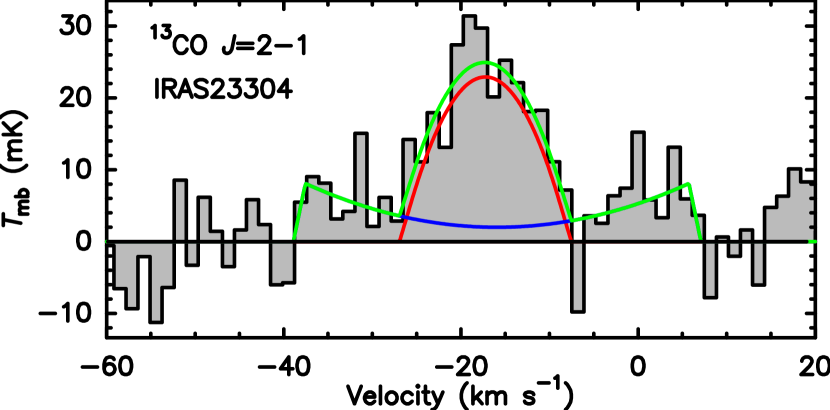
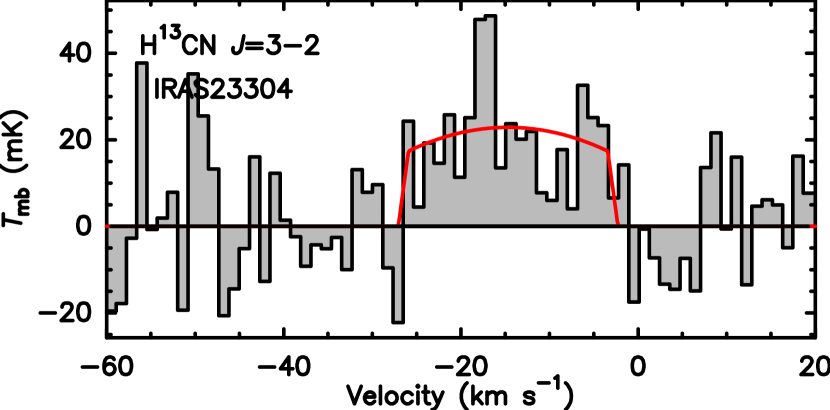
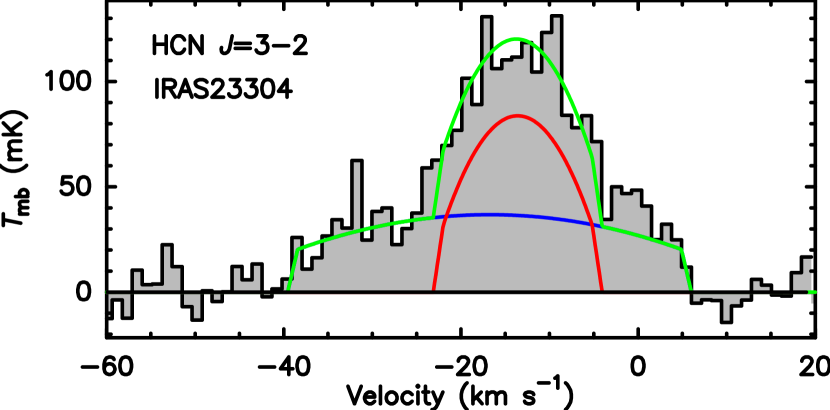
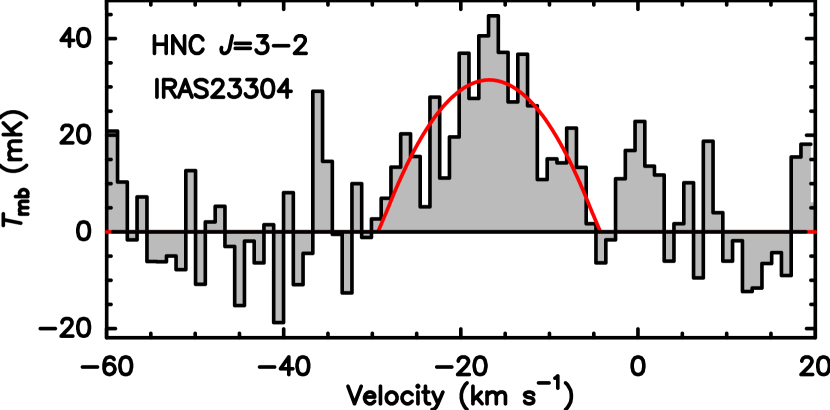
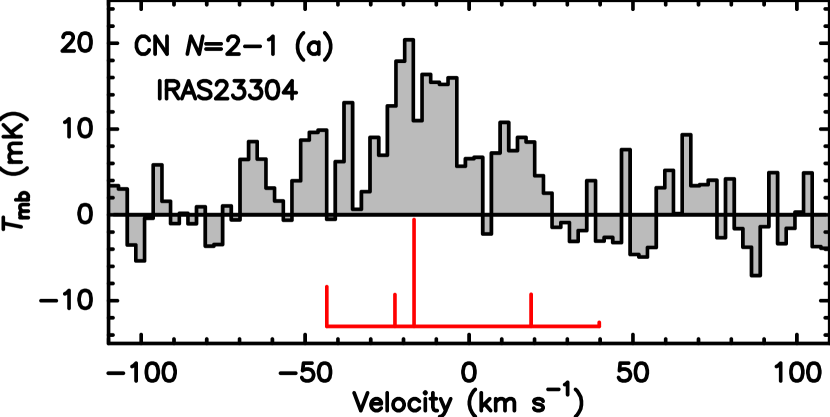
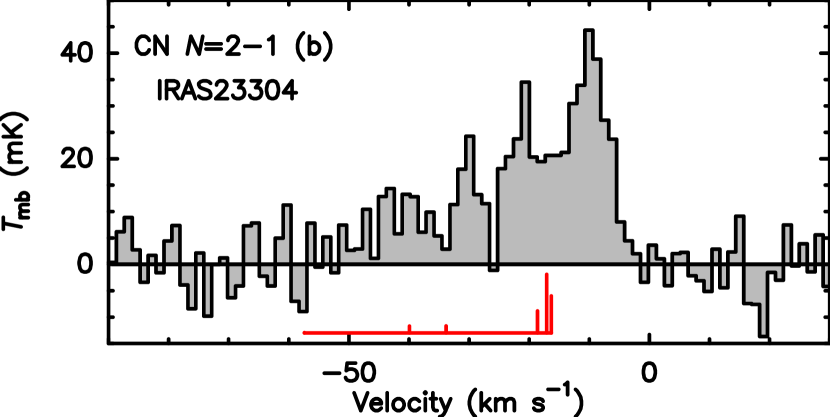
3.5 IRAS 23304+6147
The first detection of CO in IRAS 23304+6147 was made by Woodsworth et al. (1990) using the JCMT through the transition. Likkel et al. (1991) and Hrivnak & Bieging (2005) observed the CO and transitions. Omont et al. (1993) tentatively detected the CS transition using the IRAM 30 m telescope. Our observations result in the detection of six lines, including the CO , 13CO , transitions of HCN, HCN, and H13CN, and CN , as shown in Fig. 7. The 13CO and HCN lines are composed of narrow and broad components. Similar to the CO line in IRAS 19500-1709, the two components of the HCN line show slightly different peak velocities with an offset of 3.2 km s-1. It ought to be regarded as a fitting error because the fitting of the broad component is substantially influenced by its faint wing. The CO line shows an asymmetric shape with stronger emission at the blue side. A similar profile has been reported by Hrivnak & Bieging (2005) for the CO line. We observe a narrow emission feature at the velocity of about 0 km s-1 for the CO line, which may stem from the interstellar medium close to the Galactic plane. The mean line widths result in expansion velocities of 10.3 0.9 and 22 0.8 km s-1 for the narrow and broad components, respectively.
The HC3N transition is marginally detected. The 13CO and C18O , SO , SiO , SiS and , SiC2 , and HC3N lines are not seen.
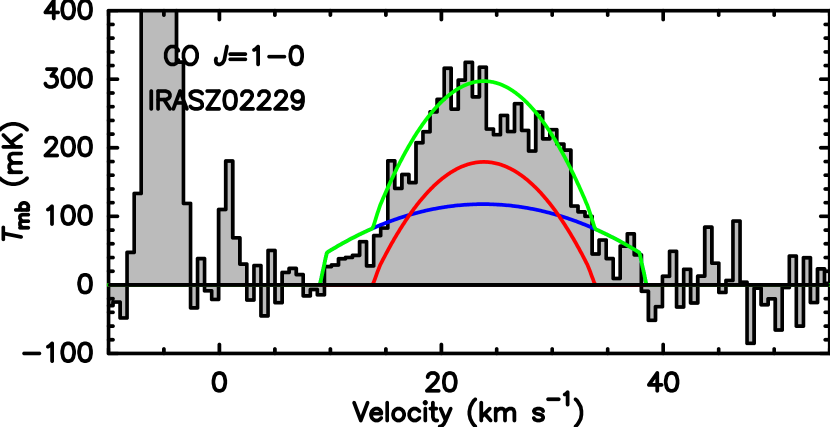
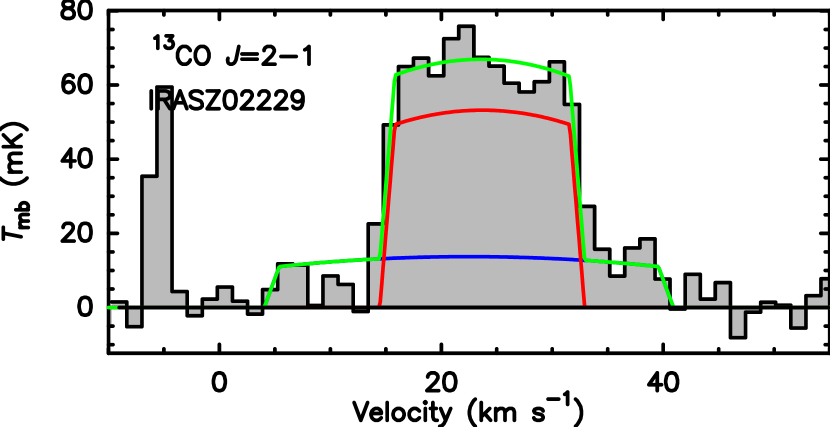
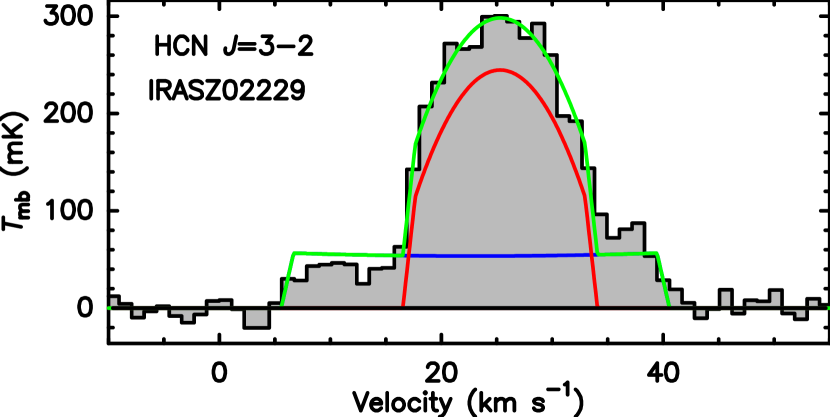
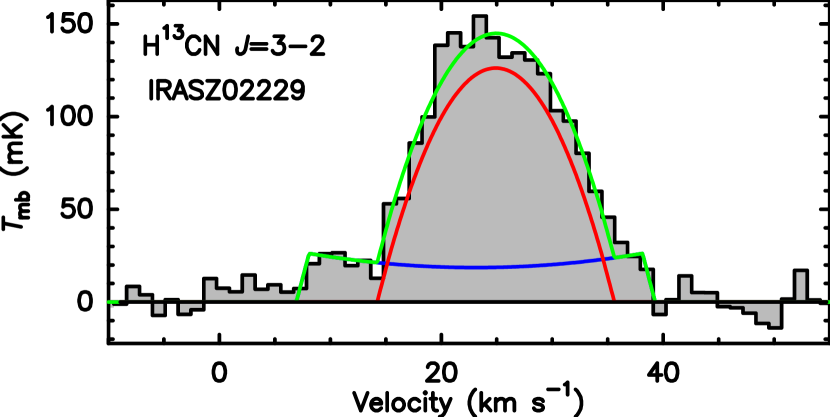
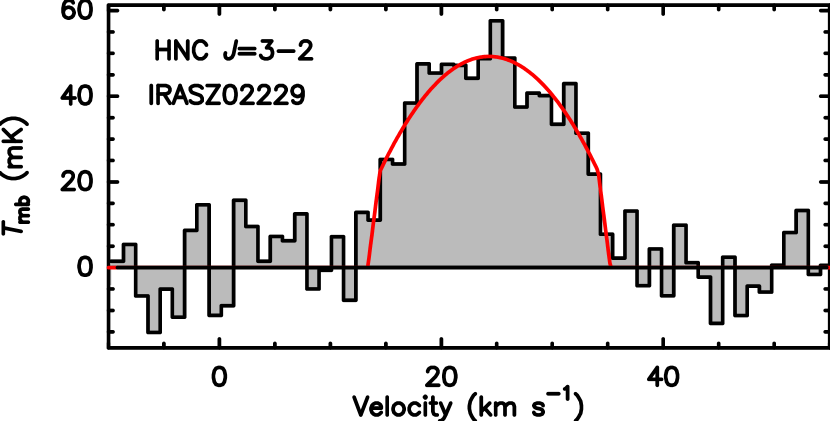
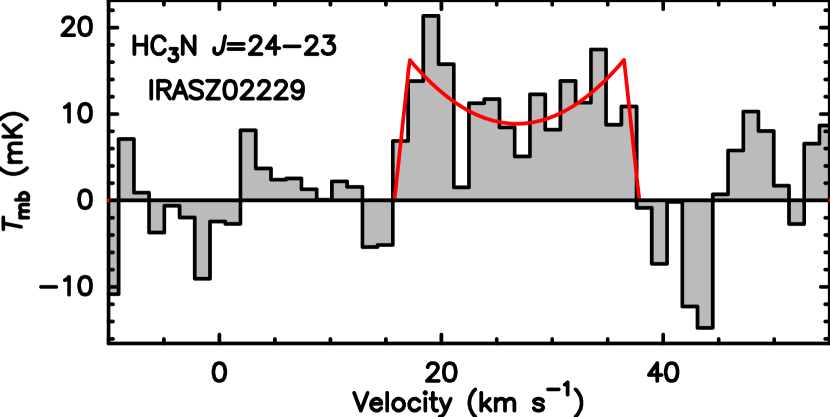
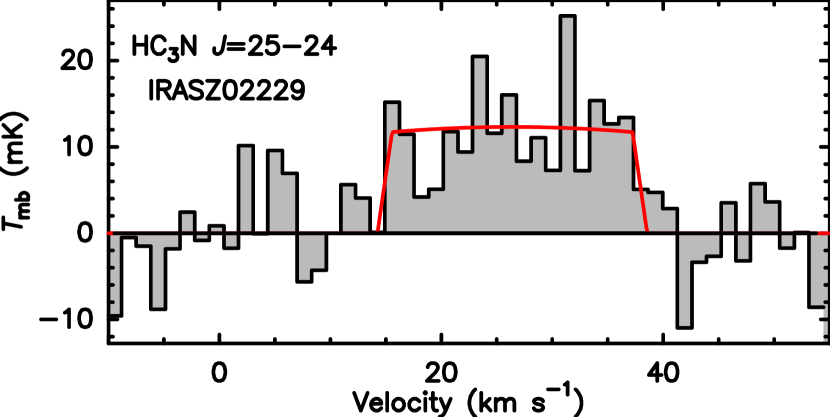
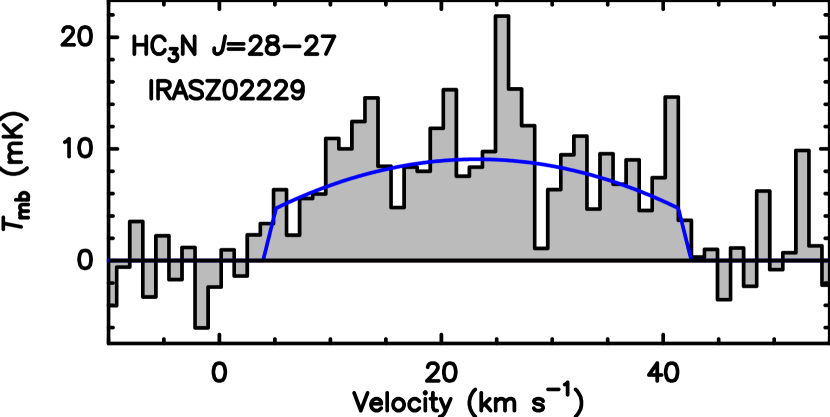
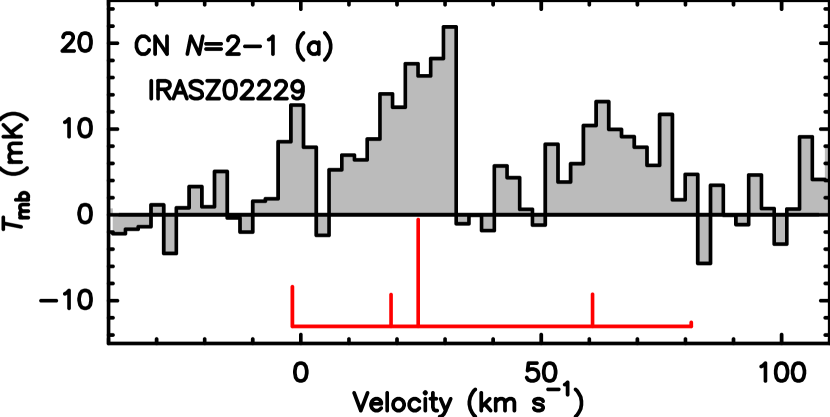
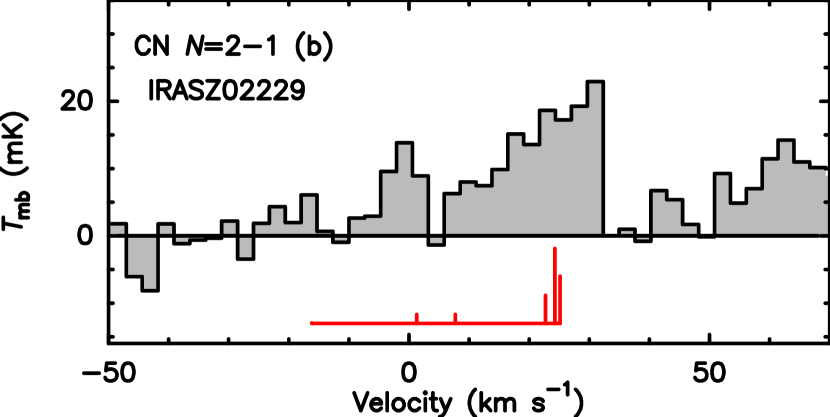
3.6 IRAS Z02229+6208
Prior to this work, CO was the only gas-phase molecule detected in this object, whose and , transitions were observed by Hrivnak & Kwok (1999) and Hrivnak & Bieging (2005). The transitions of CO and 13CO, the transitions of HCN, H13CN, and HNC, CN , and HC3N , , and lines are detected in our observations. HCN, H13CN, HNC, and HC3N are newly discovered in this object. As shown in Fig. 8, the transitions of CO and 13CO and the transitions of HCN and HNC show both broad and narrow components. The broad component is likely to originate from fast outflows. There is an emission feature at the velocity of about -5 km s-1 for CO and 13CO and lines; we infer that it may stem from the interstellar medium. The mean line widths indicate expansion velocities of 10.3 0.9 and 22 0.8 km s-1 for the broad and narrow components, respectively.
The SiS line is marginally detected. The C18O , SO and , SiO , SiS , and SiC2 transitions lie within our frequency coverage and are not detected.
3.7 Column densities and fractional abundances
Three HC3N transitions are clearly detected in IRAS Z02229+6208 (Fig. 7), allowing us to perform a rotation-diagram analysis to derive the excitation temperature () and total column density () of HC3N in this PPN. Based on the assumptions of local thermodynamical equilibrium (LTE) and optical thinness, the level populations can be expressed in the function of
| (2) |
where and represent the Boltzmann constant and Planck constant, respectively. The rest frequency (in Hz), upper-level energy (in K), partition function , spontaneous emission coefficient , and upper state degeneracy of each transition are taken from the CDMS catalog (Müller et al., 2001, 2005). Based on the assumption of both the source brightness distribution and the antenna beam being Gaussian profiles, the line intensity in the scale of main beam temperature is converted to the source brightness temperature by the expression of . The value is equal to the HPBW of each transition, as listed in Table 7. The source size is simply assumed to be 104, a value that has been used to estimate the mass loss rate of IRAS Z02229+6208 by Mishra et al. (2016). is the velocity-integrated intensity of each line. We derive = 88.4 27.7 K and = (1.37 0.76) 1013 cm-2 for HC3N in IRAS Z02229+6208. The resultant rotation diagram is shown in Fig. 9. Assuming K and taking the source sizes from Mishra et al. (2016) (see Table 1), we can estimate the column densities of other molecules through Eq. 2. The analysis results are presented in Table LABEL:Table8. The assumption of a constant is only a rough approximation, which however does not cause significant errors under the condition of K.
To determine the fractional abundances with respect of H2 (), we utilize the equation proposed by Olofsson (1996),
| (3) |
where is in s-1, is the expansion velocity in km s-1, is the beam size in arcsecond, is the distance in pc, is the rest frequency in GHz, is the velocity-integrated intensity in K km s-1, is the energy of the lower level in K, is the H2 mass loss rate in , and and represent the ratios of the inner () and outer () radii over the beam size, that is, (see Table 1 for these values). If more than one transition from a molecule is detected, we adopt the average abundance. The obtained values are listed in Table LABEL:Table8. The indicated uncertainties come only from the measurement uncertainties, and may be significantly larger if considering the uncertainties associated with the distance estimation and the assumed gas-to-dust ratio. Nevertheless, the relative abundances between different molecules are free from the uncertainties of the distances and gas-to-dust ratios. It should be noted that if the lines are optically thick, the values should be considered as the lower limits.
Ramstedt & Olofsson (2014) investigated 19 C stars and found the fractional abundance of 13CO to be (0.1–5.5) 10-4 with a mean value of 1.3 10-4, systematically higher than the values of 21 m sources of (1–2) 10-5. The CSE expansion leads to a decreased optical depth, and hence the shielding of the CO against the ambient interstellar radiation field is declining. As a result, more 13CO may be photo-dissociated. On the other hand, the more extensive penetration of UV photons, either from the center star (or a companion) or the external radiation field, may ionize more molecules and drive photochemistry during the evolution from the AGB to PPN phase.
Table 9 compares the molecular abundances of the 21 m sources and those of the prototypical C-star IRC+10216 and PPN CRL 2688. We find that despite having molecular abundances more than one order of magnitude lower than the two prototype objects, the 21 m sources’ abundance pattern more closely resembles CRL 2688 than IRC+10216. Therefore, it seems that molecular spectra could serve as valuable means for classifying CSEs.
3.8 12C/13C abundance ratios
Isotopic abundance ratios can shed some insights on the stellar nucleosynthesis. As an intermediate reaction product of the CNO cycle, 13C can be brought to the surface of a red giant through the first dredge-up process. 12C is mainly generated by the triple- reaction in AGB phase (Herwig, 2005; Karakas & Lattanzio, 2014). The 12C/13C ratios are estimated through CO and HCN lines and their 13C isotopic lines. As no C18O lines are discovered, we estimate the lower limits of the 16O/18O ratios based on the observational sensitivity. The results are presented in Table 10. Because the CO and HCN are optically thicker than their isotopic lines, the 12C/13C ratios listed in Table 10 should be treated as lower limits. For IRAS Z02229+6208, the 12C/13C ratios obtained from the broad and narrow line components are listed. Their divergent values are most likely the cause of the two components having different optical depths. The lower limits of the 12C/13C ratios in all 21 m sources are much lower than the solar value (89.3, Lodders, 2003), which cannot be solely attributed to the influence of optical thickness. Therefore, the 21 m sources exhibit a 13C enhancements probably as a result of nonstandard mixing processes (Karakas, 2010). We come to the conclusion that the isotopic ratios of 21 m sources are representative of evolved stars in general. We also note that the extremely low 12C/13C ratios (15) is a characteristic of J-type carbon stars that might be associated with binary evolution.
4 Discussion and conclusion
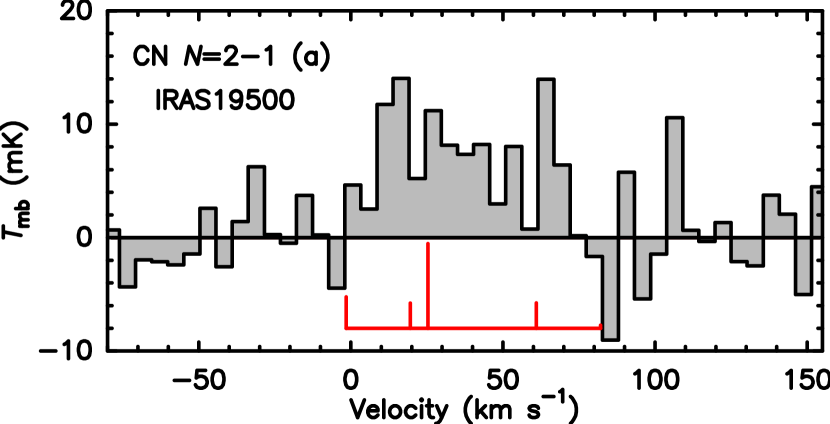
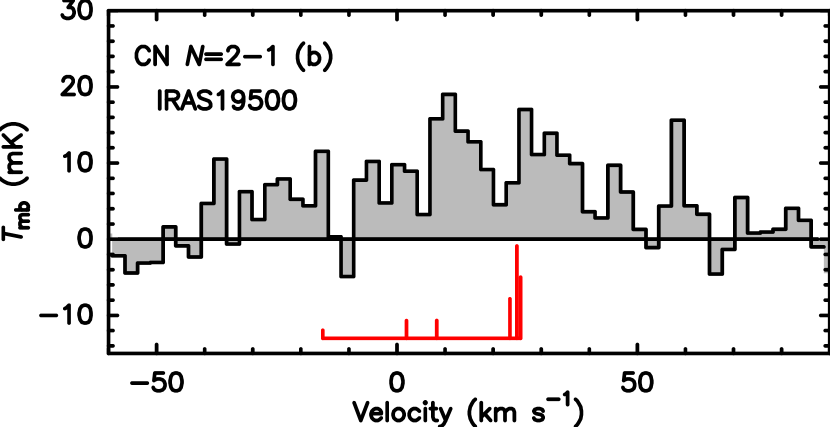
The CN transition consists of eleven hyperfine components, which are divided into two groups located at frequency ranges of 226.6–226.7 and 226.8–226.9 GHz, respectively, as shown in Figs. 3–8. Their intensity ratios may differ from intrinsic values due to the influence of optical depth. However, the observed intensity ratios between the 226.8 and the 226.6 GHz groups are lower than 1.2, which is significantly less than the intrinsic strength ratio (1.8). To replicate the huge deviation, unreasonably large optical depths are needed. The same circumstances have been discovered for other CSEs (Bachiller et al., 1997; Zhang, 2020a). The pumping of CN lines by optical and/or near-IR radiation provides a more likely explanation for the strength abnormalities.
The interferometric observations of IRAS 07134+1005 show a geometrically thick expanding torus with an expanding velocity of 8 km s-1 (Nakashima et al., 2009). Based on a comparison of two sources, Zhang (2020a) finds that the 21 m source IRAS 22272+5435 may have a relatively narrow line width, probably tracing a slowly expanding torus. The narrow line profile is also shown in our spectra of all the 21 m sources. It is reasonable to speculate that the presence of a torus might provide a favorable condition for the formation of the 21 m carrier. However, apart from the narrow component, the lines of IRAS 19500-1709, IRAS 23304+6147, and IRAS Z02229+6208 exhibit a broad wing with a width of 20–30 km s-1, tracing velocity-enhanced components. The CO observations with the Atacama Large Millimetre/submillimetre Array (ALMA) reveal that IRAS 07134+1005 has a hollow shell with a slight velocity enhancement at the poles, while another 21 m source, IRAS 16594-4646 (not part of the current sample), does indeed exhibit a dense torus (Ueta et al., 2018). Therefore, the 21 m sources seem to have a range of morphologies. This could also be inferred from the mid-IR observations of Ueta et al. (2000). Follow-up interferometric observations of a larger sample are required to elucidate the details of the three-dimensional structures and dynamics of 21 m sources.
As shown in Table 9, the relative molecular abundances exhibit a similar degree of dispersion as the strengths of the 21 m feature. To establish a link between the 21 m emission feature and the gas-phase molecular species, we investigate the correlations between the relative intensities of the 21 m feature respective to total IR emission (F21μm/FIR) and molecular fractional abundance fX for the six 21 m feature sources, as shown in Fig. 10. The F21μm/FIR values equal to 4.0, 8.1, 1.0, 2.3, 4.7, and 1.3 for IRAS 06530-0213, IRAS 07134+1005, IRAS 19500+1709, IRAS 23304+6147, IRAS 22272+5435, and IRAS Z02229+6208, respectively. We note that different authors have reported different intensities of the 21 m feature because of different spectral decomposition approaches (Zhang et al., 2010; Mishra et al., 2015, 2016). For the purpose of consistency, the values and uncertainties presented in Mishra et al. (2016) are used in our work. It must bear in mind that the adopted uncertainties of the F21μm/FIR ratio in the analysis are likely to be underestimated. We fit the data with a linearized power law of the form , where fX is the fractional abundances of CO, 13CO, HCN, H13CN, HNC, CN, SiS, and HC3N, as shown in Fig. 10. The fittings are performed using the LINMIX Bayesian regression package Kelly (2007), which takes into account the uncertainties in x- and y-directions and is able to handle the upper limits of the y values. The fitting results are presented in Table 11. The correlation coefficients are too low to have a strong statistical significance. However, some of the correlations would be enhanced if the points for the feeblest 21 m source IRAS 19500+1709 are excluded.
In Fig. 10, we also examine the correlation between the 21 m feature and the HNC/HCN and CN/HCN abundance ratios. [HNC]/[HCN] has been found to decrease with increasing gas kinetic temperature (Graninger et al., 2014, and the references therein) and thus has been taken as a thermometer of astronomical environments (e.g., Jin et al. 2015; Hacar et al. 2020; Long et al. 2021). We find a strong inverse correlation between [HNC]/[HCN] and F21μm/FIR, suggesting that a warm environment may favor the formation of the 21 m carrier. The modelling of Huggins & Glassgold (1982) suggests that CN in C-rich CSEs is the direct photodissociation product of HCN. This is supported by the observations that CN is enhanced with respect to HCN during the PPN–PN evolution (Bachiller et al., 1997). If one excludes the points for IRAS 07134+1005 and IRAS 19500+1709, which have the strongest and weakest relative intensities of the 21 m feature in our sample, the [CN]/[HCN] values lie within a narrow range. If we assume that [CN]/[HCN] is an indication of a change in the UV radiation field, this might suggest that these sources have a similar radiation environment. The rough trend shown in Fig. 10 can be tentatively explained in terms of a scheme in which the 21 m carrier is being formed/excited with increasing UV radiation and is destroyed once the radiation strength reaches a certain level. This seems to be in line with the notion of Kwok et al. (1989) that the 21 m emission is a transient phenomenon. However, the interpretation is highly speculative and can be further complicated by other factors, such as the properties of the central star and the dust-to-gas ratio.
The intensity ratio between the 13CO line and the total IR emission can be taken as a proxy of the gas-to-dust ratio. If we assume a constant mass-loss ratio () and expansion velocity (), the could be used to trace the average density of the CSE. A correlation study may shed new insights into the physical conditions of synthesizing the 21 m carrier. However, we cannot find any strong correlation, as shown in Fig. 10. A large sample study is needed to draw meaningful conclusions.
References
- Agundez et al. (2012) Agúndez, M., Fonfría, J. P., Cernicharo, J., et al. 2012, A&A, 543, A48. doi:10.1051/0004-6361/201218963
- Agundez (2009) Agundez, M. 2009, Ph.D. Thesis, 2009
- Aladro et al. (2015) Aladro, R., Martín, S., Riquelme, D., et al. 2015, A&A, 579, A101. doi:10.1051/0004-6361/201424918
- Bachiller et al. (1997) Bachiller, R., Fuente, A., Bujarrabal, V., et al. 1997, A&A, 319, 235
- Bakker et al. (1997) Bakker, E. J., van Dishoeck, E. F., Waters, L. B. F. M., et al. 1997, A&A, 323, 469. doi:10.48550/arXiv.astro-ph/9610063
- Bujarrabal et al. (2001) Bujarrabal, V., Castro-Carrizo, A., Alcolea, J., et al. 2001, A&A, 377, 868. doi:10.1051/0004-6361:20011090
- Bujarrabal et al. (1992) Bujarrabal, V., Alcolea, J., & Planesas, P. 1992, A&A, 257, 701.
- Cami et al. (2010) Cami, J., Bernard-Salas, J., Peeters, E., et al. 2010, Science, 329, 1180. doi:10.1126/science.1192035
- Cernicharo et al. (2011) Cernicharo, J., Agúndez, M., & Guélin, M. 2011, The Molecular Universe, 280, 237. doi:10.1017/S1743921311025014
- Cerrigone et al. (2011) Cerrigone, L., Hora, J. L., Umana, G., et al. 2011, ApJ, 738, 121. doi:10.1088/0004-637X/738/2/121
- Dame et al. (2001) Dame, T. M., Hartmann, D., & Thaddeus, P. 2001, ApJ, 547, 792. doi:10.1086/318388
- Fong et al. (2006) Fong, D., Meixner, M., Sutton, E. C., et al. 2006, ApJ, 652, 1626. doi:10.1086/508127
- Gaia Collaboration et al. (2023) Gaia Collaboration, Vallenari, A., Brown, A. G. A., et al. 2023, A&A, 674, A1. doi:10.1051/0004-6361/202243940
- Gledhill et al. (2001) Gledhill, T. M., Chrysostomou, A., Hough, J. H., et al. 2001, MNRAS, 322, 321. doi:10.1046/j.1365-8711.2001.04112.x
- Graninger et al. (2014) Graninger, D. M., Herbst, E., Öberg, K. I., et al. 2014, ApJ, 787, 74. doi:10.1088/0004-637X/787/1/74
- Groesbeck et al. (1994) Groesbeck, T. D., Phillips, T. G., & Blake, G. A. 1994, ApJS, 94, 147. doi:10.1086/192076
- Hacar et al. (2020) Hacar, A., Bosman, A. D., & van Dishoeck, E. F. 2020, A&A, 635, A4. doi:10.1051/0004-6361/201936516
- He et al. (2008) He, J. H., Dinh-V-Trung, Kwok, S., et al. 2008, ApJS, 177, 275. doi:10.1086/587142
- Herwig (2005) Herwig, F. 2005, ARA&A, 43, 435. doi:10.1146/annurev.astro.43.072103.150600
- Hrivnak & Kwok (1999) Hrivnak, B. J. & Kwok, S. 1999, ApJ, 513, 869. doi:10.1086/306873
- Hrivnak et al. (1989) Hrivnak, B. J., Kwok, S., & Volk, K. M. 1989, ApJ, 346, 265. doi:10.1086/168007
- Hrivnak & Reddy (2003) Hrivnak, B. J. & Reddy, B. E. 2003, ApJ, 590, 1049. doi:10.1086/375191
- Hrivnak & Bieging (2005) Hrivnak, B. J. & Bieging, J. H. 2005, ApJ, 624, 331. doi:10.1086/428894
- Huggins & Glassgold (1982) Huggins, P. J. & Glassgold, A. E. 1982, ApJ, 252, 201. doi:10.1086/159547
- Höfner & Olofsson (2018) Höfner, S. & Olofsson, H. 2018, A&A Rev., 26, 1. doi:10.1007/s00159-017-0106-5
- Iglesias-Groth (2006) Iglesias-Groth, S. 2006, MNRAS, 368, 1925. doi:10.1111/j.1365-2966.2006.10272.x
- Jin et al. (2015) Jin, M., Lee, J.-E., & Kim, K.-T. 2015, ApJS, 219, 2. doi:10.1088/0067-0049/219/1/2
- Justtanont et al. (1996) Justtanont, K., Barlow, M. J., Skinner, C. J., et al. 1996, A&A, 309, 612
- Jørgensen et al. (2020) Jørgensen, J. K., Belloche, A., & Garrod, R. T. 2020, ARA&A, 58, 727. doi:10.1146/annurev-astro-032620-021927
- Karakas (2010) Karakas, A. I. 2010, MNRAS, 403, 1413. doi:10.1111/j.1365-2966.2009.16198.x
- Karakas & Lattanzio (2014) Karakas, A. I. & Lattanzio, J. C. 2014, PASA, 31, e030. doi:10.1017/pasa.2014.21
- Kelly (2007) Kelly, B. C. 2007, ApJ, 665, 1489. doi:10.1086/519947
- Knapp et al. (1989) Knapp, G. R., Sutin, B. M., Phillips, T. G., et al. 1989, ApJ, 336, 822. doi:10.1086/167052
- Knapp et al. (2000) Knapp, G. R., Crosas, M., Young, K., et al. 2000, ApJ, 534, 324. doi:10.1086/308731
- Knapp et al. (1998) Knapp, G. R., Young, K., Lee, E., et al. 1998, ApJS, 117, 209. doi:10.1086/313111
- Koike et al. (2017) Koike, C., Matsuno, J., & Chihara, H. 2017, ApJ, 845, 115. doi:10.3847/1538-4357/aa7deb
- Kwok (2021) Kwok, S. 2021, Ap&SS, 366, 67. doi:10.1007/s10509-021-03974-y
- Kwok et al. (1989) Kwok, S., Volk, K. M., & Hrivnak, B. J. 1989, ApJ, 345, L51. doi:10.1086/185550
- Landsman (1993) Landsman, W. B. 1993, Astronomical Data Analysis Software and Systems II, 52, 246
- Likkel et al. (1987) Likkel, L., Omont, A., Morris, M., et al. 1987, A&A, 173, L11
- Likkel et al. (1991) Likkel, L., Forveille, T., Omont, A., et al. 1991, A&A, 246, 153
- Lodders (2003) Lodders, K. 2003, ApJ, 591, 1220. doi:10.1086/375492
- Long et al. (2021) Long, F., Bosman, A. D., Cazzoletti, P., et al. 2021, A&A, 647, A118. doi:10.1051/0004-6361/202039336
- Meixner et al. (2004) Meixner, M., Zalucha, A., Ueta, T., et al. 2004, ApJ, 614, 371. doi:10.1086/423606
- Meixner et al. (1997) Meixner, M., Skinner, C. J., Graham, J. R., et al. 1997, ApJ, 482, 897. doi:10.1086/304174
- Mishra et al. (2015) Mishra, A., Li, A., & Jiang, B. W. 2015, ApJ, 802, 39. doi:10.1088/0004-637X/802/1/39
- Mishra et al. (2016) Mishra, A., Li, A., & Jiang, B. W. 2016, ApJ, 825, 68. doi:10.3847/0004-637X/825/1/68
- Müller et al. (2001) Müller, H. S. P., Thorwirth, S., Roth, D. A., et al. 2001, A&A, 370, L49. doi:10.1051/0004-6361:20010367
- Müller et al. (2005) Müller, H. S. P., Schlöder, F., Stutzki, J., et al. 2005, Journal of Molecular Structure, 742, 215. doi:10.1016/j.molstruc.2005.01.027
- Nakashima et al. (2009) Nakashima, J.-. ichi ., Koning, N., Kwok, S., et al. 2009, ApJ, 692, 402. doi:10.1088/0004-637X/692/1/402
- Nakashima et al. (2012) Nakashima, J.-. ichi ., Koning, N., Volgenau, N. H., et al. 2012, ApJ, 759, 61. doi:10.1088/0004-637X/759/1/61
- Olofsson (1996) Olofsson, H. 1996, in IAU Symp. 178, Molecules in Astrophysics: Probes and Processes, ed. E. van Dishoeck (Dordrecht: Kluwer), 457. https://doi.org/10.1017/S007418090000961X
- Omont et al. (1993) Omont, A., Loup, C., Forveille, T., et al. 1993, A&A, 267, 515
- Omont (2016) Omont, A. 2016, A&A, 590, A52. doi:10.1051/0004-6361/201527685
- Pety (2005) Pety, J. 2005, SF2A-2005: Semaine de l’Astrophysique Francaise, 721
- Posch et al. (2004) Posch, T., Mutschke, H., & Andersen, A. 2004, ApJ, 616, 1167. doi:10.1086/425113
- Qiu et al. (2022) Qiu, J.-J., Zhang, Y., Zhang, J.-S., et al. 2022, ApJS, 259, 56. doi:10.3847/1538-4365/ac5180
- Ramstedt & Olofsson (2014) Ramstedt, S. & Olofsson, H. 2014, A&A, 566, A145. doi:10.1051/0004-6361/201423721
- Reddy et al. (2002) Reddy, B. E., Lambert, D. L., Gonzalez, G., et al. 2002, ApJ, 564, 482. doi:10.1086/324216
- Reddy et al. (1999) Reddy, B. E., Bakker, E. J., & Hrivnak, B. J. 1999, ApJ, 524, 831. doi:10.1086/307858
- Reyniers et al. (2004) Reyniers, M., Van Winckel, H., Gallino, R., et al. 2004, A&A, 417, 269. doi:10.1051/0004-6361:20034397
- Sahai et al. (2007) Sahai, R., Morris, M., Sánchez Contreras, C., et al. 2007, AJ, 134, 2200. doi:10.1086/522944
- Shan et al. (2012) Shan, W., Yang, J., Shi, S., et al. 2012, IEEE Transactions on Terahertz Science and Technology, 2, 593. doi:10.1109/TTHZ.2012.2213818
- Taniguchi et al. (2023) Taniguchi, K., Gorai, P., & Tan, J. C. 2023, arXiv:2303.15769. doi:10.48550/arXiv.2303.15769
- Ueta et al. (2018) Ueta, T., Izumiura, H., Yamamura, I., et al. 2018, in IAU Symp. 343, Why Galaxies Care About AGB Stars: A Continuing Challenge through Cosmic Time, ed. F. Kerschbaum, M. Groenewegen &, H. Olofsson (Cambridge: Cambridge University Press), 520 doi:10.1017/S1743921318006373
- Ueta et al. (2001) Ueta, T., Meixner, M., Hinz, P. M., et al. 2001, ApJ, 557, 831. doi:10.1086/322259
- Ueta et al. (2000) Ueta, T., Meixner, M., & Bobrowsky, M. 2000, ApJ, 528, 861. doi:10.1086/308208
- Ueta et al. (2005) Ueta, T., Murakawa, K., & Meixner, M. 2005, AJ, 129, 1625. doi:10.1086/427541
- Van Winckel & Reyniers (2000) Van Winckel, H. & Reyniers, M. 2000, A&A, 354, 135. doi:10.48550/arXiv.astro-ph/9910112
- Volk et al. (2020) Volk, K., Sloan, G. C., & Kraemer, K. E. 2020, Ap&SS, 365, 88. doi:10.1007/s10509-020-03798-2
- Volk et al. (2011) Volk, K., Hrivnak, B. J., Matsuura, M., et al. 2011, ApJ, 735, 127. doi:10.1088/0004-637X/735/2/127
- Volk et al. (1999) Volk, K., Kwok, S., & Hrivnak, B. J. 1999, ApJ, 516, L99. doi:10.1086/312007
- Woods et al. (2003a) Woods, P. M., Millar, T. J., Herbst, E., et al. 2003a, A&A, 402, 189. doi:10.1051/0004-6361:20030215
- Woods et al. (2003b) Woods, P. M., Schöier, F. L., Nyman, L.-Å., et al. 2003b, A&A, 402, 617. doi:10.1051/0004-6361:20030190
- Woodsworth et al. (1990) Woodsworth, A. W., Kwok, S., & Chan, S. J. 1990, A&A, 228, 503
- Začs et al. (2016) Začs, L., Musaev, F., Kaminsky, B., et al. 2016, ApJ, 816, 3. doi:10.3847/0004-637X/816/1/3
- Zhang et al. (2009) Zhang, K., Jiang, B. W., & Li, A. 2009, MNRAS, 396, 1247. doi:10.1111/j.1365-2966.2009.14808.x
- Zhang et al. (2020) Zhang, Y., Sadjadi, S., & Hsia, C.-H. 2020, Ap&SS, 365, 67. doi:10.1007/s10509-020-03779-5
- Zhang (2020a) Zhang, Y. 2020a, ApJ, 898, 151. doi:10.3847/1538-4357/ab9b80
- Zhang (2020b) Zhang, Y. 2020b, Chinese Journal of Chemical Physics, 33, 101. doi:10.1063/1674-0068/cjcp1911203
- Zhang et al. (2013) Zhang, Y., Kwok, S., Nakashima, J.-. ichi ., et al. 2013, ApJ, 773, 71. doi:10.1088/0004-637X/773/1/71
- Zhang et al. (2010) Zhang, Y., Kwok, S., & Hrivnak, B. J. 2010, ApJ, 725, 990. doi:10.1088/0004-637X/725/1/990
- Ziurys (2006) Ziurys, L. M. 2006, Proceedings of the National Academy of Science, 103, 12274. doi:10.1073/pnas.0602277103
- Zuckerman et al. (1986) Zuckerman, B., Dyck, H. M., & Claussen, M. J. 1986, ApJ, 304, 401. doi:10.1086/164174


| Source name | Duration | |||||||||
|---|---|---|---|---|---|---|---|---|---|---|
| (10-12 W m-2) | (10-12 W m-2) | (kpc) | (km s-1) | (10-5 yr-1) | (10-4 ) | (″) | (103yr) | |||
| IRAS 06530-0213 | 0.177 0.005 | 4.44 0.44 | 4.17 1.22 | 14.0 | 2.8 | 4.9 | 0.02 | 0.15 | 7.9 | 4.3 |
| IRAS 07134+1005 | 1.62 0.06 | 17.3 1.60 | 2.22 0.10 | 10.0 | 5.1 | 3.7 | 0.03 | 0.09 | 6.0 | 1.9 |
| IRAS 19500-1709 | 0.266 0.002 | 26.52 2.60 | 2.50 0.19 | 11.0 | 5.0 | 18.9 | 0.05 | 0.25 | 15.4 | 6.5 |
| IRAS 22272+5435 | 0.89 0.05 | 35.8 2.20 | 1.45 0.06 | 9.80 | 3.2 | 4.8 | 0.05 | 0.22 | 15.2 | 3.7 |
| IRAS 23304+6147 | 0.54 0.045 | 8.90 0.83 | 4.17 0.52 | 15.5 | 6.8 | 10.7 | 0.03 | 0.16 | 10.9 | 5.6 |
| IRAS Z02229+6208 | 0.34 0.02 | 25.6 1.95 | 2.63 0.42 | 14.8 | 6.4 | 6.9 | 0.02 | 0.15 | 10.4 | 3.6 |
Note. — The values of , , expansion velocity (), and inner and outer radius of the circumstellar shell ( and ) are taken from Mishra et al. (2015) and Mishra et al. (2016). The total dust mass () and the duration age from AGB stage are taken from Mishra et al. (2015) and Mishra et al. (2016), which have been scaled to the Gaia DR3 distance. The average mass-loss rate is deduced through the dust mass divided by the duration age under an assumption of the gas-to-dust mass ratio of 100.
| Frequency | Species | Transition | d | RMS | Dv | HPBW | ||||
|---|---|---|---|---|---|---|---|---|---|---|
| (MHz) | Upper-Lower | (km s-1) | (mK) | (mK km s-1) | (mK) | (km s-1) | (km s-1) | (″) | ||
| 115271.2 | CO | 14.9 1.1 | … | 58.0 | 917.8 80.5 | 20.2 | 31.6 | 0.6 | 48.2 | |
| 110201.4 | 13CO | ? | ? | 20 | 200 | 17.8 | ? | 2.0 | 50.4 | |
| 220398.7 | 13CO | 10.3 1.0 | -0.13 | 7.7 | 152.4 39.2 | 5.5 | 33.1 | 2.7 | 34.3 | |
| 109782.2 | C18O | ? | ? | 20 | 200 | 17.8 | ? | 2.0 | 50.6 | |
| 265886.4 | HCN | 10.8 0.2 | -0.83 | 103.4 | 1619.0 41.5 | 8.6 | 33.9 | 1.1 | 28.4 | |
| 259011.8 | H13CN | ? | ? | 10: | 115.2a | 5.9 | ? | 2.3 | 29.2 | |
| 271981.1 | HNC | 9.4 0.4 | 0.45 | 11.3 | 244.0 29.5 | 5.6 | 30.8 | 2.2 | 27.8 | |
| 219949.4 | SO | ? | ? | 5 | 50 | 3.6 | ? | 2.7 | 34.3 | |
| 217105.0 | SiO | ? | ? | 5 | 50 | 6.4 | ? | 2.8 | 34.8 | |
| 217817.6 | SiS | ? | ? | 5 | 50 | 6.8 | ? | 1.4 | 34.7 | |
| 272243.0 | SiS | ? | ? | 5 | 50 | 3.2 | ? | 2.2 | 27.7 | |
| 220773.7 | SiC2 | ? | ? | 5 | 50 | 4.7 | ? | 1.4 | 34.2 | |
| 226616.5 | CN | ? | ? | 1: | 292.1b | 3.8 | ? | 5.3 | 33.3 | |
| 226632.2 | CN | 3: | 3.8 | 5.3 | 33.3 | |||||
| 226659.5 | CN | 6: | 3.8 | 5.3 | 33.3 | |||||
| 226663.7 | CN | 6: | 3.8 | 5.3 | 33.3 | |||||
| 226679.3 | CN | 5: | 3.8 | 5.3 | 33.3 | |||||
| 226874.2 | CN | ? | ? | 4: | 340.4c | 4.4 | ? | 2.6 | 33.3 | |
| 226874.8 | CN | 4: | 4.4 | 2.6 | 33.3 | |||||
| 226875.9 | CN | 4: | 4.4 | 2.6 | 33.3 | |||||
| 226887.4 | CN | 4: | 4.4 | 2.6 | 33.3 | |||||
| 226892.2 | CN | 4: | 4.4 | 2.6 | 33.3 | |||||
| 226905.4 | CN | 4: | 4.4 | 2.6 | 33.3 | |||||
| 218324.7 | HC3N | ? | ? | 10: | 56.2a | 5.2 | ? | 1.4 | 34.6 | |
| 227418.9 | HC3N | ? | ? | 5 | 50 | 6.4 | ? | 1.3 | 33.2 |
Symbol:
? means the values that cannot be derived from our observations because of insufficient sensitivity.
means the values that cannot be obtained because of unsolved hyperfine structures.
: means uncertain measurements.
Note. — aafootnotetext: Obtained by integrating the main-beam temperature over the velocity coverage from 20–50 km s-1. bbfootnotetext: Obtained by integrating the main-beam temperature over the velocity coverage from -20–110 km s-1. ccfootnotetext: Obtained by integrating the main-beam temperature over the velocity coverage from -30–60 km s-1.
| Frequency | Species | Transition | d | RMS | Dv | HPBW | ||||
|---|---|---|---|---|---|---|---|---|---|---|
| (MHz) | Upper-Lower | (km s-1) | (mK) | (mK km s-1) | (mK) | (km s-1) | (km s-1) | (″) | ||
| 115271.2 | CO | 8.6 0.1 | -0.46 | 320.4 | 4666.5 175.3 | 87.8 | 73.6 | 1.4 | 48.2 | |
| 110201.4 | 13CO | ? | ? | 20 | 200 | 15.9 | ? | 2.0 | 50.4 | |
| 220398.7 | 13CO | 10.2 0.2 | 0.46 | 22.1 | 518.8 37.0 | 6.7 | 71.9 | 1.4 | 34.3 | |
| 109782.2 | C18O | ? | ? | 20 | 200 | 17.8 | ? | 2.0 | 50.6 | |
| 265886.4 | HCN | 10.9 0.2 | -0.47 | 91.9 | 1685.3 41.1 | 8.0 | 72.9 | 1.1 | 28.4 | |
| 259011.8 | H13CN | ? | ? | 5 | 50 | 3.4 | ? | 2.3 | 29.2 | |
| 271981.1 | HNC | ? | ? | 8: | 45.1a | 7.9 | ? | 1.1 | 27.8 | |
| 219949.4 | SO | ? | ? | 5 | 50 | 7.7 | ? | 1.4 | 34.3 | |
| 217105.0 | SiO | ? | ? | 50 | 6.8 | ? | 1.4 | 34.8 | ||
| 217817.6 | SiS | ? | ? | 50 | 5.0 | ? | 1.4 | 34.6 | ||
| 272243.0 | SiS | ? | ? | 5 | 50 | 6.1 | ? | 2.2 | 27.7 | |
| 220773.7 | SiC2 | ? | ? | 5 | 50 | 6.5 | ? | 1.4 | 34.2 | |
| 226616.5 | CN | ? | ? | 5: | 1542.7b | 5.0 | ? | 1.3 | 33.3 | |
| 226632.2 | CN | 20: | 5.0 | 1.3 | 33.3 | |||||
| 226659.5 | CN | 60: | 5.0 | 1.3 | 33.3 | |||||
| 226663.7 | CN | 40: | 5.0 | 1.3 | 33.3 | |||||
| 226679.3 | CN | 20: | 5.0 | 1.3 | 33.3 | |||||
| 226874.2 | CN | ? | ? | 25: | 1466.0c | 4.3 | ? | 1.3 | 33.3 | |
| 226874.8 | CN | 25: | 4.3 | 1.3 | 33.3 | |||||
| 226875.9 | CN | 25: | 4.3 | 1.3 | 33.3 | |||||
| 226887.4 | CN | 15: | 4.3 | 1.3 | 33.3 | |||||
| 226892.2 | CN | 15: | 4.3 | 1.3 | 33.3 | |||||
| 226905.4 | CN | 2: | 4.3 | 1.3 | 33.3 | |||||
| 218324.7 | HC3N | ? | ? | 5: | 73.1a | 6.3 | ? | 1.4 | 34.6 | |
| 227418.9 | HC3N | ? | ? | 5 | 50 | 4.6 | ? | 1.3 | 33.2 |
Note. — aafootnotetext: Obtained by integrating the main-beam temperature over the velocity coverage from 60–85 km s-1. bbfootnotetext: Obtained by integrating the main-beam temperature over the velocity coverage from 20–150 km s-1. ccfootnotetext: Obtained by integrating the main-beam temperature over the velocity coverage from 30–1000 km s-1.
| Frequency | Species | Transition | d | RMS | Dv | HPBW | ||||
|---|---|---|---|---|---|---|---|---|---|---|
| (MHz) | Upper-Lower | (km s-1) | (mK) | (mK km s-1) | (mK) | (km s-1) | (km s-1) | (″) | ||
| 115271.2 | CO | 7.4 0.8 | 0.82 | 67.8 | 1284.5 140.6 | 29.8 | 23.3 | 1.9 | 48.2 | |
| 29.5 2.4 | 3.20 | 13.6 | 1652.0 275.9 | 29.8 | 18.1 | 1.9 | 48.2 | |||
| 110201.4 | 13CO | ? | ? | 20 | 200 | 23.0 | ? | 2.0 | 50.4 | |
| 220398.7 | 13CO | 10.9 0.1 | -1.00 | 52.1 | 756.6 45.8 | 6.8 | 25.0 | 1.4 | 34.3 | |
| 29.1 1.2 | -0.84 | 21.2 | 887.2 63.2 | 6.8 | 20.8 | 1.4 | 34.3 | |||
| 109782.2 | C18O | ? | ? | 20 | 200 | 17.8 | ? | 2.0 | 50.6 | |
| 265886.4 | HCN | 32.7 1.9 | -0.57 | 11.9 | 631.9: | 5.6 | 23.4 | 2.3 | 28.4 | |
| 259011.8 | H13CN | ? | ? | 5 | 50 | 9.0 | ? | 2.3 | 29.2 | |
| 271981.1 | HNC | ? | ? | 20: | 288.3a | 14.4 | ? | 1.1 | 27.8 | |
| 219949.4 | SO | ? | ? | 5 | 50 | 6.4 | ? | 1.4 | 34.3 | |
| 217105.0 | SiO | ? | ? | 10: | 161.5a | 5.8 | ? | 1.4 | 34.8 | |
| 217817.6 | SiS | ? | ? | 10: | 110.8a | 6.3 | ? | 1.4 | 34.7 | |
| 272243.0 | SiS | ? | ? | 10: | 105.0a | 12.2 | ? | 2.2 | 27.7 | |
| 220773.7 | SiC2 | ? | ? | 5 | 50 | 8.0 | ? | 1.4 | 34.2 | |
| 226616.5 | CN | ? | ? | 1: | 558.0b | 4.4 | ? | 5.3 | 33.3 | |
| 226632.2 | CN | 4: | 4.4 | 5.3 | 33.3 | |||||
| 226659.5 | CN | 6: | 4.4 | 5.3 | 33.3 | |||||
| 226663.7 | CN | 6: | 4.4 | 5.3 | 33.3 | |||||
| 226679.3 | CN | 2: | 4.4 | 5.3 | 33.3 | |||||
| 226874.2 | CN | ? | ? | 7: | 654.1c | 2.9 | ? | 2.6 | 33.3 | |
| 226874.8 | CN | 7: | 2.9 | 2.6 | 33.3 | |||||
| 226875.9 | CN | 7: | 2.9 | 2.6 | 33.3 | |||||
| 226887.4 | CN | 15: | 2.9 | 2.6 | 33.3 | |||||
| 226892.2 | CN | 8: | 2.9 | 2.6 | 33.3 | |||||
| 226905.4 | CN | 4: | 2.9 | 2.6 | 33.3 | |||||
| 218324.7 | HC3N | ? | ? | 5 | 50 | 6.3 | ? | 1.4 | 34.6 | |
| 227418.9 | HC3N | ? | ? | 5 | 50 | 6.3 | ? | 1.3 | 33.2 |
Note. — aafootnotetext: Obtained by integrating the main-beam temperature over the velocity coverage from -15–60 km s-1. bbfootnotetext: Obtained by integrating the main-beam temperature over the velocity coverage from -30–110 km s-1. ccfootnotetext: Obtained by integrating the main-beam temperature over the velocity coverage from -30–50 km s-1.
| Frequency | Species | Transition | d | RMS | Dv | HPBW | ||||
|---|---|---|---|---|---|---|---|---|---|---|
| (MHz) | Upper-Lower | (km s-1) | (mK) | (mK km s-1) | (mK) | (km s-1) | (km s-1) | (″) | ||
| 115271.2 | CO | 8.4 0.1 | -0.71 | 460.6 | 5938.5 110.7 | 72.2 | -28.5 | 0.6 | 48.2 | |
| 110201.4 | 13CO | 6.8 0.5 | 1.06 | 16.9 | 310.1 66.6 | 14.0 | -28.1 | 1.3 | 50.4 | |
| 109782.2 | C18O | ? | ? | 20 | 200 | 17.8 | ? | 2.0 | 50.6 |
| Frequency | Species | Transition | d | RMS | Dv | HPBW | ||||
|---|---|---|---|---|---|---|---|---|---|---|
| (MHz) | Upper-Lower | (km s-1) | (mK) | (mK km s-1) | (mK) | (km s-1) | (km s-1) | (″) | ||
| 115271.2 | CO | 10.3 0.6 | -0.44 | 121.2 | 2142.4 210.9 | 27.5 | -16.2 | 1.4 | 48.2 | |
| 110201.4 | 13CO | ? | ? | 20 | 200 | 11.3 | ? | 2.0 | 50.4 | |
| 220398.7 | 13CO | 9.2 0.6 | 0.86 | 24.9 | 328.8 37.6 | 5.6 | -17.5 | 1.4 | 34.3 | |
| 21.8 0.5 | 11.5 | 0.9 | 182.1 42.6 | 5.6 | -16.5 | 1.4 | 34.3 | |||
| 109782.2 | C18O | ? | ? | 20 | 200 | 17.8 | ? | 2.0 | 50.6 | |
| 265886.4 | HCN | 9.0 1.1 | -0.71 | 83.8 | 1150.1 22.2 | 10.8 | -13.5 | 1.1 | 28.4 | |
| 22.2 1.1 | -0.47 | 36.8 | 1379.3 22.2 | 10.8 | -16.7 | 1.1 | 28.4 | |||
| 259011.8 | H13CN | 11.8 0.1 | -0.27 | 22.9 | 493.5 75.9 | 14.3 | -14.7 | 1.2 | 29.2 | |
| 271981.1 | HNC | 11.3 1.9 | -0.72 | 29.1 | 500.4 50.8 | 10.1 | -17.2 | 1.1 | 27.8 | |
| 219949.4 | SO | ? | ? | 5 | 50 | 6.7 | ? | 1.4 | 34.3 | |
| 217105.0 | SiO | ? | ? | 5 | 50 | 5.1 | ? | 1.4 | 34.8 | |
| 217817.6 | SiS | ? | ? | 5 | 50 | 2.9 | ? | 2.8 | 34.7 | |
| 272243.0 | SiS | ? | ? | 5 | 50 | 4.1 | ? | 1.1 | 27.7 | |
| 220773.7 | SiC2 | ? | ? | 5 | 50 | 4.7 | ? | 1.4 | 34.2 | |
| 226616.5 | CN | ? | ? | 1: | 773.9a | 3.9 | ? | 2.6 | 33.3 | |
| 226632.2 | CN | 9: | 3.9 | ? | 2.6 | 33.3 | ||||
| 226659.5 | CN | 20: | 3.9 | ? | 2.6 | 33.3 | ||||
| 226663.7 | CN | 12: | 3.9 | ? | 2.6 | 33.3 | ||||
| 226679.3 | CN | 10: | 3.9 | ? | 2.6 | 33.3 | ||||
| 226874.2 | CN | ? | ? | 20: | 793.5b | 5.5 | ? | 1.3 | 33.3 | |
| 226874.8 | CN | 20: | 5.5 | ? | 1.3 | 33.3 | ||||
| 226875.9 | CN | 20: | 5.5 | ? | 1.3 | 33.3 | ||||
| 226887.4 | CN | 5: | 5.5 | ? | 1.3 | 33.3 | ||||
| 226892.2 | CN | 10: | 5.5 | ? | 1.3 | 33.3 | ||||
| 226905.4 | CN | 1: | 5.5 | ? | 1.3 | 33.3 | ||||
| 218324.7 | HC3N | ? | ? | 5 | 50 | 7.1 | ? | 1.4 | 34.6 | |
| 227418.9 | HC3N | ? | ? | 10: | 267.1c | 6.4 | ? | 1.3 | 33.2 |
Note. — aafootnotetext: Obtained by integrating the main-beam temperature over the velocity coverage from -80–80 km s-1. bbfootnotetext: Obtained by integrating the main-beam temperature over the velocity coverage from -70–10 km s-1. ccfootnotetext: Obtained by integrating the main-beam temperature over the velocity coverage from -40–5 km s-1.
| Frequency | Species | Transition | d | RMS | Dv | HPBW | ||||
|---|---|---|---|---|---|---|---|---|---|---|
| (MHz) | Upper-Lower | (km s-1) | (mK) | (mK km s-1) | (mK) | (km s-1) | (km s-1) | (″) | ||
| 115271.2 | CO | 9.7 0.2 | -0.91 | 179.5 | 2435.1 186.3 | 42.8 | 23.9 | 0.6 | 48.2 | |
| 14.4 0.1 | -0.63 | 117.9 | 2688.0 357.8 | 42.8 | 23.8 | 0.6 | 48.2 | |||
| 110201.4 | 13CO | 5.2 1.1 | 4.97 | 7.3 | 202.1 109.0 | 15.6 | 20.9 | 1.3 | 50.4 | |
| 15.2 0.9 | -0.05 | 26.4 | 791.8 196.9 | 15.6 | 24.3 | 1.3 | 50.4 | |||
| 220398.7 | 13CO | 8.6 0.3 | -0.09 | 53.2 | 885.0 67.0 | 4.2 | 23.7 | 1.4 | 34.3 | |
| 17.8 0.7 | -0.21 | 13.7 | 454.0 105.6 | 4.2 | 22.5 | 1.4 | 34.3 | |||
| 109782.2 | C18O | ? | ? | 20 | 200 | 17.8 | ? | 2.0 | 50.6 | |
| 265886.4 | HCN | 8.2 0.2 | -0.61 | 244.7 | 3197.8 148.9 | 13.8 | 25.3 | 1.1 | 28.4 | |
| 16.9 0.2 | 0.06 | 53.5 | 1849.5 174.6 | 13.8 | 23.1 | 1.1 | 28.4 | |||
| 259011.8 | H13CN | 10.1 0.1 | -0.89 | 126.2 | 1795.2 36.4 | 7.6 | 24.9 | 1.2 | 29.2 | |
| 15.6 0.2 | 0.44 | 18.6 | 666.6 48.7 | 7.6 | 23.1 | 1.2 | 29.2 | |||
| 271981.1 | HNC | 10.4 0.3 | -0.61 | 49.3 | 817.2 37.9 | 7.6 | 24.3 | 1.1 | 27.8 | |
| 219949.4 | SO | ? | ? | 5 | 50 | 7.9 | ? | 1.4 | 34.3 | |
| 254573.6 | SO | ? | ? | 5 | 50 | 4.7 | ? | 1.2 | 29.7 | |
| 217105.0 | SiO | ? | ? | 5 | 50 | 7.5 | ? | 1.4 | 34.8 | |
| 217817.6 | SiS | ? | ? | 5: | 71.6a | 5.4 | ? | 1.4 | 34.7 | |
| 272243.0 | SiS | ? | ? | 5 | 50 | 6.3 | ? | 1.1 | 27.7 | |
| 220773.7 | SiC2 | ? | ? | 5 | 50 | 10.5 | ? | 1.4 | 34.2 | |
| 226616.5 | CN | ? | ? | 1: | 675.1b | 2.7 | ? | 2.6 | 33.3 | |
| 226632.2 | CN | 6: | 2.7 | 2.6 | 33.3 | |||||
| 226659.5 | CN | 7: | 2.7 | 2.6 | 33.3 | |||||
| 226663.7 | CN | 7: | 2.7 | 2.6 | 33.3 | |||||
| 226679.3 | CN | 8: | 2.7 | 2.6 | 33.3 | |||||
| 226874.2 | CN | ? | ? | 7: | 760.0c | 5.5 | ? | 2.6 | 33.3 | |
| 226874.8 | CN | 7: | 5.5 | 2.6 | 33.3 | |||||
| 226875.9 | CN | 7: | 5.5 | 2.6 | 33.3 | |||||
| 226887.4 | CN | 5: | 5.5 | 2.6 | 33.3 | |||||
| 226892.2 | CN | 7: | 5.5 | 2.6 | 33.3 | |||||
| 226905.4 | CN | 1: | 5.5 | 2.6 | 33.3 | |||||
| 218324.7 | HC3N | 10.3 0.4 | 0.96 | 8.9 | 242.4 38.4 | 6.8 | 26.8 | 1.4 | 34.6 | |
| 227418.9 | HC3N | 11.5 0.4 | -0.06 | 12.3 | 278.1 29.9 | 6.3 | 26.4 | 1.3 | 33.2 | |
| 254699.5 | HC3N | 17.0 0.6 | -0.23 | 8.7 | 273.3 29.9 | 4.8 | 24.7 | 1.2 | 29.7 |
Note. — aafootnotetext: Obtained by integrating the main-beam temperature over the velocity coverage from 5–40 km s-1. aafootnotetext: Obtained by integrating the main-beam temperature over the velocity coverage from -10–90 km s-1. aafootnotetext: Obtained by integrating the main-beam temperature over the velocity coverage from -20–50 km s-1.
| Object | Species | (cm-2) | |
|---|---|---|---|
| IRAS 06530-0213 | CO | (1.77 0.16) 1017 | (5.61 0.52) 10-4 |
| 13CO | (7.31 1.88) 1015 | (1.02 0.26) 10-5 | |
| H13CN | 2.56: 1012 | 1.59: 10-9 | |
| HCN | (3.26 0.08) 1013 | (9.11 0.23) 10-8 | |
| HNC | (4.20 0.51) 1012 | (8.44 1.02) 10-9 | |
| CN | 8.95: 1013 | 4.30: 10-8 | |
| SO | 1.66 1013 | 4.83 10-8 | |
| SiO | 1.94 1012 | 5.68 10-9 | |
| SiS | 9.96 1012 | 2.91 10-8 | |
| SiC2 | 3.24 1013 | 5.85 10-8 | |
| HC3N | 4.91: 1012 | 1.43: 10-8 | |
| IRAS 07134+1005 | CO | (1.40 0.05) 1018 | (9.95 0.37) 10-4 |
| 13CO | (4.25 0.30) 1016 | (1.34 0.10) 10-5 | |
| H13CN | 1.88 1012 | 2.66 10-10 | |
| HCN | (5.75 0.14) 1013 | (3.66 0.09) 10-8 | |
| HNC | 1.31: 1012 | 6.02: 10-10 | |
| CN | 7.22: 1014 | 8.15: 10-8 | |
| SO | 2.83 1013 | 1.87 10-8 | |
| SiO | 6.78 1012 | 4.48 10-9 | |
| SiS | 4.23: 1013 | 2.79: 10-8 | |
| SiC2 | 5.54 1013 | 2.26 10-8 | |
| HC3N | 1.09: 1013 | 7.21: 10-9 | |
| IRAS 19500-1709 | CO | (1.42 0.20) 1017 | (2.40 0.34) 10-4 |
| 13CO | (3.93 0.26) 1016 | (1.67 0.11) 10-5 | |
| H13CN | 3.47 1011 | 1.07 10-10 | |
| HCN | 4.01: 1012 | 5.51: 10-9 | |
| HNC | 1.57: 1012 | 1.55: 10-9 | |
| CN | 5.16: 1013 | 1.25: 10-8 | |
| SO | 4.95 1012 | 7.34 10-9 | |
| SiO | 1.87: 1012 | 2.79: 10-9 | |
| SiS | 6.58: 1012 | 9.79: 10-9 | |
| SiC2 | 7.70 1012 | 8.89 10-9 | |
| HC3N | 1.30 1012 | 1.94 10-9 | |
| IRAS 22272+5435 | CO | (1.01 0.11) 1016 | (4.06 0.08) 10-4 |
| 13CO | (3.38 0.36) 1015 | (1.63 0.04) 10-5 | |
| H13CN | (2.71 0.04) 1013 | (6.86 0.11) 10-9 | |
| HCN | (3.27 0.01) 1013 | (4.80 0.07) 10-8 | |
| HNC | (8.49 0.28) 1012 | (6.90 0.23) 10-9 | |
| CN | 8.67: 1013 | 1.74: 10-8 | |
| SO | … | … | |
| SiO | 2.83 1012 | 3.47 10-9 | |
| SiS | 3.02: 1012 | 8.90: 10-9 | |
| SiC2 | 4.14: 1013 | 7.45: 10-9 | |
| HC3N | (1.70 0.16) 1013 | (2.05 0.18) 10-8 | |
| IRAS 23304+6147 | CO | (1.97 0.19) 1017 | (4.04 0.40) 10-4 |
| 13CO | (1.19 0.14) 1016 | (1.06 0.04) 10-5 | |
| H13CN | (6.04 0.93) 1012 | (2.36 0.36) 10-9 | |
| HCN | (2.82 0.05) 1013 | (4.95 0.07) 10-8 | |
| HNC | (4.78 0.49) 1012 | (6.02 0.61) 10-9 | |
| CN | 1.23: 1014 | 3.76: 10-8 | |
| SO | 8.99 1012 | 1.67 10-8 | |
| SiO | 1.05 1012 | 1.96 10-9 | |
| SiS | 5.40 1012 | 1.01 10-8 | |
| SiC2 | 1.76 1013 | 2.02 10-8 | |
| HC3N | 2.37: 1012 | 2.29: 10-8 | |
| IRAS Z02229+6208 | CO | (5.20 0.55) 1017 | (6.21 0.66) 10-4 |
| 13CO | (3.83 0.51) 1016 | (1.99 0.26) 10-5 | |
| H13CN | (3.30 0.11) 1013 | (7.54 0.26) 10-9 | |
| HCN | (6.16 0.39) 1013 | (6.32 0.40) 10-8 | |
| HNC | (8.54 0.40) 1012 | (6.29 0.29) 10-9 | |
| CN | 1.22: 1014 | 2.17: 10-8 | |
| SO | 9.88 1012 | 1.07 10-8 | |
| SiO | 1.16 1012 | 1.26 10-9 | |
| SiS | 8.50: 1012 | 9.22: 10-9 | |
| SiC2 | 1.93 1013 | 1.29 10-8 | |
| HC3N | (1.37 0.76) 1013 | (1.45 0.19) 10-8 |
| Species | 21 m objectsa | RSDb | CRL 2688c | IRC+10216d |
|---|---|---|---|---|
| CO | (5.38 2.61) 10-4 | 49 | … | 1.00e 10-3 |
| 13CO | (1.47 0.36) 10-5 | 24 | … | 2.86f 10-5 |
| HCN | (4.90 2.84) 10-8 | 58 | 1.54 10-7 | 1.40 10-5 |
| H13CN | (4.59 3.05) 10-9 | 66 | 5.34 10-7 | 3.10 10-7 |
| HNC | (4.97 3.14) 10-9 | 63 | 3.01 10-8 | 7.20 10-8 |
| CN | (3.56 2.54) 10-8 | 71 | 8.67 10-6 | 2.18 10-6 |
| SiO | 2.79: 10-9 | … | 9.07 10-9 | 1.30 10-7 |
| SiS | (1.31 0.79) 10-8 | 61 | 1.18 10-7 | 1.05 10-6 |
| SiC2 | 7.45: 10-9 | … | 1.05 10-7 | 2.40 10-7 |
| HC3N | (1.36 0.79) 10-8 | 58 | 1.15 10-7 | 1.25 10-6 |
| HNC/HCN | (1.26 0.87) 10-1 | 69 | 0.20 | 5.14 10-3 |
| CN/HCN | 1.61 1.39 | 86 | 56.3 | 0.16 |
| 13CO/ | (4.82 1.30) 1013 | 27 | … | … |
| /g | (3.93 1.11) 10-6 | 28 | 3.17 10-14 | 2.63 10-14 |
| / | (3.56 2.66) 10-2 | 75 | … | … |
Note. — aafootnotetext: The average values of fractional abundances of each species with a standard deviation. bbfootnotetext: The relative standard deviation (RSD) is the ratio between the standard deviation and the average value. ccfootnotetext: Taken from Qiu et al. (2022). ddfootnotetext: Taken from Woods et al. (2003b). eefootnotetext: Taken from Agundez (2009). fffootnotetext: Obtained by scaling the (CO) value to the 12C/13C ratio of 35 from Agundez et al. (2012). ggfootnotetext: In yr-1 km s-1.
| Objects | CO/13CO | CO/13CO | HCN/H13CN | CO/C18O |
|---|---|---|---|---|
| =1–0 | =2–1 | =3–2 | =1–0 | |
| IRAS 06530-0213 | 1.0a | 15.9 6.3 | 14.1: | 5.1 |
| IRAS 07134+1005 | 7.8a | 19.2 3.5 | 11.2c | 23.3 |
| IRAS 19500-1709 | 4.9a | 3.6 0.6 | 4.2c | 14.7 |
| IRAS 22272+5435 | 19.1 4.1 | 9.2 0.3b | 1.7 0.1b | 29.7 |
| IRAS 23304+6147 | 3.6a | 6.7 2.3 | 5.1 0.8 | 10.7 |
| IRAS Z02229+6208 | 12.0 6.6d | 5.9 1.4 | 1.8 0.1d | 25.6 |
| 3.4 1.0e | … | 2.8 0.3e | … |
Note. — aafootnotetext: The non-detection of the 13CO line suggests that its integrated intensity is lower than 3. bbfootnotetext: Taken from Zhang (2020a). ccfootnotetext: The non-detection of the H13CN line suggests that its integrated intensity is lower than 3. ddfootnotetext: Derived from the broad line component. eefootnotetext: Derived from the narrow line component.
| CO | 13CO | HCN | H13CN | HNC | CN | HC3N | HNC/HCN | CN/HCN | 13CO/ | / | ||
|---|---|---|---|---|---|---|---|---|---|---|---|---|
| a | median | -2.70 | -5.11 | -6.46 | -10.23 | -8.95 | -6.33 | -8.26 | -2.39 | 0.66 | 13.25 | -5.50 |
| mean | -2.74 | -5.17 | -6.24 | -7.68 | -9.16 | -6.33 | -8.29 | -2.55 | 0.46 | 13.46 | -5.49 | |
| stdev | 0.89 | 0.46 | 2.37 | 18.60 | 3.18 | 0.70 | 2.72 | 2.06 | 2.69 | 1.20 | 0.90 | |
| b | median | 0.39 | -0.18 | 0.65 | -1.14 | -0.34 | 0.78 | -0.29 | -0.89 | 0.40 | -0.27 | -0.05 |
| mean | 0.38 | -0.22 | 0.74 | 0.88 | -0.45 | 0.78 | -0.25 | -1.00 | 0.24 | -0.13 | -0.04 | |
| stdev | 0.55 | 0.29 | 1.48 | 13.27 | 1.95 | 0.45 | 1.77 | 1.26 | 1.68 | 0.76 | 0.56 | |
| median | 0.67 | -0.84 | 0.53 | -0.45 | -0.28 | 0.95 | -0.46 | -0.78 | 0.41 | -0.80 | -0.13 | |
| mean | 0.49 | -0.65 | 0.38 | -0.25 | -0.18 | 0.82 | -0.26 | -0.59 | 0.26 | -0.56 | -0.07 | |
| stdev | 0.49 | 0.45 | 0.54 | 0.70 | 0.61 | 0.29 | 0.65 | 0.46 | 0.60 | 0.53 | 0.63 |
Note. — is the linear correlation coefficient.