Measuring the conditional luminosity and stellar mass functions of galaxies by combining the DESI LS DR9, SV3 and Y1 data
Abstract
In this investigation, we leverage the combination of Dark Energy Spectroscopic Instrument Legacy imaging Surveys Data Release 9 (DESI LS DR9), Survey Validation 3 (SV3), and Year 1 (Y1) data sets to estimate the conditional luminosity and stellar mass functions (CLFs & CSMFs) of galaxies across various halo mass bins and redshift ranges. To support our analysis, we utilize a realistic DESI Mock Galaxy Redshift Survey (MGRS) generated from a high-resolution Jiutian simulation. An extended halo-based group finder is applied to both MGRS catalogs and DESI observation. By comparing the and -band luminosity functions (LFs) and stellar mass functions (SMFs) derived using both photometric and spectroscopic data, we quantified the impact of photometric redshift (photo-z) errors on the galaxy LFs and SMFs, especially in the low redshift bin at low luminosity/mass end. By conducting prior evaluations of the group finder using MGRS, we successfully obtain a set of CLF and CSMF measurements from observational data. We find that at low redshift the faint end slopes of CLFs and CSMFs below (or ) evince a compelling concordance with the subhalo mass functions. After correcting the cosmic variance effect of our local Universe following Chen et al. (2019), the faint end slopes of the LFs/SMFs turn out to be also in good agreement with the slope of the halo mass function.
1 Introduction
Over the past few decades, large galaxy surveys, such as the Two-degree Field Galaxy Redshift Survey (2dFGRS, Colless 1999) and Sloan Digital Sky Survey (SDSS, York et al. 2000), have played a significant role in advancing our understanding of the galaxy formation and evolution. These surveys allow for various galaxy observable measurements, including the luminosity function (LF), stellar mass function (SMF), and two-point correlation function (2PCF) (Norberg et al., 2002; Blanton et al., 2003; Zehavi et al., 2005, 2011; Wang et al., 2007; Li & White, 2009; Zhao et al., 2020; Wang et al., 2021; Moustakas et al., 2013). Despite the absence of direct physical explanations of the galaxy formation and evolution, the statistical measurements provide essential constraints on multiple physical processes, including gravitational instability, gas cooling, star formation, merging, tidal stripping, heating, and feedback mechanisms. However, modeling the galaxy observables through physical processes remains a challenge, given the incomplete understanding of these processes (Naab & Ostriker, 2017; Smercina et al., 2018; Katsianis et al., 2021; Sales et al., 2022).
Under the hypothesis that galaxies form within dark matter halos, empirical halo models provide a straightforward way to model galaxy observables and infer the relationship between galaxies and their host halos (Wechsler & Tinker, 2018; Katsianis et al., 2023). For instance, the halo occupation distribution (HOD, Jing et al. 1998; Peacock & Smith 2000; Tinker et al. 2005; Zheng et al. 2005, 2009; Brown et al. 2008; Zu & Mandelbaum 2015, 2016, 2018; Wang et al. 2019; Alam et al. 2020; Yuan et al. 2018, 2022) infers the number of galaxies of a specific type in halos of different masses, and the conditional luminosity function (CLF, Yang et al. 2003; van den Bosch et al. 2003, 2007; Yang et al. 2008; Cacciato et al. 2009; Yang et al. 2012) constrains the galaxy luminosity functions in halo of different masses. Additionally, the subhalo abundance matching (SHAM, Vale & Ostriker 2004; Conroy et al. 2006; Behroozi et al. 2010; Neistein et al. 2011; Guo et al. 2016) links the number density of galaxies above a luminosity (or stellar mass) threshold to the number density of subhalos above a mass (or circular velocity) threshold. These empirical models have significantly enhanced our understandings of the galaxy formation and evolution processes.
In addition to studies of the galaxy-halo connection through model fittings based on statistical measurements, an alternative method is introduced to identify individual dark matter halos observationally and measure the galaxy content within them. To this end, the halo-based group-finding algorithm (Yang et al., 2005b) has particular advantages in grouping galaxies within the same dark matter halos. The group finder has been extensively tested and applied to galaxy samples with spectroscopic redshifts (Yang et al., 2005b, 2007). During the past decade, attempts have been made to improve halo mass estimations in the group finders under different scenarios (e.g. Old et al., 2014, 2015; Lu et al., 2015; Wang et al., 2020; Tinker et al., 2021a; Yang et al., 2021). Within this framework, Yang et al. (2021) extended the halo-based group finder so that it can deal with galaxies with photometric and spectroscopic redshifts simultaneously, which significantly broadened its application scope. The CLFs and conditional stellar mass functions (CSMFs) have been successfully measured from the 2dFGRS, SDSS, HSC and DECaLS observations (e.g. Yang et al., 2005a, 2008, 2009; Lan et al., 2016; To et al., 2020; Meng et al., 2023; Golden-Marx et al., 2022; Wang et al., 2021; Tinker et al., 2021b).
In this study, we explore the LFs, SMFs, CLFs and CSMFs (central and satellite) of galaxies across different halo mass bins and redshift ranges through galaxy and group catalogues constructed by Yang et al. (2021) from the DESI Image Legacy Surveys DR9 sample in redshift range of , which has a selection of apparent magnitudes down to . We seek to evaluate the impact of photometric redshift and spectroscopic completness on the LFs and SMFs, with a particular focus on the faint end, by making full use of the first year of spectroscopic observation data. Furthermore, we utilize a DESI mock galaxy redshift survey (MGRS) based on a high-precision Jiutian simulation to perform the same statistical measurements using the same group finder employed in DESI observations, which facilitates the evaluation of systematic biases, and allows for a more accurate investigation of the history of galaxy formation and evolution in future studies. Our galaxy samples are subject to observational effects, particularly in terms of the spectroscopic sampling. With the benefit from the extension version of the group finder, we expect for more reliable CLFs and CSMFs from DESI observations guided by simulated mock data.
In Section 2, we detail the photometric and spectroscopic data, including the construction of group catalogs and the sample selection for estimations of LFs, SMFs, CLFs, and CSMFs implemented in this paper. In Section 3, we investigate the impact of photo-z errors on the measurements of LFs and SMFs. In Section 4, we use a MGRS to provide reliability verification of CLF measurements based on groups detected by the group finder. In Section 5, we present the CLFs and CSMFs based on the observational data. Finally, we discuss and summarize our results in Section 6 and 7.
Throughout this paper, we use CDM cosmology with parameters that are consistent with the Planck 2018 results (Planck Collaboration et al., 2020a): , , and . Unless otherwise Specified, luminosity (stellar mass) and halo masses are presented in units of () and , respectively. The luminosity (stellar mass) functions are presented in units of (), where is the 10-based logarithm. The units of the conditional luminosity (stellar mass) function are group and group.
2 Observational data
| Sample ID | sky coverage | magnitude cut | redshift cut | total | central | satellite | spec-z percent |
|---|---|---|---|---|---|---|---|
| () | () | ||||||
| SV3-r19.5 | 133 | z | 93943 | 73785 | 20158 | 99.2 | |
| SV3-z19.0 | 133 | z | 120392 | 96016 | 24376 | 95.2 | |
| Y1-r19.5 | 12276 | z | 8464733 | 6484281 | 1980452 | 46.4 | |
| Y1-z19.0 | 12276 | z | 10912062 | 8424354 | 2487708 | 44.3 |
In this section, we describe the construction of galaxy samples from DESI observational data utilized in this study. The general overview and instrument of DESI can be found in a series of papers (DESI Collaboration et al., 2016a, b, 2022; Levi et al., 2013; Silber et al., 2023; Miller et al., 2023). Overall, the galaxy sample is constructed by integrating a seed galaxy catalog, which is primarily based on the DESI Legacy imaging survey, with the data gathered from previous spectroscopic surveys and DESI up to the first year observation. Subsequently, group memberships are assigned using our extended adaptive halo-based group finder (e.g. Yang et al., 2005b, 2007, 2021).
2.1 DESI Legacy Imaging Surveys DR9
The Legacy Surveys Data Release 9 (LS DR9) is the basis of the seed catalog, which includes three optical bands (grz) from the Beijing-Arizona Sky Survey (BASS, Zou et al. (2017)), the Mayall z-band Legacy Survey (MzLS), and the DECam Legacy Survey (DECaLS, Dey et al. (2019)). The DR9 also includes deeper optical data from the Dark Energy Survey (DES, The Dark Energy Survey Collaboration (2005)). The optical bands of LS DR9 provide a 5 detection of 24/23.4/22.5 AB magnitude with a half-light radius of . The target selections and survey validation of DESI observational data are described in details by DESI Collaboration et al. (2023a, b); Lan et al. (2023); Alexander et al. (2023); Cooper et al. (2022); Hahn et al. (2022); Zhou et al. (2023); Raichoor et al. (2023); Chaussidon et al. (2023); Allende Prieto et al. (2020); Ruiz-Macias et al. (2020); Zhou et al. (2020); Raichoor et al. (2020); Yèche et al. (2020a); Myers et al. (2023). We use the photometric redshift (photo-z) from The Photometric Redshifts for the Legacy Surveys (PRLS) catalogue (Zhou et al., 2021), who estimates photo-z by combining the optical and two mid-infrared photometry (W1 3.4m and W2 4.6m) from the Wide-field Infrared Survey Explorer (WISE). Zhou et al. (2021) demonstrates that the reliability of photo-z estimation diminishes beyond a -band apparent magnitude of . Therefore, the -band apparent magnitude of our primary galaxy sample is limited to . While the overall selection of galaxies for this study closely follows that of Yang et al. (2021), a few modifications have been implemented to accommodate the transition from LS DR8 to LS DR9. Details about our sample selection are outlined below.
To mitigate the potential contamination, it is imperative to exclude stars and Active Galactic Nuclei (AGNs) from galaxy samples. Benefiting from the morphological classification that identifies six distinct morphological types in DR9111This classification is facilitated by a software package called THE TRACTOR, as referenced in Lang et al. (2016). THE TRACTOR is also used for source detection and optical photometry. See more details at https://www.legacysurvey.org/dr9/description/##morphological-classification, we start by eliminating objects of the PSF and DUP types from the galaxy sample. The remianing extended sources with morphological classification of REX, EXP, DEV, and SER consist our galaxy sample (similar to Yang et al. 2021).
To ensure photometric quality of our objects, constraints are imposed through the similar procedures as those described in (Zou et al., 2019; Zhou et al., 2020, 2021; Ruiz-Macias et al., 2020; Raichoor et al., 2020; Yèche et al., 2020b; Moustakas et al., 2023). We require that each object has at least one exposure in each optical band. Objects located near the Galactic plane (, where is the Galactic latitude) are eliminated to avoid regions of high stellar density. Additionally, the following bit numbers in the MASKBITS columns are used: 1 (close to Tycho-2 and GAIA bright stars), 5, 6, and 7 (close to objects which have the bits set), 8 (close to WISE W1 bright stars), 9 (close to WISE W2 bright stars), 11 (close to fainter GAIA stars), 12, and 13 (close to a local large galaxy and globular cluster, respectively). We use these selection condition to remove the objects that are contaminated or blended. In addition to the MASKBITS, other quality flags are employed to remove the flux contaminations from nearby sources (FRACFLUX) or masked pixels (FRACMASKED):
where , and . The purpose of FRACIN is to select the objects for which a large fraction of the model flux is in the contiguous pixels where the model was fitted. Note that all the magnitudes used in this paper are in the AB system and have been corrected for Galactic extinction by using the Galactic transmission values provided in DR9.
Following these criteria, we obtain a seed catalog of 138,315,649 galaxies. Most of these galaxies only contain photometric redshifts, which are the median values of the photo-z, z_phot_median, from the PRLS catalog. Approximately 3.7 million galaxies include spectroscopic redshifts collected from previous redshift surveys by Zhou et al. (2021) and Lim et al. (2017). The redshifts and properties of galaxies are updated using the DESI spectroscopic data in Section 2.2.
| 0.0-0.2 | 0.2-0.4 | 0.4-0.6 | ||||||||
|---|---|---|---|---|---|---|---|---|---|---|
| a | b | c | a | b | c | a | b | c | ||
| rband | blue | -2.35 | 1.09 | -0.20 | 1.81 | -0.53 | -0.30 | 0.06 | 1.59 | -1.26 |
| red | 0.84 | 0.78 | -0.19 | 2.05 | 0.21 | -0.53 | 3.85 | -0.83 | -1.00 | |
| total | 0.13 | 0.80 | -0.19 | 2.35 | -0.21 | -0.43 | 1.16 | 1.32 | -1.40 | |
| zband | blue | 1.66 | -0.49 | -0.07 | 1.13 | -0.82 | -0.12 | 2.62 | -1.98 | -0.10 |
| red | 1.65 | -0.19 | -0.10 | 0.25 | 0.32 | -0.40 | 1.62 | -1.00 | -0.34 | |
| total | 2.24 | -0.45 | -0.08 | 0.82 | -0.17 | -0.30 | 1.82 | -1.19 | -0.29 | |
2.2 DESI spectroscopic data and group finder
We make use of the most recent spectroscopic observation data (up to the first year observation) from the fastspecfit Value-Added Catalogs (version 1.0222https://fastspecfit.readthedocs.io/en/latest/fuji.html
https://fastspecfit.readthedocs.io/en/latest/guadalupe.html
https://fastspecfit.readthedocs.io/en/latest/iron.html), which contains three spectroscopic products, Fuji, Guadalupe and Iron (e.g. Guy et al., 2023; Brodzeller et al., 2023; Moustakas, 2023; Schlafly et al., 2023).
Iron is the most comprehensive collection of spectral data available, containing 7.8 million spectra of galaxies. We combine the fitting results of Fuji, Guadalupe, and Iron. For a galaxy with a unique target ID but multiple observations, we use the recommended “best” redshift with high quality in the combined catalogs across surveys and programs. The DESI Legacy imaging Surveys (LS) guides the fiber assignment of the DESI spectroscopic survey. Therefore, our seed catalog, which primarily utilizes photometric redshift, can be updated with the measurements derived from DESI spectra. The updated seed catalog is employed in the following analyses.
The extended group finder has been implemented to identify the membership of groups and estimate group mass using both photometric and spectroscopic data. We have noticed that a subset of galaxies lacks measurements in one or more of the five bands of , despite having assigned photo-z values. Given the typical uncertainty associated with the photo-z of these galaxies, we have excluded them from the group finding process but retained them in the LF/SMF and CLF/CSMF measurements (see Section 3.1 for more details).
By applying the extended halo-based group finder to the updated seed catalog, a group catalog is created that covers a wide range of redshifts and halo masses. According to Yang et al. (2021), the extended halo-based group finder is highly successful in identifying more than 60 percent of the members in almost 90 percent of halos with masses greater than for galaxies with magnitudes and photometric redshifts in the range in the DESI legacy imaging surveys333Better performance can be achieved in a spectroscopic redshift sample (see Yang et al., 2007).. The group catalog provides useful information about the host halo properties of galaxies, such as halo mass and local environments, and the central/satellite classification. Since the majority of the galaxies only have photometric redshifts, the entire sample is categorized as LS DR9.
2.3 Sample selection
In this paper, we consider three regions in the sky coverage with different levels of spectroscopic completeness:
-
•
The whole region of the updated seed galaxy catalog with a magnitude limit , constructed from LS DR9 and the DESI spectroscopic survey, which is primarily used to find the groups;
-
•
The Y1 region with an approximate spectral completeness after BGS magnitude cuts and a wide sky coverage of 12276 , which is used to measure the CLFs and CSMFs.
-
•
The SV3 region with the highest spectral completeness (over 95%) after BGS magnitude cuts, which is used as a benchmark to investigate the effect of photo-z on the LF and SMF measurements.
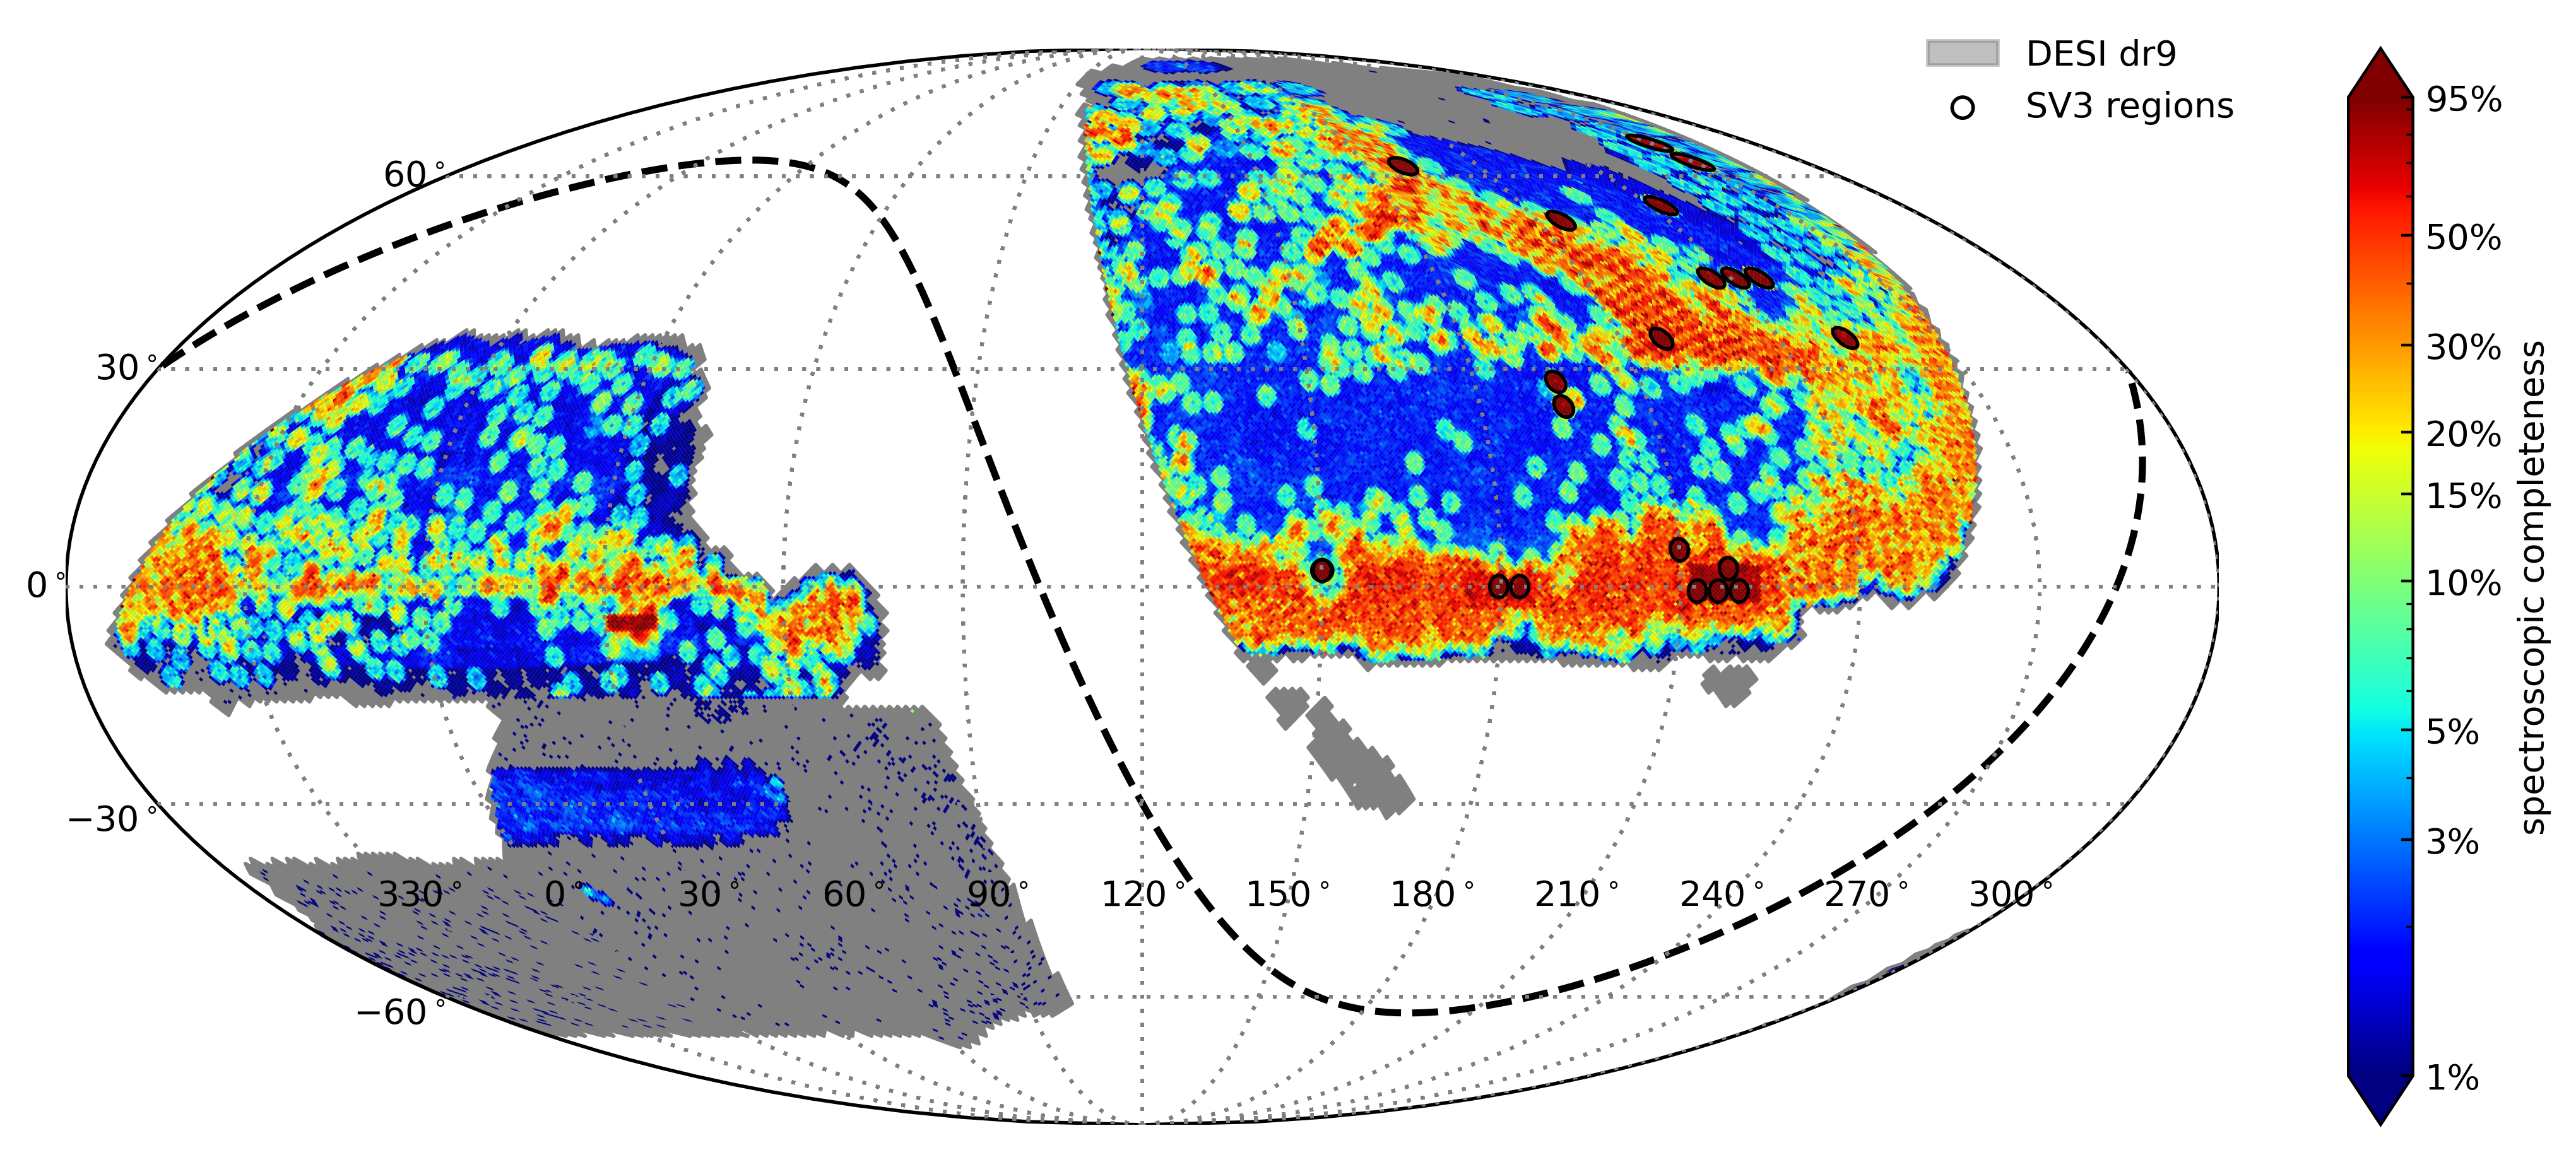
The SV3 region and Y1 region are defined by a set of rosettes and tiles using the caps at a given radius respectively, while the overall footprint of the seed catalog is mapped using the healpix tool (Górski et al., 2005b). This tool divides the spherical surface into subdivisions, each of which covers the same surface area. We set the parameter , which corresponds to per subdivision. Subdivisions with at least one galaxy are treated as part of the footprint. Figure 1 shows the sky coverage of the spectroscopic data used in this study. The SV3 region is marked by black circles, while the Y1 region is indicated by the color gradient area from cyan to red. The color coding represents the spectroscopic completeness calculated with respect to the total galaxies of . The remaining regions, characterized by gray and blue, primarily lack spectroscopic data and mainly contribute to the group finder.
To ensure a higher rate of spectroscopic redshift completeness and a reasonable sampling, we restrict our analysis to the galaxy sample with and , which is in line with the selection criteria of the DESI Bright Galaxy Survey (BGS). It has been verified that galaxies in our sample with are almost identical to the targets of the BGS conducted by Hahn et al. (2023). Taking into account the magnitude difference between and -band, this roughly corresponds to . Combining the footprint and apparent magnitude cut, we define four sub-samples for our analysis and list the details in Table LABEL:tab:sample. In the first two, Y1-r19.5 and Y1-z19.0, nearly 45% of the galaxies have spectroscopic redshifts. For simplicity, we use Y1-BGS to refer to either Y1-r19.5 or Y1-z19.0 depending on the band we are using.
Within the Y1 region, the DESI 1% Survey (also known as SV3, which includes three spectroscopic productions but covers a smaller area) has a notably higher spectroscopic completeness, which is marked by black circles in Figure 1, and the spectroscopic completeness of the remaining area is relatively lower. The strategy of SV3 was mainly focused on guiding and validating the survey design. To achieve a high level of completeness, additional passes were conducted for each of the 20 rosettes within SV3. These passes covered an area of more than , extending up to 1.45 degrees from the center of each discrete region. Among these 20 rosettes, one rosette with celestial coordinates (194.75, 28.20) is centered in the Coma Cluster. As we will demonstrate in Figure B in the Appendix, the inclusion of this rosette will significantly enhance the LFs (or SMFs) at , resulting in considerable cosmic variances. Consequently, we opted to exclude this rosette from our LF and SMF measurements. By applying the BGS selections mentioned above, the spectroscopic redshift completeness is overall larger than 95% with sky coverage. Here again, for simplicity, we use SV3-BGS to represent the third and fourth sub-samples SV3-z19.0 or SV3-r19.5, depending on the band we are using. Despite the relatively limited sky coverage and the disconnection of SV3-BGS, the high redshift completeness allows for the verification of the impact of photo-z errors on LF and SMF measurements.
The group catalogs of SV3 and Y1 sub-samples are extracted from that of the LS DR9. The detailed selection criteria and the total number of galaxies, as well as the number of central and satellite galaxies in our four sub-samples, are listed in Table LABEL:tab:sample. This enables us to distinguish the contribution of central and satellites to the conditional luminosity function, affording valuable insights into the distribution of galaxies within groups.
2.4 Galaxy luminosity and stellar mass
Following Yang et al. (2021), for each galaxy passed to the group finder, we use the following function to convert apparent magnitude to absolute magnitude according to its redshift,
| (1) |
where stands for the particular band ( or ) we adopted. represents the -correction to -band shifted by the band-shift redshift, j, where , or 0.5 obtained from the ‘Kcorrect’ model (eg. v4_3) described in Blanton & Roweis (2007a). DM(z) is the distance module corresponding to redshift z defined as
| (2) |
with (z) being the luminosity distance in unit of .
In general, the average -correction can be described by the following function,
| (3) |
The coefficients are obtained by fitting to the mean values in redshift bins of width 0.01 for both red and blue galaxies which are categorized based on Wang et al. (2019), and the best-fit results are listed in Table LABEL:tab:K-correction. These are then used to model the K-correction of galaxies in our mock redshift surveys, as well as to calculate the maximum redshift a galaxy can be observed.
The luminosity of each galaxy is then calculated using the following formula:
| (4) |
For a better consideration of the absolute magnitude of the sun after K-correction, , we use the fitting results of K-correction in narrow redshift bins from to maximum redshift. These K-correction values at typical redshifts are listed below, which are consistent with being 4.61 and 4.5 in the and -band, respectively (Willmer, 2018).
Apart from the K-corrections, Blanton & Roweis (2007b) also provide an estimation of the stellar mass for each galaxy with rough but fast spectral analysis and stellar composition estimation, enabling us to constrain the star formation history and estimate the stellar mass for each galaxy. The consistency of this method with the mass-to-light ratio method proposed by Kauffmann et al. (2003) has been checked and verified. However, due to the limitations of redshift uncertainty and the templates used, the stellar masses obtained by the K-correction code should be handled with caution. The stellar masses may be overestimated to some extent due to the long star formation history assumed, particularly at high redshifts. Nevertheless, it still provides a quick, rough estimation of stellar mass.
3 The impact of photo-z errors on the LF and SMF measurements
Prior to examining the CLF and CSMF, this section will analyze the impact of photo-z error on the measurements of LFs and SMFs using the Y1-BGS and SV3-BGS sub-samples.

3.1 Galaxy luminosity functions
We employ a standard approach to calculate the LFs. We start by removing any galaxies with apparent magnitudes beyond the magnitude limit from a magnitude-limited galaxy sample. We then select the redshift range within which the galaxies are used for the LF measurements. For a galaxy with a specific absolute magnitude, we determine the maximum redshift below which the galaxy can be observed and adopt the mean K-correction difference between and in this process. Finally, we calculate the effective volume for the galaxy according to the redshift range .
To ensure the quality of observation data, we calculate the fraction, , which represents the ratio of galaxy number with observations in five wavelengths to all galaxies’ number, using healpix (Górski et al., 2005a) as a function of -band apparent magnitude and galaxy color in each pixel. This factor is then used to adjust for the selection incompleteness in the subsequent analysis.
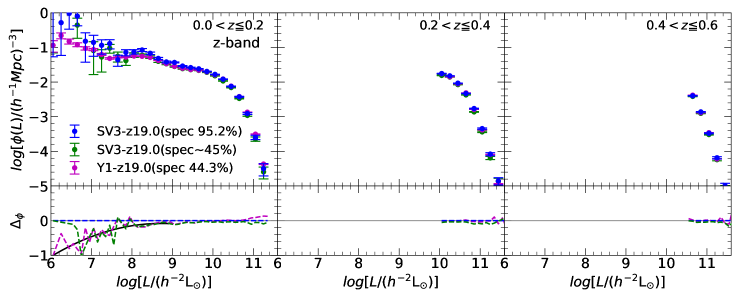
We first measure the LFs of the Y1-BGS and SV3-BGS sub-samples in three redshift bins. The upper and middle panels of Figure 2 show the results for the - and -bands, respectively. The results of -band and -band are shown in the upper and middle panels of Figure 2, respectively. The LFs of the two bands are generally consistent, although the -band luminosity is slightly lower than the -band luminosity. The blue dots with error bars represent the SV3-BGS sub-sample, which has a small sky coverage (133 ) and most of the galaxies with spectroscopic redshifts, thus providing the most reliable LF measurements. The magenta dots show the results of the Y1-BGS sub-sample, which has roughly half of its galaxies with spectroscopic redshifts. Overall the LFs of Y1-BGS and SV3-BGS show very good agreement with each other with negligible differences in all redshift bins. The main deviations from the SV3-BGS sub-sample only become prominent as the luminosity decreases below .
To investigate the influence of photo-z errors on LF measurements, we created a degraded sub-sample SV3-BGS(spectra percentage of galaxies , after here spec ) which closely matches the spectral completeness of Y1-BGS using data from SV3-BGS and shows the result with green dots. The error bars are estimated using the bootstrap method, which randomly resamples the original galaxy sample with replacement while keeping the total number of galaxies unchanged. To demonstrate the deviations more clearly, the logarithmic differences between the LFs of Y1-BGS (spec ) and SV3-BGS are shown in the lower part of each panel in Figure 2. The degraded SV3-BGS and Y1-BGS sub-samples show good agreement within 1-, demonstrating that the differences between the SV3-BGS and Y1-BGS results are indeed caused by the photoz error.
We use a quadratic function (represented by the solid black curves) to fit the deviation of LFs from the original to degraded SV3-BGS sub-samples, which will be used to correct the LF deviations observed in the Y1-BGS sub-samples. The fitted deviations for the -band and -band are and , respectively.
| \toprule or |
|
|
|
||||||||||||
|---|---|---|---|---|---|---|---|---|---|---|---|---|---|---|---|
| 0.0-0.2 | 0.2-0.4 | 0.4-0.6 | 0.0-0.2 | 0.2-0.4 | 0.4-0.6 | 0.0-0.2 | 0.2-0.4 | 0.4-0.6 | |||||||
| 6.05 | |||||||||||||||
| 6.15 | |||||||||||||||
| 6.25 | |||||||||||||||
| 6.35 | |||||||||||||||
| 6.45 | |||||||||||||||
| 6.55 | |||||||||||||||
| 6.65 | |||||||||||||||
| 6.75 | |||||||||||||||
| 6.85 | |||||||||||||||
| 6.95 | |||||||||||||||
| 7.05 | |||||||||||||||
| 7.15 | |||||||||||||||
| 7.25 | |||||||||||||||
| 7.35 | |||||||||||||||
| 7.45 | |||||||||||||||
| 7.55 | |||||||||||||||
| 7.65 | |||||||||||||||
| 7.75 | |||||||||||||||
| 7.85 | |||||||||||||||
| 7.95 | |||||||||||||||
| 8.05 | |||||||||||||||
| 8.15 | |||||||||||||||
| 8.25 | |||||||||||||||
| 8.35 | |||||||||||||||
| 8.45 | |||||||||||||||
| 8.55 | |||||||||||||||
| 8.65 | |||||||||||||||
| 8.75 | |||||||||||||||
| 8.85 | |||||||||||||||
| 8.95 | |||||||||||||||
| 9.05 | |||||||||||||||
| 9.15 | |||||||||||||||
| 9.25 | |||||||||||||||
| 9.35 | |||||||||||||||
| 9.45 | |||||||||||||||
| 9.55 | |||||||||||||||
| 9.65 | |||||||||||||||
| 9.75 | |||||||||||||||
| 9.85 | |||||||||||||||
| 9.95 | |||||||||||||||
| 10.05 | |||||||||||||||
| 10.15 | |||||||||||||||
| 10.25 | |||||||||||||||
| 10.35 | |||||||||||||||
| 10.45 | |||||||||||||||
| 10.55 | |||||||||||||||
| 10.65 | |||||||||||||||
| 10.75 | |||||||||||||||
| 10.85 | |||||||||||||||
| 10.95 | |||||||||||||||
| 11.05 | |||||||||||||||
| 11.15 | |||||||||||||||
| 11.25 | |||||||||||||||
| 11.35 | |||||||||||||||
| 11.45 | |||||||||||||||
| 11.55 | |||||||||||||||
| 11.65 | |||||||||||||||
| 11.75 | |||||||||||||||
3.2 Galaxy stellar mass functions
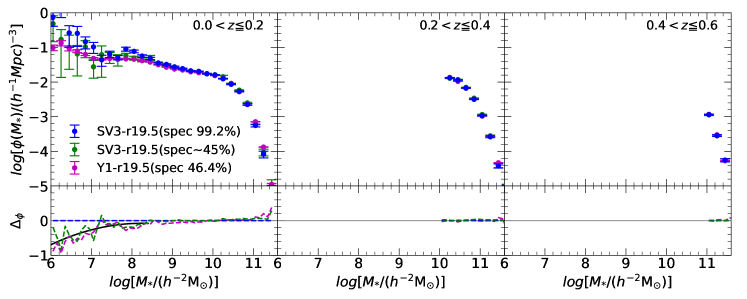
The stellar mass of galaxies is one of the most important properties in the study of galaxy evolution and cosmic structure evolution. Although it is more difficult and less reliable to measure than the luminosity of galaxies due to SED modeling, it is more commonly used in theoretical studies. In measuring the galaxy SMFs, we use the -band apparent and absolute magnitudes to calculate zmax for each galaxy in our SV3-r19.5 and Y1-r19.5 sub-samples. The resulting SMFs are shown in the lower panels of Figure 2.
These SMFs display similar trends to the LFs, especially the enhancement starting around . Such kind of enhancement in SMFs at the low mass end was also reported in a recent study carried out by Gao et al. (2023). Finally, similar to the LFs, we also fit the deviation of SMFs of degraded SV3-BGS (spec ) sub-sample with respect to the initial SV3-BGS sub-sample using a quadratic function form, denoted by the solid black lines in Figure 2. This fitting result, , can be applied to correct the SMF suppression of Y1-BGS at low mass end. The results of the luminosity functions and stellar mass functions obtained from SV3-BGS are provided in Table 3 for reference.
4 Testing the reliability of CLF measurements using MGRS
Due to various selection effects, observational data sometimes might lead to biased measurements. To assess the influence of the group finder and photo-z error on the CLF and CSMF measurements, we create an MGRS from the Jiutian simulation with the same sky coverage as the LS DR9. The luminosity of the MGRS is adjusted to match the -band LFs from the Y1-z19.0 sample after a correction factor is applied to the SV3-z19.0 sample. Two sets of mock group catalogs are then generated from the MGRS using the extended halo-based group finder with either spectroscopic or photometric redshifts.
4.1 Constructing MGRS from Jiutian simulation
We employed a high-resolution dark-matter-only -body simulation from the Jiutian simulation suite to construct our MGRS. This simulation is based on the Planck-2018 cosmology (Planck Collaboration et al., 2020b), and the parameters are listed in Section 1. The simulation was carried out with particles in a periodic box of per side using the Gadget-3 code (Springel et al., 2001; Springel, 2005). Each particle had a mass of , and the simulation began at an initial redshift of , producing 128 snapshots to . The Friends-of-Friends algorithm (Davis et al., 1985) with a linking length of times the mean inter-particle separation was used to identify dark matter halos. The HBT+ code (Han et al., 2012, 2018)444https://github.com/Kambrian/HBTplus was then used to identify subhalos and their evolution histories.
An observer is placed at a reference location in the box, and each snapshot is replicated periodically to create a subhalo light cone. The orbit of each subhalo is then interpolated over time to determine the time and location at which the subhalo should be observed. The properties of the subhalo are then interpolated to the intersecting time to generate a lightcone catalog of subhalos. Using the Jiutian subhalo light cone catalog, we assign a -band galaxy luminosity to each subhalo with a subhalo abundance matching method that incorporates a luminosity scatter dex at fixed subhalo mass. The subhalo halo mass we adopted is the maximum mass along the accretion history. The cumulative LFs used for the abundance matching are directly-measured from the Y1-z19.0 sample with narrow redshift bins. To assign luminosity to each subhalo at a particular redshift, we interpolate the LFs at different redshifts (see Gu et al. 2023 for more details).
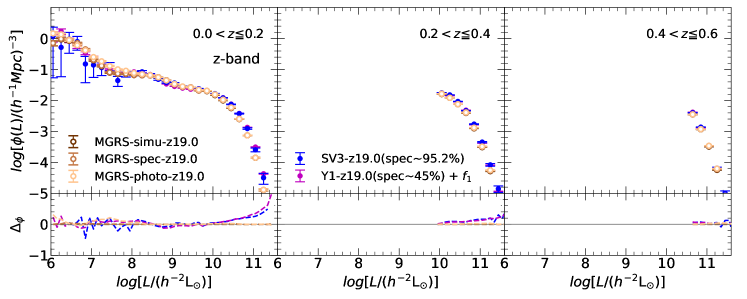
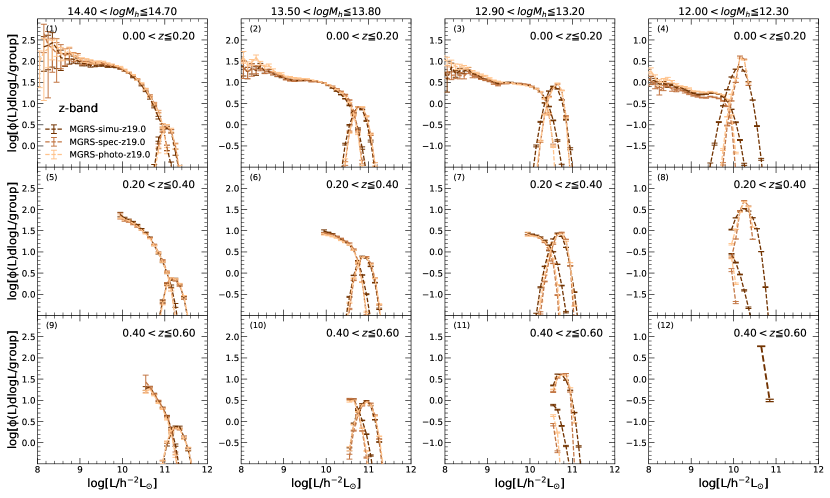
We construct our MGRS for LS DR9 by applying for the same sky coverage as LS DR9, a magnitude limit cut of and a redshift range of . The bright star masking is also applied to the MGRS. Compared with the original north galactic cap of MGRS, the number of galaxies after masking is reduced by 2.8 million and the area of the sky coverage is reduced by . Figure 3 shows the LFs obtained from our MGRS (MGRS-simu, dark brown open circles with error bars) in comparison to the observational measurements from Y1-z19.0 (magenta) and SV3-z19.0 (blue). The nice agreement between the two is expected due to the abundance matching technique.
In order to account for observational effects in redshift measurements, two additional redshifts are assigned to each galaxy in addition to the true MGRS-simu. The first of these is the MGRS-spec, which takes into account the redshift error of the DESI spectroscopic observation at about 35 km/s and the peculiar velocity of the galaxy. The other one is the MGRS-photo, which includes a photo-z error with a Gaussian distribution as described in Yang et al. (2021), =(0.01+0.15z)*(1+z). To best mimic the Y1-BGS, for galaxies with , we randomly choose 45% of them to keep the spectroscopic redshifts.
The light brown and orange open circles in Figure 3 represent the LFs obtained from the MGRS-spec and MGRS-photo, respectively. All measurements based on MGRS are in agreement, even for luminosities of . The MGRS-simu and MGRS-spec are almost indistinguishable in all redshift bins, while the MGRS-photo displays a slightly smoother trend at the faint end in the lowest redshift bin, which is caused by the Gaussian photo-z error we applied. The behavior of MGRS-photo suggests that a pure Gaussian photo error cannot accurately reproduce the decreasing behavior of the observed LFs of the half-spectroscopic sample at the faint end we see in Figure 2. The reduction in the LFs/SMFs of DESI observation could be attributed to the fact that the photo-z provided in the LS DR9 has a PDF, which prevents the median value we adopted to approach z=0.
4.2 Comparing the true and measured CLFs
The CLF describes the average number of galaxies as a function of galaxy luminosity in the dark matter halo of a given mass, which plays an essential role in understanding how galaxies form and distribute in dark matter halos. In this sub-section, we assess the impact of the group finder on the CLF measurements by comparing the results from MGRS-spec and MGRS-photo to the true input values (MGRS-simu). To do this, we apply the same extended group finder from Yang et al. (2021) to identify groups in our LS DR9 MGRS. We then construct two versions of mock group catalogs, one for MGRS-spec and the other for MGRS-photo. We use MGRS-spec, MGRS-photo, and MGRS-simu to represent the results measured from the two mock group catalogs and the true input values, respectively.
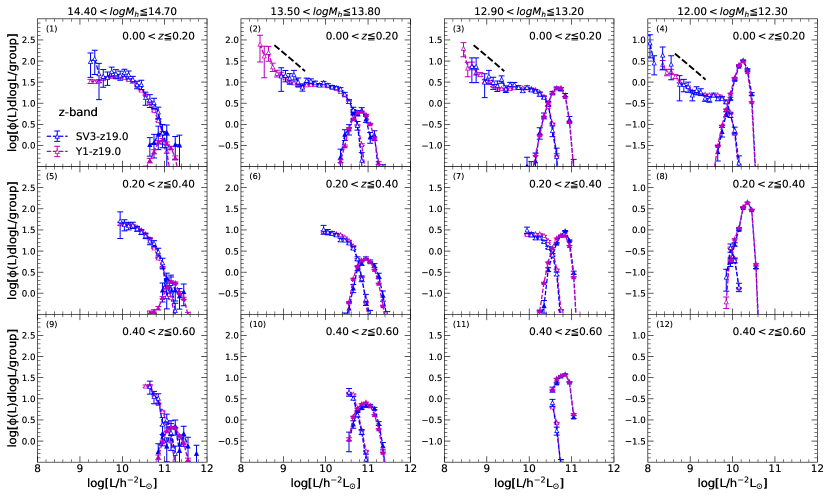
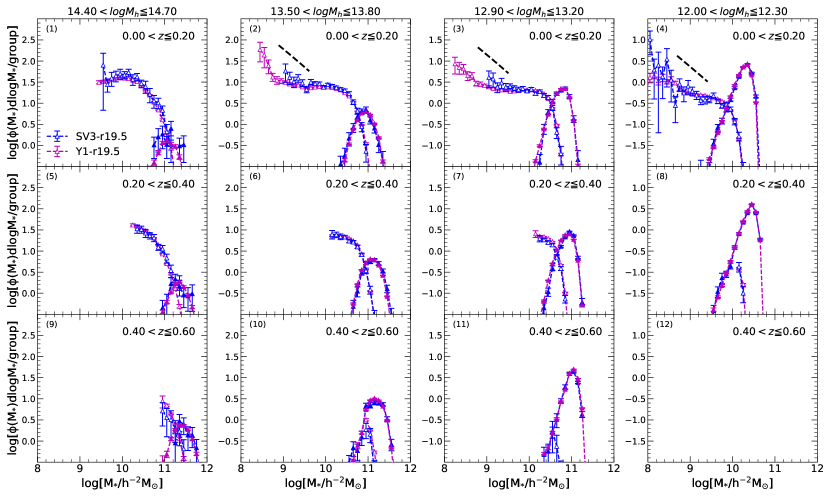
The CLF is measured differently from the LF, which is normalized by the number of groups in the redshift range instead of the cosmic volume. The same critical step of determining the maximum redshift is still necessary. To calculate the CLF, galaxies and groups in the redshift range are first selected. For a galaxy with a specific absolute magnitude, the maximum redshift is then determined. The effective number of groups is calculated by counting the group numbers within the redshift range . Figure 4 shows the -band CLFs obtained from the Jiutian MGRS in different halo mass and redshift bins. The redshift range is from , , and from top to bottom panels, respectively. The halo mass bins are , , , and (unit of ) from left to right, respectively.
We find that the central galaxy CLFs in both MGRS-spec and MGRS-photo are accurately reproduced in halos with masses greater than , regardless of redshift. The median values of these samples are similar to those of MGRS-simu in less massive halos, however, the scatter is slightly underestimated due to the halo mass estimation based on abundance matching (Yang et al., 2005b). Xu et al. (2023) recently reported that the group finder might create an artificial double-peak profile in the central CLF for a shallow survey. They found that the brighter component of the double-peak is largely contributed by the groups with a single member galaxy (see Appendix A for a more detailed discussion). Such artifacts can be largely reduced by using a deeper survey. We do not observe this feature, which manifests the validation of using a deeper survey for the group-finding process. In summary, the CLFs for central galaxies in DESI DR9 can be well recovered, except for the scatter in small halos.
The CLFs of satellites derived from the MGRS-spec, MGRS-photo and MGRS-simu samples, with luminosity greater than , also show very good agreement within different halo mass bins and redshift ranges. Most of the data points agree with each other well within their 1- error bars. The only slight difference we can see is in the lowest halo mass bin, where the CLF from MGRS-spec tends to be slightly underestimated compared to MGRS-simu, with a difference of approximately 0.05dex. These comparisons demonstrate that the satellite CLFs of either a pure spec-z sample or a mixed sample (half photo-z and half spec-z) can also be well recovered, at least for satellite galaxies with . The group finder will not induce significant bias in the CLF measurements in the DESI observations.
5 Conditional luminosity and stellar mass functions
With all the above preparations, we set out to measure the CLFs and CSMFs from the DESI galaxy observational samples.
5.1 Global properties
Before we move forward, we will present two sets of measurements of the global characteristics of groups that are essential components of the CLF and HOD theoretical framework: (1) the luminosity (or stellar mass) of the central galaxy - halo mass relation, and (2) satellite fraction, .
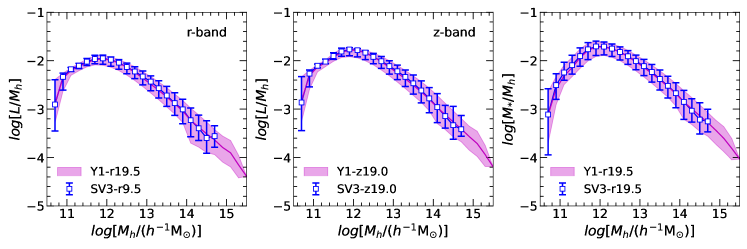
The central galaxy luminosity (or stellar mass) - halo mass relation is a key factor in understanding how galaxies form and evolve in dark matter halos. We show in Figure 5 the central galaxy - halo mass ratios obtained from the LS DR9 group catalogs for -band, -band luminosity and stellar mass in the left, middle, and right panels, respectively. The magenta-shaded region represents the Y1-BGS sub-sample, and the blue squares with error bars correspond to the SV3-BGS sub-sample. There is no significant difference between the spec-z sub-sample (SV3-BGS) and half spec-z sub-sample (Y1-BGS). This is in agreement with the results of Section 4, which suggests that the photo-z error has a negligible effect on the CLFs. Generally, the luminosity (stellar mass) of centrals has the largest luminosity (stellar mass) to halo mass ratio in halos with mass , then drops in both low mass and high mass ends. This is consistent with previous findings (e.g. Yang et al., 2008) and is likely due to a combination of AGN feedback and changes in the efficiencies of radiative cooling and dynamical friction.
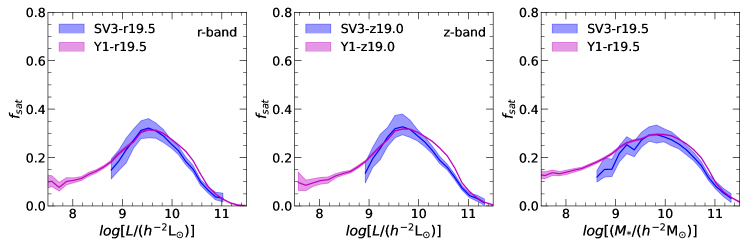
In the HOD framework, satellite fraction is considered one of the most important quantities in modeling the galaxy correlation functions. is defined as the ratio between the number of satellites and the number of all galaxies at fixed galaxy luminosity or stellar mass bin. Since each halo only contains one central galaxy, the large-scale clustering of galaxies at fixed luminosity is significantly impacted by the fraction of the satellite galaxies.
The functions obtained from the SV3-BGS and Y1-BGS sub-samples are displayed in Figure 6. The fraction of satellites is calculated by dividing the number of satellites by the total number of galaxies in a given luminosity or stellar mass bin. The error bars represent 3- confidence levels obtained from 200 bootstrap resamplings. For accuracy, only results from luminosity bins with at least 600 galaxies are shown, which leads to a truncation of the SV3-BGS sub-sample at the faint end. The satellite fraction increases from close to 10% at the faint end to a maximum of around 30% at and then decreases to zero for the most luminous or massive galaxies. This 10% level of satellite fraction in the faint (low mass) end is in agreement with the satellite-to-all subhalo fraction at the low mass end in theory or simulations. The results in the three panels demonstrate that is independent of the choice of galaxy stellar mass and luminosity, as well as the bands of luminosity.
5.2 CLFs measured from DESI observations
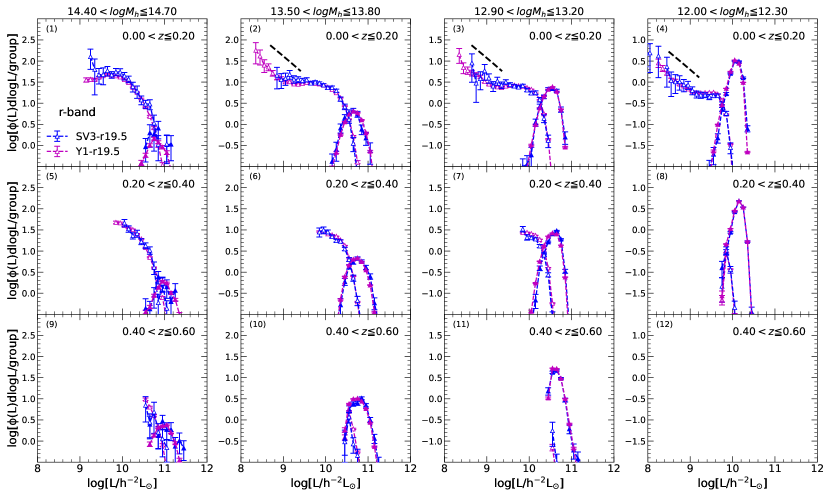
In this sub-section, we directly measure the CLFs from the DESI observational data in multiple halo mass bins. As tested in Section 4, the CLFs can be reliably measured from both the spectroscopic and combined redshift data. However, the available spectroscopic sample in this study, SV3-BGS, only covers about . Therefore, it can only provide CLF measurements for relatively bright galaxies. The Y1-BGS sub-sample, on the other hand, covers a much larger area of the sky and has a spectroscopic redshift completeness of . According to Section 4.2, we have demonstrated that the mixed sample, with the same spectral completeness as Y1-BGS, can also provide reliable CLF for luminosities . We present the direct CLF results of SV3-BGS and Y1-BGS sub-samples. Here a small correction factor obtained from Section 3.1 is applied to the Y1-BGS sub-sample. As we are focusing on relatively bright luminosity ranges (), even without such a correction, the general trends will remain almost unchanged.
Figure 7 shows the CLFs measured from -band in different mass and redshift bins. Compared the CLFs to those in Section 4.2, we find that the CLFs of DESI show similar behavior as those obtained from the MGRS, in that Y1-BGS and SV3-BGS show very similar results. On the other hand, due to the much larger sky coverage of Y1-BGS, its CLFs in general show much better statistics and smaller error bars.
Comparing the -band CLFs to those obtained in a previous study from SDSS at low redshift (Yang et al., 2008), our measurements at are similar. However, thanks to the DESI deeper imaging and spectroscopic surveys, our CLF measurements are able to reach much fainter end and show a clear upturn. Quite interestingly, such kind of enhancement in the faint end CLFs was already reported in previous works (e.g. Lan et al., 2016; Meng et al., 2023) using SDSS groups. By combing SDSS imaging data and SDSS group catalogs, Lan et al. (2016) found that the satellite CLFs of SDSS groups at redshift display a steep upturn at for all halo masses, mainly contributed by red galaxies.
Here, thanks to the much deeper DESI observations, we are able to obtain more reliable CLF measurements. Interestingly, we found that the slope of the upturn at is rather steep (). The faint end slope of the CLFs is in general agreement with that of the subhalo mass function, which is indicated by the black dashed line in the top panels, except for the most massive bin. This suggests that galaxies may have a roughly constant star formation efficiency in low-mass subhalos. According to Figure 5, a galaxy with a characteristic luminosity of lives in a halo with mass . Halos with mass lower than this critical mass tend to form stars with a roughly constant efficiency.
Figure 8 shows the CLFs measured from -band in different mass and redshift bins. Overall, the CLFs from -band show similar trends as -band, except that the ones in -band are slightly shifted to brighter end.
5.3 CSMFs measured from DESI observations
The CSMF, , is a key element in modeling the evolution of galaxies. It describes the average number of galaxies as a function of galaxy stellar mass in a dark matter halo of a particular mass . It is simpler and more common to use CSMF than CLF to access galaxy formation models because of the difficulty in converting mass to luminosity. When evaluating the CSMF, the completeness of the galaxy sample in terms of stellar mass shall also be properly taken into account. For each galaxy, we count the number of groups within the maximum redshift and redshift range to calculate the CSMFs. The CSMFs obtained from the DESI observations are shown in Figure 9. The data points are taken from the SV3-BGS and Y1-BGS samples. The CSMFs have overall similarities with the CLF in terms of shape and features.
The above direct CLF/CSMF measurements that covering much larger redshift and luminosity/stellar mass ranges, will be adopted in a subsequent study to understand the evolution of galaxies below redshift .
6 Discussion
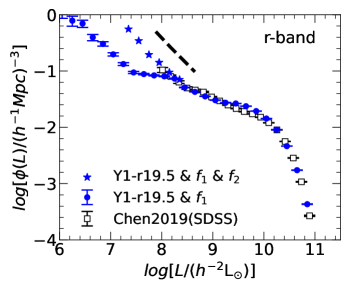
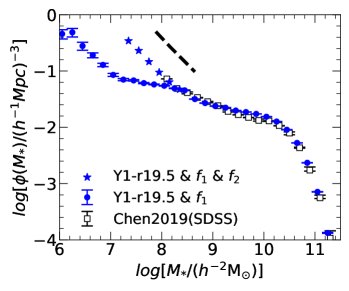
In our measurements of the CLFs/CSMFs, we find a clear upturn at . This trend however is not clearly pronounced in the LFs/SMFs of SV3-BGS shown in Figure 2, which exhibit a slight drop below . We set out to explore the clues for the potential discrepancy and find that the cosmic variance (CV) caused by the local void in our Universe is a possible reason (Chen et al., 2019).
The CV is known to affect galaxy observables due to the biased distribution of galaxies in the local universe. Several approaches are proposed to address this effect, such as analyzing subsamples with jackknife, utilizing the spatial distribution of bright galaxies (e.g. Driver & Robotham, 2010; Baldry et al., 2012), estimating cosmic variance from a given sample with a basic analytic model (e.g. Somerville et al., 2004; Moster et al., 2011), and obtaining cosmic variance directly from N-body simulation-based semi-analytic and empirical models. Chen et al. (2019) proposed a systematic correction method for LFs/SMFs based on the ELUCID simulation (e.g. Wang et al., 2014, 2016; Yang et al., 2018) by comparing the SMFs predicted in the SDSS region and the entire simulation box. Without this correction, the faint end galaxy luminosity functions obtained from SDSS would likely be significantly suppressed.
To assess the constraining power of Y1-BGS on the LFs at , we compare our measurements of Y1-BGS incorporating photo-z correction factor from Section 3 with those obtained from SDSS by Chen et al. (2019) in Figure 10. The galaxies in the two observations are both K-corrected to and the primary difference between these two samples is their redshift range, as in Y1-BGS, and in Chen et al. (2019). We find that the LF results directly measured by Y1-BGS with photo-z correction factor shows good agreement with those obtained from SDSS after the CV correction. Y1-BGS, which has observed wide sky regions and is much deeper should suffer from the CV effect in the much fainter luminosity ranges. The good agreement demonstrates that the CV correction factor obtained by Chen et al. (2019) in the range of to works remarkably well.
Considering the apparent magnitudes limit of Y1-r19.5 is nearly two magnitude fainter than Chen et al. (2019) which is 17.6, the impact of CV on the LFs might also appear in the two magnitudes fainter ranges, that is below . In this section, we apply the same correction factor obtained by Chen et al. (2019) to our LFs and SMFs measurements at , shifted to fainter end by 0.8dex in terms of luminosity or stellar mass. Our LF and SMF results with photo-z correction factor are shown in Figure 10 illustrated by blue dots with error bars. The results with additional cosmic variance correction factor are shown by blue star icons. It is evident that a considerable difference in the faint-end slope emerges, with comparing the slope in the range of with that of .
As a reference, we show in each panel of Figure 10 the low mass end slope of the halo mass function using a black short dashed line. Upon closer inspection, it is remarkable that the slopes of the LF and SMF match the typical halo mass function at the very faint end. This behavior is now in good agreement with our CLF measurements, in that for both total and satellite galaxies with luminosity/stellar mass less than (or ), they show roughly consisitent galaxy-halo connections. In addition, it suggests that galaxy formation in low-mass halos could be still quite efficient, regardless of halo mass. This would be contrary to the standard theories of galaxy formation, which usually invoke stellar winds, supernova feedback, etc., to reduce star formation efficiency towards the low mass end.
7 Summary
In this paper, we leverage the two recent DESI observational sub-samples, SV3-BGS and Y1-BGS, to update the seed catalog of LS DR9 for our group finder. The SV3-BGS, despite the limited coverage of , contains the most complete spectroscopic redshift data. In contrast, the Y1-BGS, with only half of the spectroscopic redshift completeness, achieves a sky coverage that is 90 times larger than SV3-BGS. We obtain a galaxy group catalog by applying the extended version of halo-based group finder (Yang et al., 2021) to this updated seed catalog. Based on the assessments using MGRS spec-z and photo-z mock galaxy samples constructed based on Jiutian simulation, we investigated the galaxy luminosity functions (LFs), stellar mass functions (SMFs), conditional luminosity functions (CLFs), and conditional stellar mass functions (CSMFs) in three redshift bins up to . Our main results can be summarized as follows.
-
1.
We measure the galaxy LFs and SMFs in three different redshift bins. We find that utilization of photometric redshift in the mixed sub-sample will somewhat suppress the LFs and SMFs at the very faint/low mass end in the lowest redshift bin.
-
2.
We constructed an MGRS galaxy catalog based on Jiutian simulation using the LFs of Y1-BGS by applying the photo-z correction factor. To mimic the redshift completeness of SV3-BGS and Y1-BGS sub-samples, we have constructed two sets of redshifts, MGRS-spec and MGRS-photo. By applying the same group finder to the two sets of MGRSs, we use the resulting group catalogs to evaluate the reliability of the CLF measurements. Compared to the true values, the two MGRS samples demonstrate that the central galaxy CLFs can be accurately recovered using both spec-z and photo-z in all redshift and halo mass bins, except for the lowest halo mass bin. The CLFs of the satellite galaxies are slightly underestimated by approximately 0.05 dex using spec-z.
-
3.
We derived the central luminosity (or stellar mass) - host halo mass relations and the satellite fraction based on the galaxy group catalogs constructed from SV3-BGS and Y1-BGS observational sub-samples, which extend down to a luminosity or stellar mass (). We found that the satellite fraction peaks at at about 30% level and decreases to 10% at the low luminosity (or stellar mass) end.
-
4.
Based on the validation of the group finder on our CLF measurements, we provide our observational measurements of CLFs and CSMFs at () from SV3-BGS and Y1-BGS sub-samples in a wide halo mass range and three redshift bins. Our analysis reveals an upturn in the CLFs and CSMFs at the faint (or low stellar mass) end below (or ). Remarkably, the slope of this upturn is in nice agreement with that of the subhalo mass functions.
-
5.
After taking into account the photo-z correction factor and cosmic variance correction factor , the LFs and SMFs we obtained from DESI observation may also reveal a continuous upturn below (or ), similar to those in the CLFs and CSMFs. The slope is in nice agreement with that of the halo mass function at the low mass end.
This study provides a comprehensive analysis of the LFs, SMFs, CLFs, and CSMFs of galaxies across a broad range of redshifts and halo mass bins, combining both observed and mock galaxy samples. These measurements also span large luminosity (or stellar mass) ranges of (or ) at low redshift and (or ) at higher redshift . The intriguing upturn feature in the faint (low mass) end of LFs/SMFs/CLFs/CSMFs carries significant implications for refining the CLF model. Moreover, it provides valuable insights into the formation and evolution mechanisms of galaxies in the very low mass halo. We will perform related investigations in a subsequent work.
Acknowledgements
We thank Antonella Palmese for careful reading through our draft and giving helpful comments that improved the presentation of this paper. This work is supported by the National Science Foundation of China (Nos. 11833005, 11890692, 11621303, 12141302), “the Fundamental Research Funds for the Central Universities”, 111 project No. B20019, and Shanghai Natural Science Foundation, grant No.19ZR1466800. We acknowledge the science research grants from the China Manned Space Project with Nos. CMS-CSST-2021-A02, CMS-CSST-2021-A03. The computations in this paper were run on the Gravity Supercomputer at Shanghai Jiao Tong University.
This research used data obtained with the Dark Energy Spectroscopic Instrument (DESI). DESI construction and operations is managed by the Lawrence Berkeley National Laboratory. This material is based upon work supported by the U.S. Department of Energy, Office of Science, Office of High-Energy Physics, under Contract No. DEAC0205CH11231, and by the National Energy Research Scientific Computing Center, a DOE Office of Science User Facility under the same contract. Additional support for DESI was provided by the U.S. National Science Foundation (NSF), Division of Astronomical Sciences under Contract No. AST-0950945 to the NSF’s National Optical-Infrared Astronomy Research Laboratory; the Science and Technology Facilities Council of the United Kingdom; the Gordon and Betty Moore Foundation; the HeisingSimons Foundation; the French Alternative Energies and Atomic Energy Commission (CEA); the National Council of Science and Technology of Mexico (CONACYT); the Ministry of Science and Innovation of Spain (MICINN), and by the DESI Member Institutions: www.desi.lbl.gov/collaborating-institutions.
The DESI Legacy Imaging Surveys consist of three individual and complementary projects: the Dark Energy Camera Legacy Survey (DECaLS), the Beijing-Arizona Sky Survey (BASS), and the Mayall z-band Legacy Survey (MzLS). DECaLS, BASS and MzLS together include data obtained, respectively, at the Blanco telescope, Cerro Tololo Inter-American Observatory, NSF’s NOIRLab; the Bok telescope, Steward Observatory, University of Arizona; and the Mayall telescope, Kitt Peak National Observatory, NOIRLab. NOIRLab is operated by the Association of Universities for Research in Astronomy (AURA) under a cooperative agreement with the National Science Foundation. Pipeline processing and analyses of the data were supported by NOIRLab and the Lawrence Berkeley National Laboratory (LBNL). Legacy Surveys also uses data products from the Near-Earth Object Wide-field Infrared Survey Explorer (NEOWISE), a project of the Jet Propulsion Laboratory/California Institute of Technology, funded by the National Aeronautics and Space Administration. Legacy Surveys was supported by: the Director, Office of Science, Office of High Energy Physics of the U.S. Department of Energy; the National Energy Research Scientific Computing Center, a DOE Office of Science User Facility; the U.S. National Science Foundation, Division of Astronomical Sciences; the National Astronomical Observatories of China, the Chinese Academy of Sciences and the Chinese National Natural Science Foundation. LBNL is managed by the Regents of the University of California under contract to the U.S. Department of Energy. The complete acknowledgments can be found at https://www.legacysurvey.org/acknowledgment/.
We additionally made use of Astropy, a community-developed core Python package for Astronomy (Astropy Collaboration et al. 2018), IPython (Pérez & Granger 2007), Matplotlib (Hunter 2007), and TOPCAT (Taylor 2005, http://www.starlink.ac.uk/topcat/ ).
Appendix A Cosmic variance in the SV3-BGS sub-sample
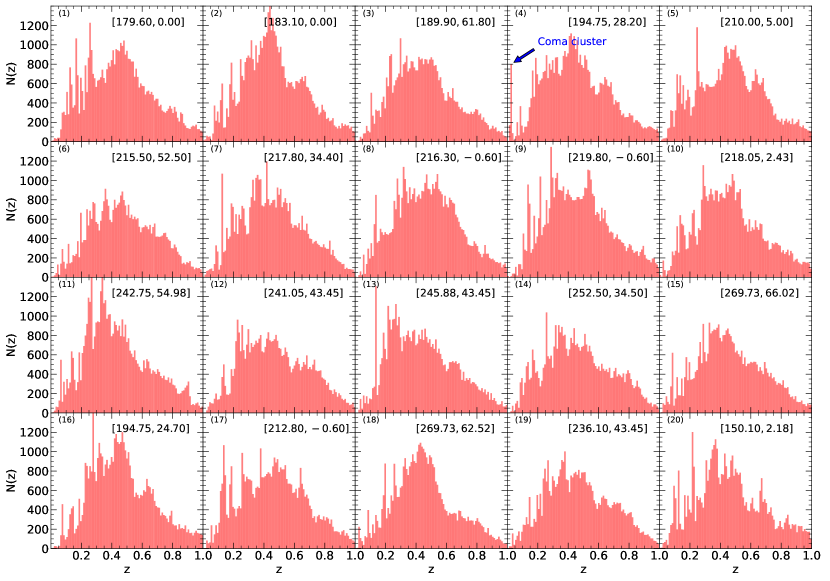
When performing the LF measurements from the SV3-BGS sub-samples using the method outlined in Section 3, we find a significant enhancement at in the low redshift bin compared with that of Y1-BGS sub-sample. To find the cause of the big enhancement, we checked the redshift distribution of galaxies in the 20 rosettes of the SV3-BGS sub-sample. The results are shown in different panels of Figure A, each corresponding to a particular rosette. In several panels, spikes exhibit at low redshift, especially in panel (4) which is centered at the coordinate [RA194.75, DEC28.20]. According to the DESI official website555https://desi.lbl.gov/trac/wiki/SurveyOps/OnePercent, this fourth rosette contains the Coma cluster with redshift 0.0231.
The presence of the Coma cluster significantly enhanced the LF measurements of the SV3-BGS sub-sample at , which is verified in Figure B. The black dots with error bars stand for the results with 20 rosettes, and the blue ones are the measurements with 19 rosettes excluding Coma cluster one. Since the number of large clusters in the local universe below the redshift of 0.03 is small, the Coma cluster causes a considerable cosmic variance in the DESI SV3-BGS 1% sky coverage. Thus, in our investigation, the galaxies in rosette 4 are excluded from our SV3-BGS sub-sample.


References
- Alam et al. (2020) Alam, S., Peacock, J. A., Kraljic, K., Ross, A. J., & Comparat, J. 2020, MNRAS, 497, 581, doi: 10.1093/mnras/staa1956
- Alexander et al. (2023) Alexander, D. M., Davis, T. M., Chaussidon, E., et al. 2023, AJ, 165, 124, doi: 10.3847/1538-3881/acacfc
- Allende Prieto et al. (2020) Allende Prieto, C., Cooper, A. P., Dey, A., et al. 2020, Research Notes of the American Astronomical Society, 4, 188, doi: 10.3847/2515-5172/abc1dc
- Baldry et al. (2012) Baldry, I. K., Driver, S. P., Loveday, J., et al. 2012, MNRAS, 421, 621, doi: 10.1111/j.1365-2966.2012.20340.x
- Behroozi et al. (2010) Behroozi, P. S., Conroy, C., & Wechsler, R. H. 2010, ApJ, 717, 379, doi: 10.1088/0004-637X/717/1/379
- Blanton & Roweis (2007a) Blanton, M. R., & Roweis, S. 2007a, AJ, 133, 734, doi: 10.1086/510127
- Blanton & Roweis (2007b) —. 2007b, AJ, 133, 734, doi: 10.1086/510127
- Blanton et al. (2003) Blanton, M. R., Hogg, D. W., Bahcall, N. A., et al. 2003, ApJ, 592, 819, doi: 10.1086/375776
- Brodzeller et al. (2023) Brodzeller, A., Dawson, K., Bailey, S., et al. 2023, AJ, 166, 66, doi: 10.3847/1538-3881/ace35d
- Brown et al. (2008) Brown, M. J. I., Zheng, Z., White, M., et al. 2008, ApJ, 682, 937, doi: 10.1086/589538
- Cacciato et al. (2009) Cacciato, M., van den Bosch, F. C., More, S., et al. 2009, MNRAS, 394, 929, doi: 10.1111/j.1365-2966.2008.14362.x
- Chaussidon et al. (2023) Chaussidon, E., Yèche, C., Palanque-Delabrouille, N., et al. 2023, ApJ, 944, 107, doi: 10.3847/1538-4357/acb3c2
- Chen et al. (2019) Chen, Y., Mo, H. J., Li, C., et al. 2019, ApJ, 872, 180, doi: 10.3847/1538-4357/ab0208
- Colless (1999) Colless, M. 1999, Philosophical Transactions of the Royal Society of London Series A, 357, 105, doi: 10.1098/rsta.1999.0317
- Conroy et al. (2006) Conroy, C., Wechsler, R. H., & Kravtsov, A. V. 2006, ApJ, 647, 201, doi: 10.1086/503602
- Cooper et al. (2022) Cooper, A. P., Koposov, S. E., Allende Prieto, C., et al. 2022, arXiv e-prints, arXiv:2208.08514. https://arxiv.org/abs/2208.08514
- Davis et al. (1985) Davis, M., Efstathiou, G., Frenk, C. S., & White, S. D. M. 1985, ApJ, 292, 371, doi: 10.1086/163168
- DESI Collaboration et al. (2016a) DESI Collaboration, Aghamousa, A., Aguilar, J., et al. 2016a, arXiv e-prints, arXiv:1611.00036. https://arxiv.org/abs/1611.00036
- DESI Collaboration et al. (2016b) —. 2016b, arXiv e-prints, arXiv:1611.00037. https://arxiv.org/abs/1611.00037
- DESI Collaboration et al. (2022) DESI Collaboration, Abareshi, B., Aguilar, J., et al. 2022, AJ, 164, 207, doi: 10.3847/1538-3881/ac882b
- DESI Collaboration et al. (2023a) DESI Collaboration, Adame, A. G., Aguilar, J., et al. 2023a, arXiv e-prints, arXiv:2306.06307, doi: 10.48550/arXiv.2306.06307
- DESI Collaboration et al. (2023b) —. 2023b, arXiv e-prints, arXiv:2306.06308, doi: 10.48550/arXiv.2306.06308
- Dey et al. (2019) Dey, A., Schlegel, D. J., Lang, D., et al. 2019, AJ, 157, 168, doi: 10.3847/1538-3881/ab089d
- Driver & Robotham (2010) Driver, S. P., & Robotham, A. S. G. 2010, MNRAS, 407, 2131, doi: 10.1111/j.1365-2966.2010.17028.x
- Gao et al. (2023) Gao, H., Jing, Y. P., Gui, S., et al. 2023, arXiv e-prints, arXiv:2306.06317, doi: 10.48550/arXiv.2306.06317
- Golden-Marx et al. (2022) Golden-Marx, J. B., Zu, Y., Wang, J., et al. 2022, arXiv e-prints, arXiv:2212.13270, doi: 10.48550/arXiv.2212.13270
- Górski et al. (2005a) Górski, K. M., Hivon, E., Banday, A. J., et al. 2005a, ApJ, 622, 759, doi: 10.1086/427976
- Górski et al. (2005b) —. 2005b, ApJ, 622, 759, doi: 10.1086/427976
- Guo et al. (2016) Guo, H., Zheng, Z., Behroozi, P. S., et al. 2016, MNRAS, 459, 3040, doi: 10.1093/mnras/stw845
- Guy et al. (2023) Guy, J., Bailey, S., Kremin, A., et al. 2023, AJ, 165, 144, doi: 10.3847/1538-3881/acb212
- Hahn et al. (2022) Hahn, C., Wilson, M. J., Ruiz-Macias, O., et al. 2022, arXiv e-prints, arXiv:2208.08512. https://arxiv.org/abs/2208.08512
- Hahn et al. (2023) —. 2023, AJ, 165, 253, doi: 10.3847/1538-3881/accff8
- Han et al. (2018) Han, J., Cole, S., Frenk, C. S., Benitez-Llambay, A., & Helly, J. 2018, MNRAS, 474, 604, doi: 10.1093/mnras/stx2792
- Han et al. (2012) Han, J., Jing, Y. P., Wang, H., & Wang, W. 2012, MNRAS, 427, 2437, doi: 10.1111/j.1365-2966.2012.22111.x
- Jing et al. (1998) Jing, Y. P., Mo, H. J., & Börner, G. 1998, ApJ, 494, 1, doi: 10.1086/305209
- Katsianis et al. (2023) Katsianis, A., Yang, X., Fong, M., & Wang, J. 2023, MNRAS, 523, 1538, doi: 10.1093/mnras/stad1498
- Katsianis et al. (2021) Katsianis, A., Xu, H., Yang, X., et al. 2021, MNRAS, 500, 2036, doi: 10.1093/mnras/staa3236
- Kauffmann et al. (2003) Kauffmann, G., Heckman, T. M., White, S. D. M., et al. 2003, MNRAS, 341, 33, doi: 10.1046/j.1365-8711.2003.06291.x
- Lan et al. (2016) Lan, T.-W., Ménard, B., & Mo, H. 2016, MNRAS, 459, 3998, doi: 10.1093/mnras/stw898
- Lan et al. (2023) Lan, T.-W., Tojeiro, R., Armengaud, E., et al. 2023, ApJ, 943, 68, doi: 10.3847/1538-4357/aca5fa
- Lang et al. (2016) Lang, D., Hogg, D. W., & Mykytyn, D. 2016, The Tractor: Probabilistic astronomical source detection and measurement, Astrophysics Source Code Library, record ascl:1604.008. http://ascl.net/1604.008
- Levi et al. (2013) Levi, M., Bebek, C., Beers, T., et al. 2013, arXiv e-prints, arXiv:1308.0847. https://arxiv.org/abs/1308.0847
- Li & White (2009) Li, C., & White, S. D. M. 2009, MNRAS, 398, 2177, doi: 10.1111/j.1365-2966.2009.15268.x
- Lim et al. (2017) Lim, S. H., Mo, H. J., Lu, Y., Wang, H., & Yang, X. 2017, MNRAS, 470, 2982, doi: 10.1093/mnras/stx1462
- Lu et al. (2015) Lu, Y., Yang, X., & Shen, S. 2015, ApJ, 804, 55, doi: 10.1088/0004-637X/804/1/55
- Meng et al. (2023) Meng, J., Li, C., Mo, H. J., et al. 2023, ApJ, 944, 75, doi: 10.3847/1538-4357/acae86
- Miller et al. (2023) Miller, T. N., Doel, P., Gutierrez, G., et al. 2023, arXiv e-prints, arXiv:2306.06310, doi: 10.48550/arXiv.2306.06310
- Moster et al. (2011) Moster, B. P., Somerville, R. S., Newman, J. A., & Rix, H.-W. 2011, ApJ, 731, 113, doi: 10.1088/0004-637X/731/2/113
- Moustakas (2023) Moustakas, J. 2023, FastSpecFit: Fast spectral synthesis and emission-line fitting of DESI spectra, Astrophysics Source Code Library, record ascl:2308.005. http://ascl.net/2308.005
- Moustakas et al. (2013) Moustakas, J., Coil, A. L., Aird, J., et al. 2013, ApJ, 767, 50, doi: 10.1088/0004-637X/767/1/50
- Moustakas et al. (2023) Moustakas, J., Lang, D., Dey, A., et al. 2023, ApJS, 269, 3, doi: 10.3847/1538-4365/acfaa2
- Myers et al. (2023) Myers, A. D., Moustakas, J., Bailey, S., et al. 2023, AJ, 165, 50, doi: 10.3847/1538-3881/aca5f9
- Naab & Ostriker (2017) Naab, T., & Ostriker, J. P. 2017, ARA&A, 55, 59, doi: 10.1146/annurev-astro-081913-040019
- Neistein et al. (2011) Neistein, E., Li, C., Khochfar, S., et al. 2011, MNRAS, 416, 1486, doi: 10.1111/j.1365-2966.2011.19145.x
- Norberg et al. (2002) Norberg, P., Baugh, C. M., Hawkins, E., et al. 2002, MNRAS, 332, 827, doi: 10.1046/j.1365-8711.2002.05348.x
- Old et al. (2014) Old, L., Skibba, R. A., Pearce, F. R., et al. 2014, MNRAS, 441, 1513, doi: 10.1093/mnras/stu545
- Old et al. (2015) Old, L., Wojtak, R., Mamon, G. A., et al. 2015, MNRAS, 449, 1897, doi: 10.1093/mnras/stv421
- Peacock & Smith (2000) Peacock, J. A., & Smith, R. E. 2000, MNRAS, 318, 1144, doi: 10.1046/j.1365-8711.2000.03779.x
- Planck Collaboration et al. (2020a) Planck Collaboration, Aghanim, N., Akrami, Y., et al. 2020a, A&A, 641, A6, doi: 10.1051/0004-6361/201833910
- Planck Collaboration et al. (2020b) —. 2020b, A&A, 641, A6, doi: 10.1051/0004-6361/201833910
- Raichoor et al. (2020) Raichoor, A., Eisenstein, D. J., Karim, T., et al. 2020, Research Notes of the American Astronomical Society, 4, 180, doi: 10.3847/2515-5172/abc078
- Raichoor et al. (2020) Raichoor, A., Eisenstein, D. J., Karim, T., et al. 2020, Research Notes of the AAS, 4, 180, doi: 10.3847/2515-5172/abc078
- Raichoor et al. (2023) Raichoor, A., Moustakas, J., Newman, J. A., et al. 2023, AJ, 165, 126, doi: 10.3847/1538-3881/acb213
- Ruiz-Macias et al. (2020) Ruiz-Macias, O., Zarrouk, P., Cole, S., et al. 2020, Research Notes of the American Astronomical Society, 4, 187, doi: 10.3847/2515-5172/abc25a
- Ruiz-Macias et al. (2020) Ruiz-Macias, O., Zarrouk, P., Cole, S., et al. 2020, Research Notes of the AAS, 4, 187, doi: 10.3847/2515-5172/abc25a
- Sales et al. (2022) Sales, L. V., Wetzel, A., & Fattahi, A. 2022, Nature Astronomy, 6, 897, doi: 10.1038/s41550-022-01689-w
- Schlafly et al. (2023) Schlafly, E. F., Kirkby, D., Schlegel, D. J., et al. 2023, arXiv e-prints, arXiv:2306.06309, doi: 10.48550/arXiv.2306.06309
- Silber et al. (2023) Silber, J. H., Fagrelius, P., Fanning, K., et al. 2023, AJ, 165, 9, doi: 10.3847/1538-3881/ac9ab1
- Smercina et al. (2018) Smercina, A., Bell, E. F., Price, P. A., et al. 2018, ApJ, 863, 152, doi: 10.3847/1538-4357/aad2d6
- Somerville et al. (2004) Somerville, R. S., Lee, K., Ferguson, H. C., et al. 2004, ApJ, 600, L171, doi: 10.1086/378628
- Springel (2005) Springel, V. 2005, MNRAS, 364, 1105, doi: 10.1111/j.1365-2966.2005.09655.x
- Springel et al. (2001) Springel, V., Yoshida, N., & White, S. D. M. 2001, New A, 6, 79, doi: 10.1016/S1384-1076(01)00042-2
- The Dark Energy Survey Collaboration (2005) The Dark Energy Survey Collaboration. 2005, arXiv e-prints, astro, doi: 10.48550/arXiv.astro-ph/0510346
- Tinker et al. (2021a) Tinker, J. L., Cao, J., Alpaslan, M., et al. 2021a, MNRAS, 505, 5370, doi: 10.1093/mnras/stab1576
- Tinker et al. (2021b) —. 2021b, MNRAS, 505, 5370, doi: 10.1093/mnras/stab1576
- Tinker et al. (2005) Tinker, J. L., Weinberg, D. H., Zheng, Z., & Zehavi, I. 2005, ApJ, 631, 41, doi: 10.1086/432084
- To et al. (2020) To, C.-H., Reddick, R. M., Rozo, E., Rykoff, E., & Wechsler, R. H. 2020, ApJ, 897, 15, doi: 10.3847/1538-4357/ab9636
- Vale & Ostriker (2004) Vale, A., & Ostriker, J. P. 2004, MNRAS, 353, 189, doi: 10.1111/j.1365-2966.2004.08059.x
- van den Bosch et al. (2003) van den Bosch, F. C., Yang, X., & Mo, H. J. 2003, MNRAS, 340, 771, doi: 10.1046/j.1365-8711.2003.06335.x
- van den Bosch et al. (2007) van den Bosch, F. C., Yang, X., Mo, H. J., et al. 2007, MNRAS, 376, 841, doi: 10.1111/j.1365-2966.2007.11493.x
- Wang et al. (2016) Wang, H., Mo, H. J., Yang, X., et al. 2016, ApJ, 831, 164, doi: 10.3847/0004-637X/831/2/164
- Wang et al. (2020) Wang, K., Mo, H. J., Li, C., Meng, J., & Chen, Y. 2020, MNRAS, 499, 89, doi: 10.1093/mnras/staa2816
- Wang et al. (2014) Wang, L., Yang, X., Shen, S., et al. 2014, MNRAS, 439, 611, doi: 10.1093/mnras/stt2481
- Wang et al. (2021) Wang, W., Takada, M., Li, X., et al. 2021, MNRAS, 500, 3776, doi: 10.1093/mnras/staa3495
- Wang et al. (2007) Wang, Y., Yang, X., Mo, H. J., & van den Bosch, F. C. 2007, ApJ, 664, 608, doi: 10.1086/519245
- Wang et al. (2019) Wang, Z., Xu, H., Yang, X., et al. 2019, ApJ, 879, 71, doi: 10.3847/1538-4357/ab25e6
- Wechsler & Tinker (2018) Wechsler, R. H., & Tinker, J. L. 2018, ARA&A, 56, 435, doi: 10.1146/annurev-astro-081817-051756
- Willmer (2018) Willmer, C. N. A. 2018, ApJS, 236, 47, doi: 10.3847/1538-4365/aabfdf
- Xu et al. (2023) Xu, H., Zheng, Z., Yang, X., & Li, Q. 2023, arXiv e-prints, arXiv:2311.04966. https://arxiv.org/abs/2311.04966
- Yang et al. (2005a) Yang, X., Mo, H. J., Jing, Y. P., & van den Bosch, F. C. 2005a, MNRAS, 358, 217, doi: 10.1111/j.1365-2966.2005.08801.x
- Yang et al. (2003) Yang, X., Mo, H. J., & van den Bosch, F. C. 2003, MNRAS, 339, 1057, doi: 10.1046/j.1365-8711.2003.06254.x
- Yang et al. (2008) —. 2008, ApJ, 676, 248, doi: 10.1086/528954
- Yang et al. (2009) —. 2009, ApJ, 695, 900, doi: 10.1088/0004-637X/695/2/900
- Yang et al. (2005b) Yang, X., Mo, H. J., van den Bosch, F. C., & Jing, Y. P. 2005b, MNRAS, 356, 1293, doi: 10.1111/j.1365-2966.2005.08560.x
- Yang et al. (2007) Yang, X., Mo, H. J., van den Bosch, F. C., et al. 2007, ApJ, 671, 153, doi: 10.1086/522027
- Yang et al. (2012) Yang, X., Mo, H. J., van den Bosch, F. C., Zhang, Y., & Han, J. 2012, ApJ, 752, 41, doi: 10.1088/0004-637X/752/1/41
- Yang et al. (2018) Yang, X., Zhang, Y., Wang, H., et al. 2018, ApJ, 860, 30, doi: 10.3847/1538-4357/aac2ce
- Yang et al. (2021) Yang, X., Xu, H., He, M., et al. 2021, ApJ, 909, 143, doi: 10.3847/1538-4357/abddb2
- Yèche et al. (2020a) Yèche, C., Palanque-Delabrouille, N., Claveau, C.-A., et al. 2020a, Research Notes of the American Astronomical Society, 4, 179, doi: 10.3847/2515-5172/abc01a
- Yèche et al. (2020b) —. 2020b, Research Notes of the American Astronomical Society, 4, 179, doi: 10.3847/2515-5172/abc01a
- York et al. (2000) York, D. G., Adelman, J., Anderson, John E., J., et al. 2000, AJ, 120, 1579, doi: 10.1086/301513
- Yuan et al. (2018) Yuan, S., Eisenstein, D. J., & Garrison, L. H. 2018, MNRAS, 478, 2019, doi: 10.1093/mnras/sty1089
- Yuan et al. (2022) Yuan, S., Garrison, L. H., Hadzhiyska, B., Bose, S., & Eisenstein, D. J. 2022, MNRAS, 510, 3301, doi: 10.1093/mnras/stab3355
- Zehavi et al. (2005) Zehavi, I., Zheng, Z., Weinberg, D. H., et al. 2005, ApJ, 630, 1, doi: 10.1086/431891
- Zehavi et al. (2011) —. 2011, ApJ, 736, 59, doi: 10.1088/0004-637X/736/1/59
- Zhao et al. (2020) Zhao, P., Xu, H., Katsianis, A., & Yang, X.-H. 2020, Research in Astronomy and Astrophysics, 20, 195, doi: 10.1088/1674-4527/20/12/195
- Zheng et al. (2009) Zheng, Z., Zehavi, I., Eisenstein, D. J., Weinberg, D. H., & Jing, Y. P. 2009, ApJ, 707, 554, doi: 10.1088/0004-637X/707/1/554
- Zheng et al. (2005) Zheng, Z., Berlind, A. A., Weinberg, D. H., et al. 2005, ApJ, 633, 791, doi: 10.1086/466510
- Zhou et al. (2020) Zhou, R., Newman, J. A., Dawson, K. S., et al. 2020, Research Notes of the American Astronomical Society, 4, 181, doi: 10.3847/2515-5172/abc0f4
- Zhou et al. (2020) Zhou, R., Newman, J. A., Dawson, K. S., et al. 2020, Research Notes of the AAS, 4, 181, doi: 10.3847/2515-5172/abc0f4
- Zhou et al. (2021) Zhou, R., Newman, J. A., Mao, Y.-Y., et al. 2021, MNRAS, 501, 3309, doi: 10.1093/mnras/staa3764
- Zhou et al. (2023) Zhou, R., Dey, B., Newman, J. A., et al. 2023, AJ, 165, 58, doi: 10.3847/1538-3881/aca5fb
- Zou et al. (2019) Zou, H., Gao, J., Zhou, X., & Kong, X. 2019, ApJS, 242, 8, doi: 10.3847/1538-4365/ab1847
- Zou et al. (2017) Zou, H., Zhou, X., Fan, X., et al. 2017, PASP, 129, 064101, doi: 10.1088/1538-3873/aa65ba
- Zu & Mandelbaum (2015) Zu, Y., & Mandelbaum, R. 2015, MNRAS, 454, 1161, doi: 10.1093/mnras/stv2062
- Zu & Mandelbaum (2016) —. 2016, MNRAS, 457, 4360, doi: 10.1093/mnras/stw221
- Zu & Mandelbaum (2018) —. 2018, MNRAS, 476, 1637, doi: 10.1093/mnras/sty279