Phenomenology of Heavy Neutral Gauge Boson at Muon Collider
Abstract
Heavy neutral gauge boson is proposed in many new physics models. It has rich phenomena at the future muon collider. We study the properties of boson with the process of , , and . The discrepancy of coupling to different types of particles can be shown in the cross section distributions around the resonance peak of various decay modes.
Angular distributions of the final quark or lepton in process are sensitive to the parameters such as mass of and the mixing angle. The interaction of new gauge boson coupling to the standard model gauge particles and Higgs boson are also studied through and . The cross section and the final particles’ angular distributions with the contribution of boson differ from those processes with only standard model particles. A forward-backward asymmetry defined by the angular distribution is provided to show the potential of searching for new physics at the muon collider. Especially, the beam polarization with certain value can effectively enlarge the forward-backward asymmetry.
Keywords: boson, Muon collider, New physics
PACS numbers: 12.60.Cn,13.66.Lm,14.70.Pw
section[0pt]\filright \contentspush\thecontentslabel \titlerule*[6pt].\contentspage \titlecontentssubsection[15pt]\filright \contentspush\thecontentslabel \titlerule*[6pt].\contentspage \titlecontentssubsubsection[25pt]\filright \contentspush\thecontentslabel \titlerule*[6pt].\contentspage
I Introduction
Heavy neutral gauge boson () is predicted in various theories beyond the Standard Model. An attractive motivation came from the development of grand unified theory (GUT) with the extension of gauge group, such as those based on or [1, 2, 3, 4, 5, 6, 7, 8, 9]. The models with extra dimensions also allow the Kaluza-Klein excitations of gauge boson [10, 11]. Recently, the LHC has reported the research of TeV scale boson via the process of dijet [12, 13], dilepton [14, 15], diphoton [16, 17] , diboson [18, 19] and [20, 21]. The model dependent excluded mass region with an upper bound can reach 4.5 (5.1) TeV for boson [14]. Meanwhile, the lepton colliders have the superiority of low background compared with the hadron colliders. It would be a better machine for the precision measurement on the extra neutral gauge boson at the future electron-positron colliders [22, 23]. Furthermore, a muon collider, proposed with the less synchrotron radiation and higher collision energy, provides a bright prospect for the TeV search.
A possible gauge group extension theory is to add an additional group to the standard model group , which may result in models derived from GUT. Additional group can also result from higher dimensional constructions such as string compactifications [24, 25]. In many models of GUT symmetry breaking, groups survive at relatively low energies, resulting in corresponding neutral gauge bosons, commonly referred to as bosons [26]. Many other models predict the existence of boson, such as 3-3-1 model [27], Minimal model [28, 29, 30] , Top-philic model [31, 32] and Vector-leptoquark model [33]. In these models, the coupling strength of with standard model particles is different. The properties of extra neutral gauge bosons have been extensively investigated in various models at the Large Electron-Positron Collider (LEP) and LHC [34, 35, 36, 37, 38, 39, 40].
Recently, a muon collider has been proposed with great potential in high-energy physics. It can offer collisions of point-like particles at very high energies, since muons can be accelerated in a ring without limitation from synchrotron radiation [41]. In the past few years, the International Muon Collider Collaboration (IMCC) has been actively exploring the construction of a muon collider with center-of-mass system (C.M.S.) energy of 10 TeV or higher and with high luminosity [42, 43]. In our previous research, we have investigated the process of interaction at 14 TeV LHC and the future electron-positron collider [44, 22]. An angular distribution is suggested to investigate the properties of coupling to other particles. In this paper, we will study the phenomenology of heavy neutral gauge boson at muon collider via the processes of , , and . This study will provide detailed prospects for the heavy neutral gauge boson at the muon collider.
This paper is organized as follows. In Section 2, we will give a detailed introduction to the theoretical framework. In Section 3, we study the scattering cross section and final state angular distribution of the processes with various decay modes and the results with different beam polarizations are provided. Finally, a summary is presented.
II Theoretical Framework and Collider Constraints
In order to introduce the neutral gauge boson, we extend an additional group in the gauge group structure of the standard model, . We follow the notations in reference [45] to depict the interactions and mass relationships in the Hidden Abelian Higgs Model (HAHM). The sector of this new group is coupled to the standard model particles only through kinetic mixing with the hypercharge gauge boson . The kinetic energy terms of the gauge group are
| (1) |
where is helpful to maintain the consistency between the accurate electric weak prediction and the experimental measurement results. The gauge sector of Lagrangian can be written as
| (2) |
where , and are the field strength tensors of , and respectively. We diagonalize the neutral gauge boson mass matrix and obtain the mass eigenstates as
| (3) |
where the usual weak mixing angle and new gauge boson mixing angle are
| (4) |
with
| (5) |
where and are the masses before mixing of and . The mass eigenvalues of these two neutral gauge bosons are expressed as
| (6) |
From the above expression we can get the mass eigenvalue and with in a suitable range. Therefore, The interaction can be parameterized as
| (7) |
The and boson coupling to SM fermions can be expressed as
| (8) |
| (9) |
where , is the third component of weak isospin, is hypercharge and is the Weinberg angle. () and ( are the factors of vector and pseudovector component. We list the typical value of these parameters in Table 9 in Appendix Appendix A: Detailed study of process with , and , respectively.
The mass value of and are the main free parameters in the model. The mass region of is predicted in the direct measurements from the lepton and hadron colliders [46, 47]. The mixing angle is determined by value from Equation (3), which is related to the mass of from Equation (6). The accurate mass of boson has been given experimentally with the value of GeV [48]. Thus, we choose the and in a range that can guarantee the deviation of the boson mass in our model not beyond its experimental deviation. The decay width of is taken 2% of its mass as input in the following simulation of this paper.
boson can come from more complicated modes such as GUT. In the context of most GUT models arising from the group, there exist two mixing angles, denoted as and . These mixing angles play a crucial role in the evolution process
| (10) |
Specifically, represents the mixing angle between the and groups, whereby these two groups combine linearly through the angle to form a novel . On the other hand, is the mixing angle between and the Standard Model’s . Various mixing angles give rise to distinct physical phenomena [49, 50, 51, 52, 53, 54, 55, 56, 57]. Accordingly, different models have emerged based on these mixing angles [58, 59, 60, 61, 62], such as the model with an additional [63], the model with an extra [63], and the model featuring a [64].
Numerous experimental analyses from various colliders in the past have provided mass or coupling constraints on the possible existence of particles within different models. The simple extension to SM boson is the so-called Sequential Standard Model (SSM) which implies the existence of with the same couplings as the boson except the mass value. The CMS collaboration has determined the lower mass limits for the Sequential Standard Model in the channels , , and or to be 4100 GeV, 4250 GeV, and 4500 GeV, respectively, based on the analysis of proton-proton collision data at TeV with an integrated luminosity of . The mass lower limits for the three decay channels corresponding to the model are 3450 GeV, 3700 GeV, and 3900 GeV [65], respectively. The ATLAS experiment has established exclusion limits at a confidence level for SSM bosons decaying into a pair of leptons, with a lower mass limit of 2420 GeV. Additionally, for the non-universal model, which demonstrates enhanced couplings to third-generation fermions, the exclusion limit is set at 2250 GeV [66]. Studies have been conducted for high-mass resonances in the dijet invariant mass spectrum. In the context of the SSM, gauge bosons with decays are excluded for masses up to , and in the leptophobic model with Standard Model-like couplings to quarks, gauge bosons are excluded for masses up to 2100 GeV at a confidence level [67] . Several prominent models and the current experimental lower mass limits are presented in Table 1 for reference.
| model | Group | Lower Limit of | ||
|---|---|---|---|---|
| 4100 GeV | ||||
| 3900 GeV | ||||
| 3900 GeV | ||||
| 1162 GeV |
For a hadron collider, the observational limits can be provided through a model-independent analysis. If one denotes by the number of signal events required for a discovery signal, the upper limit on the mass of is defined as [68],
| (11) |
where the details of the model are encoded in
| (12) |
For a collider, , , and in the kinematical region of interest at LHC . The predicted upper limit for is around 5000 GeV at a Large Hadron Collider with TeV [68]. Furthermore, the coupling constant for coupling to has been introduced in some models. Experimental groups like ATLAS [69, 70, 71, 12], CMS [72, 73, 74, 13, 75, 76, 72, 77, 78, 79], CDF [80, 81] and UA2 [82] have provided constraints on in various decay channels. Most of these exclusion lower limitations are the order of , and the most stringent limit coming from the study of dijet process by ATLAS with a lower bound of 0.05 when TeV [69].
Studies of the boson have also been conducted at lepton colliders, particularly in the low mass regions below 1000 GeV. Experiments carried out by ALEPH and OPAL at LEP have constrained the mass of the boson through the process, where represents either a lepton or a quark. The lower mass limits for the , derived from pair production, are 365 GeV for ALEPH and 355 GeV for OPAL, while those obtained from production are 523 GeV for ALEPH and 375 GeV for OPAL [83]. With the prospect of future lepton colliders, there is potential to significantly extend the mass range and coupling strength of the boson, especially in the context of Higgs boson production.
For the Hidden Abelian Higgs Model, the new gauge sector couples with the Standard Model solely through the dynamical mixing with the hypercharge gauge boson, denoted as . Many experiments are more concerned with the coupling constraints between and dark matter particles, with typically taking values smaller than the mass of the boson [84, 85, 86]. Some experimental and phenomenological studies have also imposed constraints on this model in other parameter spaces [87, 88]. The limitations on the value in the Hidden Abelian Higgs Model are investigated in different colliders. For example, it has been suggested that there maybe an opportunity to detect signals of the particle in this model when exceeds 0.03 at the LHC with the integrated luminosity of 100 in the mass region of GeV. For the International Linear Collider (ILC) at for 500 integrated luminosity, a mass of requires value greater than in order to achieve a significance level exceeding in the process [89].
III Boson Production and Decay at Future Muon Collider
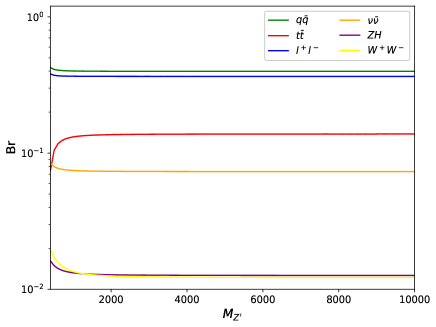
In this part, we will study the production and decay with the process of , , and . The main decay branch ratios of are illustrated in Figure 1. and are the dominant decay modes with the branching ratio around 40% and 35%. The branching ratio of can reach 14% with the mass of larger than the threshold of top pair production. Although the branching ratio of and is only about 1%, it is useful to study these decay processes for the interaction between and other gauge bosons and Higgs particle. The decay modes of is also an interesting process for the invisible decay, which is out of the reach of this paper.
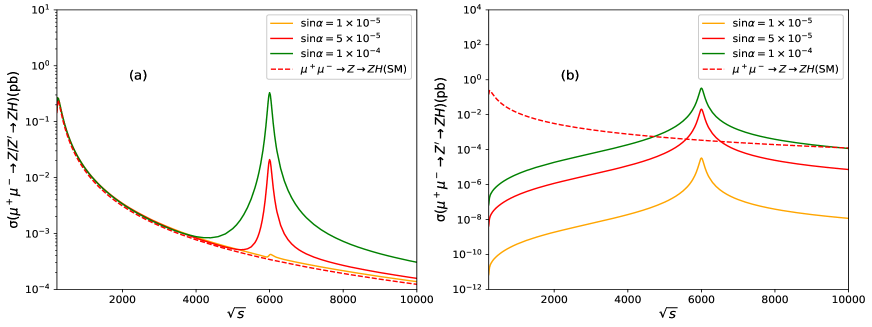
We give an example for the production of at the muon collider. The cross section distribution as a function of is shown in Figure 2. Comparing with the result of , the cross section induced by increases with the increasing of . The values of the vertex factor in Equations (7) and (8) with the typical value of are presented in Table 9.
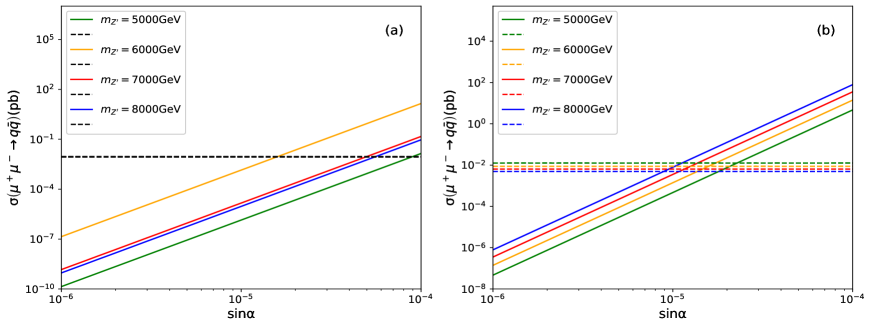
In Figure 2 (a), the cross section induced by boson is 0.0088 pb with GeV, and it will be the same value in the induced process when GeV and . The distribution of cross section has the maximum value with GeV for the resonance enhancement with the C.M.S. energy close to . While the cross sections show different orders with various mass values in Figure 2 (b). In this case the cross section increases with the increasing of where the resonance enhancement is included in each case for . The cross sections of other processes induced by boson, such as , and , have the same distributions which can be obtained using the proportions of the decay branching ratio. In order to directly display the dependence between the mass of boson, the mixing angle and the production of , we give the cross section of projected to the plane in Figure 3. In this plot we have considered the constraint on from the measurement of boson mass. We have required that the mass correction of boson according to Equation (6) should be less than the experimental deviation in [48], thus the blank space in Figure 3 is excluded by the experimental measurement. The cross section is insensitive to when the mass of is relatively small.
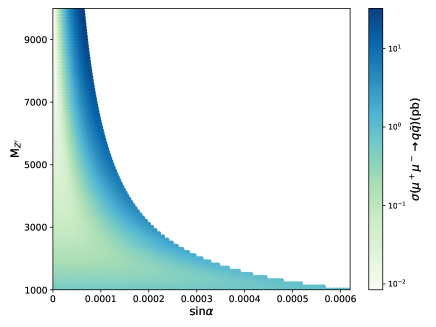
As increases, the allowed range of decreases, meanwhile the scattering cross section gradually becomes sensitive to . This means that when mass is large, a suitable can lead to a larger cross section. With GeV and , the cross section can be reached 12 pb at the C.M.S. energy of 6 TeV. In this figure, the maximum cross section value is about 32 pb, which corresponds to GeV and . Similar to Figure 2, the cross section of other processes induced by have the similar dependence on and . We will study the effects in each decay channel in the following sections.
III.1 search in
III.1.1 The cross section of process
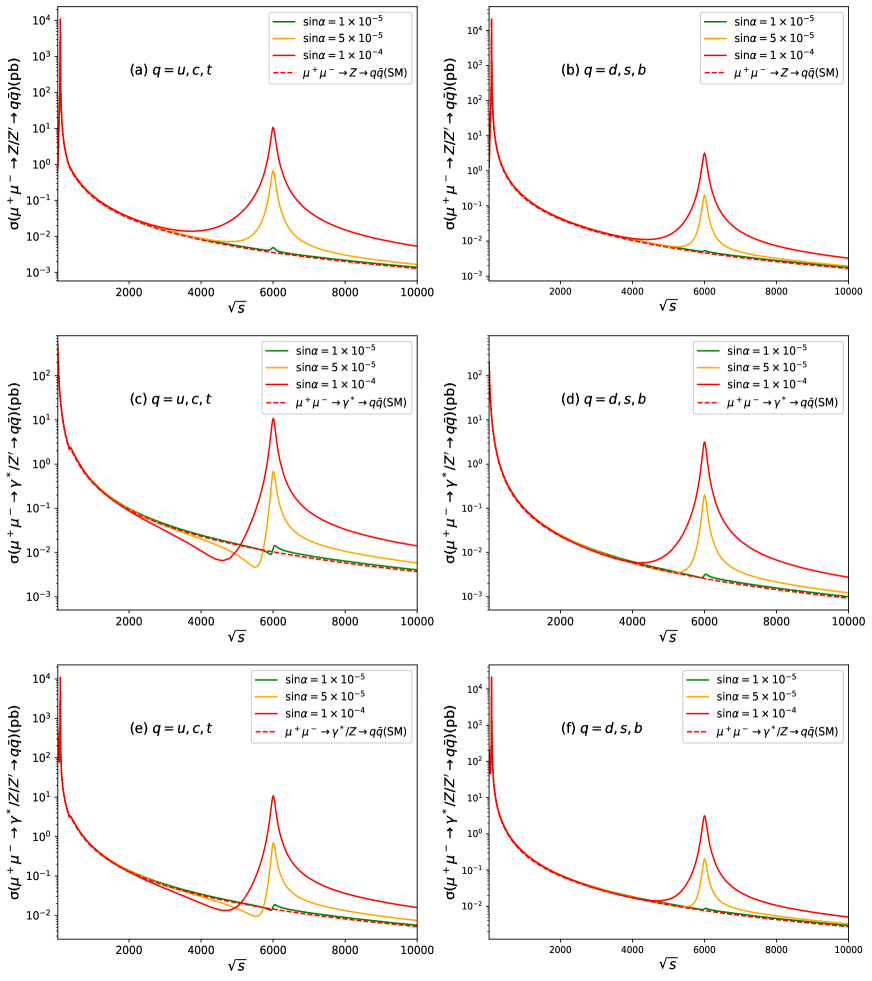
We have simulated the production of quark final state processes with all flavors. Through the analysis of the results, we divide the quark processes into two categories according to the electrical properties of quarks, where are quarks with positive charges, and are quarks with negative charges. In Figure 4, we show the variation of the scattering cross sections of these two kinds of quark final state processes with different C.M.S. energy. When the C.M.S. energy approaches the mass of , a prominent resonance peak will manifest, which is consistent with the phenomenon observed in Figure 2. Another interesting phenomenon occurs in the process. If the final state quarks carry positive charge, the scattering cross section will exhibit suppressions with different values as the C.M.S. energy approaching and falling below the mass. However, this phenomenon is not observed when the final state quarks carry negative charge. The discrepancy is obvious in Figure 4 (e) and (f), which is due to the negative interference effect of and . The detailed analysis can be found in Appendix Appendix A: Detailed study of process . Furthermore, the suppression of the scattering cross section increases with the increasing value of and a larger resonance peak appears as shown in Figure 4.
III.1.2 The angular distribution of quarks in
As we all know, the top quark will decay before hadronization which will not be the same as other quarks. We firstly focus on investigating processes involving light quarks excluded the top quark. Following the discussion in reference [83], we study the interaction between and other particles by analyzing the angular distribution of the final particles. The angle can be expressed from the following formula:
| (13) |
where and are the three momentum of the final and initial particle, respectively.
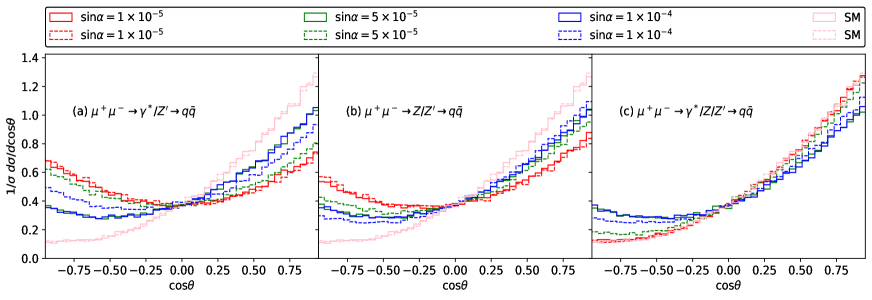
Figure 5 shows the angular distribution for the final quarks with TeV and the C.M.S. energy TeV and 8 TeV. We present the final quark angular distributions for , and processes respectively, from which a highly asymmetric angular distribution of the final state particles can be obtained. With the increasing of , the angular distributions with contribution deviate far from the SM distribution in Figure 5 (c). A forward-backward asymmetry according to the angular distribution can be defined as
| (14) |
The corresponding forward-backward asymmetries of process are listed in Table 2. The asymmetry becomes large with the C.M.S. energy changing from 6000 GeV to 8000 GeV. With the increasing of , the asymmetry changes small and far from the SM.
| 6000 GeV | ||||
|---|---|---|---|---|
| 8000 GeV | ||||
Due to the short lifetime of quark, we will discuss quark processes separately. The leptonic decay modes for quarks via is selected in our study. Figure 6 displays the corresponding Feynman diagram. The angular distributions of the final leptons are investigated for studying in the future muon colliders with the cascade decay shown in Figure 7. The angular distribution of the final leptons is utilized to study the properties in the top pair production, where the final lepton angular distribution is defined as formula (13) with being and being , respectively. It is noteworthy that the dilepton signal produced by the decay channel of quarks differs significantly from that produced by the direct decay of or bosons to diquarks.

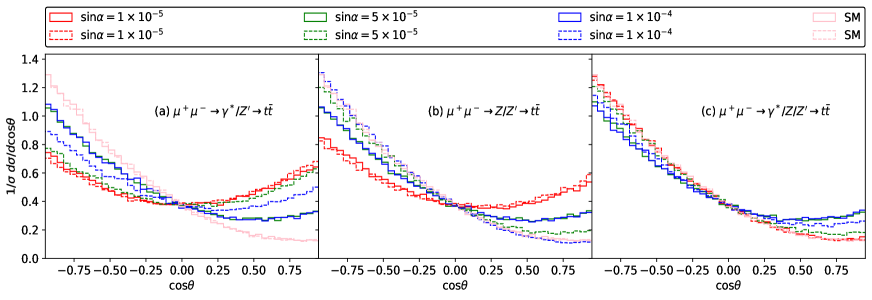
The major difference derives from the following two parts. Firstly, the dilepton directly generated by or can only be the same generation of leptons to meet the conservation of lepton numbers, namely and (where is excluded for its short life time and different detection methods). But the dilepton produced by the decay channel of quark actually decay from and to leptons and corresponding neutrinos, so dilepton can be the combination of , , , . Secondly, since the final state particle we choose is a particle rather than an antiparticle, the angular distribution in the process should be inverse of the light quark process, which is caused by coming from the decay of quark. The forward-backward asymmetry of the angular distribution for the process are listed in Table 3. With the same value of , as the mixing angle increases, the angular distribution deviates from the standard model further. The asymmetry will be slightly enhanced with the C.M.S. energy increasing in the process of intermediate as shown in Figure 7 (c).
| 6000 GeV | ||||
|---|---|---|---|---|
| 8000 GeV | ||||
III.1.3 Signals with beam polarization
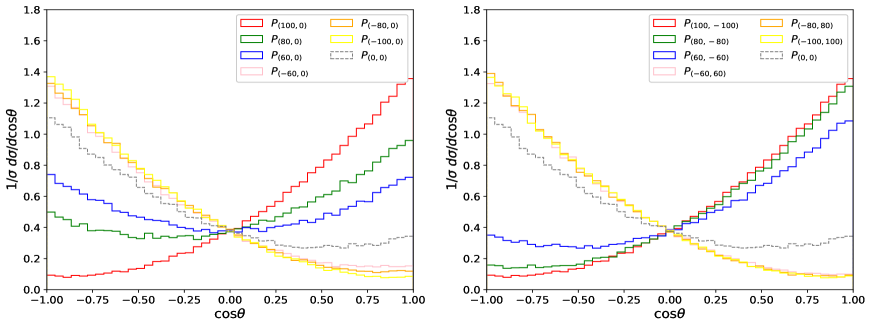
The beam polarization has superiority at the lepton colliders, which can be employed to enhance the effects from boson in some ways. In the case of the Circular Electron-Positron Collider (CEPC), the choice has been made to employ a polarized electron source. In order to facilitate the future collision between polarized electron beams and unpolarized positron beams, the Circular Electron Positron Collider (CEPC) contemplates the utilization of a specially prepared GaAs/GaAsP superlattice photocathode DC gun-type electron source. This implementation is expected to result in the production of polarized electron beams with a polarization degree exceeding on average [90]. Although it is not easy to keep the large luminosity associated with the large beam polarizations stated by J. F. Gunion [91], the prospects of muon beam polarization on future circular colliders have also been widely discussed [42, 92, 93, 94, 95], with the International Muon Collider Collaboration presenting exclusion regions for luminosity at different collision energies when muon beam polarization is set at [96].We investigate the process with different polarizations of muon. The cross section is shown in Figure 8 with the polarization of and values ranging from to . From Figure 8, one can find that the beam polarization can significantly affect the scattering cross section of the process. The cross section with is times larger than that with when . The maximum cross section is about pb with close to -100 and close to 100. Besides, there is an interesting point with around , where the cross section is about with all kinds of value for .
We also show the final quarks angular distribution for with different values of beam polarization in Figure 9. The angular distribution has a slight difference when comparing with the unpolarization condition. While, it can greatly affect the angular distribution when is positive, and even changes to the inverse tendency of the distribution when . For example, the distribution asymmetry with is larger than that with . In Figure 10, we show the dependence of the angular distribution of the final charged leptons and the beam polarization in the top quark pair production. We can clearly see that the beam polarization has a great influence on the angular distribution of the final particles comparing with the unpolarized condition. The distribution is the same as in Figure 9 with a mirror symmetry.
The forward-backward asymmetry with different polarization of processes and are listed in Table 4. The asymmetry can be with the polarization of () in process. The asymmetry of is about the same value as process but with an opposite sign. The results show that the asymmetry is an observable sensitively to the polarization.
III.2 search in
III.2.1 The cross section of process
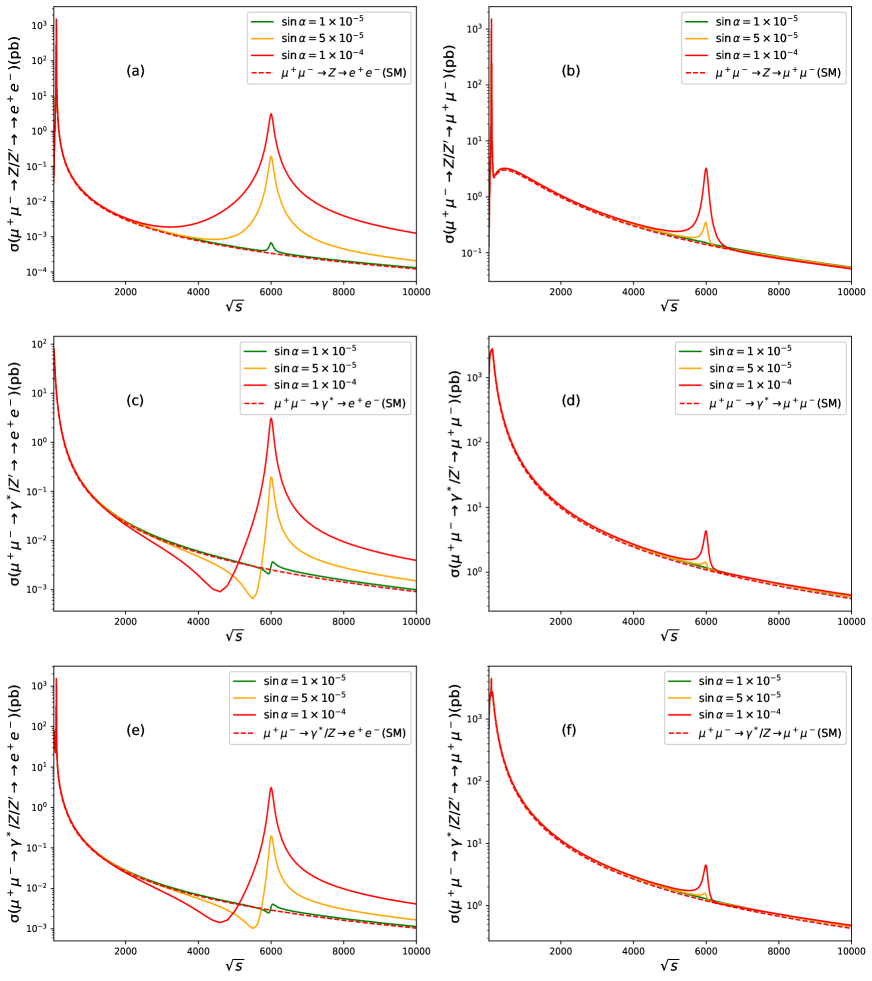
As a process widely studied for the neutral gauge boson production, the process on the future Muon Collider is also very meaningful. The dilepton process, compared with the diquark process, has additional channel Feynman diagrams. Due to the extremely short lifetime of the lepton, we only consider the final states with and referring to the dilepton final states. For the final states with and , as shown in Figure 11, they exhibit significant differences in the scattering cross section as well. The reason for this phenomenon is that only the channel Feynman diagram contributes to the scattering cross section in process , while there are also channel Feynman diagrams in process that contribute to the scattering cross section in addition to the channel contribution.
The cross section distribution of process is similar to the process with diquark final state with only channel Feynman diagrams. Due to the interference between and , the distribution has a valley in the region of C.M.S. energy smaller and closed to mass pole as shown in Figure 11 (c), (e). However, the production of final state has a different distribution since the channel Feynman diagram contributes to a positive value to offset the negative contribution from the interference between and as shown in Figure 11 (d), (f).
III.2.2 The angular distribution of leptons in process
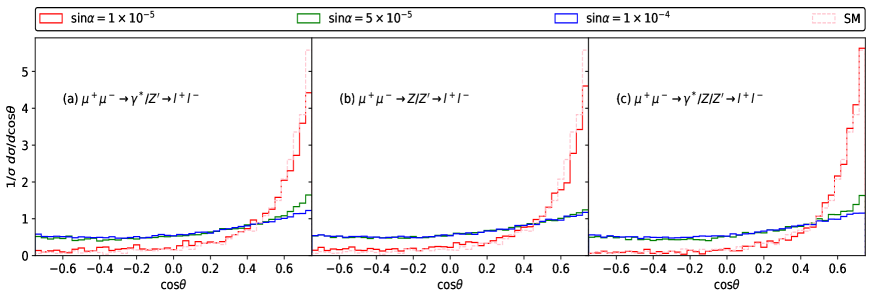
The angular distribution of the final leptons in process is investigated in this part. The angle is defined by the moving direction of and initial as Equation (13). We plot the angular distribution of leptons in the final state of the dilepton process in Figure 12. The distribution is not the same as because of the contribution from channel contribution. Most of the negative charged final leptons go along with the direction of , especially large number of the negative charged final leptons is close to the direction of . The forward-backward asymmetry is also defined as the formula of Equation (14) and the numbers are listed in Table 5. The asymmetry associated solely with the presence of contribution exhibits a reduced magnitude in comparison to that arising solely from the SM boson process. However, when the mixing angle is gradually increased, the contribution of to the process increases, leading to a decrease in the overall asymmetry. The process has additional contribution from -channel Feynman diagram comparing with the process , which leads to a greater asymmetry in the final particle angular distribution.
| 0.757 | 0.732 | 0.883 | ||||
| 0.240 | ||||||
| 0.224 |
III.2.3 Signals with beam polarization
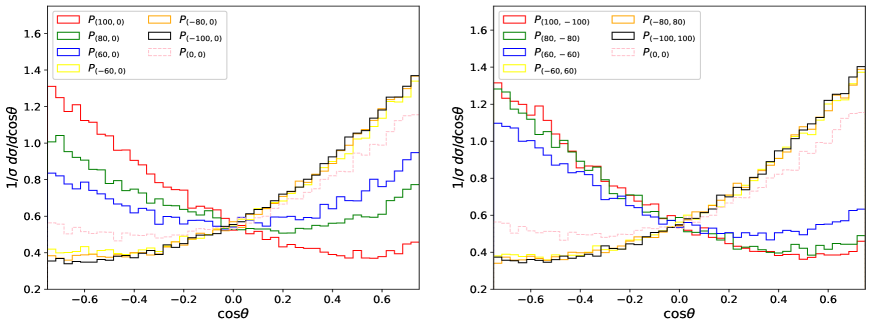
We investigate the relationship between the angular distribution of final lepton and the polarization of the initial muons. Figure 13 shows that the various beam polarizations will indeed change the angular distribution of final leptons. The tendency of the angular distribution with is inverse with . In Table 6, we list the values of forward-backward asymmetry with different beam polarization. The asymmetry is defined as the formula of Equation (14). It is found that when the value of is negative in the dilepton process, the forward-backward asymmetry for the final lepton angular distribution will change slightly. The asymmetry can be -0.361 with and 0.386 with . These results show that the study of the production with beam polarization is worthy to investigate the new physics models.
III.3 search in
The study of Higgs boson properties will be an important aim at the future muon colliders. Although the branching ratio of is a few percent, it is meaningful to study the process of .
III.3.1 The cross section of process
The cross section of with various C.M.S. energy is shown in Figure 14. The interference effect with boson is included in Figure 14 (a), which shows the same distributions as in electron-positron collider [22]. One can notice that when the C.M.S. energy is close to the mass of , a large resonance peak will be generated and the size of the resonance peak is affected by the mixing angle . When , the peak can be observed significantly. But the contribution of to the total cross section is small with the collision energy far away from mass pole. This phenomenon implies the signal of new physics is outstanding with the collision energy close to the mass of , which shows the advantage of muon collider to detect new physics with a larger mass scale than the electron-positron collider.
III.3.2 The angular distribution of leptons in the final state of process

In order to study the property of interaction, we consider the further decay of and Higgs bosons. The angular distribution of final leptons is studied in process of with and (). The corresponding Feynman diagram is shown in Figure 15.
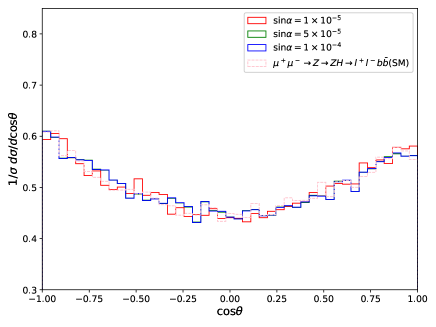
We present the angular distribution of the final leptons for process in Figure 16 . It is worthy of note that in order to better observe the angular distribution of the final leptons, we change the center of mass system of leptons into the center of mass system of through Lorentz transformation when calculating the scattering angle as [22]. In the calculation, we still use Formula (13) to calculate the angular distribution of the final leptons, where is and is . The asymmetry of this process is relatively small. When is , and , the forward-backward asymmetries are , and respectively with contributions while it is for the SM process. Although the difference of the angular distribution is not as clear as those in reference [22], the investigated mass range of reaches to a few TeV and is smaller about two order of magnitudes compared to the previous study. We will study the effect of beam polarization on this process in the following section.
III.3.3 Signals with beam polarization
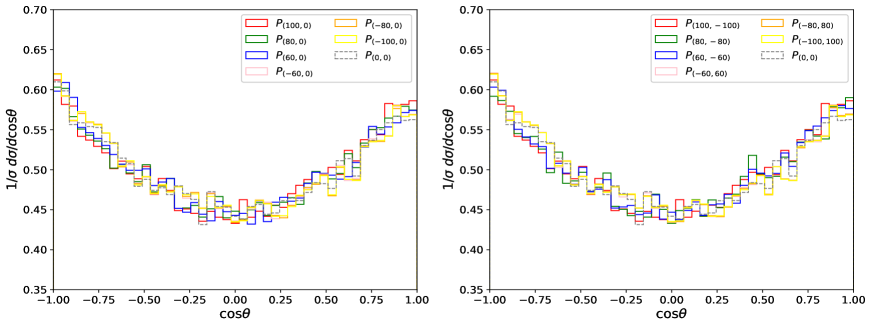
The influence of polarization on the cross section of is studied. The final lepton angular distributions with different beam polarizations are shown in Figure 17. The corresponding forward-backward asymmetries are listed in Table 7. The asymmetry can change sign with some specific polarizations, and the absolute values of the asymmetry range within a few percent. It requires a high precision detection on the asymmetry to distinguish the new physics through this process in the future muon collider.
III.4 search in
The interaction between and charged gauge boson is also an important part for the study of boson. In this section, we investigate the properties of the new physics model in the process of at the future muon collider.
III.4.1 The cross section of process
The Feynman diagrams of are shown in Figure 18. Each diagram separately contributes to a cross section that grows in the same manner as
| (15) |
where and are the momenta of the outgoing bosons. The contribution to the cross section within only channel Feynman diagram has a bad behavior at large C.M.S. energy which will break the unitarity. Fortunately, the badly behaved terms might be cancelled including the channel diagrams, leaving a more proper high-energy behavior. The cancellation is required by the Ward identity of the gauge theory. We calculate the cross section of process using FeynArts and FeynClac codes [97, 98, 99]. The detailed calculations are given in Appendix B.


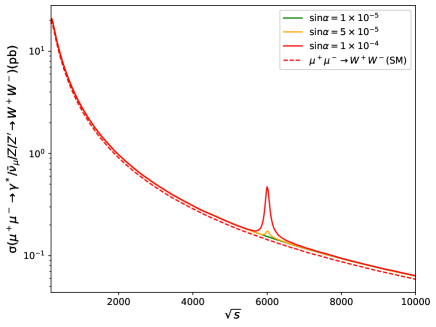
The cross section of with the C.M.S. energy is displayed in Figure 19. The cross section can reach pb at the resonance peak of 6000 GeV with . The channel process and channel process are not displayed separately as the previous processes since it is unphysical with the unitarity broken. The resonance peak is obviously compared to the purely SM contribution with in Figure 19.
III.4.2 The angular distribution of leptons in


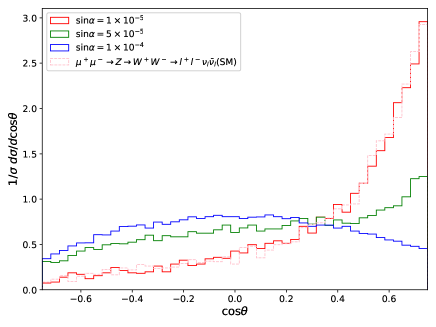
We study the final lepton angular distribution of () process. The Feynman diagram of this process is shown in Figure 20. The scattering angle is defined by the final state and initial beam moving direction in the laboratory frame as formula (13), where and . We show the corresponding angular distribution of this process in Figure 21. The plots show that the distribution including contribution is the same as that of the pure SM with , while the distribution changes greatly with the increasing of . According to formula (14) with , the forward-backward asymmetries are 0.664, 0.219, 0.015 corresponding to , , respectively and the value from SM is 0.657.
III.4.3 Signals with beam polarization
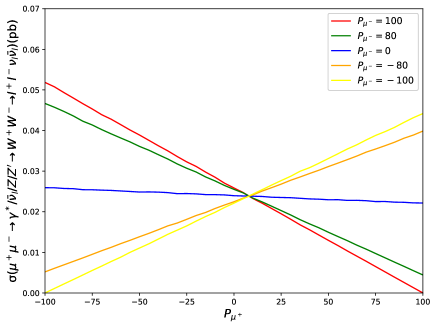
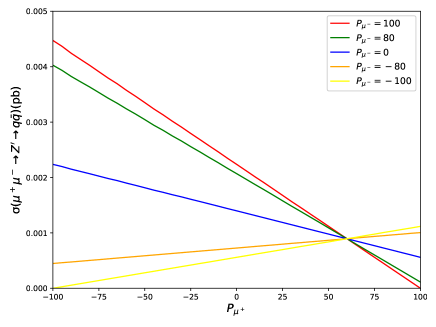
Beam polarization has a great influence on process . In the following, we will show the distribution of cross section and the final lepton angular distribution with different polarizations. The effect of polarization on the scattering cross section of process is different from that of process and , as shown in Figure 22. The cross section can reach the maximum value 0.044 pb with the polarization of , . Inversely, it leads to the minimum value of the cross section when , and , .
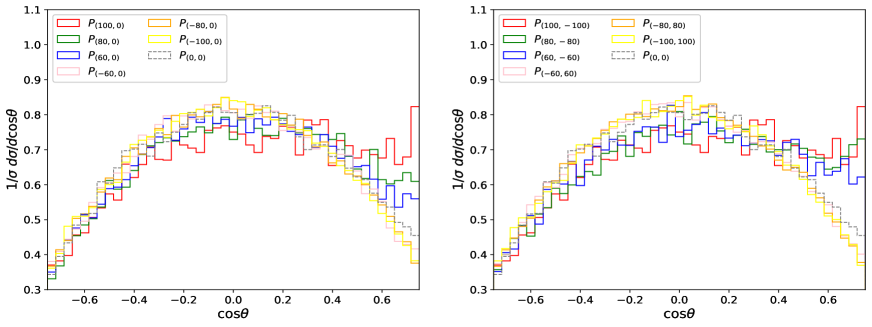
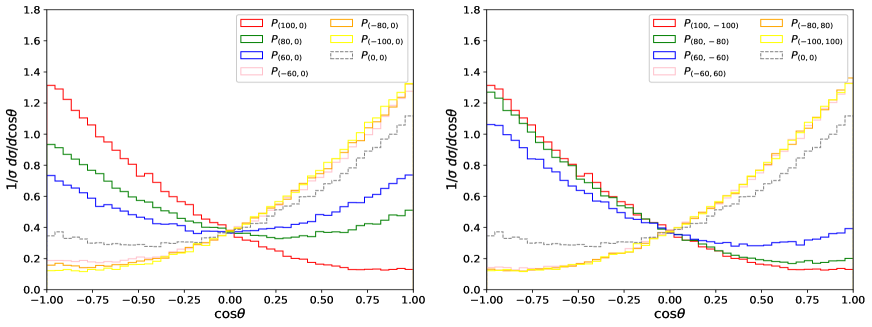
The angular distribution of process with different polarizations are shown in Figure 23. The corresponding forward-backward asymmetries with are given in Table 8. The results show that the angular distributions have large discrepancy in the region of with different beam polarization. There will be a large forward-backward asymmetry when , while it will be significantly reduced with . The forward-backward asymmetry can reach 0.086 when , .
IV Sensitivity
After the detailed studies of the cross section, decay channel and polarization effects, we perform the sensitivity of the search at the muon collider. From Figure 3 and Figure 4 we can find that the significance (defined as ) is large when the resonance mass is close to the collision energy. We have imposed constraints on processes in different parameter spaces in HAHM. In Figure 24, we give the cross section distributions for process correspond to different mixing angles and masses at the collision energy of 6 TeV and 10 TeV . The colored region imposes the constraints from boson mass measurement. The significance lines are illustrated with 5, 10, and 100. It can be observed that when the C.M.S energy closes to the mass of , the scattering cross section significantly increases. Furthermore, the cross section gradually decreases symmetrically around the resonance mass. The contour lines with a significance of in Figure 24 (a) exhibit a different distribution compared to other contour lines. This is due to the interference cancellation phenomenon observed in Figure 4 (c) and (e). As the mass of increases while keeping the collision energy a constant, the interference cancellation occurs within the range where is greater than the collision energy (corresponding to the region where the C.M.S energy is less than the resonance peak in Figure 4). This leads to an increase in the absolute value of contributions from the interference terms involving with photons and with , as the mixing angle increases, resulting in a reduction in the cross section. This effect causes the contour lines of in the region of differing from the other lines. The cross section can be achieved 0.013 pb at a collision energy of 6000 GeV. The region that cannot be detected is limited to the upper right colored region with a significance level less than 5. Figure 24 (b) illustrates the sensitivity of with its mass lower than or equal to the collision energy of 10 TeV. The distribution is similar to the region of GeV in Figure 24 (a). This implies that a muon collider with a collision energy at 10 TeV can explore a wide region of mass from 3500 GeV to 10000 GeV with a significance larger than .
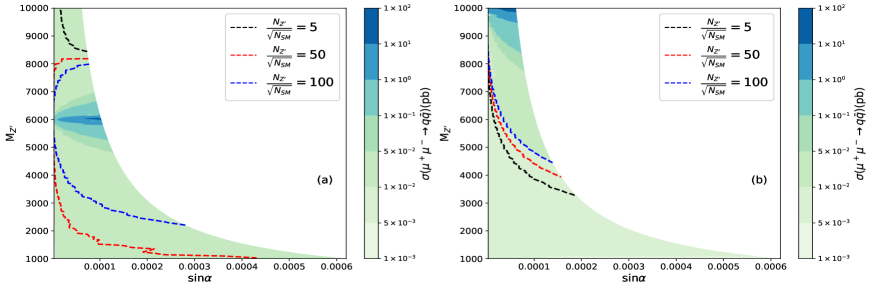
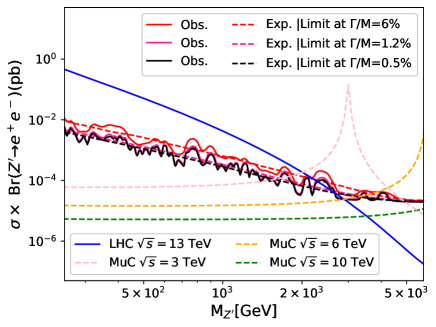
The ATLAS collaboration has performed the observation of at the LHC with process. We give the results of boson in HAHM at the LHC with and . The simulation results are presented by the blue solid line in Figure 25. The mass range lower than 2000 GeV is excluded by the LHC experimental results. For the muon collider, we have displayed the production of at the collision energy of 3, 6, 10 TeV with . We can find that the excluded mass region can be enlarged with the resonance peak effects. On the other hand, with the collision energy increasing, the study of heavy boson undetected at the LHC can be conducted at the muon collider.
V Summary
In this paper, we investigate the new neutral gauge boson production and decay at the muon colliders. The interactions and couplings of with SM fermions and gauge bosons derive from the Hidden Abelian Higgs Model proposed by J. D. Wells. The free parameters in the model are chosen as the mass of and , the typical value is set as TeV following the collision energy of future muon collider and which is safe to guarantee the current experimental measurement of boson mass. The cross section , final state angular distribution and the forward-backward asymmetry are studied in the mainly decay modes of . Each channel has special phenomena for studying properties of boson. The processes of light quark pair and lepton pair final state have the largest branching fraction for the search of boson. With GeV and , the cross section of can be reached 12 pb at the C.M.S. energy of 6 TeV. The cross section distributions with collision energies show discrepancies around the resonance peak with coupling to up-type or down-type quarks. While the distributions of and are different around the resonance peak because of the contribution from different Feynman diagrams. The interactions of with gauge boson and Higgs boson can be studied in and process. Although the branching ratio is a few percent, it shows the potential to test the new gauge interaction at the future muon colliders.
The angular distribution of the final leptons decaying from boson effectively reveals the properties of coupling with SM particles. The contribution from is obvious in the angular distribution comparing with the SM process. Meanwhile, the angular distributions are also sensitive to the mixing angle between . The corresponding forward-backward asymmetry defined by the angular distribution shows the numerically discrepancy with various parameters in the new physics model. This exotic neutral gauge boson can be introduced in many new physics models. The studies on boson depend on its interaction with the SM particles. Roughly there are two kinds of sources for the new interaction, one is coming from the SM-like gauge interaction , and the other is from the kinetic mixing of . The study of this work focuses on the latter one. The production of boson is very similar in various models except for the production rate proportional to different couplings. The decay of boson is also very general except the specific forbidden models. The mass constraints, production rates and detailed distributions will be differing from models depending on the input of the free parameters, but the methods of studying boson in this paper can be adopted to the other models. The studies of boson at the muon collider not only provide the new methods for the search of new physics, but also reveal the prospect on the new physics model at the future muon collider.
Ackonwledgement
This work was supported by the Natural Science Foundation of Shandong Province under grant No. ZR2022MA065 and National Natural Science Foundation of China (NNSFC) under grant Nos.12235008.
References
- Robinett and Rosner [1982a] R. W. Robinett and J. L. Rosner, Phys. Rev. D 25, 3036 (1982a), [Erratum: Phys.Rev.D 27, 679 (1983)].
- London and Rosner [1986] D. London and J. L. Rosner, Phys. Rev. D 34, 1530 (1986).
- Langacker et al. [1984] P. Langacker, R. W. Robinett, and J. L. Rosner, Phys. Rev. D 30, 1470 (1984).
- Hewett and Rizzo [1989] J. L. Hewett and T. G. Rizzo, Phys. Rept. 183, 193 (1989).
- Kang and Langacker [2005] J. Kang and P. Langacker, Phys. Rev. D 71, 035014 (2005), arXiv:hep-ph/0412190 .
- Li et al. [2022] T. Li, Q. Xiang, X. Yin, and H. Zhou, Phys. Rev. D 106, 075010 (2022), arXiv:2201.03878 [hep-ph] .
- Lazarides and Shafi [2019] G. Lazarides and Q. Shafi, JHEP 10, 193, arXiv:1904.06880 [hep-ph] .
- Pernow [2019] M. Pernow, Phenomenology of SO(10) Grand Unified Theories, Ph.D. thesis, Royal Inst. Tech., Stockholm (2019).
- Benavides et al. [2018] R. H. Benavides, L. Muñoz, W. A. Ponce, O. Rodríguez, and E. Rojas, Int. J. Mod. Phys. A 33, 1850206 (2018), arXiv:1801.10595 [hep-ph] .
- Han et al. [1999] T. Han, J. D. Lykken, and R.-J. Zhang, Phys. Rev. D 59, 105006 (1999), arXiv:hep-ph/9811350 .
- Duff et al. [1986] M. J. Duff, B. E. W. Nilsson, and C. N. Pope, Phys. Rept. 130, 1 (1986).
- Aad et al. [2020a] G. Aad et al. (ATLAS), JHEP 03, 145, arXiv:1910.08447 [hep-ex] .
- Sirunyan et al. [2020a] A. M. Sirunyan et al. (CMS), JHEP 05, 033, arXiv:1911.03947 [hep-ex] .
- Aad et al. [2019] G. Aad et al. (ATLAS), Phys. Lett. B 796, 68 (2019), arXiv:1903.06248 [hep-ex] .
- Sirunyan et al. [2021] A. M. Sirunyan et al. (CMS), JHEP 07, 208, arXiv:2103.02708 [hep-ex] .
- Aaboud et al. [2016] M. Aaboud et al. (ATLAS), JHEP 09, 001, arXiv:1606.03833 [hep-ex] .
- Khachatryan et al. [2017] V. Khachatryan et al. (CMS), Phys. Lett. B 767, 147 (2017), arXiv:1609.02507 [hep-ex] .
- Aad et al. [2020b] G. Aad et al. (ATLAS), Eur. Phys. J. C 80, 1165 (2020b), arXiv:2004.14636 [hep-ex] .
- Tumasyan et al. [2022] A. Tumasyan et al. (CMS), Phys. Rev. D 105, 032008 (2022), arXiv:2109.06055 [hep-ex] .
- Aad et al. [2013] G. Aad et al. (ATLAS), JHEP 01, 116, arXiv:1211.2202 [hep-ex] .
- Khachatryan et al. [2016a] V. Khachatryan et al. (CMS), Phys. Rev. D 93, 012001 (2016a), arXiv:1506.03062 [hep-ex] .
- Yin et al. [2022] X. Yin, H. Li, Y. Jin, Z. Han, and Z. Lu, Chin. Phys. C 46, 053106 (2022), arXiv:2112.13975 [hep-ph] .
- Dong et al. [2018] M. Dong et al. (CEPC Study Group), (2018), arXiv:1811.10545 [hep-ex] .
- Cvetic and Langacker [1998] M. Cvetic and P. Langacker, Adv. Ser. Direct. High Energy Phys. 18, 312 (1998), arXiv:hep-ph/9707451 .
- Cvetic and Langacker [1996] M. Cvetic and P. Langacker, Phys. Rev. D 54, 3570 (1996), arXiv:hep-ph/9511378 .
- Langacker [2009] P. Langacker, Rev. Mod. Phys. 81, 1199 (2009), arXiv:0801.1345 [hep-ph] .
- Cao and Zhang [2016] Q.-H. Cao and D.-M. Zhang, (2016), arXiv:1611.09337 [hep-ph] .
- Amrith et al. [2019] S. Amrith, J. M. Butterworth, F. F. Deppisch, W. Liu, A. Varma, and D. Yallup, JHEP 05, 154, arXiv:1811.11452 [hep-ph] .
- Deppisch et al. [2018] F. F. Deppisch, W. Liu, and M. Mitra, JHEP 08, 181, arXiv:1804.04075 [hep-ph] .
- Basso et al. [2009] L. Basso, A. Belyaev, S. Moretti, and C. H. Shepherd-Themistocleous, Phys. Rev. D 80, 055030 (2009), arXiv:0812.4313 [hep-ph] .
- Kim et al. [2016] J. H. Kim, K. Kong, S. J. Lee, and G. Mohlabeng, Phys. Rev. D 94, 035023 (2016), arXiv:1604.07421 [hep-ph] .
- Greiner et al. [2015] N. Greiner, K. Kong, J.-C. Park, S. C. Park, and J.-C. Winter, JHEP 04, 029, arXiv:1410.6099 [hep-ph] .
- Di Luzio et al. [2018] L. Di Luzio, J. Fuentes-Martin, A. Greljo, M. Nardecchia, and S. Renner, JHEP 11, 081, arXiv:1808.00942 [hep-ph] .
- Aaltonen et al. [2009a] T. Aaltonen et al. (CDF), Phys. Rev. Lett. 102, 031801 (2009a), arXiv:0810.2059 [hep-ex] .
- Abazov et al. [2011] V. M. Abazov et al. (D0), Phys. Lett. B 695, 88 (2011), arXiv:1008.2023 [hep-ex] .
- Feldman et al. [2006a] D. Feldman, Z. Liu, and P. Nath, Phys. Rev. Lett. 97, 021801 (2006a), arXiv:hep-ph/0603039 .
- Chiappetta et al. [1996] P. Chiappetta, J. Layssac, F. M. Renard, and C. Verzegnassi, Phys. Rev. D 54, 789 (1996), arXiv:hep-ph/9601306 .
- Barger et al. [1996] V. D. Barger, K.-m. Cheung, and P. Langacker, Phys. Lett. B 381, 226 (1996), arXiv:hep-ph/9604298 .
- Sirunyan et al. [2020b] A. M. Sirunyan et al. (CMS), Phys. Rev. Lett. 124, 131802 (2020b), arXiv:1912.04776 [hep-ex] .
- Rizzo [1986] T. G. Rizzo, Phys. Rev. D 34, 1438 (1986).
- Delahaye et al. [2019] J. P. Delahaye, M. Diemoz, K. Long, B. Mansoulié, N. Pastrone, L. Rivkin, D. Schulte, A. Skrinsky, and A. Wulzer, (2019), arXiv:1901.06150 [physics.acc-ph] .
- Accettura et al. [2023] C. Accettura et al., (2023), arXiv:2303.08533 [physics.acc-ph] .
- Ruhdorfer et al. [2023] M. Ruhdorfer, E. Salvioni, and A. Wulzer, (2023), arXiv:2303.14202 [hep-ph] .
- Li et al. [2013] H.-L. Li, Z.-G. Si, X.-Y. Yang, Z.-J. Yang, and Y.-J. Zheng, Phys. Rev. D 87, 115024 (2013), arXiv:1305.1457 [hep-ph] .
- Wells [2008] J. D. Wells, , 283 (2008), arXiv:0803.1243 [hep-ph] .
- Andreev et al. [2017] V. Andreev et al. (H1), Eur. Phys. J. C 77, 215 (2017), [Erratum: Eur.Phys.J.C 81, 739 (2021)], arXiv:1611.03421 [hep-ex] .
- Adloff et al. [2001] C. Adloff et al. (H1), Eur. Phys. J. C 19, 289 (2001), arXiv:hep-ex/0010054 .
- Zyla et al. [2020] P. A. Zyla et al. (Particle Data Group), PTEP 2020, 083C01 (2020).
- Nandi [1986] S. Nandi, Phys. Lett. B 181, 375 (1986).
- Baer et al. [1987] H. Baer, D. Dicus, M. Drees, and X. Tata, Phys. Rev. D 36, 1363 (1987).
- Barger and Whisnant [1987] V. D. Barger and K. Whisnant, Phys. Rev. D 36, 3429 (1987).
- Gunion et al. [1988] J. F. Gunion, L. Roszkowski, and H. E. Haber, Phys. Rev. D 38, 105 (1988).
- Feldman et al. [2006b] D. Feldman, Z. Liu, and P. Nath, JHEP 11, 007, arXiv:hep-ph/0606294 .
- Rizzo [2006] T. G. Rizzo, in Theoretical Advanced Study Institute in Elementary Particle Physics: Exploring New Frontiers Using Colliders and Neutrinos (2006) pp. 537–575, arXiv:hep-ph/0610104 .
- Lee [2009] H.-S. Lee, Phys. Lett. B 674, 87 (2009), arXiv:0812.1854 [hep-ph] .
- Barger et al. [2009] V. Barger, P. Langacker, and H.-S. Lee, Phys. Rev. Lett. 103, 251802 (2009), arXiv:0909.2641 [hep-ph] .
- Gulov et al. [2018] A. V. Gulov, A. A. Pankov, A. O. Pevzner, and V. V. Skalozub, Nonlin. Phenom. Complex Syst. 21, 21 (2018), arXiv:1803.07532 [hep-ph] .
- Erler and Langacker [2000] J. Erler and P. Langacker, Phys. Rev. Lett. 84, 212 (2000), arXiv:hep-ph/9910315 .
- Carena et al. [2004] M. Carena, A. Daleo, B. A. Dobrescu, and T. M. P. Tait, Phys. Rev. D 70, 093009 (2004), arXiv:hep-ph/0408098 .
- Erler et al. [2002] J. Erler, P. Langacker, and T.-j. Li, Phys. Rev. D 66, 015002 (2002), arXiv:hep-ph/0205001 .
- Hiçyılmaz et al. [2023] Y. Hiçyılmaz, S. Khalil, and S. Moretti, Phys. Rev. D 107, 035030 (2023), arXiv:2209.09226 [hep-ph] .
- Erler et al. [2009] J. Erler, P. Langacker, S. Munir, and E. Rojas, JHEP 08, 017, arXiv:0906.2435 [hep-ph] .
- Robinett and Rosner [1982b] R. W. Robinett and J. L. Rosner, Phys. Rev. D 26, 2396 (1982b).
- Appelquist et al. [2003] T. Appelquist, B. A. Dobrescu, and A. R. Hopper, Phys. Rev. D 68, 035012 (2003), arXiv:hep-ph/0212073 .
- Sirunyan et al. [2018a] A. M. Sirunyan et al. (CMS), JHEP 06, 120, arXiv:1803.06292 [hep-ex] .
- Aaboud et al. [2018a] M. Aaboud et al. (ATLAS), JHEP 01, 055, arXiv:1709.07242 [hep-ex] .
- Aaboud et al. [2018b] M. Aaboud et al. (ATLAS), Phys. Rev. D 98, 032016 (2018b), arXiv:1805.09299 [hep-ex] .
- Leike [1997] A. Leike, Phys. Lett. B 402, 374 (1997), arXiv:hep-ph/9703263 .
- Aaboud et al. [2019a] M. Aaboud et al. (ATLAS), Phys. Lett. B 788, 316 (2019a), arXiv:1801.08769 [hep-ex] .
- Aaboud et al. [2019b] M. Aaboud et al. (ATLAS), Phys. Lett. B 795, 56 (2019b), arXiv:1901.10917 [hep-ex] .
- Aaboud et al. [2018c] M. Aaboud et al. (ATLAS), Phys. Rev. Lett. 121, 081801 (2018c), arXiv:1804.03496 [hep-ex] .
- Sirunyan et al. [2018b] A. M. Sirunyan et al. (CMS), JHEP 08, 130, arXiv:1806.00843 [hep-ex] .
- Sirunyan et al. [2018c] A. M. Sirunyan et al. (CMS), Eur. Phys. J. C 78, 789 (2018c), [Erratum: Eur.Phys.J.C 82, 379 (2022)], arXiv:1803.08030 [hep-ex] .
- Khachatryan et al. [2016b] V. Khachatryan et al. (CMS), Phys. Rev. Lett. 117, 031802 (2016b), arXiv:1604.08907 [hep-ex] .
- Sirunyan et al. [2020c] A. M. Sirunyan et al. (CMS), Phys. Lett. B 805, 135448 (2020c), arXiv:1911.03761 [hep-ex] .
- Sirunyan et al. [2018d] A. M. Sirunyan et al. (CMS), Phys. Rev. Lett. 120, 201801 (2018d), arXiv:1802.06149 [hep-ex] .
- Sirunyan et al. [2019a] A. M. Sirunyan et al. (CMS), Phys. Rev. D 100, 112007 (2019a), arXiv:1909.04114 [hep-ex] .
- Sirunyan et al. [2019b] A. M. Sirunyan et al. (CMS), Phys. Rev. Lett. 123, 231803 (2019b), arXiv:1905.10331 [hep-ex] .
- Sirunyan et al. [2019c] A. M. Sirunyan et al. (CMS), JHEP 04, 031, arXiv:1810.05905 [hep-ex] .
- Aaltonen et al. [2009b] T. Aaltonen et al. (CDF), Phys. Rev. D 79, 112002 (2009b), arXiv:0812.4036 [hep-ex] .
- Abe et al. [1997] F. Abe et al. (CDF), Phys. Rev. D 55, R5263 (1997), arXiv:hep-ex/9702004 .
- Alitti et al. [1993] J. Alitti et al. (UA2), Nucl. Phys. B 400, 3 (1993).
- Lynch et al. [2001] K. R. Lynch, E. H. Simmons, M. Narain, and S. Mrenna, Phys. Rev. D 63, 035006 (2001), arXiv:hep-ph/0007286 .
- Aaboud et al. [2018d] M. Aaboud et al. (ATLAS), JHEP 06, 166, arXiv:1802.03388 [hep-ex] .
- Diamond [2017] M. Diamond, Search for dark gauge bosons decaying into displaced lepton-jets in proton–proton collisions at = 13 TeV with the ATLAS detector, Ph.D. thesis, Toronto U. (2017).
- Liu et al. [2017] Z.-C. Liu, C.-X. Yue, and Y.-C. Guo, (2017), arXiv:1703.00153 [hep-ph] .
- Curtin et al. [2015] D. Curtin, R. Essig, S. Gori, and J. Shelton, JHEP 02, 157, arXiv:1412.0018 [hep-ph] .
- Aad et al. [2022] G. Aad et al. (ATLAS), JHEP 03, 041, arXiv:2110.13673 [hep-ex] .
- Kumar and Wells [2006] J. Kumar and J. D. Wells, Phys. Rev. D 74, 115017 (2006), arXiv:hep-ph/0606183 .
- CEP [2018] (2018), arXiv:1809.00285 [physics.acc-ph] .
- Gunion [1998] J. F. Gunion, AIP Conf. Proc. 435, 37 (1998), arXiv:hep-ph/9802258 .
- Al Ali et al. [2022] H. Al Ali et al., Rept. Prog. Phys. 85, 084201 (2022), arXiv:2103.14043 [hep-ph] .
- Liu et al. [2023] Z. Liu, K.-F. Lyu, I. Mahbub, and L.-T. Wang, (2023), arXiv:2308.06323 [hep-ph] .
- Belfkir et al. [2023] M. Belfkir, T. A. Chowdhury, and S. Nasri, (2023), arXiv:2307.16111 [hep-ph] .
- Black et al. [2022] K. M. Black et al., (2022), arXiv:2209.01318 [hep-ex] .
- de Blas et al. [2022] J. de Blas et al. (Muon Collider), (2022), arXiv:2203.07261 [hep-ph] .
- Hahn [2001] T. Hahn, Comput. Phys. Commun. 140, 418 (2001), arXiv:hep-ph/0012260 .
- Shtabovenko et al. [2016] V. Shtabovenko, R. Mertig, and F. Orellana, Comput. Phys. Commun. 207, 432 (2016), arXiv:1601.01167 [hep-ph] .
- Shtabovenko et al. [2020] V. Shtabovenko, R. Mertig, and F. Orellana, Comput. Phys. Commun. 256, 107478 (2020), arXiv:2001.04407 [hep-ph] .
- Workman et al. [2022] R. L. Workman et al. (Particle Data Group), PTEP 2022, 083C01 (2022).
Appendix A: Detailed study of process
The vertex of boson in the new physics model can be written as,
| (16) |
If we require to fulfill the SM, then we obtain the following relationships,
| (17) |
So equation (3) can be reduced to,
| (18) |
where and . The vertex of and fermions is
| (19) |
It can be shown in the new expression of
| (20) |
where and for
| (21) |
we list some specific values of and in SM and new physics Model with different respectively in Table 9.
| SM | |||||||
| 0.092 | |||||||
| 0.459 | |||||||
| 0.918 | |||||||
The total amplitude of process can be written as
| (22) |
where and are the amplitude produced by and as a propagator respectively. In Figure 4 (e), we can clearly find that when the C.M.S. energy is close to the mass of , there is a negative term in the total amplitude. The term with negative value is when the C.M.S. energy is close to the mass of and less than the mass of . So we can give
| (23) |
where and ( is the angle between the outgoing and incoming particles). We rewrite
| (24) |
| (25) |
where is the square of the C.M.S. energy, is the decay width of boson, is the charge of quarks, is the angle between the initial and final particles moving direction, and . In fact, both the interference between and boson, and the interference between and photon contribute negatively to the total scattering cross-section. However, the contribution from the interference of boson and boson is small and it does not significantly affect the total scattering cross section.The negative contribution from is larger than that from , as observed in Figure 4 (c), while this phenomenon is not prominent in Figure 4 (d).
Appendix B: The cross section of process
The Feynman rule of weak interaction with the vertices of , and are given,
| (26) |
| (27) |
| (28) |
We assume that is the coupling relative to the corresponding the SM. We can find that , and by Equations (26), (27) and (28). But we will normally assume rather small kinetic mixing and and . We have calculated the scattering cross section expression of this process through FeynArts and FeynClac. The cross section of can be expressed as
| (26) | ||||
where is the mixing angle, is the velocity of the boson, and .