Time-reversal symmetry breaking in the chemosensory array: asymmetric switching and dissipation-enhanced sensing
Abstract
The Escherichia coli chemoreceptors form an extensive array that achieves cooperative and adaptive sensing of extracellular signals. The receptors control the activity of histidine kinase CheA, which drives a non-equilibrium phosphorylation-dephosphorylation reaction cycle for response regulator CheY. Recent single-cell FRET measurements revealed that kinase activity of the array spontaneously switches between active and inactive states, with asymmetric switching times that signify time-reversal symmetry breaking in the underlying dynamics. Here, we show that the asymmetric switching dynamics can be explained by a non-equilibrium lattice model, which considers both the dissipative reaction cycles of individual core units and the coupling between neighboring units. The model reveals that large dissipation and near-critical coupling are required to explain the observed switching dynamics. Microscopically, the switching time asymmetry originates from irreversible transition paths. The model shows that strong dissipation enables sensitive and rapid signaling response by relieving the speed-sensitivity trade-off, which can be tested by future single-cell experiments. Overall, our model provides a general framework for studying biological complexes composed of coupled subunits that are individually driven by dissipative cycles and the rich non-equilibrium physics within.
Cellular sensing is resource intensive: signaling networks must be built to overcome the large fluctuations and small number statistics typically present in chemical signals. To deal with this noise, cells integrate repeated measurements, which are made using a large number of receptors on the cell surface [1, 2]. The mechanisms for averaging and copying signals to intracellular carriers often involve burning fuel molecules, for example, phosphorylation cycles powered by ATP hydrolysis [3, 4, 5, 6, 7]. The relationships between cell resources (receptors, signaling proteins, energy) and sensing fidelity have been studied extensively [7, 6, 8, 5, 9, 10, 11]. In general, increasing the energy input raises the optimal speed and accuracy of cellular sensing. The receptors, however, do not sense independently: in Escherichia coli, for example, CryoEM imaging [12, 13, 14, 15] shows that chemoreceptors and the associated histidine kinase couple together in a hexagonal lattice and the downstream signal shows considerable cooperativity [16, 17, 18, 19]. Little is known about how the signaling response is impacted by the interplay between dissipative chemical cycles, driven out-of-equilibrium by ATP hydrolysis, and the collective behavior of the receptor lattice.
We address this question in the context of the E. coli chemotaxis signaling pathway, where recent single-cell studies provided a new view into the non-equilibrium dynamics of chemoreceptor lattices [19, 20]. In the absence of extracellular ligands and adaptation machinery, cells spontaneously switch between active and inactive states, which normally correspond respectively to no-ligand and large ligand concentration responses [16, 17, 19, 18]. This behavior is reminiscent of switching between metastable magnetized states in a finite-size Ising lattice except for one feature: the time to execute a switch from the active to inactive states is longer than the reverse process. Asymmetric switching breaks time-reversal symmetry, indicating that the collective dynamics of the chemoreceptor lattice are driven by a dissipative process. However, a quantitative description of the non-equilibrium dynamics at the receptor cluster level remains missing.
Here, we develop a minimal model to investigate non-equilibrium dynamics and the signaling response properties of the chemoreceptor lattice. The model is an extension of a non-equilibrium all-or-none allosteric model, which we recently proposed to capture both the ligand binding and kinase activity of the receptor cluster [10]. Combining numerical simulations and mean-field theory, we show that dissipative driving is required for the asymmetric switching observed in experiments. Furthermore, the magnitude of the measured dwell times between switching events indicates near-critical lattice coupling. Microscopically, asymmetric switching arises because the lattice follows different paths through state-space depending on the direction of the switch: inactive to active or vice versa, a tell-tale consequence of time-reversal symmetry breaking in the underlying system. Our study shows that operating out of equilibrium enhances both the amplitude and the speed of the sensing response, thus allowing the chemosensory array to respond swiftly and sharply to changes in the ligand concentration.
I Non-equilibrium lattice model of the chemoreceptor cluster
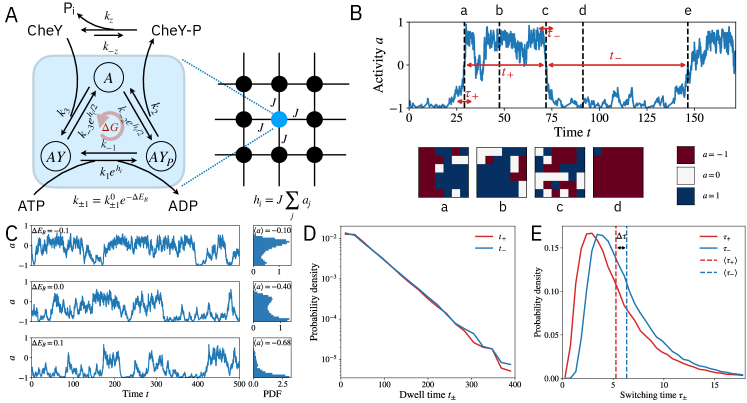
Our non-equilibrium lattice model is inspired by the chemoreceptor arrays found in E. coli, whose core functional unit comprises two trimers of chemoreceptor dimers, one histidine kinase CheA dimer, and two coupling proteins CheW [21]. Binding of external signals (ligands) to the chemoreceptors controls the kinase activity of CheA, i.e., its ability to phosphorylate the response regulator CheY. The phosphorylation-dephosphorylation (PdP) cycle is completed by CheZ catalyzing the dephosphorylation of CheY-P. The core units form an extended hexagonal lattice on the plasma membrane [12, 13, 14, 15]. The kinase activity of the core unit depends on both the occupancy of ligands and the methylation level of the receptors. Recent experimental evidence [17, 22, 23] favors a non-equilibrium allosteric model [10], which explicitly includes the PdP cycle driven by ATP hydrolysis. Non-equilibrium driving is necessary to explain the disproportionate shifts in ligand binding and kinase response due to receptor methylation [17, 22, 23, 10]. Here, we generalize this model to an extended lattice by incorporating the PdP cycle of individual kinase with the cooperative interactions between neighboring core units.
We use a minimal three-state model to describe the kinase activity of core unit-: , , and represent the unbound kinase , the kinase bound to unphosphorylated CheY (), and the kinase bound to CheY-P (), respectively†††In reality there are more sub-steps in the phosphorylation cycle, including CheA autophosphorylation and phosphotransfer to CheY. Here, we opt for the simplest non-equilibrium model with a coarse-grained three-state cycle.. As illustrated in Fig. 1A, for each of the core units in the lattice, the kinase activity dynamics can be described by the following reaction cycle,
| (1) |
where A and Y, and Y represent CheA, CheY and CheY-P respectively, and labels the core units. Neighboring core units interact with coupling strength (Fig. 1A). We use a square lattice for simplicity but the switching behavior is robust to lattice structure (see SI, section II). The effective field due to nearest neighbor kinase scales the forward phosphorylation rate for kinase : . To maintain thermodynamic consistency in the PdP cycle, and are also scaled by . We set to fix the unit of time. CheY-P is dephosphorylated in solution at rate with the reverse rate .
Each core unit operates out of equilibrium. Completing the PdP cycle consumes one ATP molecule with free energy dissipation
| (2) |
with and being the contributions from the kinase cycle of the core unit and the dephosphorylation by CheZ, respectively. For studying the dependence of lattice dynamics on dissipation, we assume the reverse transition rates scale identically: .
Recent work on the non-equilibrium allosteric model [10] suggests that ligand binding and receptor methylation affect kinase activity in different ways: binding to the receptors acts as an ON/OFF switch for the kinase, while methylation shifts the energy barrier for the phosphorylation reaction in the ON state. Together these effects can be captured by an effective barrier shift that scales the forward and reverse phosphorylation rates: , where are the rates corresponding to equal occupancy of the active and inactive states. If the relation between receptor conformation and occupancy is described by the Monod-Wyman-Changeux (MWC) model [24, 10], the effective barrier shift is
| (3) |
The first term corresponds to the direct barrier shift due to methylation , with slope and intercept . The second term describes the effective barrier shift due to the fraction of bound receptors: is the ligand concentration and () is the dissociation constant for the inactive (active) receptor. Both contributions are proportional to , the effective receptor cluster size felt by the kinase within a core unit. In analogy to the Ising model, plays the role of an external field that modulates the activity of the entire lattice.
The dynamics of the lattice are simulated using the Gillespie algorithm [25]. We focus on the kinase states and do not simulate the dephosphorylation step explicitly; instead, the intracellular concentrations of CheY, CheY-P, ATP, and ADP are held constant and absorbed into pseudo-first-order reaction rates. With a sufficiently strong coupling (), the system undergoes two-state switching similar to the measured activity switching in E. coli [20]. As shown in Fig. 1B, the two-state switching behavior can be readily detected in the time trace of the order parameter (lattice activity) , along with snapshots of the lattice at various times. Following the experimental literature [20], we define dwell times to be the time spent in the active and inactive states respectively, and the switching times as the duration of transition between these two states (Fig. 1B). The average activity can be controlled by modulating the effective barrier (via ligand concentration and/or receptor methylation): lowering the energy barrier enhances activity (Fig. 1C). Consistent with experiments, the dwell times are exponentially distributed (Fig. 1D), while the switching time distributions are peaked, right skewed, and asymmetric (Fig. 1E).
II Chemoreceptor array operates near a highly non-equilibrium critical point
The non-equilibrium lattice model lets us identify the key ingredients that lead to the asymmetric two-state switching observed in E. coli chemoreceptor arrays [20]. In mutants containing only serine-binding receptors (Tsr) or aspartate receptors (Tar), and for cells without activity bias (i.e. equal dwell times in the active and inactive states), the measurements found a switching-to-dwell-time ratio of and a switching time asymmetry of [20]. As illustrated below, the large asymmetry implies that the system operates far from equilibrium, while the switching-to-dwell-time ratio evidences proximity to criticality.
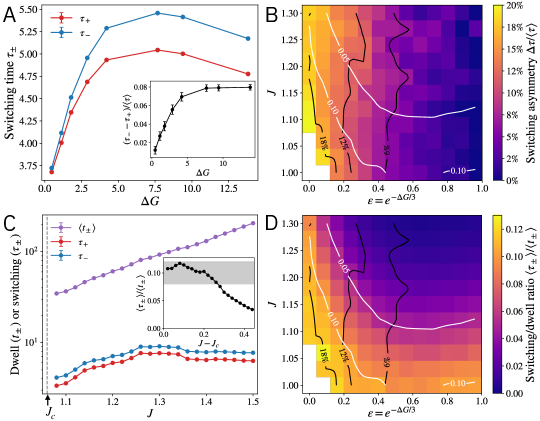
The observed switching time asymmetry requires strong dissipation. The switching time distribution is determined by the ensemble of transition paths: trajectories that go from one state (e.g. inactive) to the other (active) without returning to the source [26]. For equilibrium systems, time-reversal symmetry establishes a one-to-one correspondence between forward and backward trajectories. Thus, the transition path ensembles are equivalent, resulting in identical switching time distributions. This symmetry has been shown explicitly in specific cases [27]. Therefore, the disparity between forward and backward switching time distributions in the E. coli measurements [20] and in our model (Fig. 1) is a clear signature of the underlying dissipative driving breaking time-reversal symmetry. Here, the driving is provided by ATP hydrolysis through : indeed, reducing dissipation reduces the switching time asymmetry (Fig. 2A).
Varying both dissipation and coupling strength (Fig. 2B) reveals that the switching time asymmetry depends only weakly on coupling strength , while strong dissipation () is always required. In the large dissipation limit, the model explains a asymmetry. The remaining asymmetry observed in the experiments may be accounted for by considering the dephosphorylation reaction, neglected in our simulations. For example, the difference between the timescales for dephosphorylation and phosphorylation with a fully active receptor cluster is approximately s [28], accounting for about additional asymmetry [20]. Furthermore, the asymmetry may be underestimated because the coarse-grained three-state reaction cycle used here neglects intermediate chemical reactions. Coarse-graining is known to lower the dissipation rate in chemical networks [29, 30] and hence may also decrease switching asymmetry.
The observed switching-to-dwell-time ratio indicates proximity to criticality. Two-state switching only emerges when the coupling is above a critical strength (). This critical coupling depends both on the dissipation level and the competition of timescales determined by kinetic rates. As we show in the mean-field limit (see SI, section I), the critical coupling in general varies non-monotonically with the dissipation.
In equilibrium barrier crossing problems, the dwell time grows exponentially with the energy barrier [31] while the transition time grows much slower [32, 33]. Here we find similar relations: as the coupling strength increases away from the critical point, the dwell times grow exponentially while the switching times saturate for large (Fig. 2C). The switching-to-dwell-time ratio shrinks exponentially away from the critical point (inset). Therefore, the measured ratio between switching and dwell times provides an indirect measure of how strongly the chemoreceptors are coupled.
Varying both dissipation and coupling reveals that the switching-to-dwell-time ratio depends primarily on the distance of the coupling strength from its critical value and decays exponentially as grows (Fig. 2D). To observe spontaneous switching on an experimental timescale, the cells must therefore operate in reasonable proximity to the critical point: otherwise, dwell times become exponentially long compared to the switching time and can not explain the observed switching-to-dwell-time ratios, .
III Microscopic origin of asymmetric switching
Our model provides insight into the microscopic origin of the switching time asymmetry: depending on the direction of switching, transitions take distinct paths through the lattice space. This can be illustrated by projecting the average transition paths onto a plane spanned by the fraction of core units in the AYP () and AY () states, respectively. In the irreversible limit (Fig. 3, lower triangle), trajectories toward the inactive state (red) tend to take paths through the lower left region of state space (where the number of core-units, is large), whereas trajectories toward the active state (white) run closer to the diagonal. This behavior is intuitive because, in the underlying three-state cycle (Fig. 1A), the core unit moves through the 0-state on the way to the inactive state, while the transition from to is direct. The difference in switching trajectories is discernible from snapshots of the lattice simulations (Fig. 1B): when switching to inactive a considerable fraction of the kinase occupies the -state compared to the forward switches to the active state.
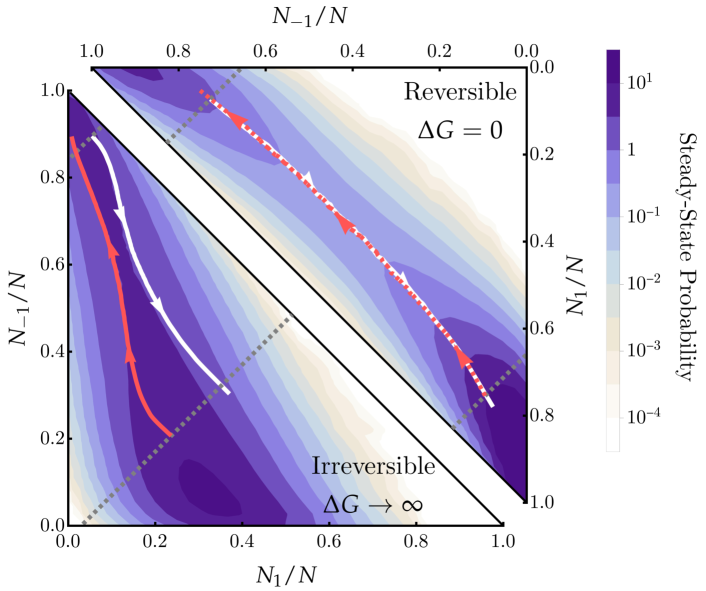
Keegstra et al. found switching-time distributions were well described by gamma distributions, [20], which is the distribution of times to execute an -step process with rate for each step. Thus, can be used as a proxy for the number of independent timescales underlying the switching process. The larger fit for switching to the inactive state versus switching to the active state (2.45 versus 1.72 for Tsr and 2.74 versus 1.87 for Tar [20]) reflects the presence of more mixed time-scales in the backward switch, consistent with our model.
In the absence of dissipative driving, the state-space trajectories during switching are identical (Fig. 3, upper triangle), a consequence of time-reversal symmetry. In this case, the microscopic cycles are symmetric (Fig. 1A): the core units are equally likely to transition clockwise or counter-clockwise regardless of the direction of switching.
IV Dissipation enhances the sensing response properties of the chemosensory array
The spontaneous asymmetric switching considered above was observed in cells without extracellular ligands and adaptation machinery [20]. How does the non-equilibrium mechanism underlying the asymmetry affect the sensing properties of the receptor cluster? Recent studies [10, 17, 22, 23] provide strong evidence that the receptor complex acts as an enzyme exerting kinetic control: both ligand concentration and receptor methylation affect the kinase activity by modulating the effective phosphorylation energy barrier (Eq. 3). Thus, the signal input is a shift in the effective barrier induced by changes in the extracellular ligand concentration . The output is the intracellular CheY-P concentration, which is proportional to the fraction of active kinase. Here we focus on the response on a much shorter timescale than adaptation feedback.
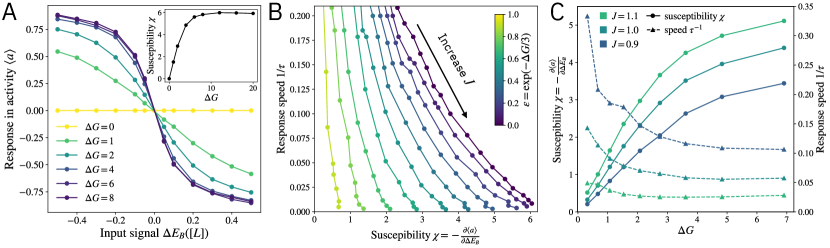
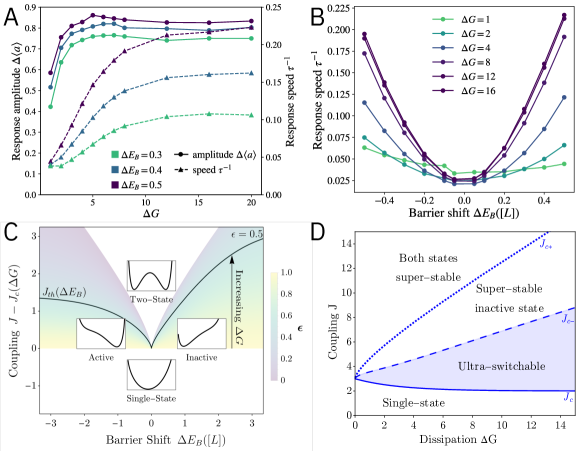
In our model, controls the overall lattice activity ‡‡‡The response functions for other order parameters, e.g. or have nearly identical behaviors to all results in this section (see SI, section II). with a sigmoidal response curve (Fig. 4A) reminiscent of E. coli’s activity response to varying ligand concentration [16, 17, 19]. Consistent with previous work [10], the response amplitude increases with dissipation and vanishes in the equilibrium limit, where the steady state is unaffected by the kinetic barrier shift. The zero-field susceptibility also increases monotonically with dissipation (Fig. 4A, inset). The sharp response in the large dissipation limit is reminiscent of a non-equilibrium ultrasensitivity mechanism proposed for the E. coli flagellar motor switch [34]. In the following sections, we demonstrate that dissipation enhances response both in the linear (small ) and nonlinear (large ) regimes.
Linear regime: dissipation improves the speed-sensitivity trade-off. Small signals () induce changes in activity proportional to , with susceptibility defined above. The sensitivity to changes in ligand concentration can be quantified by an effective Hill coefficient , with being the normalized activity. Using Eq. (3), the maximum sensitivity is (Methods),
| (4) |
where is the total response range. The response speed is defined as , with the relaxation time obtained by fitting the activity to an exponential relaxation process.
Tuning the coupling leads to a trade-off between speed and sensitivity (Fig. 4B). At strong coupling, a large response amplitude arises from flipping the entire system altogether (e.g. from all-active to all-inactive). However, this comes at the cost of slow speed since the dwell time in each state increases exponentially with coupling (Fig. 2B). Increasing dissipation improves the trade-off, pushing the curves to the upper right and allowing for higher sensitivity at a fixed response speed (and vice versa). Moreover, dissipation also decreases the slope of the trade-off curves so that increasing sensitivity has a smaller cost in speed.
Varying dissipation at fixed coupling leads to another speed-sensitivity trade-off (Fig. 4C): increasing dissipation amplifies the response amplitude (solid lines) at the cost of slower response speed (dashed lines). Therefore, improving the trade-off in Fig. 4B requires simultaneously varying and : for example, enhancing sensitivity at a fixed response speed requires increasing dissipation while reducing coupling to compensate for the loss in speed. Beyond dissipation and coupling, tuning the relative timescales in the phosphorylation cycle (e.g. by modulating ) can also improve the speed-sensitivity trade-off (see SI, section II).
Nonlinear regime: dissipation enables sensitive and rapid response. In the nonlinear regime, with sufficiently large , the barrier in the effective energy landscape disappears. This leads to an even more favorable situation in which dissipation not only increases the response amplitude but also speed (Fig. 5A). Indeed, sweeping across a wide range of dissipation and barrier shifts (Fig. 5B) reveals that dissipation enables a significant speed-up in response in the nonlinear regime.
The speed enhancement in the nonlinear regime can be understood analytically by using the mean-field theory. As shown in the (, )-plane (Fig. 5C), for a given , the system exhibits two stable states when the coupling strength is larger than some threshold : (black line). The threshold coupling is determined by the onset of a saddle-node bifurcation that eliminates the energy barrier between the two states (see SI, section I). For , a large signal can cause the system to cross the phase boundary and transition to a fully active or inactive state rapidly since the energy barrier is eliminated. As increases (from yellow to blue), increases, thereby reducing the signal () required to cross the phase boundary and trigger a rapid response.
It is, however, not always possible to cross the phase boundary. The phase boundaries for finite have finite asymptotes (see SI, section I). Above , the kinase active or inactive states become super stable: they cannot be destabilized by any external ligand signal. In this case, the response, even to very strong signals, is slow because it is limited by the dwell times of the two stable states.
The two limiting thresholds and along with , divide the parameter space into four regions (Fig. 5D). The “ultra-switchable” region (shaded) is the most desirable since it offers rapid cooperative response to both activating or inhibiting signals. Conversely, systems in the region respond slowly to activating signals, while beyond , the response is slow in both directions. Increasing dissipation opens up the ultra-switchable region, enabling rapid response that is robust to perturbations in the coupling strength.
V Discussion: non-equilibrium lattices for modeling biological function
Our results show that non-equilibrium lattice dynamics explain the observed asymmetric spontaneous activity switching in E. coli [20, 19]. This underlying dissipation improves the speed-sensitivity trade-off in chemotaxis signaling. Our work therefore supports an emerging general principle: operating out of equilibrium as a mechanism for relieving trade-offs between important biological functions. On its own, energy dissipation is responsible for enabling ultrasensitivity in many biological systems [34]. Optimizing sensitivity, however, often comes with a trade-off for other functional goals such as noise suppression [35, 36] and collective motion [37]. By breaking the fluctuation-dissipation theorem [38, 35], dissipation has been shown to ease these trade-offs, thereby enabling high sensitivity and low noise in biochemical oscillators [36], as well as high sensitivity and speed in flocking [37].
A possible scheme to test our model is to measure the kinase response curves using FRET with different dosages of chemoattractants and repellents. For cells exhibiting unbiased two-state switching in the absence of ligands [20], we predict a faster response if a larger concentration of attractants or repellents is introduced (Fig. 5B). This would be a counterintuitive observation analogous to the Mpemba effect [39]. Another possible test is to correlate the sensitivity with the ratio between switching and dwell times, which is a proxy for the coupling strength ; our model predicts a negative correlation as shown in Fig. 4B. Further, it may be interesting to search for superstable states by comparing the response to attractants and repellents. These quantitative measurements would provide key insights into how dissipation affects chemotaxis response.
The non-equilibrium lattice model provides a framework for studying the dynamics and response properties of biological complexes composed of interacting subunits that individually operate out-of-equilibrium driven by a dissipative cycle. The model can be extended to include more realistic lattice structures and details of kinetic cycles. In E. coli, the chemoreceptor complex forms a hexagonal array with highly structured interactions between different components [21]. A study including these structural details would reveal the precise form of the inter-core-unit coupling . The phosphorylation catalyzed by CheA involves a more intricate set of reactions than the three-state cycle considered here [40, 41]. Including these details will help draw connections between the structure and function of the receptor-kinase complex. More generally the connectivity structure and kinetic network can be adapted for modeling a variety of biophysical systems. Potential applications include a broader range of signal transduction networks involving receptor clustering, such as EGF-receptors [42] or G-protein coupled receptors [43], critical cell membrane dynamics [44], actomyosin cortex [45], and large protein complexes such as the cytoplasmic ring in bacterial flagellar motor [46], the cooperative KaiC hexamer [47] in circadian clock of Cyanobacteria and other ATPase [48].
By introducing a minimal model for an extended lattice with coupled dissipative units, this work provides a platform for addressing crucial theoretical questions. For example, how does the subunit dissipative cycle affect the emergent dynamics and signaling capabilities of the entire lattice? Would it be possible to employ a non-equilibrium renormalization group approach [49, 50] to characterize the critical points and identify universality classes? The answer to these questions may generate important insights into non-equilibrium phase transitions driven by microscopic dissipative cycles.
VI Acknowledgements
This work is supported in part by National Institutes of Health grant R35GM131734 (to Y. T.). Q. Y. acknowledges the IBM Exploratory Science Councils for a summer internship during which part of the work was done.
References
- Berg and Purcell [1977] H. C. Berg and E. M. Purcell, Physics of chemoreception, Biophysical journal 20, 193 (1977).
- Bialek and Setayeshgar [2005] W. Bialek and S. Setayeshgar, Physical limits to biochemical signaling, Proceedings of the National Academy of Sciences 102, 10040 (2005).
- Cao et al. [2015] Y. Cao, H. Wang, Q. Ouyang, and Y. Tu, The free-energy cost of accurate biochemical oscillations, Nature Phys 11, 772 (2015).
- Goldbeter and Koshland [1981] A. Goldbeter and D. E. Koshland, An amplified sensitivity arising from covalent modification in biological systems., Proceedings of the National Academy of Sciences 78, 6840 (1981).
- Govern and ten Wolde [2014] C. C. Govern and P. R. ten Wolde, Optimal resource allocation in cellular sensing systems, Proceedings of the National Academy of Sciences 111, 17486 (2014).
- Mehta et al. [2016] P. Mehta, A. H. Lang, and D. J. Schwab, Landauer in the age of synthetic biology: Energy consumption and information processing in biochemical networks, Journal of Statistical Physics 162, 1153 (2016).
- Ouldridge et al. [2017] T. E. Ouldridge, C. C. Govern, and P. R. ten Wolde, Thermodynamics of computational copying in biochemical systems, Phys. Rev. X 7, 021004 (2017).
- ten Wolde et al. [2016] P. R. ten Wolde, N. B. Becker, T. E. Ouldridge, and A. Mugler, Fundamental limits to cellular sensing, Journal of Statistical Physics 162, 1395 (2016).
- Lan et al. [2012] G. Lan, P. Sartori, S. Neumann, V. Sourjik, and Y. Tu, The energy–speed–accuracy trade-off in sensory adaptation, Nature Phys 8, 422 (2012).
- Hathcock et al. [2023] D. Hathcock, Q. Yu, B. A. Mello, D. N. Amin, G. L. Hazelbauer, and Y. Tu, A nonequilibrium allosteric model for receptor-kinase complexes: The role of energy dissipation in chemotaxis signaling, Proc. Natl. Acad. Sci. U.S.A. 120, e2303115120 (2023).
- Tjalma et al. [2023] A. J. Tjalma, V. Galstyan, J. Goedhart, L. Slim, N. B. Becker, and P. R. Ten Wolde, Trade-offs between cost and information in cellular prediction, Proc. Natl. Acad. Sci. U.S.A. 120, e2303078120 (2023).
- Briegel et al. [2009] A. Briegel, D. Ortega, E. Tocheva, K. Wuichet, Z. Li, S. Chen, A. Müller, C. Iancu, G. Murphy, M. Dobro, et al., Universal architecture of bacterial chemoreceptor arrays, Proc. Natl. Acad. Sci. USA 106, 17181 (2009).
- Liu et al. [2012] J. Liu, B. Hu, D. R. Morado, S. Jani, M. D. Manson, and W. Margolin, Molecular architecture of chemoreceptor arrays revealed by cryoelectron tomography of Escherichia coli minicells, Proc. Natl. Acad. Sci. U.S.A. 109 (2012).
- Briegel et al. [2012] A. Briegel, X. Li, A. M. Bilwes, K. T. Hughes, G. J. Jensen, and B. R. Crane, Bacterial chemoreceptor arrays are hexagonally packed trimers of receptor dimers networked by rings of kinase and coupling proteins, Proc. Natl. Acad. Sci. USA 10.1073/pnas.1115719109 (2012).
- Cassidy et al. [2020] C. K. Cassidy, B. A. Himes, D. Sun, J. Ma, G. Zhao, J. S. Parkinson, P. J. Stansfeld, Z. Luthey-Schulten, and P. Zhang, Structure and dynamics of the e. coli chemotaxis core signaling complex by cryo-electron tomography and molecular simulations, Communications Biology 3, 24 (2020).
- Shimizu et al. [2010] T. Shimizu, Y. Tu, and H. Berg, A modular gradient-sensing network for chemotaxis in escherichia coli revealed by responses to time-varying stimuli, Molecular systems biology 6 (2010).
- Amin and Hazelbauer [2010] D. N. Amin and G. L. Hazelbauer, Chemoreceptors in signalling complexes: shifted conformation and asymmetric coupling, Molecular Microbiology 78, 1313 (2010).
- Tu [2013] Y. Tu, Quantitative modeling of bacterial chemotaxis: signal amplification and accurate adaptation, Annual review of biophysics 42, 337 (2013).
- Keegstra et al. [2017] J. M. Keegstra, K. Kamino, F. Anquez, M. D. Lazova, T. Emonet, and T. S. Shimizu, Phenotypic diversity and temporal variability in a bacterial signaling network revealed by single-cell FRET, eLife 6, e27455 (2017).
- Keegstra et al. [2022] J. M. Keegstra, F. Avgidis, Y. Mullah, J. S. Parkinson, and T. S. Shimizu, Near-critical tuning of cooperativity revealed by spontaneous switching in a protein signalling array, bioRxiv 10.1101/2022.12.04.518992 (2022).
- Parkinson et al. [2015] J. S. Parkinson, G. L. Hazelbauer, and J. J. Falke, Signaling and sensory adaptation in Escherichia coli chemoreceptors: 2015 update, Trends in Microbiology 23, 257 (2015).
- Levit and Stock [2002] M. N. Levit and J. B. Stock, Receptor methylation controls the magnitude of stimulus-response coupling in bacterial chemotaxis, J. Biol. Chem. 277, 36760 (2002).
- Vaknin and Berg [2007] A. Vaknin and H. C. Berg, Physical responses of bacterial chemoreceptors., J. Mol. Biol. 366, 1416 (2007).
- Monod et al. [1965] J. Monod, J. Wyman, and J. Changeux, On the nature of allosteric transitions: a plausible model., Journal of molecular biology 12, 88 (1965).
- Gillespie [1977] D. T. Gillespie, Exact stochastic simulation of coupled chemical reactions, J. Phys. Chem. 81, 2340 (1977).
- E and Vanden-Eijnden [2010] W. E and E. Vanden-Eijnden, Transition-Path Theory and Path-Finding Algorithms for the Study of Rare Events, Annual Review of Physical Chemistry 61, 391 (2010).
- Berezhkovskii and Makarov [2019] A. M. Berezhkovskii and D. E. Makarov, On the forward/backward symmetry of transition path time distributions in nonequilibrium systems, J. Chem. Phys. 151, 065102 (2019).
- Sourjik and Berg [2002] V. Sourjik and H. C. Berg, Receptor sensitivity in bacterial chemotaxis, Proc. Natl. Acad. Sci. USA 99, 123 (2002).
- Yu et al. [2021] Q. Yu, D. Zhang, and Y. Tu, Inverse power law scaling of energy dissipation rate in nonequilibrium reaction networks, Phys. Rev. Lett. 126, 080601 (2021).
- Yu and Tu [2022a] Q. Yu and Y. Tu, State-space renormalization group theory of nonequilibrium reaction networks: Exact solutions for hypercubic lattices in arbitrary dimensions, Phys. Rev. E 105, 044140 (2022a).
- Hänggi et al. [1990] P. Hänggi, P. Talkner, and M. Borkovec, Reaction-rate theory: fifty years after Kramers, Rev. Mod. Phys. 62, 251 (1990).
- Hummer [2004] G. Hummer, From transition paths to transition states and rate coefficients, The Journal of Chemical Physics 120, 516 (2004).
- Chung et al. [2009] H. S. Chung, J. M. Louis, and W. A. Eaton, Experimental determination of upper bound for transition path times in protein folding from single-molecule photon-by-photon trajectories, Proc. Natl. Acad. Sci. U.S.A. 106, 11837 (2009).
- Tu [2008] Y. Tu, The nonequilibrium mechanism for ultrasensitivity in a biological switch: Sensing by maxwell’s demons, Proceedings of the National Academy of Sciences 105, 11737 (2008).
- Sartori and Tu [2015] P. Sartori and Y. Tu, Free Energy Cost of Reducing Noise while Maintaining a High Sensitivity, Phys. Rev. Lett. 115, 118102 (2015).
- Fei et al. [2018] C. Fei, Y. Cao, Q. Ouyang, and Y. Tu, Design principles for enhancing phase sensitivity and suppressing phase fluctuations simultaneously in biochemical oscillatory systems, Nat Commun 9, 1434 (2018).
- Yu and Tu [2022b] Q. Yu and Y. Tu, Energy Cost for Flocking of Active Spins: The Cusped Dissipation Maximum at the Flocking Transition, Phys. Rev. Lett. 129, 278001 (2022b).
- Martin et al. [2001] P. Martin, A. J. Hudspeth, and F. Jülicher, Comparison of a hair bundle’s spontaneous oscillations with its response to mechanical stimulation reveals the underlying active process, Proc. Natl. Acad. Sci. U.S.A. 98, 14380 (2001).
- Lasanta et al. [2017] A. Lasanta, F. Vega Reyes, A. Prados, and A. Santos, When the Hotter Cools More Quickly: Mpemba Effect in Granular Fluids, Phys. Rev. Lett. 119, 148001 (2017).
- Mello et al. [2018] B. A. Mello, W. Pan, G. L. Hazelbauer, and Y. Tu, A dual regulation mechanism of histidine kinase CheA identified by combining network-dynamics modeling and system-level input-output data, PLoS Comput Biol 14, e1006305 (2018).
- Muok et al. [2020] A. R. Muok, A. Briegel, and B. R. Crane, Regulation of the chemotaxis histidine kinase CheA: A structural perspective, Biochimica et Biophysica Acta (BBA) - Biomembranes 1862, 183030 (2020).
- Schreiber et al. [1983] A. B. Schreiber, T. A. Libermann, I. Lax, Y. Yarden, and J. Schlessinger, Biological role of epidermal growth factor-receptor clustering. Investigation with monoclonal anti-receptor antibodies., Journal of Biological Chemistry 258, 846 (1983).
- Sánchez and Tampé [2023] M. F. Sánchez and R. Tampé, Ligand-independent receptor clustering modulates transmembrane signaling: a new paradigm, Trends in Biochemical Sciences 48, 156 (2023).
- Honerkamp-Smith et al. [2012] A. R. Honerkamp-Smith, B. B. Machta, and S. L. Keller, Experimental Observations of Dynamic Critical Phenomena in a Lipid Membrane, Phys. Rev. Lett. 108, 265702 (2012).
- Tan et al. [2021] T. H. Tan, G. A. Watson, Y.-C. Chao, J. Li, T. R. Gingrich, J. M. Horowitz, and N. Fakhri, Scale-dependent irreversibility in living matter (2021), arXiv:2107.05701 [cond-mat, physics:physics].
- Berg [2003] H. C. Berg, The rotatory motor of bacterial flagella, Annu. Rev. Biochem. 72, 19 (2003).
- Han et al. [2023] X. Han, D. Zhang, L. Hong, D. Yu, Z. Wu, T. Yang, M. Rust, Y. Tu, and Q. Ouyang, Determining subunit-subunit interaction from statistics of cryo-em images: observation of nearest-neighbor coupling in a circadian clock protein complex, Nature Communications 14, 5907 (2023).
- Fang et al. [2022] R. Fang, J. Hon, M. Zhou, and Y. Lu, An empirical energy landscape reveals mechanism of proteasome in polypeptide translocation, eLife 11, e71911 (2022).
- Hohenberg and Halperin [1977] P. C. Hohenberg and B. I. Halperin, Theory of dynamic critical phenomena, Rev. Mod. Phys. 49, 435 (1977).
- Tu [2023] Y. Tu, The renormalization group for non-equilibrium systems, Nat. Phys. 19, 1536 (2023).