Unsupversied feature correlation model to predict breast abnormal variation maps in longitudinal mammograms
Abstract
Breast cancer continues to be a significant cause of mortality among women globally. Timely identification and precise diagnosis of breast abnormalities are critical for enhancing patient prognosis. In this study, we focus on improving the early detection and accurate diagnosis of breast abnormalities, which is crucial for improving patient outcomes and reducing the mortality rate of breast cancer. To address the limitations of traditional screening methods, a novel unsupervised feature correlation network was developed to predict maps indicating breast abnormal variations using longitudinal 2D mammograms.
The proposed model utilizes the reconstruction process of current year and prior year mammograms to extract tissue from different areas and analyze the differences between them to identify abnormal variations that may indicate the presence of cancer. The model is equipped with a feature correlation module, an attention suppression gate, and a breast abnormality detection module that work together to improve the accuracy of the prediction. The proposed model not only provides breast abnormal variation maps, but also distinguishes between normal and cancer mammograms, making it more advanced compared to the state-of-the-art baseline models. The results of the study show that the proposed model outperforms the baseline models in terms of Accuracy, Sensitivity, Specificity, Dice score, and cancer detection rate.
keywords:
longitudinal Mammogram , Deep learning , unsupervised learning , cancer localization1 Introduction
Breast cancer is one of the top health concerns for women in the world [43]. The high chance of developing breast cancer has also led to considerable anxiety among the general public. Research has demonstrated that early detection is crucial for reducing the burden of breast cancer. Healthcare professionals have emphasized the importance of early detection to improve the survival rate [11]. In particular, mammography is widely recognized as the gold standard for breast cancer screening for asymptomatic women to identify breast cancer before any symptom appears [46, 13]. American Cancer Society (ACS) recommending annual mammography screening for women ages 40 and older since 2004 [44]. Although annual screening of mammograms increases breast cancer survival rate, the large volume of screening mammograms and the use of double readings put a strain on the healthcare system and can compromise its efficiency. Furthermore, the complexity of mammograms can pose challenges for radiologists, potentially resulting in false and missed diagnoses [19, 32]. Besides, small tumors surrounded by dense fibroglandular breast tissue may go undetected, which can delay diagnosis and prevent early detection [19]. Moreover, false positive results are possible, which can lead to unnecessary procedures such as benign biopsies, additional expenses, and psychological distress for patients. [36, 34].
In clinical practice, the traditional computer-aided detection (CAD) system — relies on image processing and pattern recognition techniques — provides a second opinion on breast cancer detection and image interpretation to radiologists. The CAD system involves handcrafted features —using conventional image processing methods— from mammograms and then classifies them using statistical methods. In contrast, deep learning, a subset of machine learning, has been increasingly used over the past decade to develop CAD systems that can automatically extract features from raw inputs using multiple layers of neural networks. In recent years, many studies have utilized deep learning, especially convolutional neural networks (CNNs), for mammogram classification[47, 16, 30, 40, 41, 28, 25, 24, 1, 18, 49]. In many deep learning mammogram studies, Full-Field Digital Mammography (FFDM) has been utilized to learn the data distribution, although some studies have used reduced-size images [47, 16, 30, 40, 49], patches, or regions of interest (ROI) to minimize computational complexity [41, 28, 25, 24, 1, 18]. Although, deep learning based models have shown a remarkable ability to carry out a wide range of medical imaging tasks including breast cancer screening [47, 16, 30, 40, 41, 28, 25, 24, 1, 18, 49] and have made automated breast cancer mammography screening feasible, developing such a model still remains challenging [7], especially for localizing abnormalities in mammograms due to the unique characteristics of mammogram images.
Breast abnormalities are small and share features with the background tissue, making it difficult to accurately detect tumors with ambiguous boundaries or different shapes. Radiologists commonly use previous mammogram scans as a reference point to make an inference when examining current mammogram scans in order to spot suspicious tissue. Not only in clinical practice but also in studies it has been shown that comparing current mammogram scans with prior ones improves the outcomes of mammography classification. In the study by Kooi and Karssemeijer twin CNNs are used to classify mammogram ROIs by comparing primary mammograms with their corresponding history mammograms or opposite breast mammograms. However, the model requires some level of radiologist knowledge to identify the mass ROIs and to map them from current mammograms to their prior ones [26]. In another study by Perek et al., CNN models were used to extract features from current and previous year images, and long short-term memory (LSTM) layers were employed to learn the differences and classify mammograms. However, this method requires image registration during data pre-processing, and training LSTM with a small dataset to learn tissue changes can cause overfitting [38]. In our previous work, we developed a feature fusion siamese network to predict cancer incorporate with patients’ prior and current image[6]. While some studies have suggested using prior mammograms to classify breast cancer, no studies have been proposed to utilize prior knowledge to locate breast cancer.
In addition to the challenge of extracting effective features from complex breast tissue, the analysis of mammograms is constrained by a small sample size, particularly with accurately annotated, datasets [51, 7]. Mammogram data labeling presents a number of formidable challenges, chief among which is the requirement for specialized domain knowledge to ensure accurate and reliable labeling. Compounding this challenge is the considerable variability in mammogram quality, resolution, and orientation, rendering the accurate pixel-level identification and labeling of regions of interest a complex and arduous task. This directly leads to heavy human labor for data annotation and non-generalized annotation. One solution to the challenge of the non-annotated data and the difficulty of extracting useful features from complex breast tissue is to use an unsupervised learning approach. The breast cancer screening technique, which involves comparing current mammogram images with prior ones, naturally lends itself to building an unsupervised learning model that can learn the differences between images through the image reconstruction process. In this study, in light of U-Net’s [29, 42] empirical effectiveness and the reality of mammogram data scarcity, we propose UFCN, an unsupervised feature correlation network, to predict a map showing abnormal variations by comparing the history of mammograms, which we call it abnormal variation map (AVM). Specifically, inspired by the radiologist’s reading procedure, we propose a parallel feature correlation encoder to compares high resolution prior and current mammograms to predict and visualize tumor location without using annotated training data. The contributions of this paper are summarized as follows:
-
•
We introduce a novel model that can detect breast cancer without requiring pixel level labeled data and that covers the entire process from start to finish.
-
•
We present a novel feature correlation module that can accurately pinpoint feature discrepancies between the current and previous image.
-
•
We propose a novel attention suppression gate to enhance the model’s capacity in differentiating between normal and cancer cases.
-
•
We propose a novel module to predict abnormal maps of the breast, which can help localizing tumors.
-
•
To the best of our knowledge, this is the first time an unsupervised model has been used to predict a breast abnormality variation map by utilizing patients’ current and prior mammograms.
2 Related Study
Breast cancer localization using FFDM has been extensively studied using deep learning algorithms. Researchers have explored various advanced models to achieve accurate localization of breast cancer, including convolutional neural networks (CNNs), recurrent neural networks (RNNs), and hybrid models. Despite the success of supervised deep learning approaches, unsupervised deep learning algorithms have limited implementation in breast cancer localization. This section will review studies that employed deep learning to localize breast cancer and unsupervised segmentation studies.
2.1 Breast Cancer localization studies
In the case of breast cancer localization, the goal is to determine the precise location of the abnormal object within the cancerous patient’s image. The main model — end-to-end model — used to detect cancer is CNN [39, 45, 3, 4]. Several researchers have introduced different approaches to detect and locate different types of abnormalities in mammography images such as region-based network (R-CNN) for ADs [15], dual CNN-based visual search system for mass [23], multi-scale deep belief network [9], self-transfer learning model [20], U-Net for all types of cancer[2] and adversarial model for mass [53]. These methods involve pre-processing, image enhancement, and normalization techniques to improve detection and localization accuracy.
In many mammogram localization studies, patches are often used to overcome computation challenges [45, 12, 10]. In the study by Choukroun et al., the authors proposed detecting microcalcifications (Cals) using discriminative local information contained in patches. The patch-based approach has some limitations, as the input patches are obtained from non-overlapping regions, leading to potential difficulties in precisely localizing masses. Furthermore, the small size of the input patches can create challenges in distinguishing between normal and abnormal tissue, which can negatively impact the accuracy of the detection and diagnosis of medical conditions. These issues highlight the need for continuing research and the development of more effective approaches for breast cancer detection.
Besides the aforementioned data-driven models, there are a few general models to localize breast cancer such as the YOLO-based models [39, 4], UNet-based models [5], and attention UNet-based models [27]. The remarkable success achieved by these cutting-edge models in localizing cancer cannot be overstated. However, even the most advanced models have a few limitations that must be addressed. One particularly significant limitation is the difficulty in accurately predicting results for normal patients. This is because these models are designed to operate under the assumption that patients have already been diagnosed with cancer or are suspected of having cancer. As a result, the models are trained using only cancer and benign data, making their prediction ability for normal patients uncertain. In addition, the supervised training process for these models presents a challenge. Annotating breast tumors is a costly and unclear process due to the varying and non-standardized tumor location annotation process Different levels of experience and practice in breast cancer diagnostics could cause different annotation styles. For example, unlike other object annotations, Cals — a type of breast cancer screened as clusters of tiny bright dots —poses a challenge in determining whether to annotate the entire area or each individual dot.
2.2 Unsupervised segmentation studies
Unsupervised segmentation is a rapidly emerging field that has attracted the attention of researchers across various disciplines, including medical image analysis. Through meticulous investigation, researchers have developed cutting-edge techniques to cluster similar pixels and segment objects in natural images by assigning pixel-level labels to images [21, 22]. Despite this, the application of these methods in medical image analysis poses significant challenges as the pixel intensity fails to exhibit significant differences, rendering this approach ineffective. Unlike objects in nature images, cancer and disease present a multitude of distinct characteristics during their development stages, presenting an opportunity to apply innovative unsupervised segmentation techniques that could revolutionize the field of medical image analysis.
In the world of clinical diagnostics, it is essential to assess a patient’s disease development to predict any possible occurrence of a particular ailment. In other words, by screening patients’ current condition, a synthetic history screen can be generated to predict any abnormal variation areas. In a pioneering study by Van Voorst et al., the authors employed a deep generative model to generate prior images using patients’ lesion-contained current-year images [48]. This approach involved using the difference map as segmentation for abnormal lesions. Furthermore, this technique has also been applied in breast cancer localization, as outlined in the research by Park et al.. In their work, the authors proposed using StyleGAN2 to generate patients’ synthesized normal images based on their current images, which aids in localizing abnormal tissue. The researchers trained StyleGAN2 on normal mammograms to predict abnormal tissue on the difference between generated synthetic normal images and their corresponding suspicious current images[37]. Pioneering models have demonstrated the feasibility of unsupervised learning in disease localization. However, there are certain limitations when it comes to generating prior images to learn the difference map as a disease segmentation technique. One such limitation is that normal prediction remains unknown, which poses a significant challenge to researchers.
3 Methods
The proposed model in this study, which we call it Unsupervised Feature Correlation Network (UFCN), takes advantage of the deep U-shaped residual connected autoencoder reconstruction process to learn the abnormal variation maps. In the following section, we present our model method in detail.
3.1 Definition
In this study, we define inputs as , where is a current year image that can be biopsy-confirmed cancer or normal and is a prior image that is normal. Let be a feature extraction function and be a feature transpose function. For an and , the estimate of , , can be obtained using these functions. On the other hand, if and can be learned through training for a given then learning and can be considered as a typical image reconstruction problem. If functions and have the property of being differentiable, then their parameters can be optimized using gradient descent. However, our study aims to predict the abnormal variation map (AVM) by training and in an unsupervised manner. Particularly, the proposed model will be trained to learn and under the task of reconstruction and prediction of the AVM using the learned feature difference between and . To put this into practice, we solved two sub-problems: training parameters of and with given and prediction of the optimal AVM with learned and . Because we also want to predict no abnormal changes for normal patients (s) where AVM should detect nothing, we introduced a mapping function in to map the probability of binary labels of s, s. In our case, the represents binary label of either normal or cancer of current mammograms.
3.2 Unsupervised feature correlation network (UFCN)
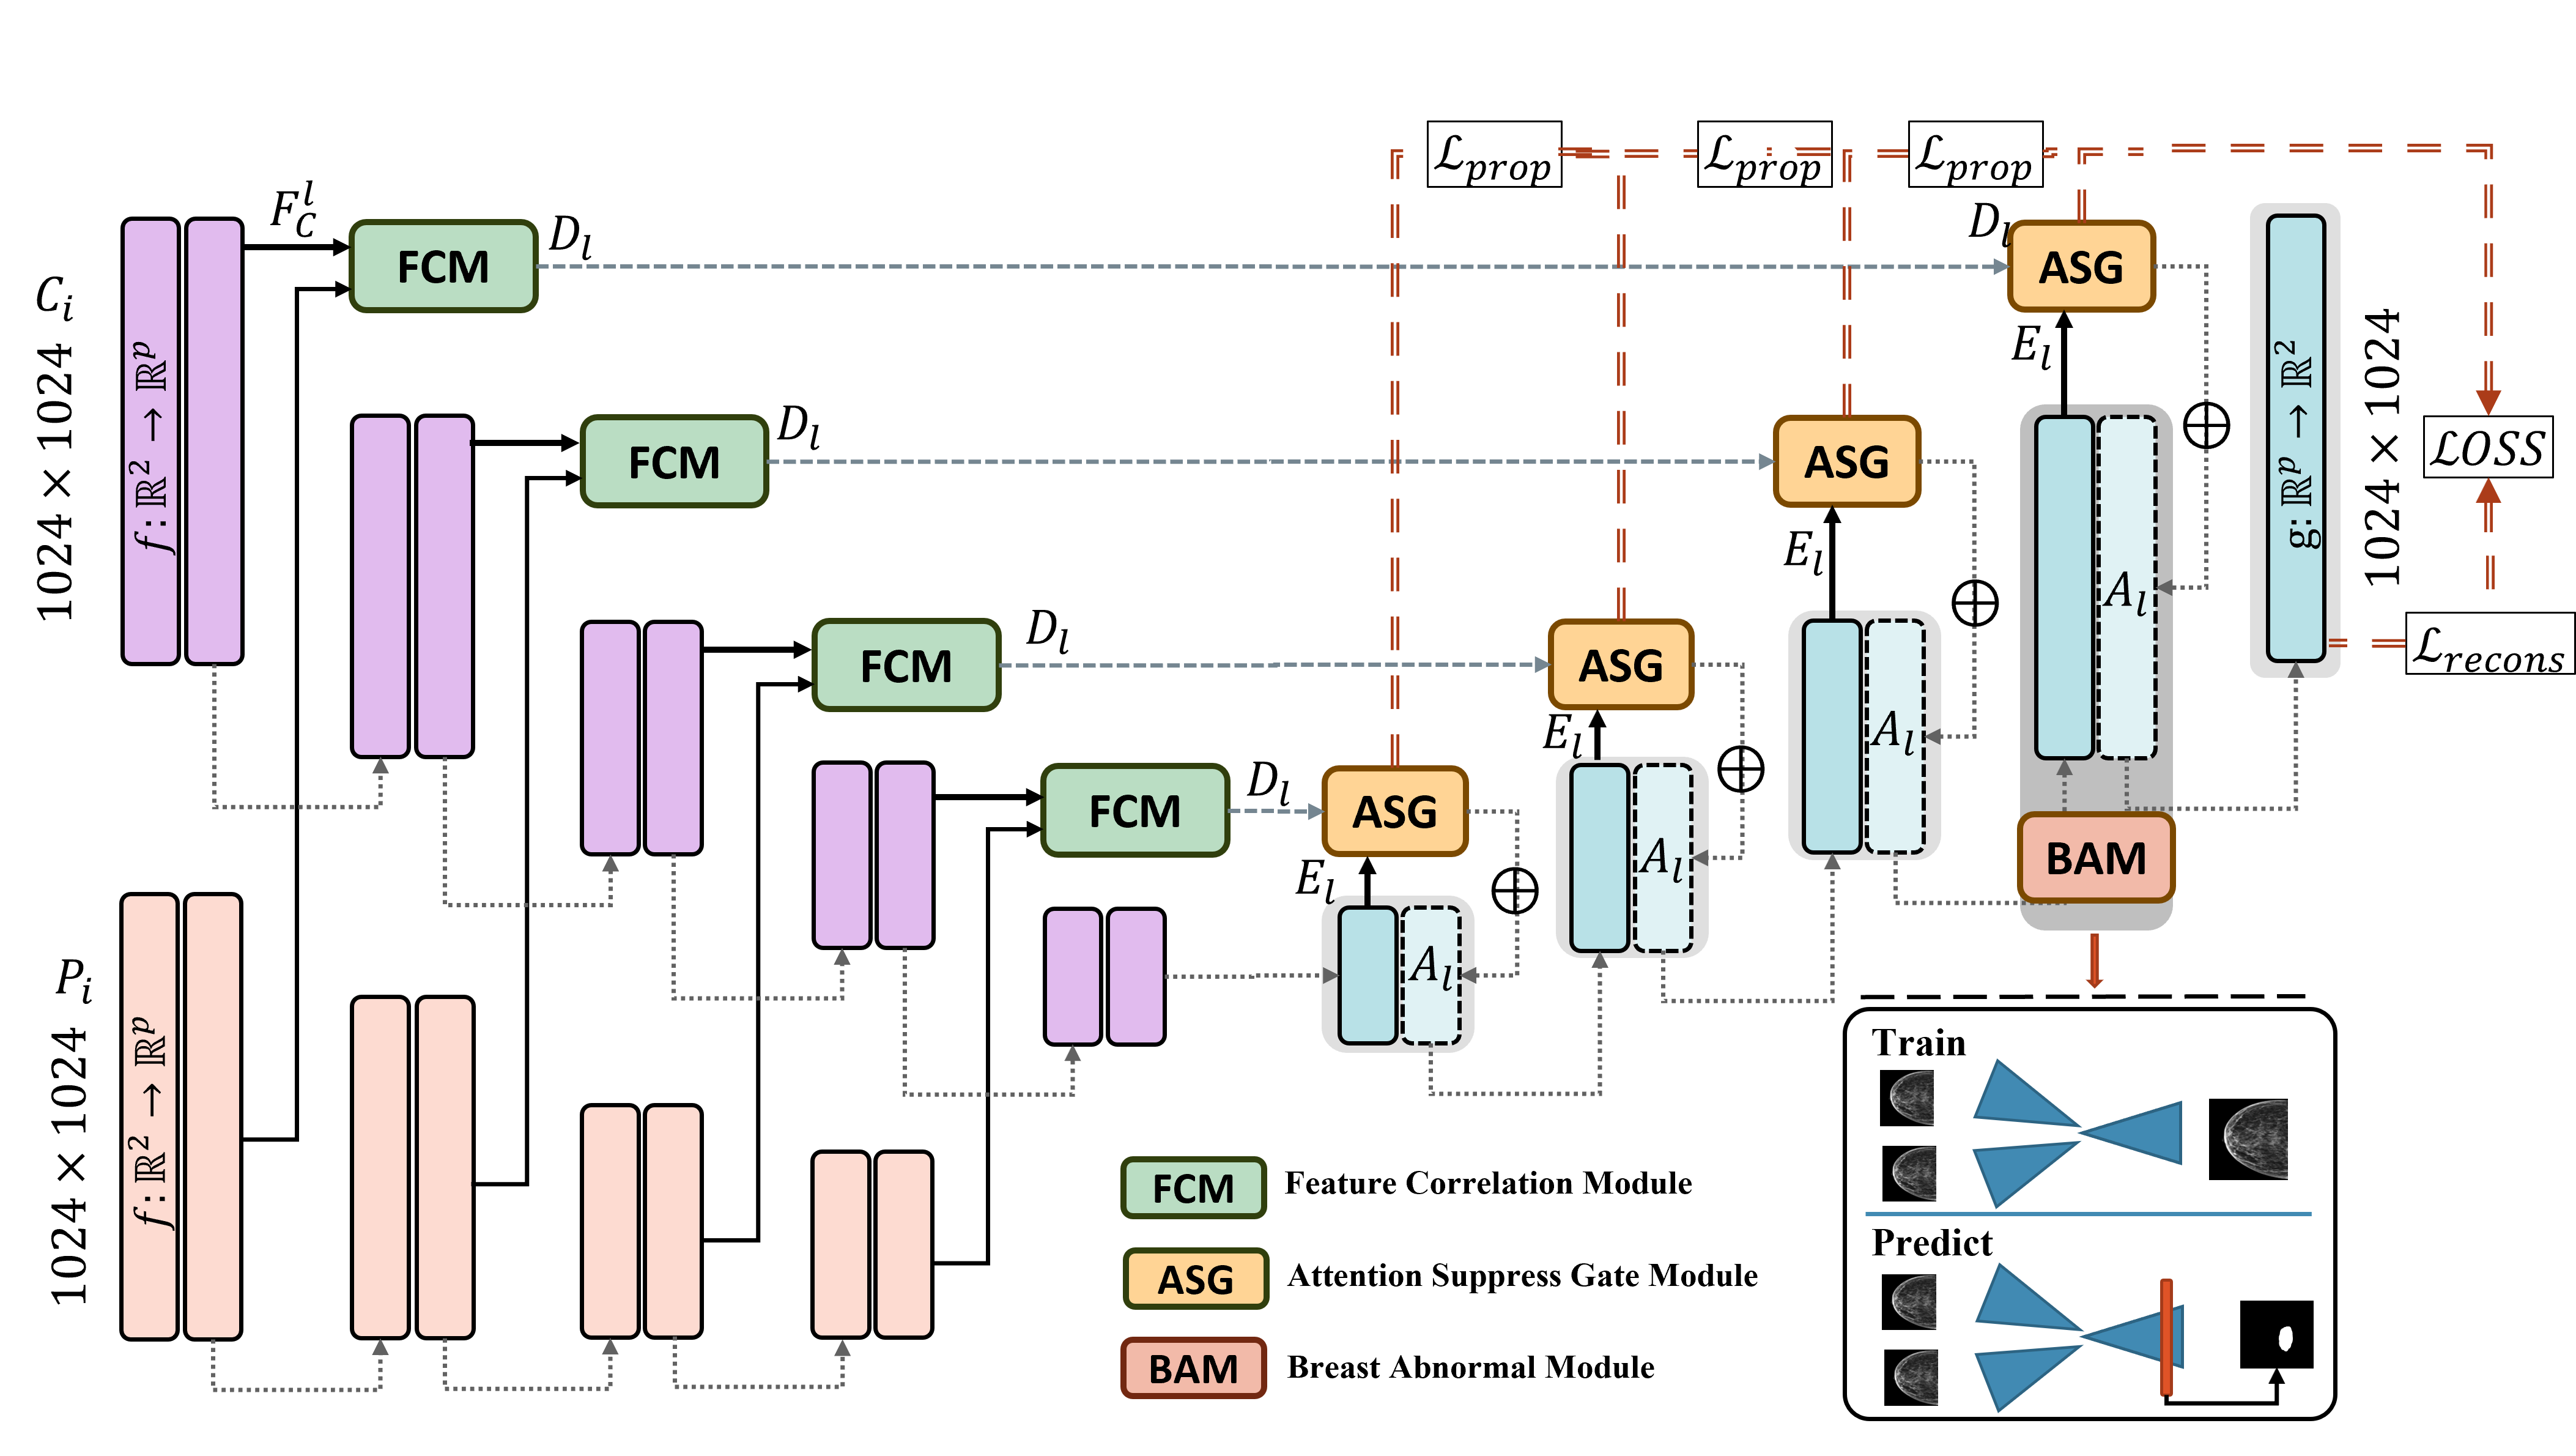
Our proposed model, UFCN, is an unsupervised CNN-based model. UFCN consists of an identical parallel twin encoder and a reconstruction decoder (Figure 1). UFCN embeds feature correlation modules (FCMs) into encoder layers and attention suppress gate modules (ASGs) into decoder layers. The breast abnormality map detection module (BAM) is embedded at the decoder’s layer , where is the total number of layers, to generate AVMs. A pair of current and prior images are input into the two identical parallel CNN blocks to learn the features. In each corresponding CNN block, the learned features of pairs of images using function are fed into FCMs to learn differences between current and prior images and their features. The output of FCM, , represents the breast tissue changes from prior mammograms () to current mammograms (). s residual connect to ASG at the decoder stage. The output of the decoder is the reconstruction of current mammograms, .
Selecting an activation function to trigger the model neurons in an unsupervised learning model is critical. Hence, we employed three activation functions in this study: 1) ReLU activation function () shown in equation 1, sigmoid activation function () shown in equation 2, and SiLU activation function () shown in equation 3 [14].
| (1) |
| (2) |
| (3) |
where is a trainable parameter and is input feature. The SiLU activation function has a desirable characteristic known as self-stabilization. This means that the point at which the derivative of the function is zero acts as a “soft floor” for the weights, which helps to regulate the learning process by discouraging the development of excessively large weights. We implemented the SiLU activation in the FCM modules and CNN blocks in the encoder and decoder; the ReLU activation in the ASG modules for faster gradient descent; and the sigmoid activation in the ASG and BAM modules.
3.3 Feature correlation module (FCM).
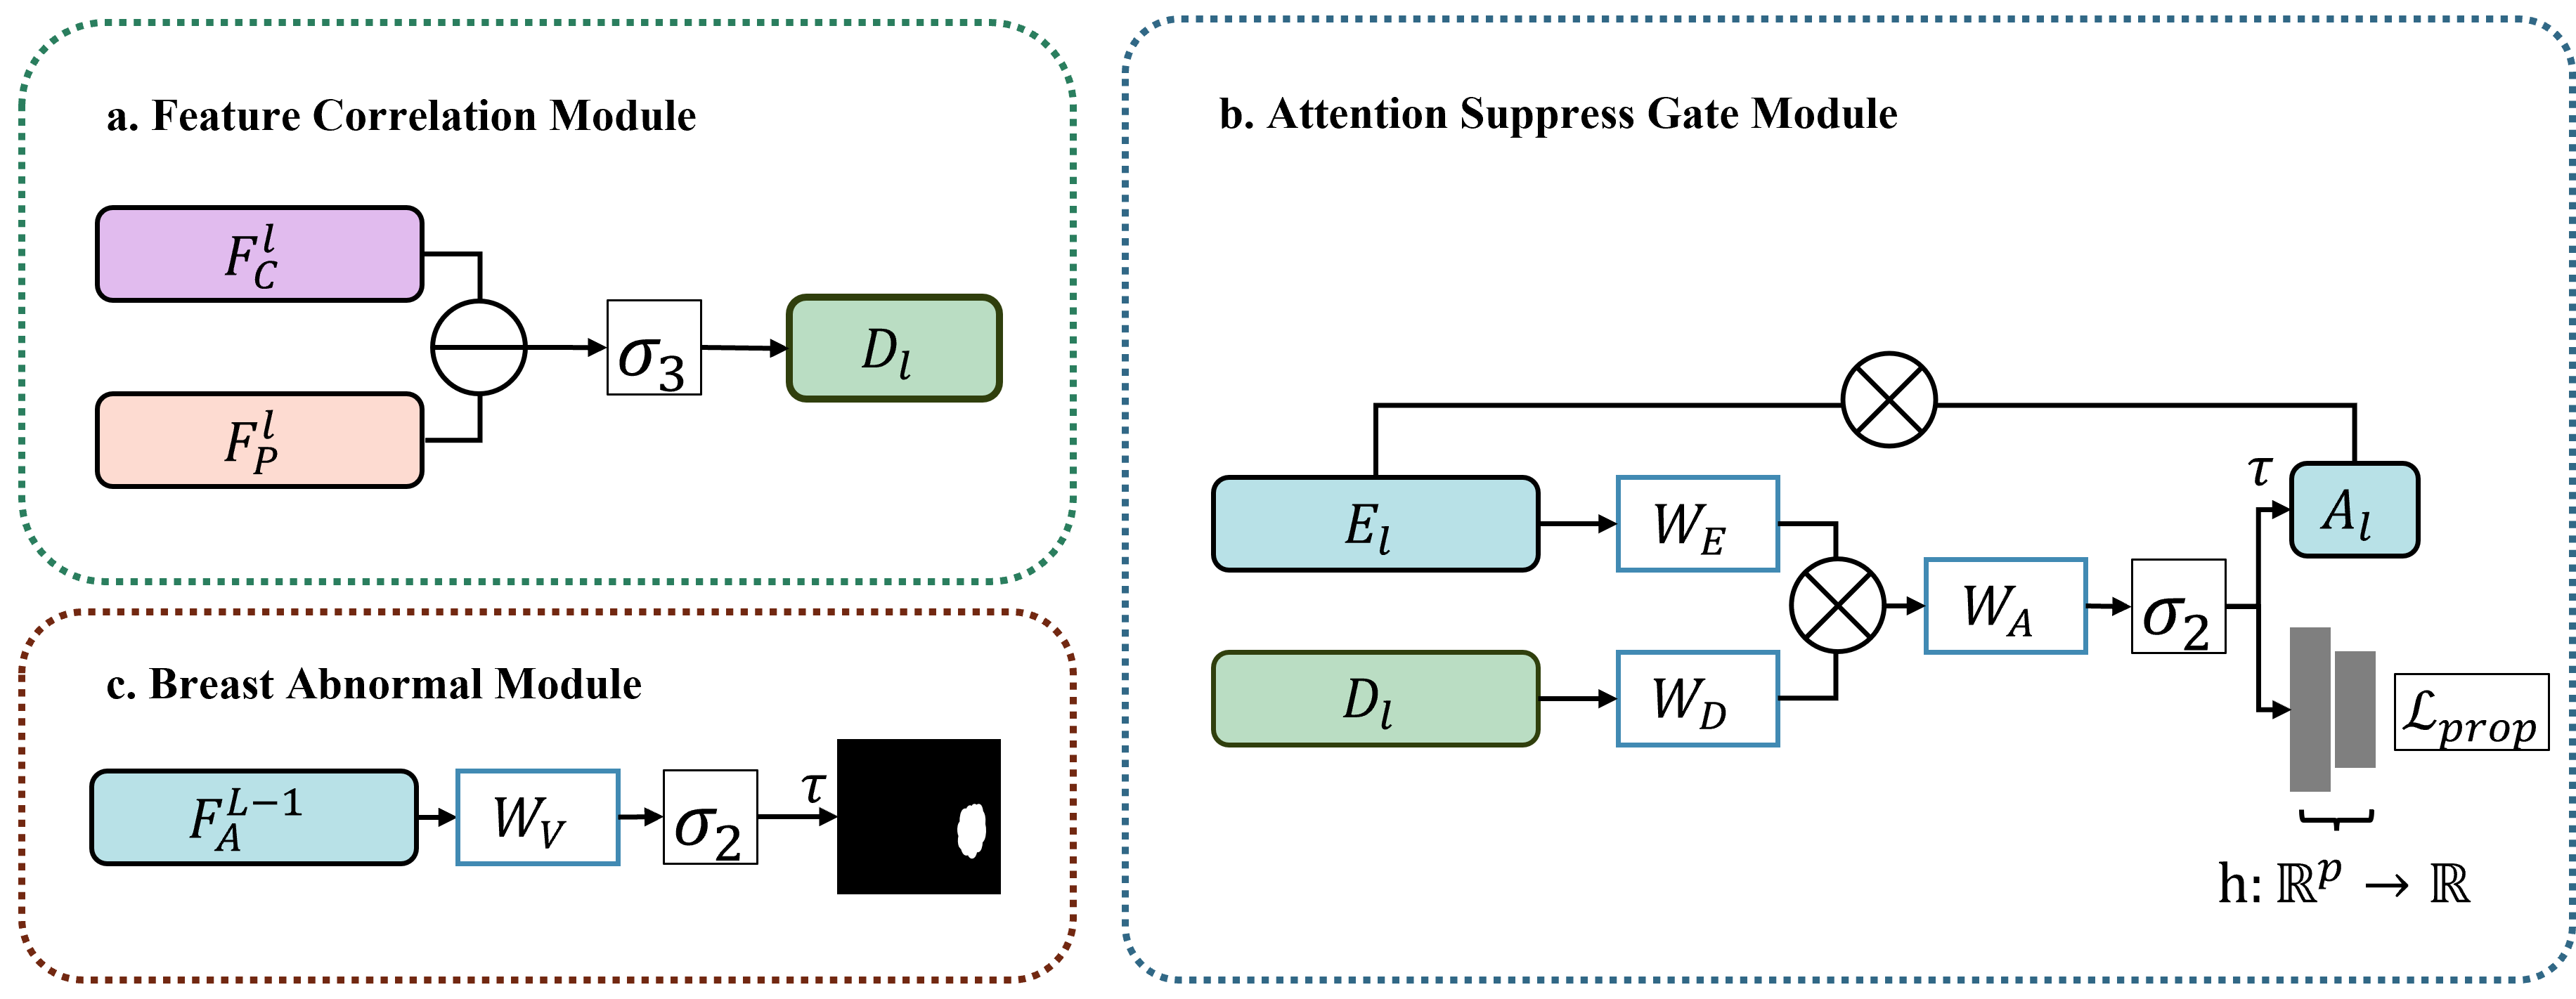
To take advantage of the paired images through the reconstruction process, we embedded FCM modules into each layer of the encoder stage. FCM (Figure 2.a.) learns multi-scaled feature correlation between current and prior mammograms to learn newly grown tumors. The FCM module output, , can be expressed as , where and are the feature maps of the current and prior mammograms at layer , is matrix subtraction, and is the SiLU activation function [14].
3.4 Attention suppress gate module (ASG).
The ASG module is embedded into each layer of the decoder stage at the image reconstruction process with function . The ASG (Figure 2.b.) aims to selectively highlight specific areas of an image through attention weightings. In our specific problem, we also utilize ASGs to completely remove any activation from the normal patients’ images. As the model is trained, the soft attention aspect will prioritize regions with greater weights while the hard suppresser — mapping function — eliminates any activity from the normal images.
ASG adds weight to breast tissue areas and reduces the impact of changes in breast borders. ASG at layer outputs attention coefficients whiles takes and as input, where is decoder output at layer . is computed as , where is the sigmoid activation function, and is Hadamard product. To have more aggressive soft attention, we introduced a threshold to suppress the attention coefficients lower than the threshold and to remain the attention region for the attention coefficients higher than the threshold. To prevent neurons from dying, we suppress the lease-activated region (the feature map region below the threshold) to a small constant value instead of zero.
The hard suppressor acts as a regularizer that maps region-activated feature map to probability of as where is a vector of trainable parameters in our study. The mapped probability of normal and cancer,, are participated in loss term to compute the gradient. ASG progressively suppresses features responding in irrelevant background regions and normal patient’s image. The output of ASG at each layer is concatenated with its corresponding encoder features at each layer , and then the features are fed forward to the next layer until reaching the last layer that reconstructs and outputs .
3.5 Breast abnormality detection module (BAM).
As we defined in the previous section, the optimal AVM is predicted with learned and . To achieve an accurate binary mask AVM indicating the abnormal regions, we embedded BAM in the decoder stage. The BAM module (Figure 2.c.) is applied to layer which outputs and generates AVMs as , where is the extracted feature vector at layer . The module applies a convolution layer to blend the features, then employs the sigmoid activation function. Finally, using a threshold (we used in our study), BAM selects the most activated regions as AVMs, indicating cancer regions.
3.6 Loss function
The proposed loss function consists of a constraint on current year image reconstruction — the similarity index measure(SSIM) reconstruction loss [50], a layer wise constraint on the probability of binary labels (normal and cancer) of images — the binary cross function (BE), and a constraint on weights — the norm function, denoted as follows:
| (4) |
where
| (5) |
where represents the mean of pixel intensities, in this equation denotes the standard deviation of pixel intensities, and are constant for stability. is given by and where and are constant values, and is the dynamic range of pixel intensities.
The probability distribution constraint is defined as:
| (6) |
where is the binary label for the at ASG, is prediction of the , and is input feature map.
4 Baseline and Variant models
In the course of the experiments, we used the following models as baseline models and variants of the proposed model. All baseline models are supervised autoencoder-shaped models. We trained the baseline models, proposed model, and variation models with the same training dataset and input dimension. However, the baseline models were only trained using cancer images due to their design. To have a fair comparison, all baseline models and variation models employed the same numbers of building blocks.
4.1 U-Net
We compared the performance of the proposed method with that of the U-Net [29]. We kept the structure of U-Net as standard U-Net and optimized the feature depth at each building block. The U-Net model has contained five building blocks. The feature depth of each building block is indicated as . We used dice loss (Equation 7) to optimize the U-Net gradient as follow:
| (7) |
where is the number of images in this equation, is predicted probability, is ground truth, and is a hyperparameter to ensure the stability of the loss function.
4.2 Attention U-Net
We also compared the performance of the proposed model with that of U-Net attention[35]. The structure of attention U-Net reminded the same as its original and we optimized the feature depth at each building block. The feature depths of building blocks are . We used dice loss (Equation 7) to optimize the attention U-Net gradient.
4.3 U-Net++
Another baseline model we used in this study is U-Net++ [52]. The structure of the U-Net++ reminded the same. We used feature depth of for building blocks. U-Net++ is an extension of the U-Net architecture for semantic image segmentation. The model structure is similar to U-Net, but with additional nested and dense skip connections. We used dice loss (Equation 7) to optimize the attention U-Net++ gradient.
4.4 SegResNet
We used SegResNet [33] for performance comparison too. SegResNet is a deep neural network architecture designed for semantic image segmentation tasks. The model is based on the ResNet [17] architecture. The SegResNet enhance the performance of ResNet for image segmentation tasks by adding a decoder network to the architecture. This decoder network is composed of several deconvolutional (or transposed convolutional) layers, which upsample the features extracted by the ResNet encoder and generate a pixel-wise segmentation mask. We used dice loss (Equation 7) to optimize the SegResNet gradient.
4.5 V-Net
We also compared the proposed model with V-Net [31]. The V-Net architecture bears some resemblance to the U-Net architecture, but with some differences. Firstly, V-Net does not employ Batch Normalization, unlike U-Net. In addition, while U-Net uses element-wise summation after each successive convolutional layer, V-Net does not. In the experiment, we kept the same structure as the original V-Net. We used dice loss (Equation 7) to optimize the V-Net gradient.
4.6 UFCN-variants
As mentioned in the Method section (section 3), the activation function is important to obtain accurate abnormal variation maps. Therefore, to explore how the activation function impacts the proposed model, we studied two variations of the proposed model: 1) UFCN-T, and 2) UFCN-R. In the UFCN-T model, We define a new activation function, which we called it Tilu, to enhance the activated region by dropping the low-signaled neurons. The Tilu activation function can be expressed as , where is a small constant value as hard floor. The UFCN-R used regular ReLU activation function in the entire model. The loss function remains the same as that of the proposed method expressed in Equation 4.
5 Data & Experimental Setup
5.1 Experiment setup
We used PyTorch to implement the proposed method, its variants and the baseline models. Data pre-processing was performed with High-Performance Computing (HPC) with 36 cores Xeon CPU. The proposed method was trained on Xsede with multiple 32 GB V100 GPU nodes [8]. We explored the starting learning rate in a range from to . We used a learning rate scheduler to optimize the model’s learning rate. The proposed model code is available at https://github.com/NabaviLab/ufcn.
5.2 Data
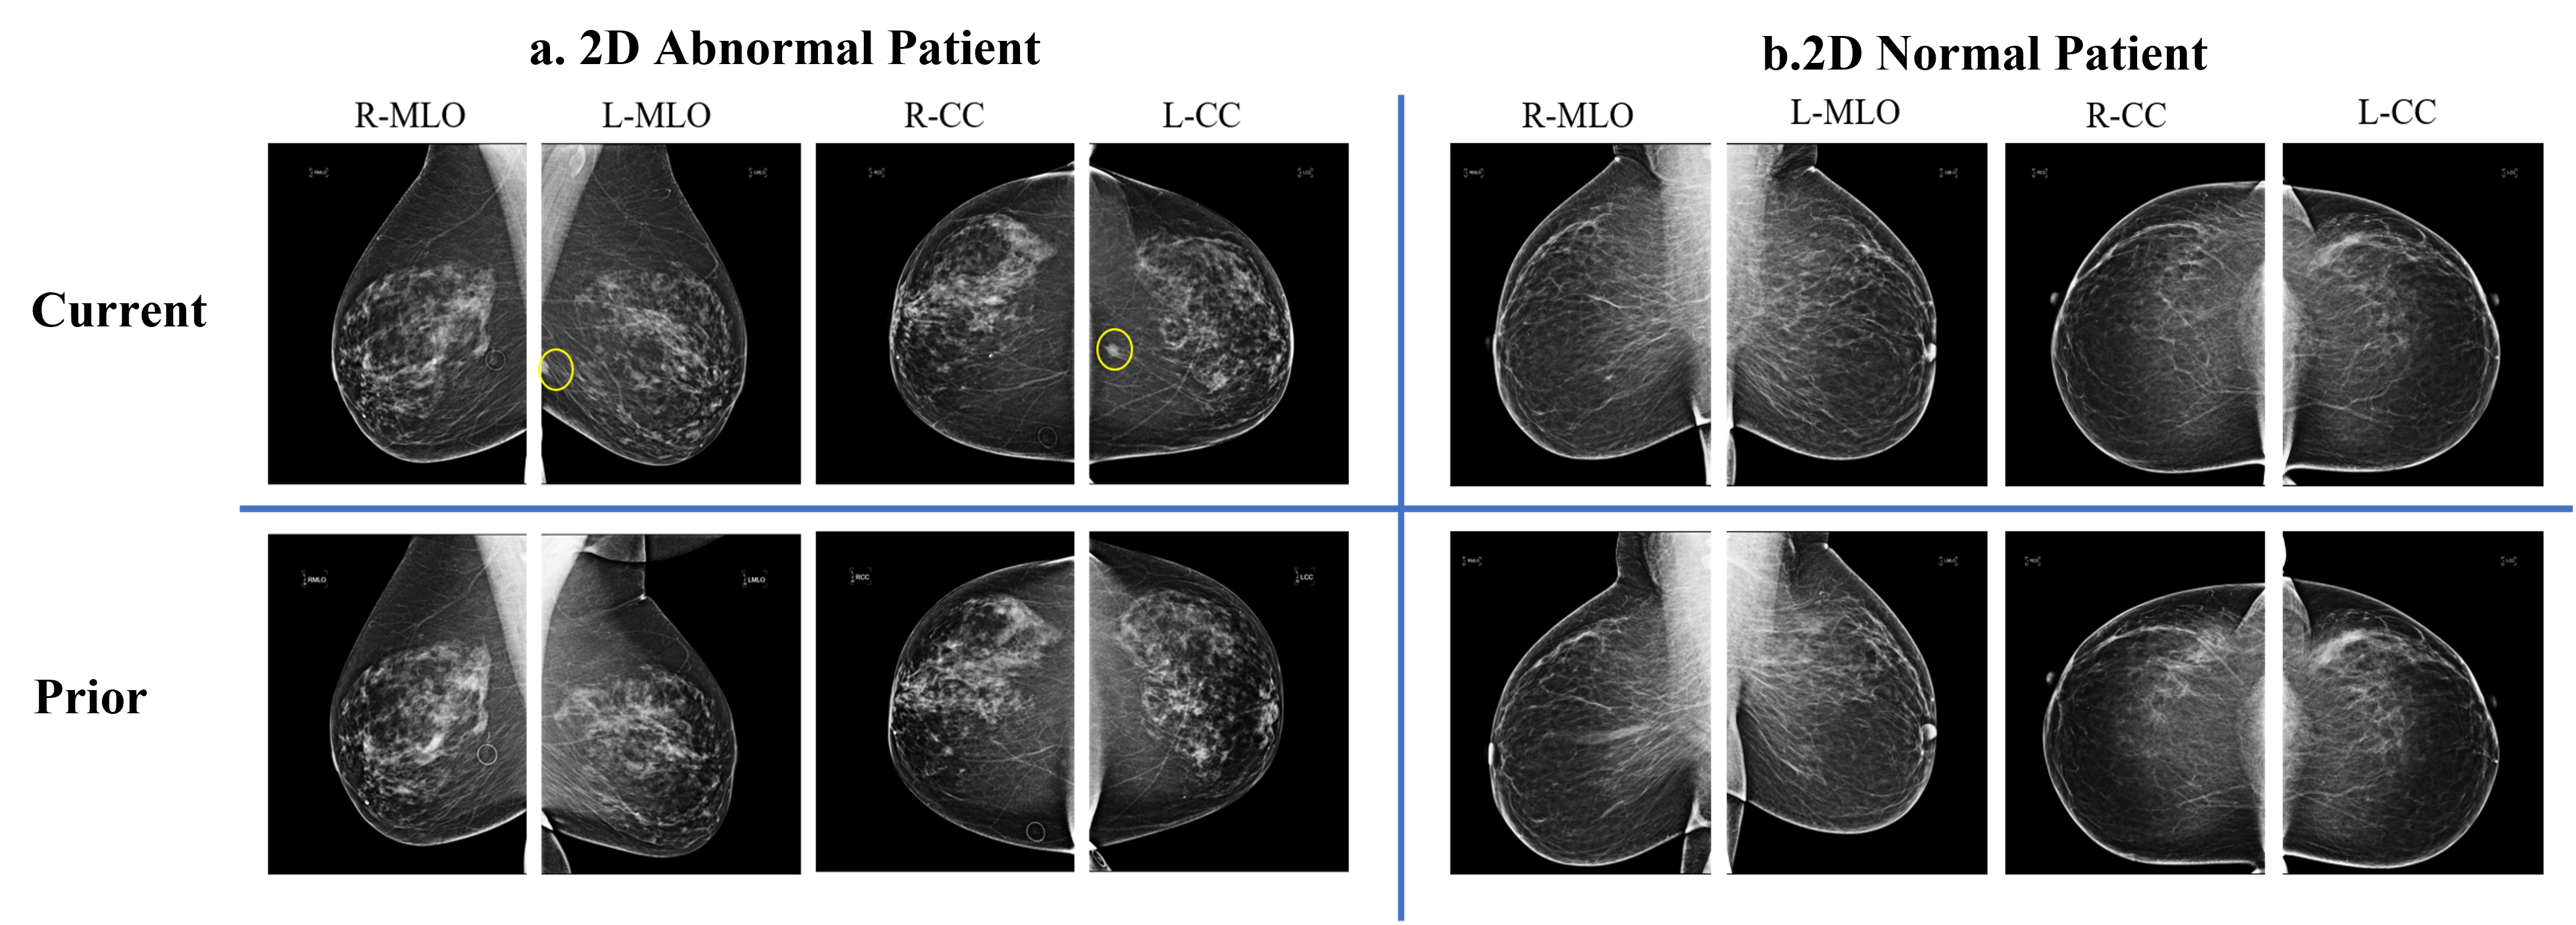
The proposed and baseline models were trained, tested, and validated on the UConn Health Center (UCHC) dataset, which includes both current and historical mammograms. This dataset was compiled by collecting FFDMs from patients who underwent mammogram exams at UCHC between October 31, 2006, and August 23, 2021, using a Hologic machine. The UCHC Institutional Review Board approved the data collection, and the Diagnostic Imaging Informatics Department at UCHC provided support in exporting the DICOMs from the Picture Archiving and Communication Systems (PACS) at UCHC. To ensure patient privacy, identifiers were removed and replaced with a standard naming convention. The mammograms in the dataset were annotated by radiologists.
In this collection, 493 mammogram pairs (current and their corresponding prior normal mammograms) are labeled cancer, and 581 mammogram pairs are labeled normal. Data pre-processing includes normalization, re-scale, and augmentation are applied. No alignment is performed in this study. The ground truth used for evaluation is annotated by radiologists.
To ensure the diversity and generalizability of the dataset, various types of tumors and breast densities were included. The mass type in the dataset includes round, oval, architectural distortion, irregular, and lobulated, while the microcalcification type includes amorphous, coarse, fine linear branching, pleomorphic, punctate, and round with regular shapes. All types of breast densities, including fatty, fibroglandular dense, heterogeneously dense, and extremely dense breasts, were also included. The fibroglandular dense and heterogeneously dense breast types cover a significant portion of the dataset.
6 Results and discussion
We compared the performance of the proposed model and its variant with the baseline model explained in Section4, in terms of Dice score, cancer detection rate (cDR), and normal detection rate(nDR) for different cancer types (Mass, microcalcifications (Calc), Architectural Distortion (AD)). The results for different cancer types are shown in Table 1.
We define cancer detection as binary detection when for cancer cases a cancer region is detected and for normal cases, a minimal region that below the threshold as shown in Equation 9 is detected . Additionally, we compared the performance of all the models in terms of Accuracy, Sensitivity, Precision, and F1 in detecting abnormalities. True Positive () and True Negative () used in computing the aforementioned metrics are defined in Equations 8 and 9, respectively.
| (8) |
where is the input test mammogram image.
| (9) |
where are the width and height of the input image.
6.1 Overall results
Table 1 highlights the superiority of the proposed model, UFCN, in terms of cancer detection. This model achieves the best cancer detection rate for both masses and microcalcifications, as well as the best Dice score for masses. Furthermore, the proposed UFCN also performs well in architectural distortion cancer type, achieving the second-best performance in terms of the Dice score and the third-best in terms of cancer detection rate. When compared to its variant, UFCN-R, which uses the ReLU activation function, the proposed UFCN outperforms in all types of cancers. The inferior performance of UFCN-R may be caused by the dying ReLU, in which ASG suppresses the majority of nodes to zero, resulting in a decrease in the activated regions and shrinkage of the abnormal variation map. In contrast, the use of the "soft floor" SiLU activation function in UFCN prevents dead neurons and provides the necessary stability to activate the attention regions while simultaneously suppressing the irrelevant background of cancer images and normal images. The results demonstrate the superior performance of UFCN in cancer detection, even though the model is trained in an unsupervised fashion.
For the architectural distortion cancer type, UFCN-T shows superior performance in both Dice score and cancer detection rate. Although the TiLU activation function uses a hard floor like ReLU, it employs a slightly tighter bound as a hard floor to avoid the dying ReLU caused by the properties of zero, unlike the ReLU activation function that uses for the hard floor. In other words, UFCN-T maximizes the variation between the current year image and the prior image, which is also observable by its superior performance in detecting microcalcifications and comparable performance in detecting masses.
The proposed model, UFCN, outperforms all baseline models including U-Net, U-Net attention, U-Net++, SegResNet, and V-Net in almost all the metrics. Among all baseline models, U-Net++ showed the best performance in terms of cancer detection rate and Dice score in architectural distortion and mass cancer types, while U-Net showed a decent Dice score and cancer detection rate in Cals among all baseline models. However, both models showed relatively low performance in normal tissue classification, as indicated by their low nDR. In contrast, UFCN achieved the best performance in terms of cancer detection rate and Dice score for mass and the second-best for calcifications, as well as the highest nDR among all the models. These findings demonstrate the superior performance of our proposed UFCN, which is trained in an unsupervised fashion. Specifically, UFCN-T showed the best performance overall, with a Dice score of 0.66 and a cDR of , followed by UFCN with a Dice score of and a cDR of . These findings demonstrate the superior performance of our proposed UFCN, which is trained in an unsupervised fashion.
| AD | Mass | Cals | Normal | ||||
|---|---|---|---|---|---|---|---|
| Model | Dice | cDR | Dice | cDR | Dice | cDR | nDR |
| U-Net | 0.47 | 0.71 | 0.64 | 0.87 | 0.44 | 0.71 | 0.09 |
| U-Net attention | 0.48 | 0.79 | 0.66 | 0.87 | 0.40 | 0.68 | 0.09 |
| U-Net++ | 0.60 | 0.86 | 0.68 | 0.89 | 0.38 | 0.58 | 0.08 |
| SegResNet | 0.58 | 0.86 | 0.63 | 0.85 | 0.39 | 0.61 | 0.21 |
| V-Net | 0.46 | 0.64 | 0.58 | 0.75 | 0.29 | 0.45 | 0.08 |
| UFCN-T | 0.66 | 0.86 | 0.61 | 0.76 | 0.59 | 0.61 | 0.17 |
| UFCN-R | 0.35 | 0.64 | 0.58 | 0.73 | 0.36 | 0.55 | 0.58 |
| UFCN | 0.60 | 0.79 | 0.69 | 0.91 | 0.57 | 0.74 | 0.73 |
In addition to evaluating cancer detection rates and Dice scores, we also assessed the model’s performance in detecting normal and cancer cases in terms of Accuracy, Sensitivity, Precision, and F1 scores (see Table 2). Notably, all the baseline models do not perform well when applied to normal cases. The baseline models originally proposed to identify abnormal tissue areas in cancer images, and it often relies on pre-classified cancer data. This limitation causes the baseline models to fail to distinguish between cancer and normal cases. As a result, the U-Net model shows poor performance in terms of Accuracy (), Sensitivity (), and F1 score () but a better Precision score (). The SegResNet showed slightly better performance in Accuracy () and Sensitivity () compare with U-Net. The V-Net shows least performance in terms of all evaluation metrices.
| Model | Accuracy | Sensitivity | Precision | F1 |
| U-Net | 0.41 | 0.43 | 0.80 | 0.56 |
| U-Net attention | 0.42 | 0.43 | 0.80 | 0.56 |
| U-Net++ | 0.40 | 0.42 | 0.79 | 0.55 |
| SegResNet | 0.47 | 0.46 | 0.78 | 0.58 |
| V-Net | 0.34 | 0.37 | 0.64 | 0.47 |
| UFCN-T | 0.43 | 0.43 | 0.73 | 0.54 |
| UFCN-R | 0.62 | 0.57 | 0.67 | 0.62 |
| UFCN | 0.78 | 0.72 | 0.84 | 0.78 |
Although UFCN-T shows a higher detection rate for architectural distortion and microcalcification, its normal detection rate is lower, and its accuracy (), sensitivity (), and F1 score () are comparable with those of U-Net. Similar to U-Net, the precision score of UFCN-T yields the third-best result. UFCN-R shows a better normal detection rate compared to U-Net and UFCN-T. However, the trade-off to increasing the normal detection rate in UFCN-R is a lower detection rate for cancer cases. Hence, its accuracy (), sensitivity (), and F1 score () are the second-best results. However, its precision is the lowest compared to those of the other models. The proposed UFCN shows the best performance in terms of all the evaluation metrics compared to the other models. The UFCN achieves the best normal detection rate () while still maintaining a better performance for cancer detection. As Table 2 demonstrates, UFCN shows the best accuracy (), sensitivity (), precision (), and F1 score ().
6.2 Cancerous case results

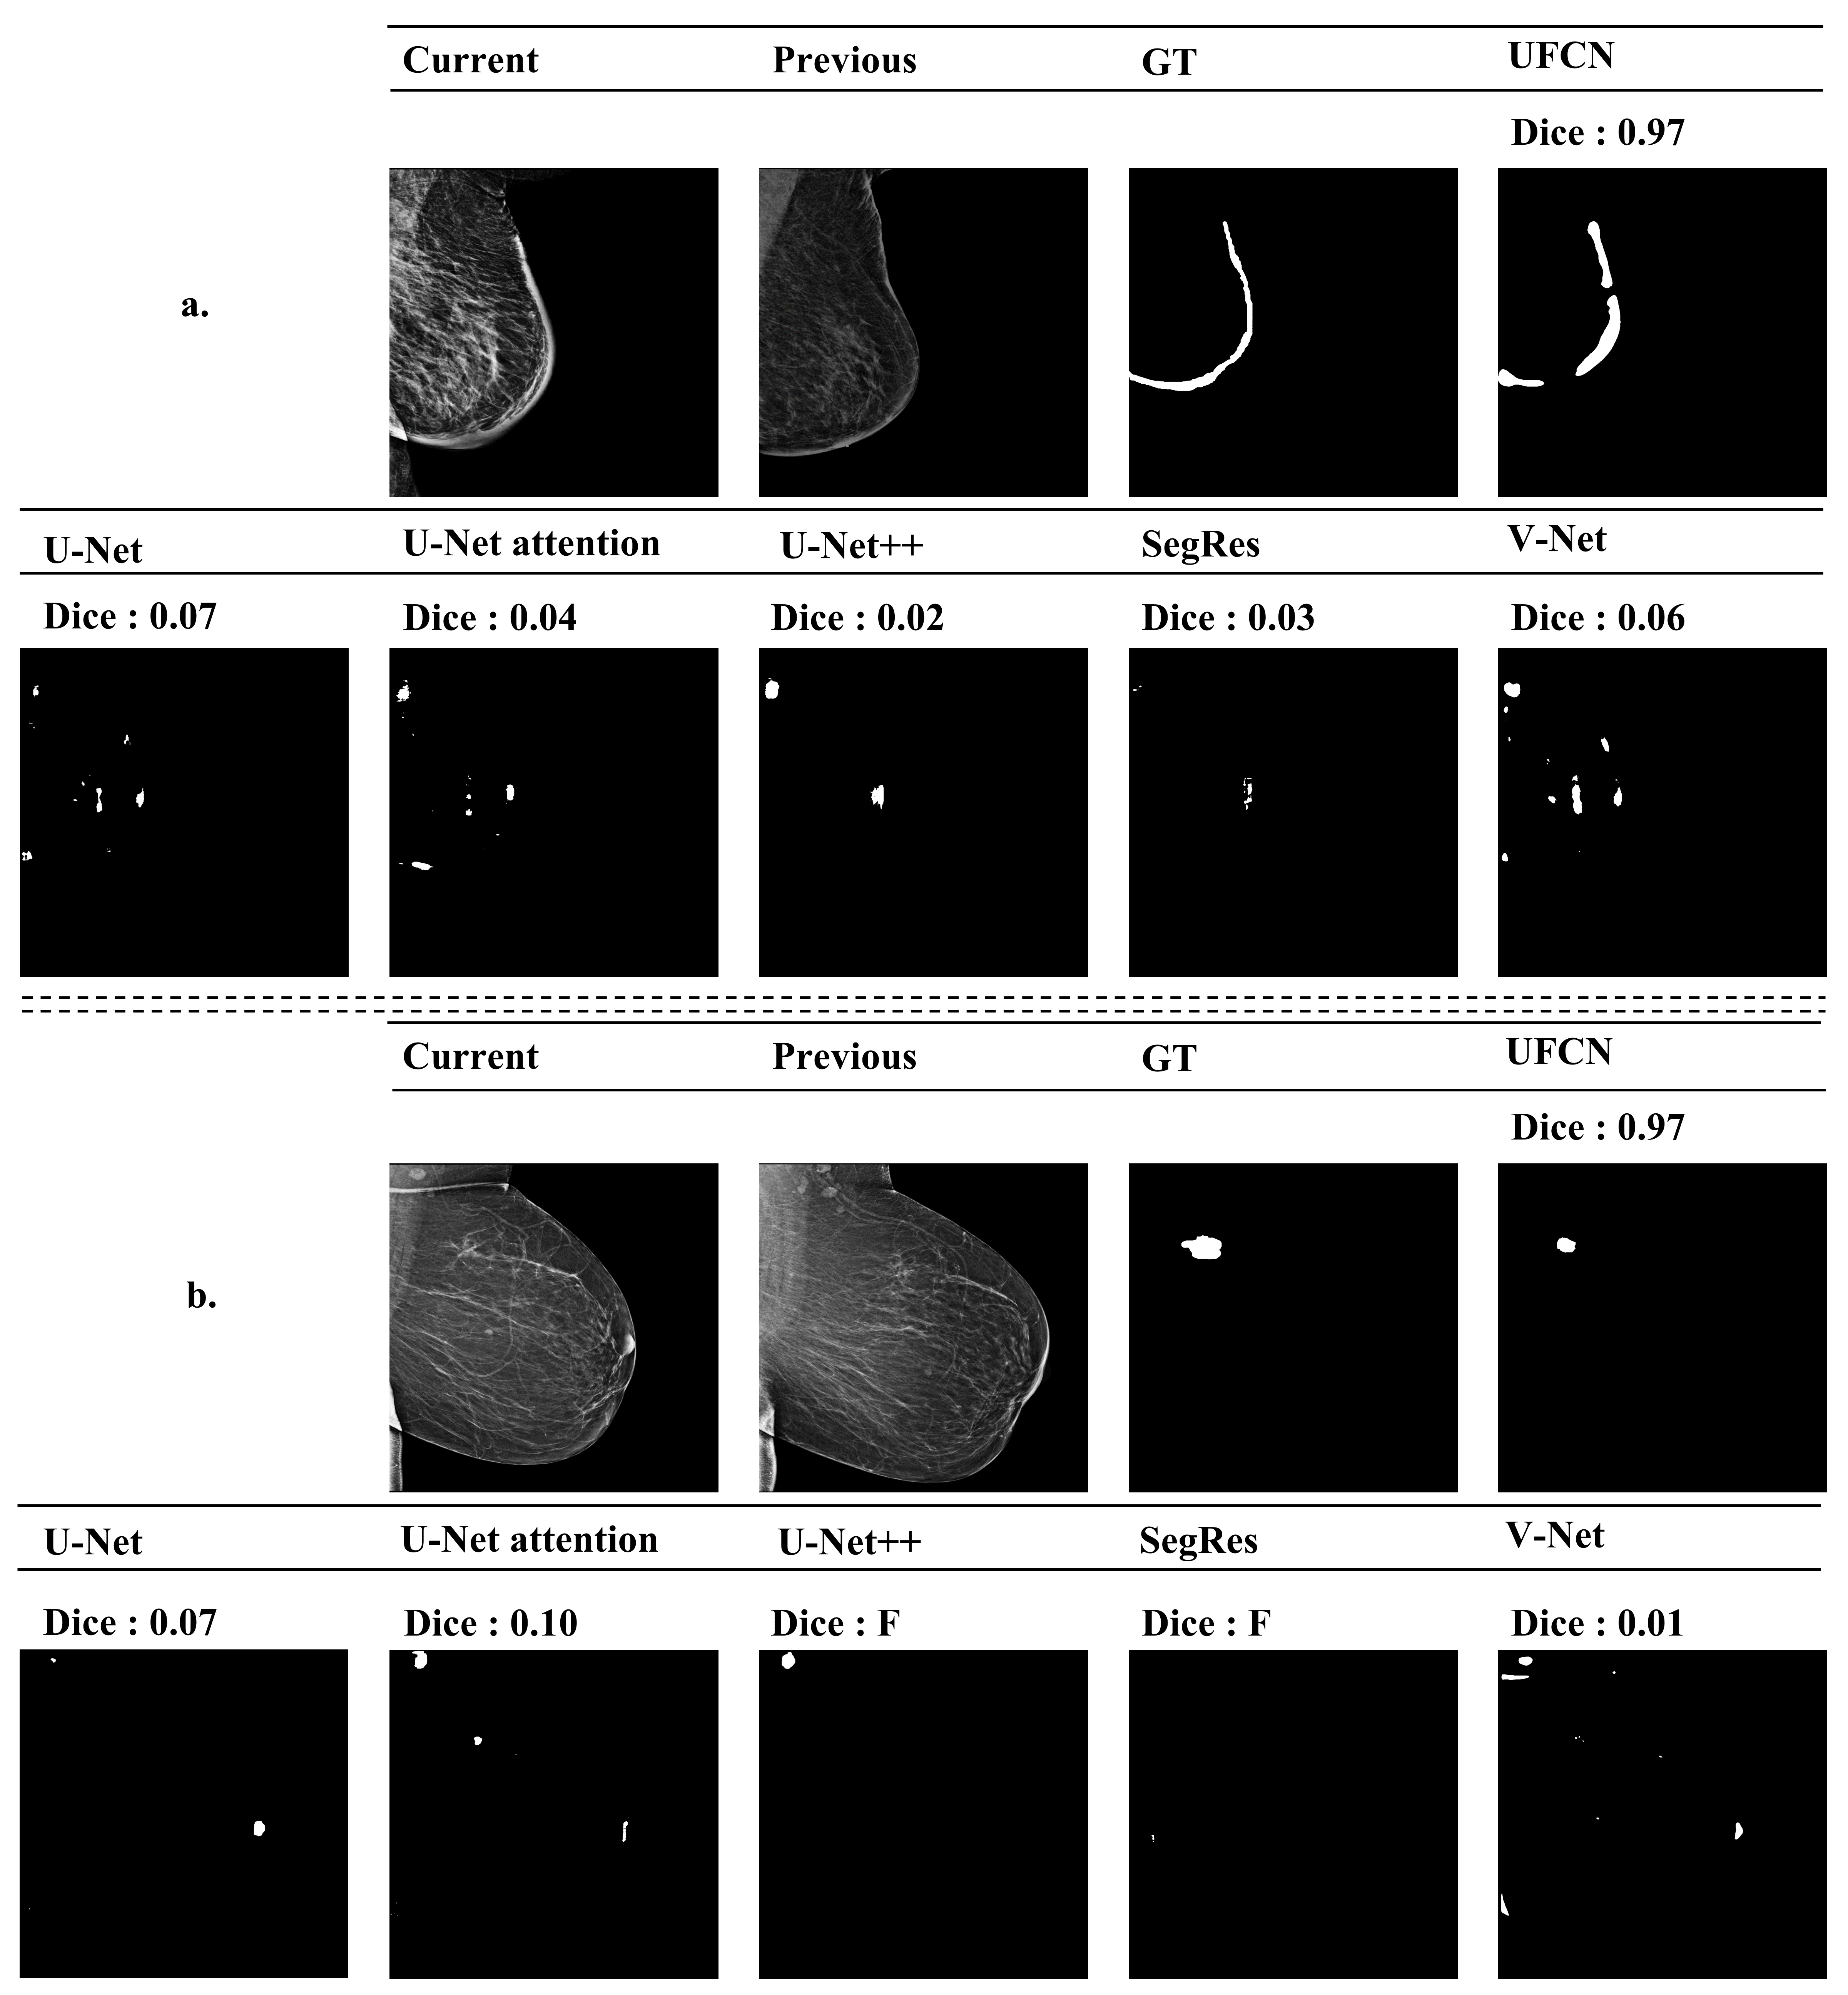
We examined the AVM outputs of the propose model and its variant and also the segmentation outputs of the baseline models. As shown in Figure 4, UFCN’s prediction is very close to the ground truth annotations. Especially for architectural distortion ( 4.e.) and microcalcification ( 4.a.), the UFCN can generates more precise abnormal tissue maps (Figure 4 a & e). As can be seen in Figure 4.a, U-Net, attention U-Net, U-Net++ and SegResNet models fail to detect microcalcification. UFCN-R misses the detection for architectural distortion. As mentioned before, the hard floor of ReLU causes the active region to shrink as shown in the Figure. UFCN-T generates larger abnormal tissue areas compared with UFCN and UFCN-R.
What stands out in our results is the skin tumor case as shown in Figure 5.a. This case was only in our test data set. As the figure shows, the U-Net model misses the skin area and wrongly detects a few other regions as tumor locations. On the other hand, the proposed UFCN model is able to precisely generate the abnormal region, which indicates that the ASG module in the proposed model was not activated in the breast tissue area, but instead it was activated in the area where the abnormal changes were exist. This demonstrates the effectiveness of the ASG mechanism in accurately localizing the abnormal tissue region in medical images. Furthermore, this finding highlights the importance of developing models that are specifically designed to handle diverse abnormalities in medical images. The proposed UFCN model demonstrates superior performance in detecting abnormal tissue areas, including those that may not be related to the specific medical condition under consideration, such as in the case of skin tumors.
In Figure 5.b., we visualized the output maps generated by all baseline models and our proposed UFCN on a mass case. As can be observed in Figure 5.b., U-Net mistakenly identified a bright round area as an abnormal tissue region, leading to false negative detection. This limitation is a common issue with U-Net, where non-cancerous bright round areas are frequently misidentified as abnormal. U-Net++ and SegResNet also failed to detect cancer in this particular case. In contrast, our proposed model, UFCN, effectively distinguishes between normal and abnormal bright areas by comparing current and previous images. Consequently, the abnormal variation map (AVM) generated by UFCN shows more precise and accurate cancer detection.
6.3 Non-cancerous results
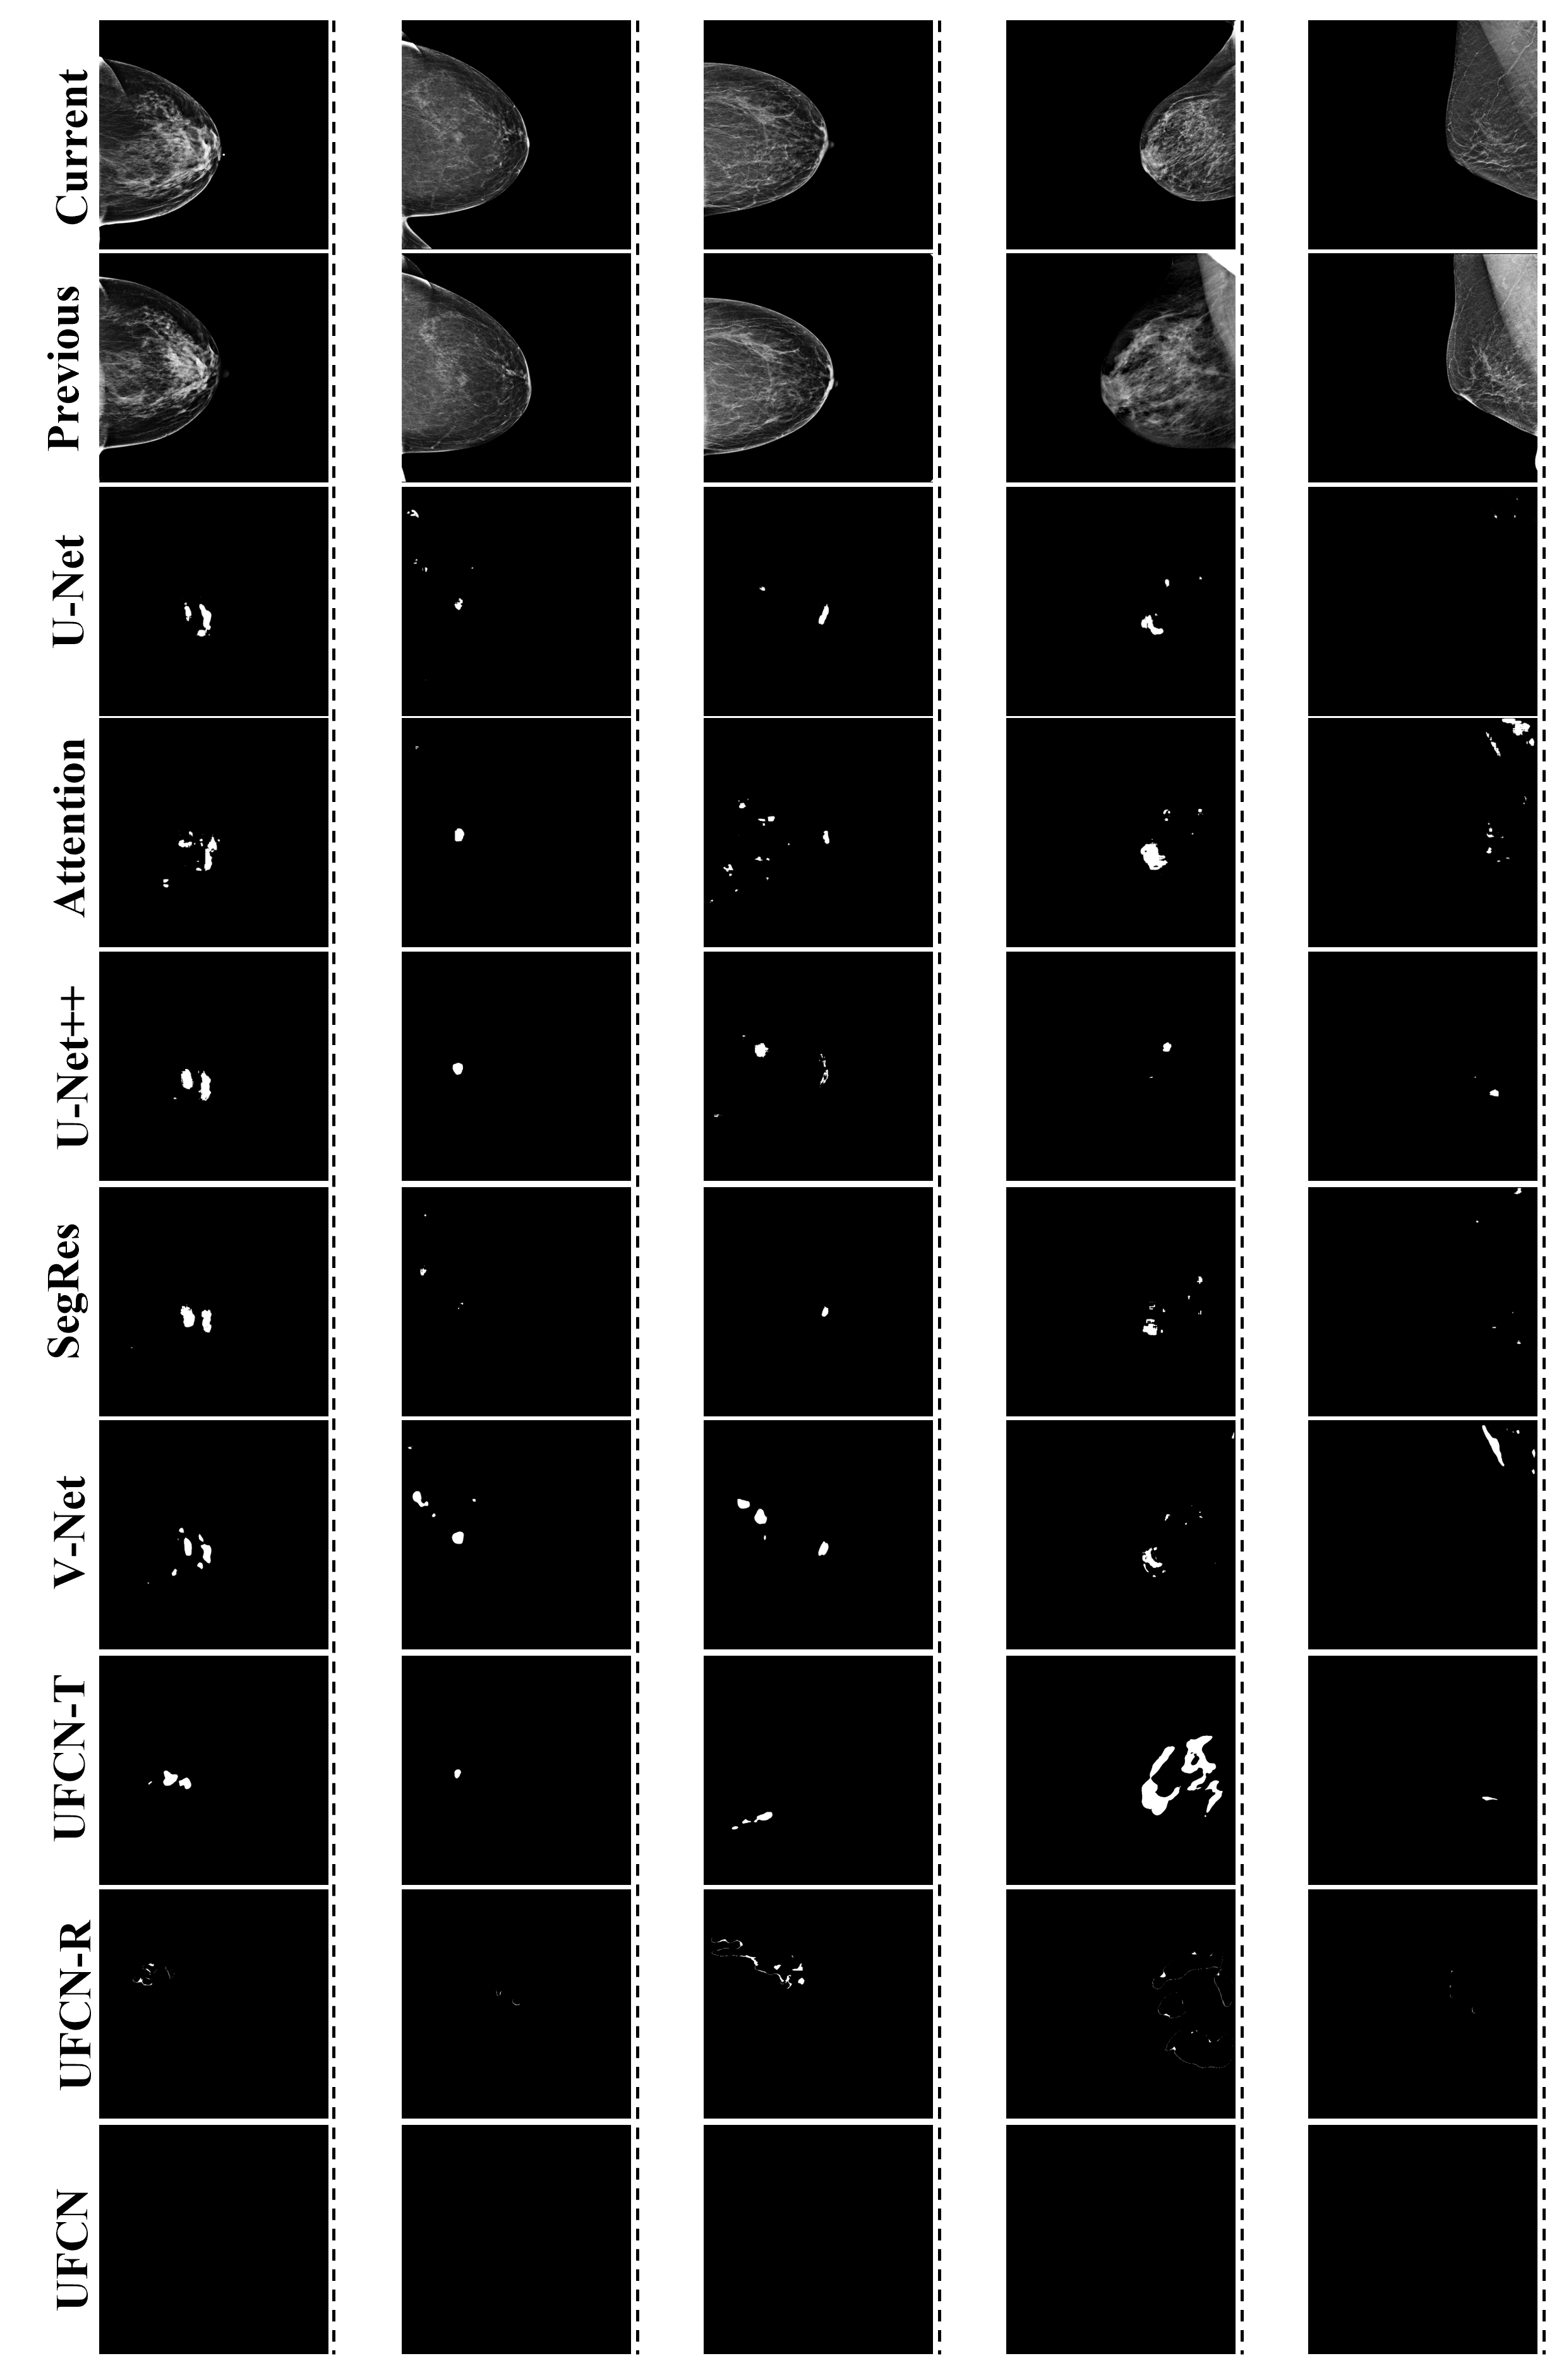
The Figure 6 illustrates the prediction of all the models when inputs are normal cases. All baseline models showed detected tissues, and the wrongly detected tissue locations are similar in all models. Although UFCN-R showed minor wrongly detected tissue areas compared with U-Net and UFCN-T, it still performed relatively well. However, the proposed model UFCN showed no detection of abnormal tissues in these normal cases, indicating its high accuracy in distinguishing between normal and abnormal cases.
In summary of our study, we demonstrate that by learning the differences between the current and prior images we can achieve unsupervised cancer area localization. Labeling in medical image studies is expensive and prone to errors, making unsupervised learning an ideal approach. Our results show that with prior images, the proposed model can achieve results as good as those of a supervised model. Additionally, the proposed model outperformed the supervised model in detecting complex tumors that the latter was unable to detect.
Overall, our study highlights the potential of unsupervised learning for medical image analysis, particularly for tasks such as cancer area localization. By leveraging longitudinal data and advanced machine learning techniques, we can reduce the need for costly and time-consuming manual labeling while still achieving high levels of accuracy and sensitivity in cancer detection. These findings have important implications for improving the efficiency and effectiveness of cancer screening and diagnosis, ultimately leading to better patient outcomes.
7 Conclusion
Breast cancer remains a leading cause of death for women worldwide. Early detection and accurate diagnosis of breast abnormalities are crucial for improving patient outcomes. However, traditional screening methods such as mammography have limitations in terms of accuracy and sensitivity, leading to missed or misdiagnosed cases. One of the main challenges in detecting cancer is the lack of large annotated datasets to train advanced segmentation models.
To address this issue, we developed a novel unsupervised feature correlation network to predict breast abnormal variation maps using 2D mammograms. Our proposed model takes advantage of the reconstruction process of the current year and prior year images to extract tissue from different areas without a need for ground truth. By analyzing the differences between the two images, our model can identify abnormal variations that may indicate the presence of cancer.
The model is embedded with a novel feature correlation module, an attention suppression gate, and a breast abnormality module, all of which work together to improve the accuracy of the prediction. The feature correlation module allows the model to identify patterns and relationships between different features, while the attention suppression gate helps to filter out irrelevant information. The breast abnormality module then uses this information to classify the input as normal or cancerous.
Notably, our proposed model not only provides breast abnormal variation maps but is also able to distinguish between normal and cancer inputs, making it more advanced compared to the state-of-the-art segmentation models. The state-of-the-art segmentation models need already classified cancer images, which requires applying a classification method first, then, using the segmentation method. The results of our study show that the proposed model outperforms or performs as well as the supervised state-of-the-art segmentation models not only in localizing abnormal regions but also in recognizing normal tissues.
Acknowledgments
This work is supported by a grant from the University of Connecticut Research Excellence Program, PIs: Nabavi and Yang. This work used the Bridges-2 system at the Pittsburgh Supercomputing Center (PSC) as part of the Extreme Science and Engineering Discovery Environment (XSEDE) which is supported by the National Science Foundation, under project number CIS220028, PI: Nabavi.
References
- Abbas [2016-12] Abbas, Q., 2016-12. DeepCAD: A computer-aided diagnosis system for mammographic masses using deep invariant features 5, 28. URL: https://www.mdpi.com/2073-431X/5/4/28, doi:10.3390/computers5040028. number: 4 Publisher: Multidisciplinary Digital Publishing Institute.
- Abdelhafiz et al. [2020] Abdelhafiz, D., Bi, J., Ammar, R., Yang, C., Nabavi, S., 2020. Convolutional neural network for automated mass segmentation in mammography. BMC bioinformatics 21, 1–19.
- Akselrod-Ballin et al. [2016] Akselrod-Ballin, A., Karlinsky, L., Alpert, S., Hasoul, S., Ben-Ari, R., Barkan, E., 2016. A region based convolutional network for tumor detection and classification in breast mammography, in: Deep Learning and Data Labeling for Medical Applications: First International Workshop, LABELS 2016, and Second International Workshop, DLMIA 2016, Held in Conjunction with MICCAI 2016, Athens, Greece, October 21, 2016, Proceedings 2, Springer. pp. 197–205.
- Al-masni et al. [2017] Al-masni, M.A., Al-antari, M.A., Park, J., Gi, G., Kim, T.Y., Rivera, P., Valarezo, E., Han, S.M., Kim, T.S., 2017. Detection and classification of the breast abnormalities in digital mammograms via regional convolutional neural network, in: 2017 39th annual international conference of the IEEE engineering in medicine and biology society (EMBC), IEEE. pp. 1230–1233.
- Baccouche et al. [2021] Baccouche, A., Garcia-Zapirain, B., Castillo Olea, C., Elmaghraby, A.S., 2021. Connected-unets: a deep learning architecture for breast mass segmentation. NPJ Breast Cancer 7, 151.
- Bai et al. [2022] Bai, J., Jin, A., Wang, T., Yang, C., Nabavi, S., 2022. Feature fusion siamese network for breast cancer detection comparing current and prior mammograms. Medical Physics 49, 3654–3669.
- Bai et al. [2021] Bai, J., Posner, R., Wang, T., Yang, C., Nabavi, S., 2021. Applying deep learning in digital breast tomosynthesis for automatic breast cancer detection: A review. Medical image analysis 71, 102049.
- Brown et al. [2021] Brown, S.T., Buitrago, P., Hanna, E., Sanielevici, S., Scibek, R., Nystrom, N.A., 2021. Bridges-2: a platform for rapidly-evolving and data intensive research, in: Practice and Experience in Advanced Research Computing, pp. 1–4.
- [9] Carneiro, N.D.G., Bradley, A.P., . Automated mass detection from mammograms using deep learning and random forest .
- Choukroun et al. [2017] Choukroun, Y., Bakalo, R., Ben-Ari, R., Akselrod-Ballin, A., Barkan, E., Kisilev, P., 2017. Mammogram classification and abnormality detection from nonlocal labels using deep multiple instance neural network., in: VCBM, pp. 11–19.
- Coleman [2017-05-01] Coleman, C., 2017-05-01. Early detection and screening for breast cancer. Seminars in Oncology Nursing 33, 141–155. URL: https://www.sciencedirect.com/science/article/pii/S0749208117300190, doi:10.1016/j.soncn.2017.02.009.
- Dhungel et al. [2015] Dhungel, N., Carneiro, G., Bradley, A.P., 2015. Deep learning and structured prediction for the segmentation of mass in mammograms, in: Medical Image Computing and Computer-Assisted Intervention–MICCAI 2015: 18th International Conference, Munich, Germany, October 5-9, 2015, Proceedings, Part I, Springer. pp. 605–612.
- Duffy et al. [2003-08] Duffy, S.W., Tabar, L., Vitak, B., Day, N.E., Smith, R.A., Chen, H.H.T., Yen, M.F.A., 2003-08. The relative contributions of screen-detected in situ and invasive breast carcinomas in reducing mortality from the disease. European Journal of Cancer (Oxford, England: 1990) 39, 1755–1760. doi:10.1016/s0959-8049(03)00259-4.
- Elfwing et al. [2018] Elfwing, S., Uchibe, E., Doya, K., 2018. Sigmoid-weighted linear units for neural network function approximation in reinforcement learning. Neural Networks 107, 3–11.
- Ertosun and Rubin [2015] Ertosun, M.G., Rubin, D.L., 2015. Probabilistic visual search for masses within mammography images using deep learning, in: 2015 IEEE International Conference on Bioinformatics and Biomedicine (BIBM), IEEE. pp. 1310–1315.
- Hang et al. [2017] Hang, W., Liu, Z., Hannun, A., 2017. GlimpseNet: Attentional methods for full-image mammogram diagnosis , 9.
- He et al. [2016] He, K., Zhang, X., Ren, S., Sun, J., 2016. Deep residual learning for image recognition, in: Proceedings of the IEEE conference on computer vision and pattern recognition, pp. 770–778.
- Huynh et al. [2016-07] Huynh, B.Q., Li, H., Giger, M.L., 2016-07. Digital mammographic tumor classification using transfer learning from deep convolutional neural networks 3. URL: https://www.ncbi.nlm.nih.gov/pmc/articles/PMC4992049/, doi:10.1117/1.JMI.3.3.034501.
- Huynh et al. [1998-10] Huynh, P.T., Jarolimek, A.M., Daye, S., 1998-10. The false-negative mammogram. Radiographics: A Review Publication of the Radiological Society of North America, Inc 18, 1137–1154; quiz 1243–1244. doi:10.1148/radiographics.18.5.9747612.
- Hwang and Kim [2016] Hwang, S., Kim, H.E., 2016. Self-transfer learning for fully weakly supervised object localization. arXiv preprint arXiv:1602.01625 .
- Kanezaki [2018] Kanezaki, A., 2018. Unsupervised image segmentation by backpropagation, in: 2018 IEEE international conference on acoustics, speech and signal processing (ICASSP), IEEE. pp. 1543–1547.
- Kim et al. [2020] Kim, W., Kanezaki, A., Tanaka, M., 2020. Unsupervised learning of image segmentation based on differentiable feature clustering. IEEE Transactions on Image Processing 29, 8055–8068.
- Kisilev et al. [2016] Kisilev, P., Sason, E., Barkan, E., Hashoul, S., 2016. Medical image description using multi-task-loss cnn, in: Deep Learning and Data Labeling for Medical Applications: First International Workshop, LABELS 2016, and Second International Workshop, DLMIA 2016, Held in Conjunction with MICCAI 2016, Athens, Greece, October 21, 2016, Proceedings 1, Springer. pp. 121–129.
- Kooi et al. [2017] Kooi, T., van Ginneken, B., Karssemeijer, N., den Heeten, A., 2017. Discriminating solitary cysts from soft tissue lesions in mammography using a pretrained deep convolutional neural network. Medical physics 44, 1017–1027.
- Kooi et al. [2016] Kooi, T., Gubern-Merida, A., Mordang, J.J., Mann, R., Pijnappel, R., Schuur, K., den Heeten, A., Karssemeijer, N., 2016. A comparison between a deep convolutional neural network and radiologists for classifying regions of interest in mammography, in: International Workshop on Breast Imaging, Springer. pp. 51–56.
- Kooi and Karssemeijer [2017-10] Kooi, T., Karssemeijer, N., 2017-10. Classifying symmetrical differences and temporal change for the detection of malignant masses in mammography using deep neural networks 4, 044501. URL: https://www.ncbi.nlm.nih.gov/pmc/articles/PMC5633751/, doi:10.1117/1.JMI.4.4.044501.
- Li et al. [2019] Li, S., Dong, M., Du, G., Mu, X., 2019. Attention dense-u-net for automatic breast mass segmentation in digital mammogram. IEEE Access 7, 59037–59047.
- Lo et al. [2002] Lo, S.C.B., Li, H., Wang, Y., Kinnard, L., Freedman, M.T., 2002. A multiple circular path convolution neural network system for detection of mammographic masses. IEEE transactions on medical imaging 21, 150–158.
- Long et al. [2015] Long, J., Shelhamer, E., Darrell, T., 2015. Fully convolutional networks for semantic segmentation, in: Proceedings of the IEEE conference on computer vision and pattern recognition, pp. 3431–3440.
- Lotter et al. [2017] Lotter, W., Sorensen, G., Cox, D., 2017. A multi-scale cnn and curriculum learning strategy for mammogram classification, in: Deep Learning in Medical Image Analysis and Multimodal Learning for Clinical Decision Support. Springer, pp. 169–177.
- Milletari et al. [2016] Milletari, F., Navab, N., Ahmadi, S.A., 2016. V-net: Fully convolutional neural networks for volumetric medical image segmentation, in: 2016 fourth international conference on 3D vision (3DV), Ieee. pp. 565–571.
- Murphy et al. [2007] Murphy, I.G., Dillon, M.F., Doherty, A.O., McDermott, E.W., Kelly, G., O’higgins, N., Hill, A.D., 2007. Analysis of patients with false negative mammography and symptomatic breast carcinoma. Journal of surgical oncology 96, 457–463.
- Myronenko [2019] Myronenko, A., 2019. 3d mri brain tumor segmentation using autoencoder regularization, in: Brainlesion: Glioma, Multiple Sclerosis, Stroke and Traumatic Brain Injuries: 4th International Workshop, BrainLes 2018, Held in Conjunction with MICCAI 2018, Granada, Spain, September 16, 2018, Revised Selected Papers, Part II 4, Springer. pp. 311–320.
- Nelson et al. [2016-02-16] Nelson, H.D., Pappas, M., Cantor, A., Griffin, J., Daeges, M., Humphrey, L., 2016-02-16. Harms of breast cancer screening: Systematic review to update the 2009 u.s. preventive services task force recommendation. Annals of Internal Medicine 164, 256–267. doi:10.7326/M15-0970.
- Oktay et al. [2018] Oktay, O., Schlemper, J., Folgoc, L.L., Lee, M., Heinrich, M., Misawa, K., Mori, K., McDonagh, S., Hammerla, N.Y., Kainz, B., et al., 2018. Attention u-net: Learning where to look for the pancreas. arXiv preprint arXiv:1804.03999 .
- Ong and Mandl [2015-04-01] Ong, M.S., Mandl, K.D., 2015-04-01. National expenditure for false-positive mammograms and breast cancer overdiagnoses estimated at $4 billion a year. Health Affairs 34, 576–583. URL: https://www.healthaffairs.org/doi/full/10.1377/hlthaff.2014.1087, doi:10.1377/hlthaff.2014.1087. publisher: Health Affairs.
- Park et al. [2023] Park, S., Lee, K.H., Ko, B., Kim, N., 2023. Unsupervised anomaly detection with generative adversarial networks in mammography. Scientific Reports 13, 2925.
- Perek et al. [2019] Perek, S., Ness, L., Amit, M., Barkan, E., Amit, G., 2019. Learning from longitudinal mammography studies, in: International Conference on Medical Image Computing and Computer-Assisted Intervention, Springer. pp. 712–720.
- Platania et al. [2017] Platania, R., Shams, S., Yang, S., Zhang, J., Lee, K., Park, S.J., 2017. Automated breast cancer diagnosis using deep learning and region of interest detection (bc-droid), in: Proceedings of the 8th ACM international conference on bioinformatics, computational biology, and health informatics, pp. 536–543.
- Ribli et al. [2018-03-15] Ribli, D., Horváth, A., Unger, Z., Pollner, P., Csabai, I., 2018-03-15. Detecting and classifying lesions in mammograms with deep learning 8, 1–7. URL: https://www.nature.com/articles/s41598-018-22437-z, doi:10.1038/s41598-018-22437-z. number: 1 Publisher: Nature Publishing Group.
- Sahiner et al. [1996-10] Sahiner, B., Chan, H.P., Petrick, N., Wei, D., Helvie, M., Adler, D., Goodsitt, M., 1996-10. Classification of mass and normal breast tissue: a convolution neural network classifier with spatial domain and texture images 15, 598–610. doi:10.1109/42.538937. conference Name: IEEE Transactions on Medical Imaging.
- Siddique et al. [2021] Siddique, N., Paheding, S., Elkin, C.P., Devabhaktuni, V., 2021. U-net and its variants for medical image segmentation: A review of theory and applications. Ieee Access 9, 82031–82057.
- Siegel et al. [2020] Siegel, R.L., Miller, K.D., Jemal, A., 2020. Cancer statistics, 2020 70, 7–30. URL: https://acsjournals.onlinelibrary.wiley.com/doi/abs/10.3322/caac.21590, doi:10.3322/caac.21590. _eprint: https://acsjournals.onlinelibrary.wiley.com/doi/pdf/10.3322/caac.21590.
- Smith et al. [2003] Smith, R.A., Saslow, D., Sawyer, K.A., Burke, W., Costanza, M.E., Evans, W.P., Foster, R.S., Hendrick, E., Eyre, H.J., Sener, S., 2003. American cancer society guidelines for breast cancer screening: Update 2003 53, 141–169. URL: https://acsjournals.onlinelibrary.wiley.com/doi/abs/10.3322/canjclin.53.3.141, doi:10.3322/canjclin.53.3.141. _eprint: https://acsjournals.onlinelibrary.wiley.com/doi/pdf/10.3322/canjclin.53.3.141.
- Sun et al. [2016] Sun, W., Tseng, T.L., Zheng, B., Qian, W., 2016. A preliminary study on breast cancer risk analysis using deep neural network, in: Breast Imaging: 13th International Workshop, IWDM 2016, Malmö, Sweden, June 19-22, 2016, Proceedings 13, Springer. pp. 385–391.
- Tabár et al. [2001-05-01] Tabár, L., Vitak, B., Chen, H.H., Yen, M.F., Duffy, S.W., Smith, R.A., 2001-05-01. Beyond randomized controlled trials: organized mammographic screening substantially reduces breast carcinoma mortality. Cancer 91, 1724–1731. doi:10.1002/1097-0142(20010501)91:9<1724::aid-cncr1190>3.0.co;2-v.
- Teare et al. [2017-08] Teare, P., Fishman, M., Benzaquen, O., Toledano, E., Elnekave, E., 2017-08. Malignancy detection on mammography using dual deep convolutional neural networks and genetically discovered false color input enhancement 30, 499. URL: https://www.ncbi.nlm.nih.gov/pmc/articles/PMC5537100/, doi:10.1007/s10278-017-9993-2. publisher: Springer.
- Van Voorst et al. [2022] Van Voorst, H., Konduri, P., van Poppel, L., van der Steen, W., van der Sluijs, P., Slot, E., Emmer, B., van Zwam, W., Roos, Y., Majoie, C., et al., 2022. Unsupervised deep learning for stroke lesion segmentation on follow-up ct based on generative adversarial networks. American Journal of Neuroradiology 43, 1107–1114.
- Wu et al. [2020-04] Wu, N., Phang, J., Park, J., Shen, Y., Huang, Z., Zorin, M., Jastrzębski, S., Févry, T., Katsnelson, J., Kim, E., Wolfson, S., Parikh, U., Gaddam, S., Lin, L.L.Y., Ho, K., Weinstein, J.D., Reig, B., Gao, Y., Toth, H., Pysarenko, K., Lewin, A., Lee, J., Airola, K., Mema, E., Chung, S., Hwang, E., Samreen, N., Kim, S.G., Heacock, L., Moy, L., Cho, K., Geras, K.J., 2020-04. Deep neural networks improve radiologists’ performance in breast cancer screening. IEEE transactions on medical imaging 39, 1184–1194. URL: https://www.ncbi.nlm.nih.gov/pmc/articles/PMC7427471/, doi:10.1109/TMI.2019.2945514.
- Zhao et al. [2016] Zhao, H., Gallo, O., Frosio, I., Kautz, J., 2016. Loss functions for image restoration with neural networks. IEEE Transactions on computational imaging 3, 47–57.
- Zhou et al. [2021-05] Zhou, S.K., Greenspan, H., Davatzikos, C., Duncan, J.S., Van Ginneken, B., Madabhushi, A., Prince, J.L., Rueckert, D., Summers, R.M., 2021-05. A review of deep learning in medical imaging: Imaging traits, technology trends, case studies with progress highlights, and future promises 109, 820–838. doi:10.1109/JPROC.2021.3054390. conference Name: Proceedings of the IEEE.
- Zhou et al. [2018] Zhou, Z., Rahman Siddiquee, M.M., Tajbakhsh, N., Liang, J., 2018. Unet++: A nested u-net architecture for medical image segmentation, in: Deep Learning in Medical Image Analysis and Multimodal Learning for Clinical Decision Support: 4th International Workshop, DLMIA 2018, and 8th International Workshop, ML-CDS 2018, Held in Conjunction with MICCAI 2018, Granada, Spain, September 20, 2018, Proceedings 4, Springer. pp. 3–11.
- Zhu and Xie [2016] Zhu, W., Xie, X., 2016. Adversarial deep structural networks for mammographic mass segmentation. Biorxiv , 095786.