360 Layout Estimation via Orthogonal Planes Disentanglement and Multi-view Geometric Consistency Perception
Abstract
Existing panoramic layout estimation solutions tend to recover room boundaries from a vertically compressed sequence, yielding imprecise results as the compression process often muddles the semantics between various planes. Besides, these data-driven approaches impose an urgent demand for massive data annotations, which are laborious and time-consuming. For the first problem, we propose an orthogonal plane disentanglement network (termed DOPNet) to distinguish ambiguous semantics. DOPNet consists of three modules that are integrated to deliver distortion-free, semantics-clean, and detail-sharp disentangled representations, which benefit the subsequent layout recovery. For the second problem, we present an unsupervised adaptation technique tailored for horizon-depth and ratio representations. Concretely, we introduce an optimization strategy for decision-level layout analysis and a 1D cost volume construction method for feature-level multi-view aggregation, both of which are designed to fully exploit the geometric consistency across multiple perspectives. The optimizer provides a reliable set of pseudo-labels for network training, while the 1D cost volume enriches each view with comprehensive scene information derived from other perspectives. Extensive experiments demonstrate that our solution outperforms other SoTA models on both monocular layout estimation and multi-view layout estimation tasks.
Index Terms:
360 vision, Manhattan world assumption, horizontal depth, layout estimation.1 Introduction
Indoor panoramic layout estimation refers to reconstructing 3D room layouts from omnidirectional images. Since the panoramic vision system captures the whole-room contextual information, we can estimate the complete room layout with a single panoramic image. However, the 360 field-of-view (FoV) inherent to panoramas introduces significant distortions that intensify with latitude, producing adverse effects on the perception of layout structures. Furthermore, current room-layout models are predicated on the Manhattan world assumption and trained in a supervised manner. For complex situations like non-cuboid rooms, these models might encounter undesired challenges, especially in the absence of annotations. In view of this, we revisit this field from two perspectives: developing an explainable fundamental model and constructing an unsupervised adaption strategy with multi-view geometric consistency.
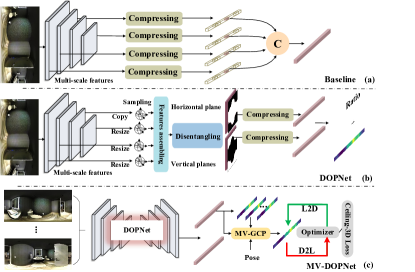
Previous approaches [1, 2, 3, 4, 5] prefer to estimate the layouts from a 1D sequence. They advocate compressing the extracted 2D feature maps in the height dimension to obtain a 1D sequence, of which every element shares the same distortion magnitude (Fig. 1a). However, such a compressed representation does not eliminate panoramic distortions; instead, it merely distributes the distortion uniformly. Moreover, it roughly mixes the vertical and horizontal planes together, confusing the semantics of different planes that are crucial for layout estimation.
To address the above problems, we propose a novel architecture (Fig.1b) that disentangles the orthogonal planes to obtain distortion-free, semantics-clean, and detail-sharp horizon-depth/ratio representations. We termed the proposed architecture DOPNet, which comprises three modules to disentangle the inherent 1D representation step-by-step. Firstly, we propose a distortion-aware feature aggregation module to assemble cross-scale features without distortion. Secondly, we propose to pre-segment the vertical plane (i.e., walls) and horizontal planes (i.e., floors and ceilings) from the whole-room contextual information to incorporate 3D geometric cue to the layout model. Given the weak symmetry properties in general layout rooms, a soft-flipping fusion strategy with learnable offsets is designed to facilitate this process. The segmented orthogonal planes are then compressed into two 1D sequences. Considering the potential inaccuracy of pre-segmentation, in the third step, we present a sequence reconstruction module to carry out intra- and inter-sequence interaction. The horizon-depth and ratio are then separately regressed from the vertical and horizontal sequences to avoid mutual interference.
On the other hand, we devise an unsupervised adaptation strategy for multi-view room layout without annotations, introducing both a horizon-depth optimizer and a multi-view perception module (Fig.1c, termed MV-DOPNet). The proposed optimizer, to our knowledge, stands as a pioneering step for horizon-depth representation in the field. It addresses depth scale inconsistencies that are common in single-view models by shifting the optimization objective from depth to 2D layout boundaries. However, optimization horizon-depth alone brings a mismatch with the unoptimized ratio. To this end, we introduce a ceiling-3D loss function, which implicitly constrains the ratio via ceiling-depth (converted from horizon-depth), ensuring that the optimization process also benefits the ratio representation. Furthermore, we develop a multi-view geometric consistency perceptron module. It employs a coarse horizon-depth sequence combined with differentiable polar coordinate warping to map different features from other views into a unified reference view to construct a 1D cost volume. It explicitly integrates multi-view layout geometry into the model, as well as ensures a more comprehensive and accurate representation.
In this enhanced version of our previous work[6], we explore unsupervised multi-view layout estimation. We introduce a novel optimization approach and a 1D cost volume construction method for horizon-depth/ratio layout representation. Our focus is on leveraging multi-view geometric consistency at both decision and feature levels.
Finally, we conduct extensive experiments on four popular datasets — MatterportLayout [7], Zind [8], Stanford 2D-3D [9], and PanoContext [10] to demonstrate the effectiveness of DOPNet. Both qualitative and quantitative results show that the proposed solution outperforms other SoTA methods. Furthermore, experimental results on the MVL challenge dataset111https://github.com/mvlchallenge/mvl_toolkit demonstrate our solution significantly outperforms the SoTA methods. Our contributions can be summarized as follows:
-
•
We propose to disentangle ambiguous semantics to obtain spotless (distortion-free, semantics-clean, and detail-sharp) horizon-depth/ratio representations, which benefit the subsequent layout recovery.
-
•
We incorporate two mutual transformative functions to a horizon-depth optimization strategy, complemented by a ceiling-3D loss to share the optimization gains and enhance network fine-tuning.
-
•
We develop a multi-view perception to enhance latent features of the reference view with feature-level geometric consistency, digging into multi-view layout geometry represented by a 1D cost volume.
-
•
On popular benchmarks, our solution outperforms other SoTA schemes on both monocular layout estimation and multi-view layout estimation tasks.
2 Related Work
2.1 Supervised 360 Room Layout Estimation
Based on Manhattan World assumption [11] that all walls and floors are aligned with global coordinate system axes and are perpendicular to each other, many approaches utilize convolutional neural networks (CNNs) to extract useful features to improve layout estimation accuracy. Specifically, Zou [12] propose LayoutNet to predict the corner/boundary probability maps directly from the panoramas and then optimize the layout parameter to generate the final predicted results. Furthermore, they annotate the Stanford 2D-3D dataset [9] with awesome layouts for training and evaluation. Yang [13] propose Dula-Net to predict a 2D floor plane semantic mask from both the equirectangular view and the perspective view of the ceilings. The modified version, LayoutNet v2, and Dula-Net v2, which have better performance than the original version, are presented by Zou [7]. Fernandez [14] present to utilize equirectangular convolutions (EquiConvs) to generate corner/edge probability maps. Sun propose HorizonNet [1] and HoHoNet [2] to simplify the layout estimation processes by representing the room layout with a 1D representation. Besides, they use Bi-LSTM and multi-head self-attention to build long-range dependencies and refine the 1D sequences.
Recently, several approaches have adopted this 1D representation and achieved impressive performance. For example, Rao [15] establish their network based on HorizonNet [1]. They replace standard convolution operation with spherical convolution to reduce distortions and take Bi-GRU to reduce computational complexity. Wang [5] combine the geometric cues across the layout and propose LED2-Net that reformulates the room layout estimation as predicting the depth of walls in the horizontal direction. Not constrained to Manhattan scenes, Pintore [4] introduce AtlantaNet to predict the room layout by combining two projections of the floor and ceiling planes. Driven by the self-attention mechanism, many transformer-based methods [16, 17, 18] proposed to build long-range dependencies. For example, Jiang [3] represent the room layout by horizon depth and room height and introduce a Transformer to enforce the network to learn the geometric relationships. However, the popular 1D representations could confuse the semantics of different planes, thus causing the layout estimation challenging. We disentangle this 1D representation by pre-segmenting orthogonal planes.
2.2 Unsupervised 360 Room Layout Estimation
In response to the data without annotations, most researchers devote themselves to developing unsupervised approaches. The current unsupervised approaches to layout estimation are developed using self-training techniques. The SSLayout360[19] innovatively applies the traditional self-training technique, typically utilized for classification or object detection, to geometric prediction tasks like layout estimation. Specifically, this approach employs a pre-trained Mean Teacher [20] model to generate pseudo-labels for unlabeled data. These pseudo-labels are subsequently incorporated into the training of existing layout estimation models. Since this method emphasizes monocular unsupervised layout estimation, it neglects the geometric constraints that exist between different views within a single room. In contrast, 360-MLC [21] advocates for leveraging geometric consistency among multi-views within the same room to generate more accurate pseudo-labels. In the 360-MLC approach, sequences of registered panoramas without annotations are input into a pre-trained layout estimation model to produce the corresponding layout boundaries. These boundaries are then projected onto a unified world coordinate system for alignment and subsequent optimization. Subsequently, the optimized boundaries are back-projected to their respective views and used as pseudo-labels. However, a notable constraint of the 360-MLC model is its emphasis on layout boundaries, in contrast to contemporary state-of-the-art models which primarily derive layouts through the prediction of horizontal depth and room height. In this paper, we investigate a robust methodology compatible with these advanced models.
2.3 360 Image Distortion Mitigation
When converting spherical data to the equirectangular projection format, severe distortions are introduced. Some recent studies [22, 23, 24] focus on designing spherical customized convolutions to make the network adapt to panoramic distortions and offer superior results compared to standard convolutional networks. Su [25] introduce SphConv to remove distortions by changing the regular planar convolutions kernel size towards each row of the 360 images. Cohen [26] propose a spherical CNN that transforms the domain space from Euclidean S2 space to a SO(3) group to reduce the distortion and encodes full rotation invariance in their network. Coors [27] addresses it by defining the convolution kernels on the tangent plane and keeping the convolution domain consistent in each kernel. Therefore, the non-distorted features can be extracted directly on 360 images. Rao [15] first applied spherical convolution operation to room layout task and showed significant improvements. Different from the above approaches, Shen [28] propose the first panorama Transformer (PanoFormer) and divide the patches on the tangent plane to remove the negative effect of distortions. However, many of the latest studies in layout estimation tend to overlook distortions, operating under the assumption that 1D representations effectively address these issues. On the contrary, we propose a feature assembling mechanism with cross-scale distortion awareness to deal with distortions. Extensive experimental results demonstrate the necessity of handling distortions before generating 1D representations.
3 Approach
3.1 Overview
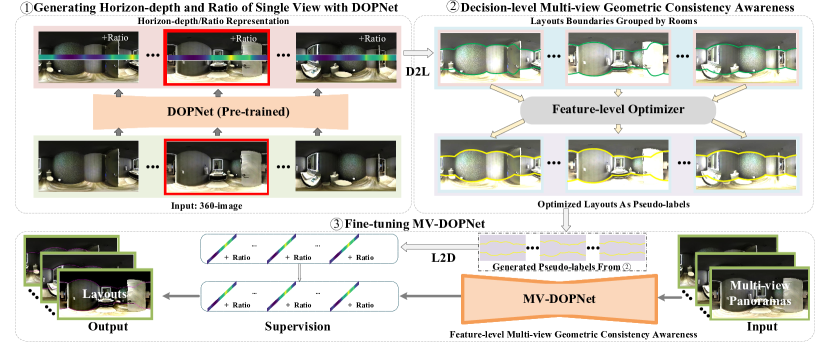
As illustrated in Fig. 2, our proposed framework is tailored for unlabeled data from general room environments. This framework includes generating pseudo-labels, optimizing, and model fine-tuning techniques. We outline the sequential steps to the framework’s design as follows.
Generating Horizon-Depth and Ratio of Single View with DOPNet. First, we introduce DOPNet to generate clear horizon-depth and ratio layout representations. DOPNet is pre-trained on existing labeled datasets (MatterportLayout [7]). When provided with a single panoramic input, the network produces both the horizon-depth sequences and the corresponding ratios related to the layout.
Multi-view Geometric Consistency Awareness. These horizon-depth sequences are grouped by rooms and undergo refinement using Algorithm 1 to create pseudo-labels for fine-tuning. Additionally, during the fine-tuning period, we present MV-DOPNet, enabling feature-level multi-view insights of layout models.
Fine-tuning with Pseudo-labels. The optimized pseudo-labels are employed to fine-tune the proposed multi-view layout model (MV-DOPNet). Our model, upon receiving multi-view panoramas as input, generates the horizon-depth and ratio for each view, which are then utilized to recover the corresponding room layouts. With our customized constraints, this fine-tuning process taps into a broader data spectrum, enhancing MV-DOPNet’s inference and generalization capabilities.
3.2 Disentangle Orthogonal Planes
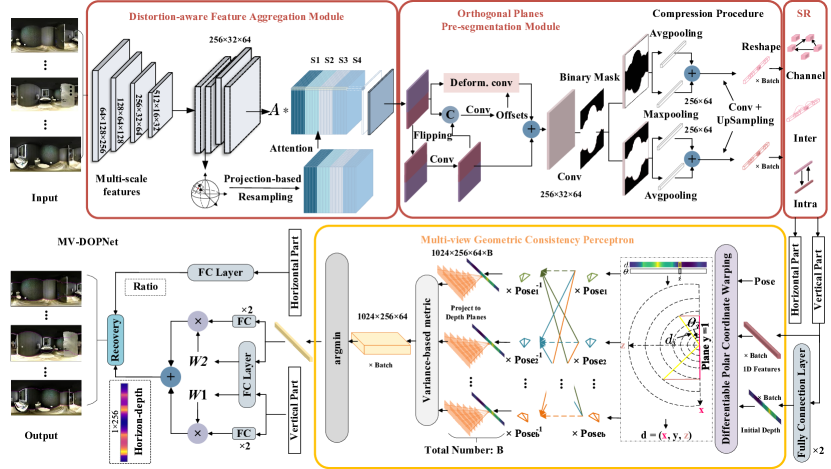
We first briefly review the details of DOPNet [6]. As illustrated in Fig. 3 (circled in red), the proposed framework consists of three stages. Specifically, we adopt a backbone (basically ResNet) to extract a series of features at 4 different scales from a single panorama. Then a distortion-aware feature aggregation module is designed to fuse the multi-scale features and free them from panoramic distortions. In the next stage, we introduce a soft-flipping fusion strategy to explore the weak symmetry properties between the floor boundary and the ceiling boundary. Subsequently, we segment the vertical and horizontal planes from the fused features followed by vertical compression, yielding two 1D sequences. In the last stage, the segmented features are reconstructed to be more discriminative and informative. Finally, the horizon-depth map and ratio value are regressed from the precise 1D representations.
Distortion-aware Feature Aggregation Module. In previous works [1, 2, 5, 3], researchers prefer to follow the architecture of HorizonNet [1] to extract multi-scale feature maps of an equirectangular image. These feature maps are merged together via vertical compression and concatenation [29]. However, the popular architecture just concatenates multi-scale features and neglects the inherent distortion distribution, resulting in an inferior panoramic feature extraction capability. To address the above issues, we propose a novel distortion-aware feature aggregation module to deal with distortions, as well as ingeniously integrate shallow and deep features.
Motivated by [14, 28], we first polymerize the most relevant features via a virtual tangent plane on the panoramic sphere projection. Based on the projection formula [28, 30, 31], we can get the distortion-free sampling positions in the 2D feature maps. Then we employ the learnable offsets to adjust the sampling locations adaptively and obtain gathered features from the distorted features. Then we select the scale as the reference scale and resize other feature maps to this scale. Specifically, we utilize the learnable sampling positions to gather the distortion-free feature maps for every feature with resized scales.
Orthogonal Planes Pre-segmentation Module. To explicitly capture the geometric cues, we propose to segment the vertical and horizontal planes from the whole scenario before compressing the 2D feature maps. Specifically, we pre-segment the horizon/vertical planes in advance to capture an explicit geometric cue in 3D space and encourage the network to learn a binary mask via a simple segmentation head. Following previous works [2, 1], we further vertically compress 2D feature maps to two 1D sequences with different plane semantics.
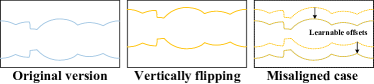
Besides, we observe that it is challenging to learn accurate layout boundaries in a complex scene due to the disturbance of furniture and illumination, e.g., occlusion. To address it, we propose to leverage the symmetry property of indoor rooms (e.g., the floor boundary and ceiling boundary are mostly symmetric in 3D space) to provide complementary information. We introduce a soft-flipping fusion strategy to exploit this symmetry property. We first vertically flip the feature map to get their symmetrical version. In fact, the floor boundary and ceiling boundary are not strictly symmetric in a general room scene. To this end, we adopt a deformable convolution with 3×3 kernel size to adaptively adjust the symmetrical version. Next, we fuse the original feature and its “soft” symmetrical version to provide more informative boundary cues.
Sequences Reconstruction Module. Previous segmentation and compression operations disrupt inherent dependencies in 2D features. To this end, we advocate generating discriminative channels, establishing solid long-range dependencies, and enhancing helpful residuals. Li [32] find that there are generally unconfined dependencies among channels, resulting in confused semantic cues. To this end, we employ graph convolution to enforce each channel to concentrate on distinguishing features. Different from normal pixel-wise [33] or object-wise [34] graphs, the introduced channel-wise one tends to guide the node to subtract the information from the neighbor nodes rather than aggregation.
Moreover, we employ the standard self-attention to reconstruct the intra-sequence long-range dependencies. It captures global interactions to adapt to the large FoV of panoramas, contributing to better performance. To compensate for inevitable errors in pre-segmentation, we introduce cross-attention to provide the missing useful residuals. Then we add the learned residuals with the two 1D sequences to implement the reconstruction. After that, two separate fully connected layers are employed to output the predicted horizon depth from the vertical plane sequence and the ratio value from the horizontal plane one, respectively.
3.3 Multi-view Geometric Consistency Awareness
The strategies proposed in this section are specifically tailored for multi-view scenarios. They aim to harness the full potential of geometric consistency across different views, thereby enhancing the precision of layout estimation tasks.
3.3.1 Decision-level Optimization
Horizon-depth Optimization. Our approach utilizes the advanced horizon-depth and ratio representation. However, the single-view layout model (DOPNet) produces horizon-depth sequences that represent depth on a relative scale, which presents challenges in aligning depths across different views. To this end, we propose to project these depth values onto a canvas, thereby shifting the optimization object from 3D space into 2D space. Specifically, we introduce the Depth-to-Layout (D2L) conversion, the reverse of the Layout-to-Depth (L2D) conversion [5], ensuring the method’s compatibility within the advanced layout estimation framework. Following refinement, we employ the L2D transformation to maintain the consistency of the model’s original representation schema. This entire cycle is described in Algorithm 1. Notably, we incorporate the calculation of standard deviations among multi-view horizon-depth maps to formulate the loss function.
Input: Registered horizon-depth sequences within a room and the corresponding camera pose relative to the world coordinates
Output: Optimized pseudo-labels , standard deviation
Ceiling-3D Constraint for Ratio. The layout model’s output implies a correlation wherein the horizon-depth is related to the ceiling-depth . Upon transforming the depth readings into 3D cartesian coordinates, we ascertain the spatial 3D points designated as and . These coordinates sustain a definable relationship, expressed by the following expression:
| (2) |
where ; indicates the predicted ratio value. Consequently, we formulate constraints on the ceiling depth rather than imposing direct constraints on the ratio. This improvement facilitates a more direct control over the model’s geometric fidelity, thereby refining the overall accuracy of the layout estimation.
3.3.2 Feature-level Perception
We introduce a multi-view geometric consistency perceptron, depicted in Fig. 3 (highlighted in Orange), designed to integrate multi-view insights at the feature level by constructing 1D cost volumes.
Differentiable Polar Coordinate Warping. Given the width of the sequence , we first calculate the longitude values :
| (4) |
With the coarse horizon-depth generated, we apply a differentiable polar coordinate warping method to obtain its 3D coordinates in the cartesian coordinate system:
| (5) |
where all the operations are element-wise. Afterward, we align the 3D points of other views to the reference view by employing the relative camera poses:
| (7) |
where indicates the matrix of the relative camera pose between the current view and the target view.
Depth Plane Sampling. Given 64 depth planes which are defined linearly across the normalized depth range [0, 1], yielding intervals 1/64, masks are created for each depth plane by checking if the z-coordinate of the aligned points lies within the depth plane. For each view, we apply the mask to the expanded features to get the volumes:
| (9) |
where represents the element-wise product. Eventually, for each reference view, we can get all the volumes .
1D Cost Volumes. Similar to [35], we employ the variance-based metric to aggregate to one 1D cost volume . The process can be written as follows:
| (11) |
where , and is the average volume among all features volumes. We finally apply the argmin operation among the depth planes to get a precise 1D feature:
| (13) |
where . Then we employ a fully connected layer to get a depth sequence from . Finally, we fuse the two depths to ensure an optimized depth representation. The final depth can be expressed as:
| (15) |
where represents the depth obtained from the cost volume; and are the weights determined by the fully connected layers.
3.4 Loss Function
3.4.1 Objective Function for Pre-training
Our objective function consists of two parts: one for room layout estimation and the other for plane segmentation. For the first part, we strictly follow [3] and denote it as . For the segmentation part, we apply binary cross-entropy loss as follows:
| (17) |
where is the ground truth of the generated segmentation label, and is the predicted value. Ultimately, we formulate the objective function as follows:
| (19) |
where is set to 0.75 to balance different constraints.
3.4.2 Objective Function for Fine-tuning
The fine-tuning phase of our model employs a loss function comprised of four distinct elements: normals, gradients of normals, horizon-depth, and ratio. Firstly, we employ which is calculated in Algorithm 1 as weights to design the losses:
| (20) | ||||
| (21) |
where the operations are element-wise. Then we carefully follow the methodology outlined in [3] for the first three components, symbolized by , , and . The subsequent ratio loss (ceiling-3D loss) is as follows,
| (22) |
where indicates the ceiling-depth converted from the pseudo-label, and is the one converted from the predicted horizon-depth. Combining all these components, the cumulative objective function is given by:
| (23) |
In our implementation, we empirically set to 0.1, to 0.9, and to 0.08 to ensure a harmonious balance between various constraints.
4 Experiments
In this section, we validate the effectiveness of our solution and compare it with existing SoTA approaches on five popular datasets. Concretely, we conduct experiments on a single GTX 3090 GPU, and the batch size is set to 16 for training. The proposed approach is implemented with PyTorch. We choose Adam [36] as the optimizer and keep the default settings. The initialized learning rate is . As in previous works [1, 3], we adopt standard left-right flipping, panoramic horizontal rotation, luminance change, and pano stretch for data augmentation during training. Furthermore, we compare our framework against the SoTA baseline method, 360-MLC. To ensure an equitable assessment, we retain the same parameters and settings.
4.1 Datasets
Monocular Layout Estimation Datasets. Four datasets are used for our experimental validation: Stanford 2D-3D [9], PanoContext [10], MatterportLayout [7] and ZInd [8].
PanoContext [10] and Stanford 2D-3D [9] are two commonly used datasets for indoor panoramic room layout estimation that contain 514 and 552 cuboid room layouts, respectively. Especially, Stanford 2D-3D [9] is labeled by Zou [12] and has a smaller vertical FoV than other datasets. Besides, MatterportLayout [7] is also annotated by Zou [7], which contains 2,295 general room layouts. The final ZInd [8] dataset includes cuboid, general Manhattan, non-Manhattan, and non-flat ceilings layouts, which better mimic the real-world data distribution. The split of ZInd [8] consists of 24,882 (for training), 3,080 (for validation), and 3,170 (for testing) panoramas. We strictly follow the same training/validation/test splits of the four datasets as in previous works [3] for a fair comparison.
Multi-view Layout Estimation Datasets. To validate the efficiency of our proposed framework, MV-DOPNet, we introduce a dataset specifically tailored for the Multi-View Layout Challenge. This challenge dataset is divided into two subsets: MP3D-FPE and HM3D-MVL. MP3D-FPE originates from the Matterport3D [37] dataset and is amassed using the MINOS [38] simulator. It contains 50 diverse scenes, aggregating 687 rooms in all. Conversely, HM3D-MVL is a recently curated dataset derived from HM3D [39], utilizing the Habitat [40] simulator. Echoing the methodology in MP3D-FPE, for HM3D-MVL, the organizer replicated user scanning patterns to encapsulate more genuine camera movement dynamics. For a fair comparison, we employ the training splits from the challenge phase for model training and leverage the pilot splits to evaluate the performance. Notably, since the test splits of the MVL dataset from the challenge phase are not publicly released, we do not use them.
4.2 Evaluation Metrics
We employ the commonly used standard evaluation metrics for a fair comparison, including corner error (CE), pixel error (PE), intersection over the union of floor shapes (2DIoU), and 3D room layouts (3DIoU). Among them, 3DIoU yields a better reflection of the accuracy of the layout estimation in 3D space. RMSE and indicate the performance of depth estimation, e.g. the horizon-depth map.
| Method | 3DIoU(%) | CE(%) | PE(%) |
|---|---|---|---|
| Train on PanoContext + Whole Stnfd.2D3D datasets | |||
| LayoutNetv2[7] | 85.02 | 0.63 | 1.79 |
| Dula-Netv2[7] | 83.77 | 0.81 | 2.43 |
| HorizonNet[1] | 82.63 | 0.74 | 2.17 |
| LGT-Net[3] | 85.16 | - | - |
| LGT-Net [w/ Post-proc][3] | 84.94 | 0.69 | 2.07 |
| Ours | 85.46 | - | - |
| Ours [w/ Post-proc] | 85.00 | 0.69 | 2.13 |
| Train on Stnfd.2D3D + Whole PanoContext datasets | |||
| LayoutNetv2[7] | 82.66 | 0.83 | 2.59 |
| Dula-Netv2[7] | 86.60 | 0.67 | 2.48 |
| HorizonNet[1] | 82.72 | 0.69 | 2.27 |
| AtlantaNet[4] | 83.94 | 0.71 | 2.18 |
| LGT-Net[3] | 85.76 | - | - |
| LGT-Net [w/ Post-proc][3] | 86.03 | 0.63 | 2.11 |
| Ours | 85.47 | - | - |
| Ours [w/ Post-proc] | 85.58 | 0.66 | 2.10 |
4.3 Cuboid Room Results
We follow LGT-Net [3] to use the combined dataset scheme mentioned in Zou [7] to evaluate our network on cuboid datasets. We denote the combined dataset that contains training splits of PanoContext [8] and whole Stanford 2D-3D datasets as “Train on PanoContext + Whole Stnfd.2D3D datasets” in Tab. I. Similarly, “Train on Stnfd.2D3D + Whole PanoContext” in Tab. I represents that we train our network on the combined dataset that contains training splits of Stanford 2D-3D and the whole PanoContext dataset. The scheme is commonly used in previous works [12, 3]. We also report the results with a post-processing strategy in DuLa-Net [13] that is denoted as ”Ours [w/ Post-proc]”.
Comparison Results. We exhibit the quantitative comparison results on cuboid room layouts in Tab. I. From the first group in Tab. I, we can observe that our approach outperforms all the other SoTA schemes with respect to 3DIoU. But from the second group, Dula-Net v2 [7] offers better 3DIoU than ours. Dula-Net v2 [7] employs a perspective view (i.e., cubemap) that is more effective for panoramas with small vertical FoV. However, once applied to more general room layout datasets (MatterportLayout[7] dataset), its performance degrades significantly. On the contrary, the proposed approach shows more general performance.
| Method | 2DIoU(%) | 3DIoU(%) | RMSE | |
| MatterportLayout datasets | ||||
| LayoutNetv2[7] | 78.73 | 75.82 | 0.258 | 0.871 |
| Dula-Netv2[7] | 78.82 | 75.05 | 0.291 | 0.818 |
| HorizonNet[1] | 81.71 | 79.11 | 0.197 | 0.929 |
| AtlantaNet[4] | 82.09 | 80.02 | - | - |
| HoHoNet[2] | 82.32 | 79.88 | - | - |
| LED2-Net[5] | 82.61 | 80.14 | 0.207 | 0.947 |
| DMH-Net [41] | 81.25 | 78.97 | - | 0.925 |
| LGT-Net[3] | 83.52 | 81.11 | 0.204 | 0.951 |
| Ours | 84.11 | 81.70 | 0.197 | 0.950 |
| ZInD datasets | ||||
| HorizonNet[1] | 90.44 | 88.59 | 0.123 | 0.957 |
| LED2-Net[5] | 90.36 | 88.49 | 0.124 | 0.955 |
| LGT-Net[3] | 91.77 | 89.95 | 0.111 | 0.960 |
| Ours | 91.94 | 90.13 | 0.109 | 0.960 |
4.4 General Room Results
MatterportLayout [7] dataset and ZInD [8] dataset provide more general indoor room layouts, which is much more challenging than the cuboid room layout datasets. Tab. II exhibits the evaluation on MatterportLayout [7]/ZInD [8] datasets. The results of LED2-Net [5] and HorizonNet [1] are from [3] that we strictly followed. Particularly, Jiang utilize their official code to re-train and re-evaluate with the standard evaluation metrics.
Comparison Results. We observe that Dula-Net [13] demonstrates much worse performance on the MatterportLayout[7] dataset, indicating that these perspective view-based methods are hard to adapt to the general indoor scenarios. Moreover, these 1D sequence-based methods are better than those 2D convolution-based schemes. However, they cannot produce accurate 3D layouts from a 1D sequence due to confused plane semantics, even if they introduce more powerful relationship builders (e.g., Bi-LSTM, Transformer). Hence, these methods give worse 3DIoU. Compared with them, our approach offers better performance than all other approaches with respect to 3DIoU because ours captures an explicit 3D geometric cue by disentangling orthogonal planes, which benefits recovering layouts from clear semantics (evidenced by Fig. 8).
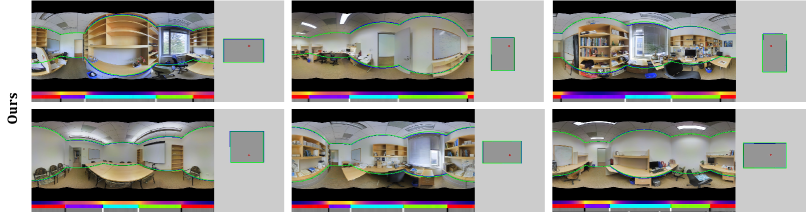
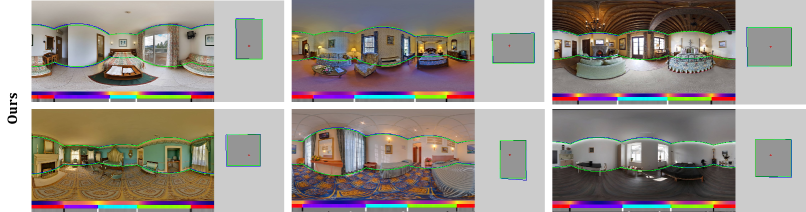
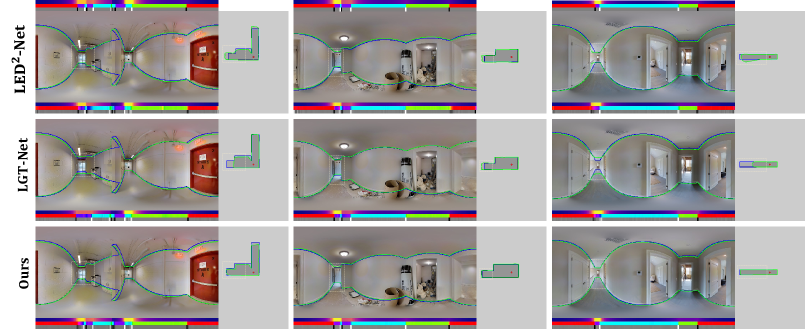
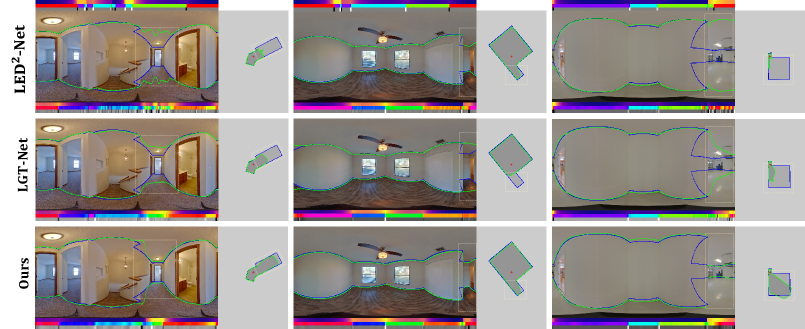
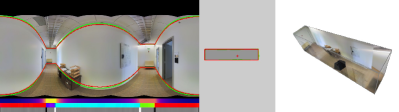
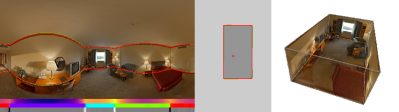
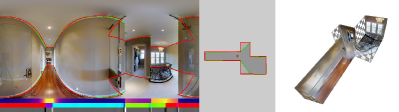
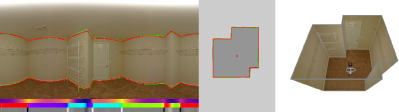
We show the qualitative comparisons in Fig. 5/6. From the figures, we can observe that our method offers better 3D results (floor plan). In Fig. 7, our results are very similar to the post-processing version. Both indicate our proposal that disentangling orthogonal planes to capture an explicit 3D geometric cue is an effective strategy.
| Method | 2DIoU(%) | 3DIoU(%) |
|---|---|---|
| HorizonNet (mp3d) | 78.53 | 73.93 |
| DOPNet (mp3d) | 80.71 | 75.13 |
| 360-MLC | 79.95 | 76.47 |
| 360-MLC-Iter | 80.87 | 77.39 |
| Ours | 83.59 | 79.42 |
4.5 MVL Results
Diverging from most conventional layout datasets like MatterportLayout [7] and Zillow [8], the dataset employed to evaluate the proposed framework stands out with its expansive rooms, augmented count of rooms within each scene, and a pronounced inclusion of non-Manhattan spaces. These intricacies emphasize a novel spectrum of challenges for room layout estimation, particularly in the absence of labeled data. In this section, we compare the current SoTA methods’ performance in facing these dilemmas. All the models are trained on challenge phase training splits and evaluated on the warm-up phase pilot splits.
The comparative results are presented in Table III. In the table, both ”HorizonNet (mp3d)” and ”DOPNet (mp3d)” signify evaluations solely based on models pre-trained with the MatterportLayout dataset. This exceptional performance is attributable to two primary factors: first, the incorporation of an advanced horizon-depth representation in our model, and second, the integration of meticulously designed modules within our network.
Additionally, the 360-MLC method is ehanced with an iterative optimization strategy (iteratively generating refined pseudo-labels and fine-tuning222Our solution that won the 1st Place in the MVL Challenge at the CVPR 2023 Workshop., denoted as ”360-MLC-Iter” in Tab. III). We observe that this strategy was found to narrow the performance disparities among base layout models. Especially, models that initially displayed suboptimal performance witnessed notable enhancement. Yet, after the 2nd iteration, a discernible influx of noise disrupts the estimated boundary, preventing it from forming seamless and complete layouts.
Moreover, it is worth noting that even with iterative optimization, the baseline method lagged behind our approach. Impressively, our method achieve the top performance, solidifying the superior efficacy of the proposed approach.
| Method | 2DIoU(%) | 3DIoU(%) |
|---|---|---|
| Group 1: ablation on MatterportLayout (Monocular) | ||
| w/o Cross-scale interaction | 83.24 | 80.71 |
| w/o Feature assembling | 82.36 | 80.10 |
| w/o Disentangling planes | 83.23 | 80.60 |
| w/o Flipping fusion | 83.01 | 80.35 |
| w/o Discriminative channels | 82.74 | 80.23 |
| w/o Long-range dependencies | 83.04 | 80.97 |
| w/o Residuals | 82.89 | 80.45 |
| Ours [Full] | 83.46 | 81.34 |
| Group 2: ablation on MVL (Multi-view) | ||
| DOPNet[mp3d] | 80.71 | 75.13 |
| DOPNet[fine-tuning] | 81.64 | 51.91 |
| MV-DOPNet[fine-tuning] | 82.15 | 53.99 |
| DOPNet[w/ ] | 81.70 | 76.02 |
| MV-DOPNet[w/ ] | 82.44 | 77.72 |
| MV-DOPNet[w/ ] | 83.59 | 79.42 |
4.6 Ablation study
We exhibit ablation studies in Tab. IV group 1, where each component of our model is evaluated on MatterportLayout [7]. To demonstrate the effectiveness of the proposed feature assembling mechanism, we first ablate cross-scale interaction in the distortion-aware feature aggregation module (denoted as ”w/o Cross-scale interaction”). Then, we further remove the distortion elimination (denoted as ”w/o Feature assembling”). To exhibit the benefit of orthogonal plane disentanglement, we remove the proposed disentangling orthogonal planes procedure (denoted as ”w/o Disentangling planes”) and soft-flipping fusion, respectively. Finally, we show the effect of each attention mechanism (denoted as ”w/o Discriminative channels”, ”w/o Long-range dependencies”, and ”w/o residuals”, respectively). For a fair comparison, we train each model with the same epochs (500).
Cross-scale Distortion Awareness. From Tab. IV, the pipeline without cross-scale interaction shows inferior performance to the complete model. Further removing the distortion elimination part, the pipeline yields worse results. It is proved that both dealing with distortions and integrating cross-scale features are essential for layout estimation.
Pre-segmenting Orthogonal Planes. Since the geometric cues are essential for inferring 3D information from 2D images, we propose to disentangle orthogonal planes. To prove its effectiveness, we remove that stage but preserve the flipping fusion strategy (the effectiveness of this strategy is validated separately). The results in Tab. IV show that this stage can make the performance more competitive. Besides, the embedding of symmetry property also contributes to the promotion of the predicted results.
Reconstructing 1D Representations. The dependencies of the 1D sequences have changed when disentangling the orthogonal planes. Hence, we propose to reconstruct the 1D representations. We verify the effectiveness of each attention mechanism in turn. From Tab. IV, we can observe that all three reconstruction operations (generating discriminative channels, rebuilding long-range dependencies, and providing the missing residuals) can benefit the overall performance. Intuitively, when removing the channel-wise graph, the pipeline’s performance decreases significantly, demonstrating that enforcing the network concentration on discriminative channel information can capture effective information by avoiding redundancy.
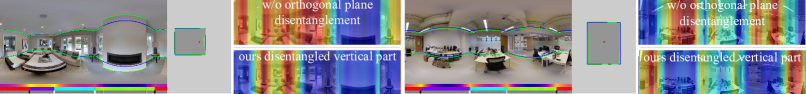
As shown in Fig. 8, we can observe that the 1D representation of the layout produced by our DOPNet is much more precise than that produced by the baseline method.
MVL Specific Designs. From Tab. IV group 2, we can observe that multi-view insights elevate our model’s 2DIoU score to the forefront, while our formulated ratio constraints simultaneously enhance both 3DIoU and 2DIoU scores. Additionally, the improved , losses further boost overall model performance, underscoring our approach’s effectiveness in advancing state-of-the-art technologies.
5 Conclusion
In this paper, we propose a framework, for multi-view layout estimation. Current approaches generate a 1D representation by a vertical compression operation. We argue that this strategy confuses the semantics of different planes. We propose to disentangle orthogonal planes to get spotless 1D representations, as well as capture geometric cues in 3D space. Specifically, we obtain disentangled semantics by eliminating distortions, pre-segmenting orthogonal plans, and reconstructing dependencies of sequences. Besides, we propose both a horizon-depth optimizer and a multi-view specific module to fully exploit the multi-view layout consistency both at the decision level and the feature level. Our experimental results demonstrate that dealing with distortion, as well as integrating shallow and deep features, can enhance the performance. Experiments demonstrate that our algorithm significantly outperforms current SoTA methods on both monocular layout estimation and multi-view layout estimation tasks.
Acknowledgments
We would like to thank Wei Wang, Shujun Huang, Yue Zhan, and Shuai Zheng for valuable discussions. Thanks to all authors for their insightful research and open source projects. This work was supported by the National Natural Science Foundation of China (Nos. 62172032, 62120106009).
References
- [1] C. Sun, C.-W. Hsiao, M. Sun, and H.-T. Chen, “Horizonnet: Learning room layout with 1d representation and pano stretch data augmentation,” in Proceedings of the IEEE/CVF Conference on Computer Vision and Pattern Recognition, 2019, pp. 1047–1056.
- [2] C. Sun, M. Sun, and H.-T. Chen, “Hohonet: 360 indoor holistic understanding with latent horizontal features,” in Proceedings of the IEEE/CVF Conference on Computer Vision and Pattern Recognition, 2021, pp. 2573–2582.
- [3] Z. Jiang, Z. Xiang, J. Xu, and M. Zhao, “Lgt-net: Indoor panoramic room layout estimation with geometry-aware transformer network,” in Proceedings of the IEEE/CVF Conference on Computer Vision and Pattern Recognition, 2022, pp. 1654–1663.
- [4] G. Pintore, M. Agus, and E. Gobbetti, “Atlantanet: inferring the 3d indoor layout from a single 360 image beyond the manhattan world assumption,” in European Conference on Computer Vision. Springer, 2020, pp. 432–448.
- [5] F.-E. Wang, Y.-H. Yeh, M. Sun, W.-C. Chiu, and Y.-H. Tsai, “Led2-net: Monocular 360deg layout estimation via differentiable depth rendering,” in Proceedings of the IEEE/CVF Conference on Computer Vision and Pattern Recognition, 2021, pp. 12 956–12 965.
- [6] Z. Shen, Z. Zheng, C. Lin, L. Nie, K. Liao, S. Zheng, and Y. Zhao, “Disentangling orthogonal planes for indoor panoramic room layout estimation with cross-scale distortion awareness,” in Proceedings of the IEEE/CVF Conference on Computer Vision and Pattern Recognition (CVPR), June 2023, pp. 17 337–17 345.
- [7] C. Zou, J.-W. Su, C.-H. Peng, A. Colburn, Q. Shan, P. Wonka, H.-K. Chu, and D. Hoiem, “Manhattan room layout reconstruction from a single 360 image: A comparative study of state-of-the-art methods,” International Journal of Computer Vision, vol. 129, pp. 1410–1431, 2021.
- [8] S. Cruz, W. Hutchcroft, Y. Li, N. Khosravan, I. Boyadzhiev, and S. B. Kang, “Zillow indoor dataset: Annotated floor plans with 360deg panoramas and 3d room layouts,” in Proceedings of the IEEE/CVF conference on computer vision and pattern recognition, 2021, pp. 2133–2143.
- [9] I. Armeni, S. Sax, A. R. Zamir, and S. Savarese, “Joint 2d-3d-semantic data for indoor scene understanding,” arXiv preprint arXiv:1702.01105, 2017.
- [10] Y. Zhang, S. Song, P. Tan, and J. Xiao, “Panocontext: A whole-room 3d context model for panoramic scene understanding,” in Computer Vision–ECCV 2014: 13th European Conference, Zurich, Switzerland, September 6-12, 2014, Proceedings, Part VI 13. Springer, 2014, pp. 668–686.
- [11] J. M. Coughlan and A. L. Yuille, “Manhattan world: Compass direction from a single image by bayesian inference,” in Proceedings of the seventh IEEE international conference on computer vision, vol. 2. IEEE, 1999, pp. 941–947.
- [12] C. Zou, A. Colburn, Q. Shan, and D. Hoiem, “Layoutnet: Reconstructing the 3d room layout from a single rgb image,” in Proceedings of the IEEE conference on computer vision and pattern recognition, 2018, pp. 2051–2059.
- [13] S.-T. Yang, F.-E. Wang, C.-H. Peng, P. Wonka, M. Sun, and H.-K. Chu, “Dula-net: A dual-projection network for estimating room layouts from a single rgb panorama,” in Proceedings of the IEEE/CVF Conference on Computer Vision and Pattern Recognition, 2019, pp. 3363–3372.
- [14] C. Fernandez-Labrador, J. M. Facil, A. Perez-Yus, C. Demonceaux, J. Civera, and J. J. Guerrero, “Corners for layout: End-to-end layout recovery from 360 images,” IEEE Robotics and Automation Letters, vol. 5, no. 2, pp. 1255–1262, 2020.
- [15] S. Rao, V. Kumar, D. Kifer, C. L. Giles, and A. Mali, “Omnilayout: Room layout reconstruction from indoor spherical panoramas,” in Proceedings of the IEEE/CVF Conference on Computer Vision and Pattern Recognition, 2021, pp. 3706–3715.
- [16] L. Yuan, Y. Chen, T. Wang, W. Yu, Y. Shi, Z.-H. Jiang, F. E. Tay, J. Feng, and S. Yan, “Tokens-to-token vit: Training vision transformers from scratch on imagenet,” in Proceedings of the IEEE/CVF international conference on computer vision, 2021, pp. 558–567.
- [17] W. Wang, E. Xie, X. Li, D.-P. Fan, K. Song, D. Liang, T. Lu, P. Luo, and L. Shao, “Pyramid vision transformer: A versatile backbone for dense prediction without convolutions,” in Proceedings of the IEEE/CVF international conference on computer vision, 2021, pp. 568–578.
- [18] Z. Liu, Y. Lin, Y. Cao, H. Hu, Y. Wei, Z. Zhang, S. Lin, and B. Guo, “Swin transformer: Hierarchical vision transformer using shifted windows,” in Proceedings of the IEEE/CVF international conference on computer vision, 2021, pp. 10 012–10 022.
- [19] P. V. Tran, “Sslayout360: Semi-supervised indoor layout estimation from 360° panorama,” in 2021 IEEE/CVF Conference on Computer Vision and Pattern Recognition (CVPR). IEEE Computer Society, 2021, pp. 15 348–15 357.
- [20] A. Tarvainen and H. Valpola, “Mean teachers are better role models: Weight-averaged consistency targets improve semi-supervised deep learning results,” Advances in neural information processing systems, vol. 30, 2017.
- [21] B. Solarte, C.-H. Wu, Y.-C. Liu, Y.-H. Tsai, and M. Sun, “360-mlc: Multi-view layout consistency for self-training and hyper-parameter tuning,” Advances in Neural Information Processing Systems, vol. 35, pp. 6133–6146, 2022.
- [22] Y. Lee, J. Jeong, J. Yun, W. Cho, and K.-J. Yoon, “Spherephd: Applying cnns on 360° images with non-euclidean spherical polyhedron representation,” IEEE Transactions on Pattern Analysis and Machine Intelligence, vol. 44, no. 2, pp. 834–847, 2020.
- [23] Y. Xu, Z. Zhang, and S. Gao, “Spherical dnns and their applications in 360 images and videos,” IEEE Transactions on Pattern Analysis and Machine Intelligence, vol. 44, no. 10, pp. 7235–7252, 2021.
- [24] C. Zhuang, Z. Lu, Y. Wang, J. Xiao, and Y. Wang, “Spdet: Edge-aware self-supervised panoramic depth estimation transformer with spherical geometry,” IEEE Transactions on Pattern Analysis and Machine Intelligence, vol. 45, no. 10, pp. 12 474–12 489, 2023.
- [25] Y.-C. Su and K. Grauman, “Learning spherical convolution for fast features from 360 imagery,” Advances in Neural Information Processing Systems, vol. 30, 2017.
- [26] T. S. Cohen, M. Geiger, J. Köhler, and M. Welling, “Spherical cnns,” arXiv preprint arXiv:1801.10130, 2018.
- [27] B. Coors, A. P. Condurache, and A. Geiger, “Spherenet: Learning spherical representations for detection and classification in omnidirectional images,” in Proceedings of the European conference on computer vision (ECCV), 2018, pp. 518–533.
- [28] Z. Shen, C. Lin, K. Liao, L. Nie, Z. Zheng, and Y. Zhao, “Panoformer: Panorama transformer for indoor 360 depth estimation,” in European Conference on Computer Vision. Springer, 2022, pp. 195–211.
- [29] T.-Y. Lin, P. Dollár, R. Girshick, K. He, B. Hariharan, and S. Belongie, “Feature pyramid networks for object detection,” in Proceedings of the IEEE conference on computer vision and pattern recognition, 2017, pp. 2117–2125.
- [30] Z. Shen, C. Lin, L. Nie, K. Liao, and Y. Zhao, “Distortion-tolerant monocular depth estimation on omnidirectional images using dual-cubemap,” in 2021 IEEE International Conference on Multimedia and Expo (ICME). IEEE, 2021, pp. 1–6.
- [31] B. Coors, A. P. Condurache, and A. Geiger, “Spherenet: Learning spherical representations for detection and classification in omnidirectional images,” in Proceedings of the European conference on computer vision (ECCV), 2018, pp. 518–533.
- [32] Y. Li and A. Gupta, “Beyond grids: Learning graph representations for visual recognition,” Advances in neural information processing systems, vol. 31, 2018.
- [33] X. Wang, S. Liu, H. Ma, and M.-H. Yang, “Weakly-supervised semantic segmentation by iterative affinity learning,” IJCV, vol. 128, no. 6, pp. 1736–1749, 2020.
- [34] C. Lin, S. Zheng, Z. Liu, Y. Li, Z. Zhu, and Y. Zhao, “Sgt: Scene graph-guided transformer for surgical report generation,” in International conference on medical image computing and computer-assisted intervention. Springer, 2022, pp. 507–518.
- [35] Y. Yao, Z. Luo, S. Li, T. Fang, and L. Quan, “Mvsnet: Depth inference for unstructured multi-view stereo,” in Proceedings of the European conference on computer vision (ECCV), 2018, pp. 767–783.
- [36] D. P. Kingma and J. Ba, “Adam: A method for stochastic optimization,” 2014.
- [37] A. Chang, A. Dai, T. Funkhouser, M. Halber, M. Niebner, M. Savva, S. Song, A. Zeng, and Y. Zhang, “Matterport3d: Learning from rgb-d data in indoor environments,” in 2017 International Conference on 3D Vision (3DV). IEEE, 2017, pp. 667–676.
- [38] M. Savva, A. X. Chang, A. Dosovitskiy, T. Funkhouser, and V. Koltun, “Minos: Multimodal indoor simulator for navigation in complex environments,” arXiv preprint arXiv:1712.03931, 2017.
- [39] S. K. Ramakrishnan, A. Gokaslan, E. Wijmans, O. Maksymets, A. Clegg, J. Turner, E. Undersander, W. Galuba, A. Westbury, A. X. Chang et al., “Habitat-matterport 3d dataset (hm3d): 1000 large-scale 3d environments for embodied ai,” arXiv preprint arXiv:2109.08238, 2021.
- [40] M. Savva, A. Kadian, O. Maksymets, Y. Zhao, E. Wijmans, B. Jain, J. Straub, J. Liu, V. Koltun, J. Malik et al., “Habitat: A platform for embodied ai research,” in Proceedings of the IEEE/CVF international conference on computer vision, 2019, pp. 9339–9347.
- [41] Y. Zhao, C. Wen, Z. Xue, and Y. Gao, “3d room layout estimation from a cubemap of panorama image via deep manhattan hough transform,” in European Conference on Computer Vision. Springer, 2022, pp. 637–654.