Interactive Shape Sonification for Tumor Localization in Breast Cancer Surgery
Abstract.
About 20 percent of patients undergoing breast-conserving surgery require reoperation due to cancerous tissue remaining inside the breast. Breast cancer localization systems utilize auditory feedback to convey the distance between a localization probe and a small marker (seed) implanted into the breast tumor prior to surgery. However, no information on the location of the tumor margin is provided. To reduce the reoperation rate by improving the usability and accuracy of the surgical task, we developed an auditory display using shape sonification to assist with tumor margin localization. Accuracy and usability of the interactive shape sonification were determined on models of the female breast in three user studies with both breast surgeons and non-clinical participants. The comparative studies showed a significant increase in usability (p¡0.05) and localization accuracy (p¡0.001) of the shape sonification over the auditory feedback currently used in surgery.
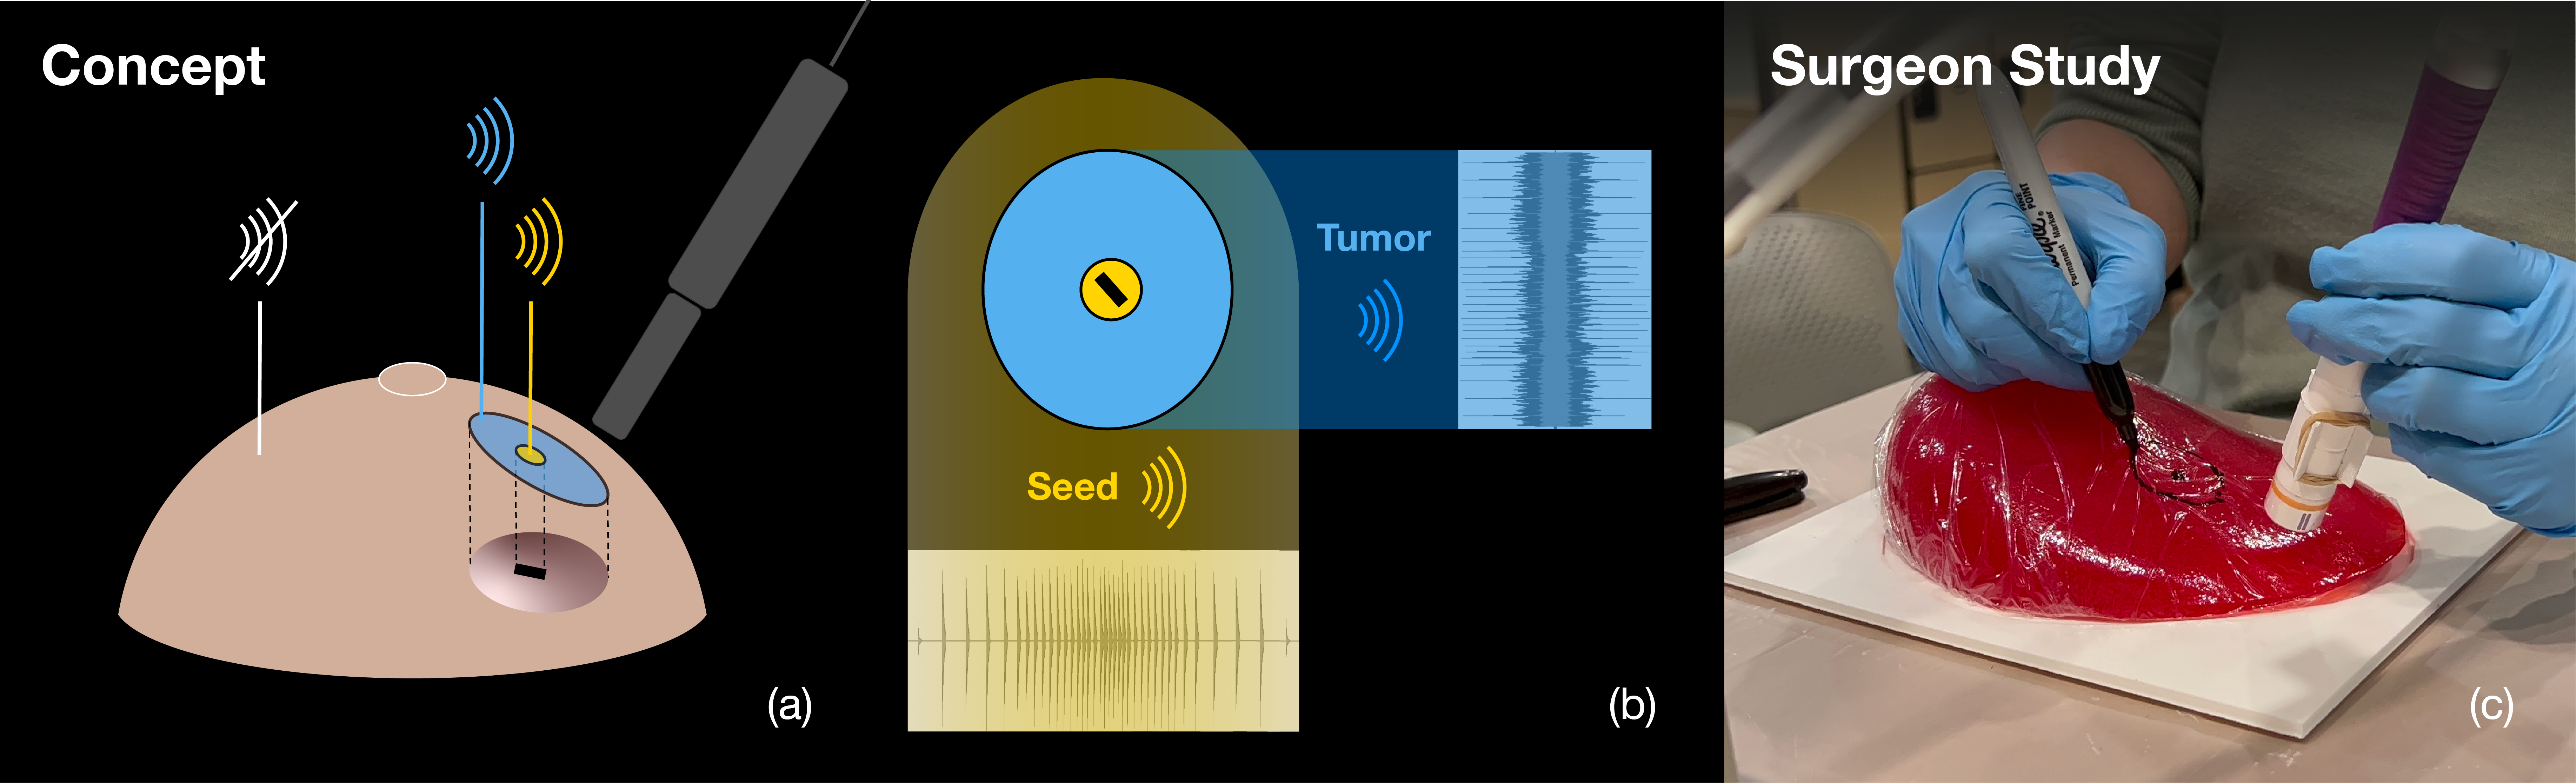
Sub-figure (a) shows a three-dimensional view of the breast in a lying down position with an ellipsoid tumor and a seed, a small rectangular box, inside the breast. The tumor margin and seed location are projected onto the skin bottom up, and the two areas are marked on the skin with a blue ellipse for the tumor margin and a yellow ellipse for the seed area. Sub-figure (b) shows the same two ellipsoid shapes as well as the sound waves produced by the tumor and seed sound. The sound waveforms show the change in sound intensity over time. The seed sound waveform shows pikes that densify towards the middle of the seed. The tumor sound waveform shows a noisy wave that keeps the same sound intensity over the entire tumor area. Sub-figure (c) shows two hands with surgical gloves. One hand holds a black marker, the other a localization probe (a cylindrical handpiece). The person is in the process of drawing an ellipsoid shape on top of a red breast model wrapped in cling wrap.
1. Introduction
Breast cancer continues to be a significant health challenge, with its incidence surpassing that of any other cancer worldwide. In 2018 alone, over two million new cases of breast cancer were diagnosed, accounting for 23% of all global cancer cases. The most common treatment for women diagnosed with breast cancer is a lumpectomy, a breast-conserving procedure that aims to remove the tumor and a small margin of surrounding healthy tissue (Fisher et al., 2002).
Male breast cancer is a rare condition, accounting for less than 1% of all diagnosed breast cancer cases (Wehring et al., 2023; Fentiman et al., 2006). Mastectomy has been the standard surgical approach for male breast cancer (Soni et al., 2023). However, recent studies have suggested that lumpectomy can be an oncologically safe treatment option for male patients as well (De La Cruz et al., 2019).
Despite its effectiveness, a lumpectomy has limitations, including the potential for tumor-positive margins, i.e., cancerous tissue left inside the breast after the initial procedure. In this case, reoperation is necessary (Wilke et al., 2014). Reported reoperation rates range from less than 10% to more than 70% (Wilke et al., 2014; McCahill et al., 2012; Jeevan et al., 2012; Landercasper et al., 2014; Schulman et al., 2017; Isaacs et al., 2016; McEvoy et al., 2018; De la Flor et al., 2022). Another common challenge during lumpectomy is overexcision, where surgeons remove more tissue than necessary, leading to poorer cosmetic outcomes. While surgeons aim to remove the entire tumor with a 1-cm margin, resection volumes have been reported to be 2.3 to 2.5 times larger than the optimal resection volume (Haloua et al., 2016; Krekel et al., 2011).
Breast cancer localization systems have been developed to make excision more precise and thus decrease the rate of reoperations. Some localization systems, such as the Savi Scout®111Savi Scout®, Merit Medical Systems, Jordan, UT, USA use sound feedback to convey the location of the tumor to the surgeon (Mango et al., 2016). However, only the location of the seed, a small marker implanted into the tumor prior to surgery, is sonified. Although the tumor size and location can be visualized using medical imaging, these images are obtained prior to surgery. Due to the deformability of breast tissue, the location and shape of the tumor will have changed from the position of the breast during preoperative imaging to the position in surgery. This introduces a potential margin of error for the surgeon in determining the tumor’s actual shape and margin location at the time of surgery, even with the use of current localization systems. This work aims to evaluate whether sonification of both the seed location and the tumor shape is effective in improving breast cancer localization accuracy and overall system usability. Novel auditory displays encoding both seed and margin location were evaluated (Figure 1). Beyond breast cancer surgery, these sonification strategies can be extended to various surgical tasks or even find application in multimodal user interfaces.
Our work provides the following main contributions:
-
(1)
We introduce shape sonification into surgical guidance systems.
-
(2)
We present an auditory display for breast cancer localization using multi-parameter sound mapping for simultaneous encoding of shape information (tumor margin) and point location (seed).
-
(3)
We report results from three user studies with four breast surgeons and 33 non-clinical participants comparing shape sonification to the current clinical sound feedback.
-
(4)
We provide evidence that shape sonification has the potential to improve the usability and accuracy of surgical localization tasks.
2. Related Work
The work presented in this paper most closely relates to three areas of research, which the following section summarizes: auditory displays with a focus on shape sonification, recent experiments in sonification for surgical guidance, and breast cancer localization approaches.
2.1. Shape Sonification
Previous research in psychoacoustics and sensory substitution proves that the visual sensory channel can be substituted by the auditory channel for certain tasks. A study by Auvray et al. [(2007)] showed that objects can be recognized by their auditory representation and that auditory cues can be used for localization tasks. Meijer et al. [(1992)] conducted an experiment on auditory image representation. They converted images into corresponding sound patterns, proving that auditory representation can effectively retain visual image information. Gerino et al. [(2015)], who evaluated multiple two-dimensional (2D) sonification techniques for shape recognition on touchscreens, were able to show that sonification is effective at conveying shape information to users. They introduced a shape sonification task which asked the user to explore an invisible 2D shape (e.g., a triangle or a rectangle) by moving their index finger along a line on a touch screen. For each position of the finger on this one-dimensional line, a ”cross-section” of the shape was sonified and played to the user. Another study on geometric shape recognition by van den Doel et al. [(2004)] focused on sound feedback for blind people. Their system mapped images of basic geometric shapes to sound. During their study, the user explored the virtual image by moving a pointer over a graphics tablet (Wacom tablet) to explore the shape and was later asked to draw the perceived shape.
A tablet-based system was also used in a showcase by Javier Sanchez [(2010)], enabling sound-based curve and shape recognition through pen and finger movement. Tommasini et al. [(2022)], while also exploring invisible geometric shapes via sound feedback, were interested in quantifying the dynamic movements of a computer mouse during shape exploration. They showed differences in exploration strategies for the distinct geometric shapes. A study evaluating shape recognition via gestures asked users to discriminate between concave and convex curves in three-dimensional (3D) space using sound (Boyer et al., 2015).
Our work introduces a new use case for shape sonification, namely breast cancer localization. The proposed system sonifies both the tumor shape and the location of a marker inside the tumor.
2.2. Surgical Sonification
Auditory displays are a promising means of guidance during medical procedures when visual focus is required on the surgical site, and a visual overlay in Augmented Reality (AR) might distract from the surgical task. Among works introducing sonification as an alternative or addition to visual surgical guidance systems are Matinfar et al. [(2022)], Roodaki et al. [(2017)] and Schütz et al. [(2022)]. Matinfar et al. [(2022)] presented a four-dimensional sonification for surgical instrument alignment during pedicle screw placement. Schütz et al. [(2022)] proposed an audiovisual guidance system for coil placement during transcranial magnetic stimulation by means of position and angle sonification. Roodaki et al. [(2017)] evaluated the influence of sound feedback on the performance of medical precision tasks, such as needle placement in eye surgery. The audio guidance encoded location and angle information about the needle to the user. Their study showed increased angle alignment accuracy over a visual medical guidance system. All three works showed that sonification is as effective as visualization in conveying tool location and angle information. Two other studies presenting an auditory display for needle placement are Black et al. [(2017)] and Bork et al. [(2015)]. Black et al. [(2017)] presented an auditory synthesis model using pitch and stereo panning parameter mapping for navigated needle placement, while Bork et al. [(2015)] introduced an audiovisual AR system to improve occluded anatomy localization perception in 3D. The latter study showed enhanced needle placement accuracy when using auditory and visuotemporal guidance. Another study evaluating the benefit of sonification in a surgical setting mapped the spatial position of a surgical tool tip with respect to a target location by encoding the direction and distance to said target position in the auditory display (Ziemer et al., 2017). Directionality was represented via sound pitch and distance to the target via beat frequency.
Unlike the studies presented in this section, which applied sonification approaches to surgical tool location and orientation, our work focuses on shape sonification. We present a novel sonic interaction with the tumor. Instead of sonifying the surgical tool alignment with some pre-planned position, we sonify the anatomical target.
2.3. Breast Tumor Localization Techniques
Current intraoperative localization methods of non-palpable breast lesions rely on medical imaging such as mammography, ultrasound, or magnetic resonance imaging (MRI) (Kasem and Mokbel, 2020). Although the acquired imaging data is volumetric, scans are commonly presented to the surgeon as a series of 2D multiplanar images and thus demand experienced mental registration of these images to the patient to locate the tumor. Image-guided tumor localization is furthermore challenging as the patient’s position during diagnostic imaging differs from their position during the surgical procedure. For instance, a breast MRI is typically acquired with the patient lying face down in a prone position, while a mammogram is taken with the patient standing and the breast compressed between two plates. In contrast, actual lumpectomy surgery is performed with the patients lying on their backs.
To ensure precise localization, even after the position is changed, a trackable marker is embedded directly into the tumor, which can be localized regardless of breast tissue deformation. While wire-guided localization has been a common approach, its limitations prompted the development of a wireless alternative using radioactive seeds, which, however, requires substantial training for the safe handling of radioactive material (Kasem and Mokbel, 2020). Several radiation-free and wireless methods, including the use of radiofrequency identification tags, magnetic seeds, and infrared reflectors, have emerged (Wazir et al., 2020; Tayeh et al., 2020; Kasem and Mokbel, 2020). These markers can be inserted at the time of pre-operative biopsy.
An exemplary radiation-free localization system is the Savi Scout®. It involves a 12×1.6 mm electromagnetic wave reflector (seed) activated by infrared light impulses generated by the console probe and two antennas that allow the reflection of the electromagnetic wave signal back to the probe (Cox et al., 2016). The system provides real-time proximity information of the detection probe to the seed through auditory feedback (Kasem and Mokbel, 2020). A recent analysis of over 800 cases revealed a significant decrease in reoperation to 12.9% when using the Savi Scout® (Kasem and Mokbel, 2020).
Although marker-based localization systems can help determine the location of the seed within the tumor, they do not provide information about the tumor margin location or its overall shape. Inferring these details from preoperative medical images can be a cognitively demanding and error-prone task. To address this challenge, several studies have explored the use of AR to assist with breast tumor localization (Perkins et al., 2017; Perkins, 2020; Gouveia et al., 2021; Lan et al., 2018). Perkins et al. [(2017)] demonstrated a Mixed Reality surgical planning system for breast tumor targeting in seven patients. The location of the tumor was marked on the skin of the breast by tracing the virtual tumor shape. In a preliminary 2D perceptual task, they evaluated the tracking accuracy of the localization system. They reported an overlap of the drawn and the virtual shape using the Dice coefficient (ranging from 0.56 to 0.95). For the patient study, they reported a Dice coefficient of about 0.2 comparing the shape drawn using a HoloLens and the ground truth shape (Perkins, 2020). Unlike Perkins et al. [(2017)], who introduced a planning system to be used before incision, Gouveia et al. [(2021)] performed a live lumpectomy using AR guidance. Lan et al. [(2018)] proposed the use of a fiber optoacoustic guide in combination with a tablet-based AR interface for lumpectomy. Their study showed a localization accuracy of 0.25mm of the tip of the fiber optoacoustic guide. However, no information about the tumor shape was presented to the user. Another recent work in the field of breast tumor localization introduced an AR visualization system for ultrasound breast biopsy, which offers segmented lesion visualization (Costa et al., 2023). Their system demonstrated improved accuracy, as evidenced by the distance from the needle tip to the lesion being reduced to 5.09 mm.
Unlike the above studies presenting visual augmentation approaches, we propose to add to the state-of-the-art practices in breast tumor localization by providing an auditory display for seed-based localization systems. We aim to enhance tumor excision precision by providing information about the tumor margin location in addition to the seed location sonified in the state-of-the-art solutions.
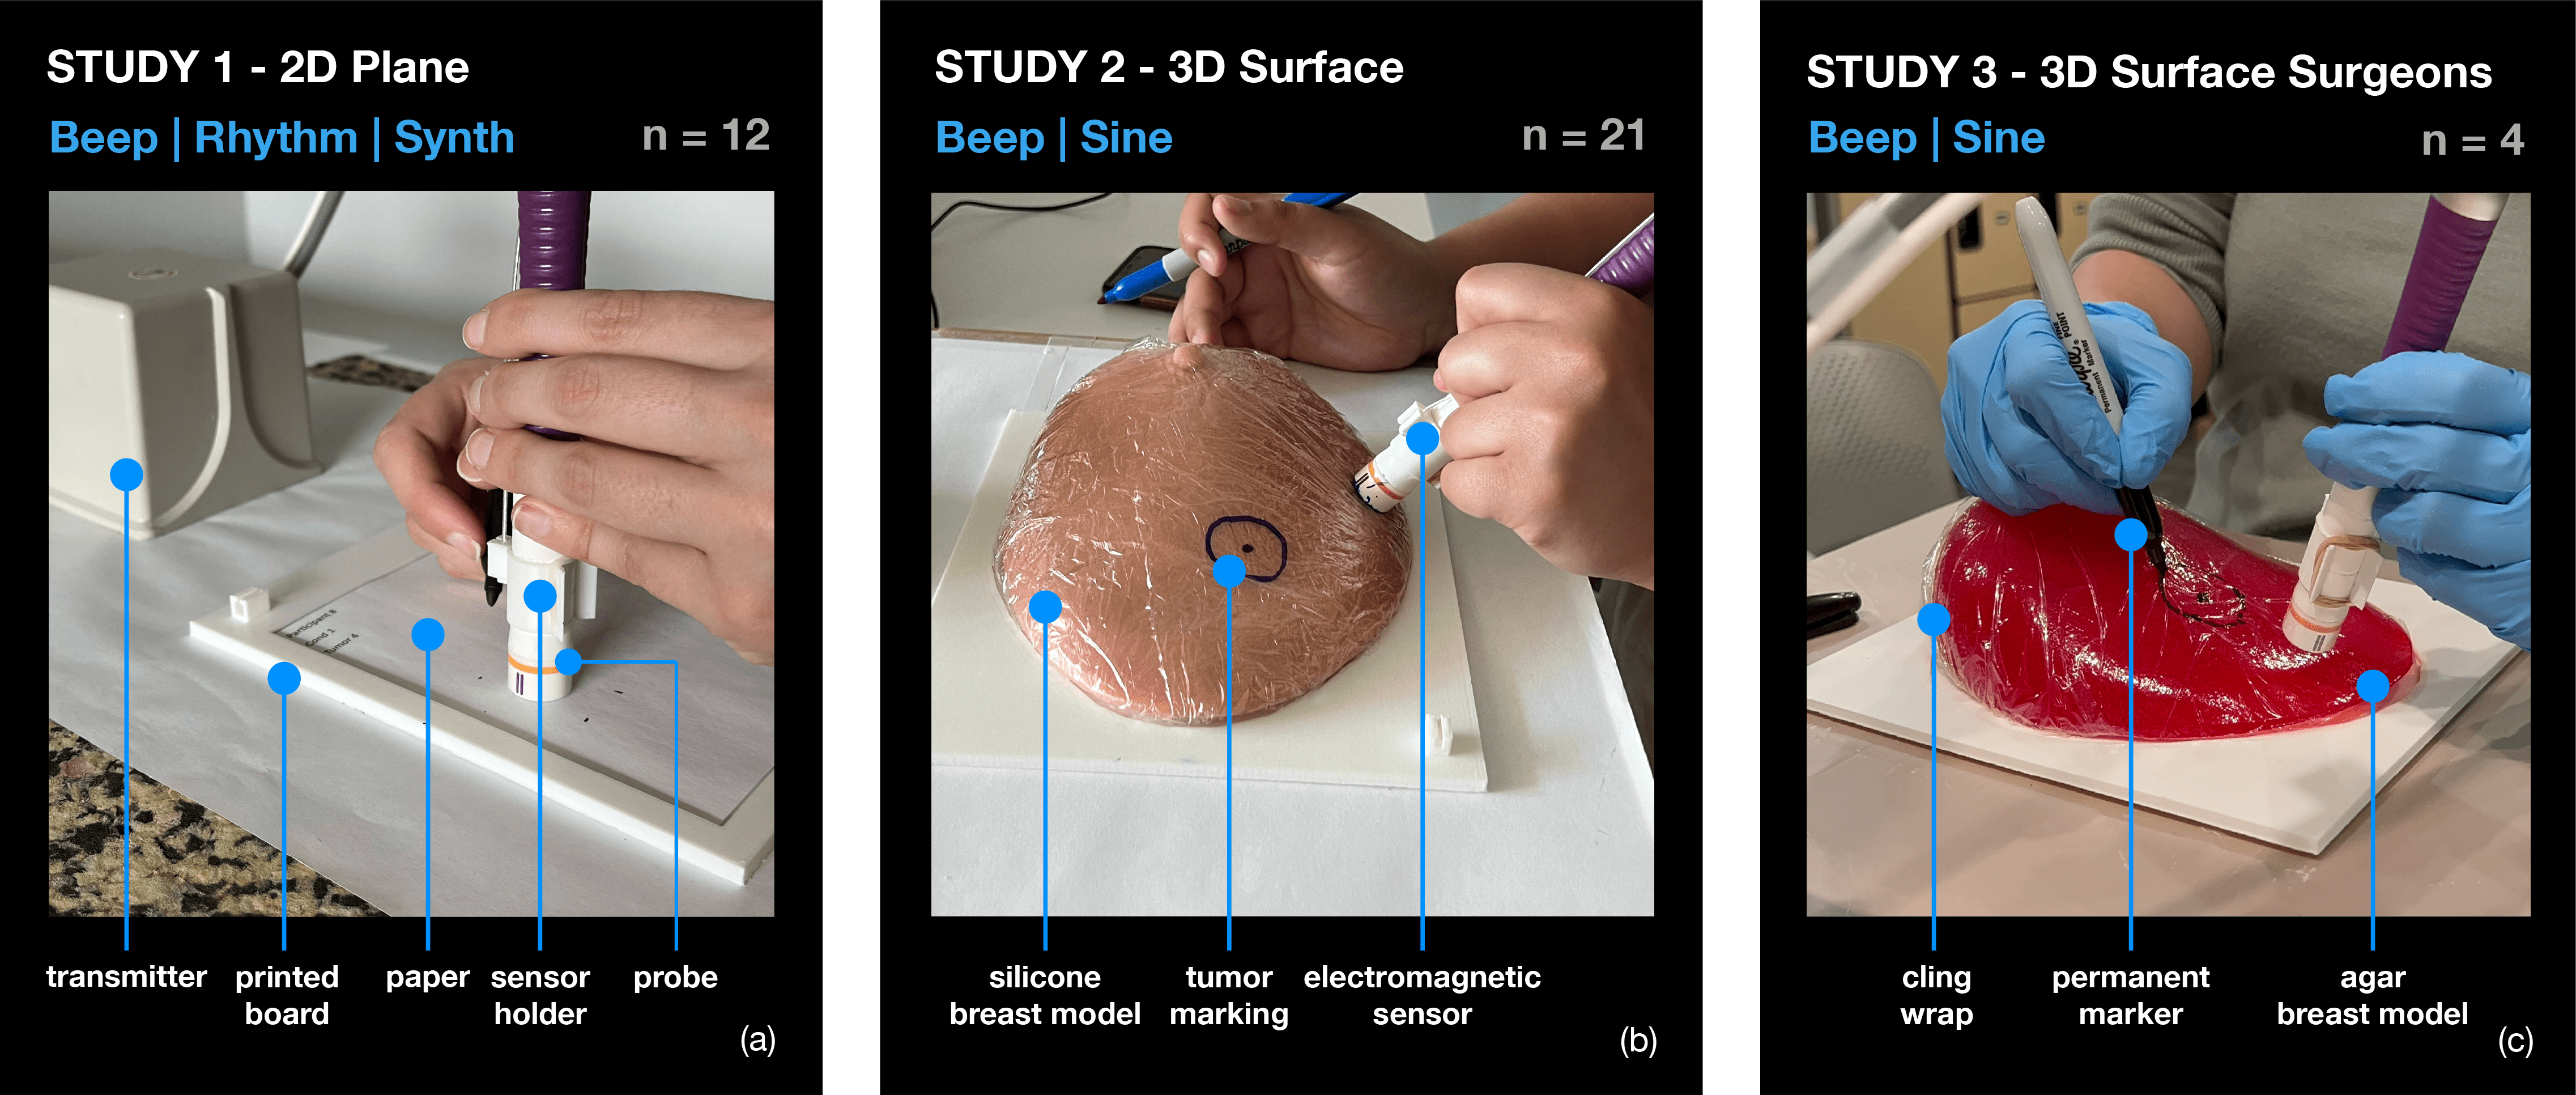
The three experiment setups are shown in order of Study 1 to Study 3 from left to right. Each picture shows a participant holding the probe in one hand and pen in the other to locate and mark a tumor margin. Study 1 uses a white paper sheet for marking, Study 2 a beige silicone breast, and Study 3 a red gelatinous breast model.
3. Experiments
We conducted three user studies to investigate whether shape sonification can increase the usability and accuracy of the tumor localization task in lumpectomy. Repeat testing helped us to incrementally refine the shape sonification design. For the first study, the use context was abstracted to a 2D plane (Figure 2(a)). The second study evaluated a refined shape sonification design on a silicone model of the female breast (Figure 2(b)), and the third study tested the final sonification design on 16 agar breast models with breast surgeons (Figure 2(c)).
All studies were approved by the university’s Institutional Review Board (IRB) office.
In particular, we sought to test the following hypotheses:
Hypothesis 1 (H1): Shape sonification (Rhythm, Synth, Sine) significantly increases the localization accuracy compared to the current clinical auditory feedback (Beep).
Hypothesis 2 (H2): Shape sonification (Rhythm, Synth, Sine) significantly enhances the usability of the auditory display compared to the current clinical auditory feedback (Beep).
Hypothesis 3 (H3): Shape sonification (Sine) significantly decreases the amount of excess healthy breast tissue resected compared to the current auditory feedback (Beep).
4. Study 1 - 2D Plane
We conducted a repeated-measures within-subject study to compare two shape sonification designs to the current clinical auditory feedback.
4.1. Participants
Twelve volunteers took part in the study, five women and seven men. The participants had an average age of 31 years, with a standard deviation of 9.74 years. The study included three postdoctoral researchers, one radiologist, three medical students, three bioengineering students, and two students in product design. None of the participants reported having any hearing impairments or prior experience in using interactive sonification for shape localization.
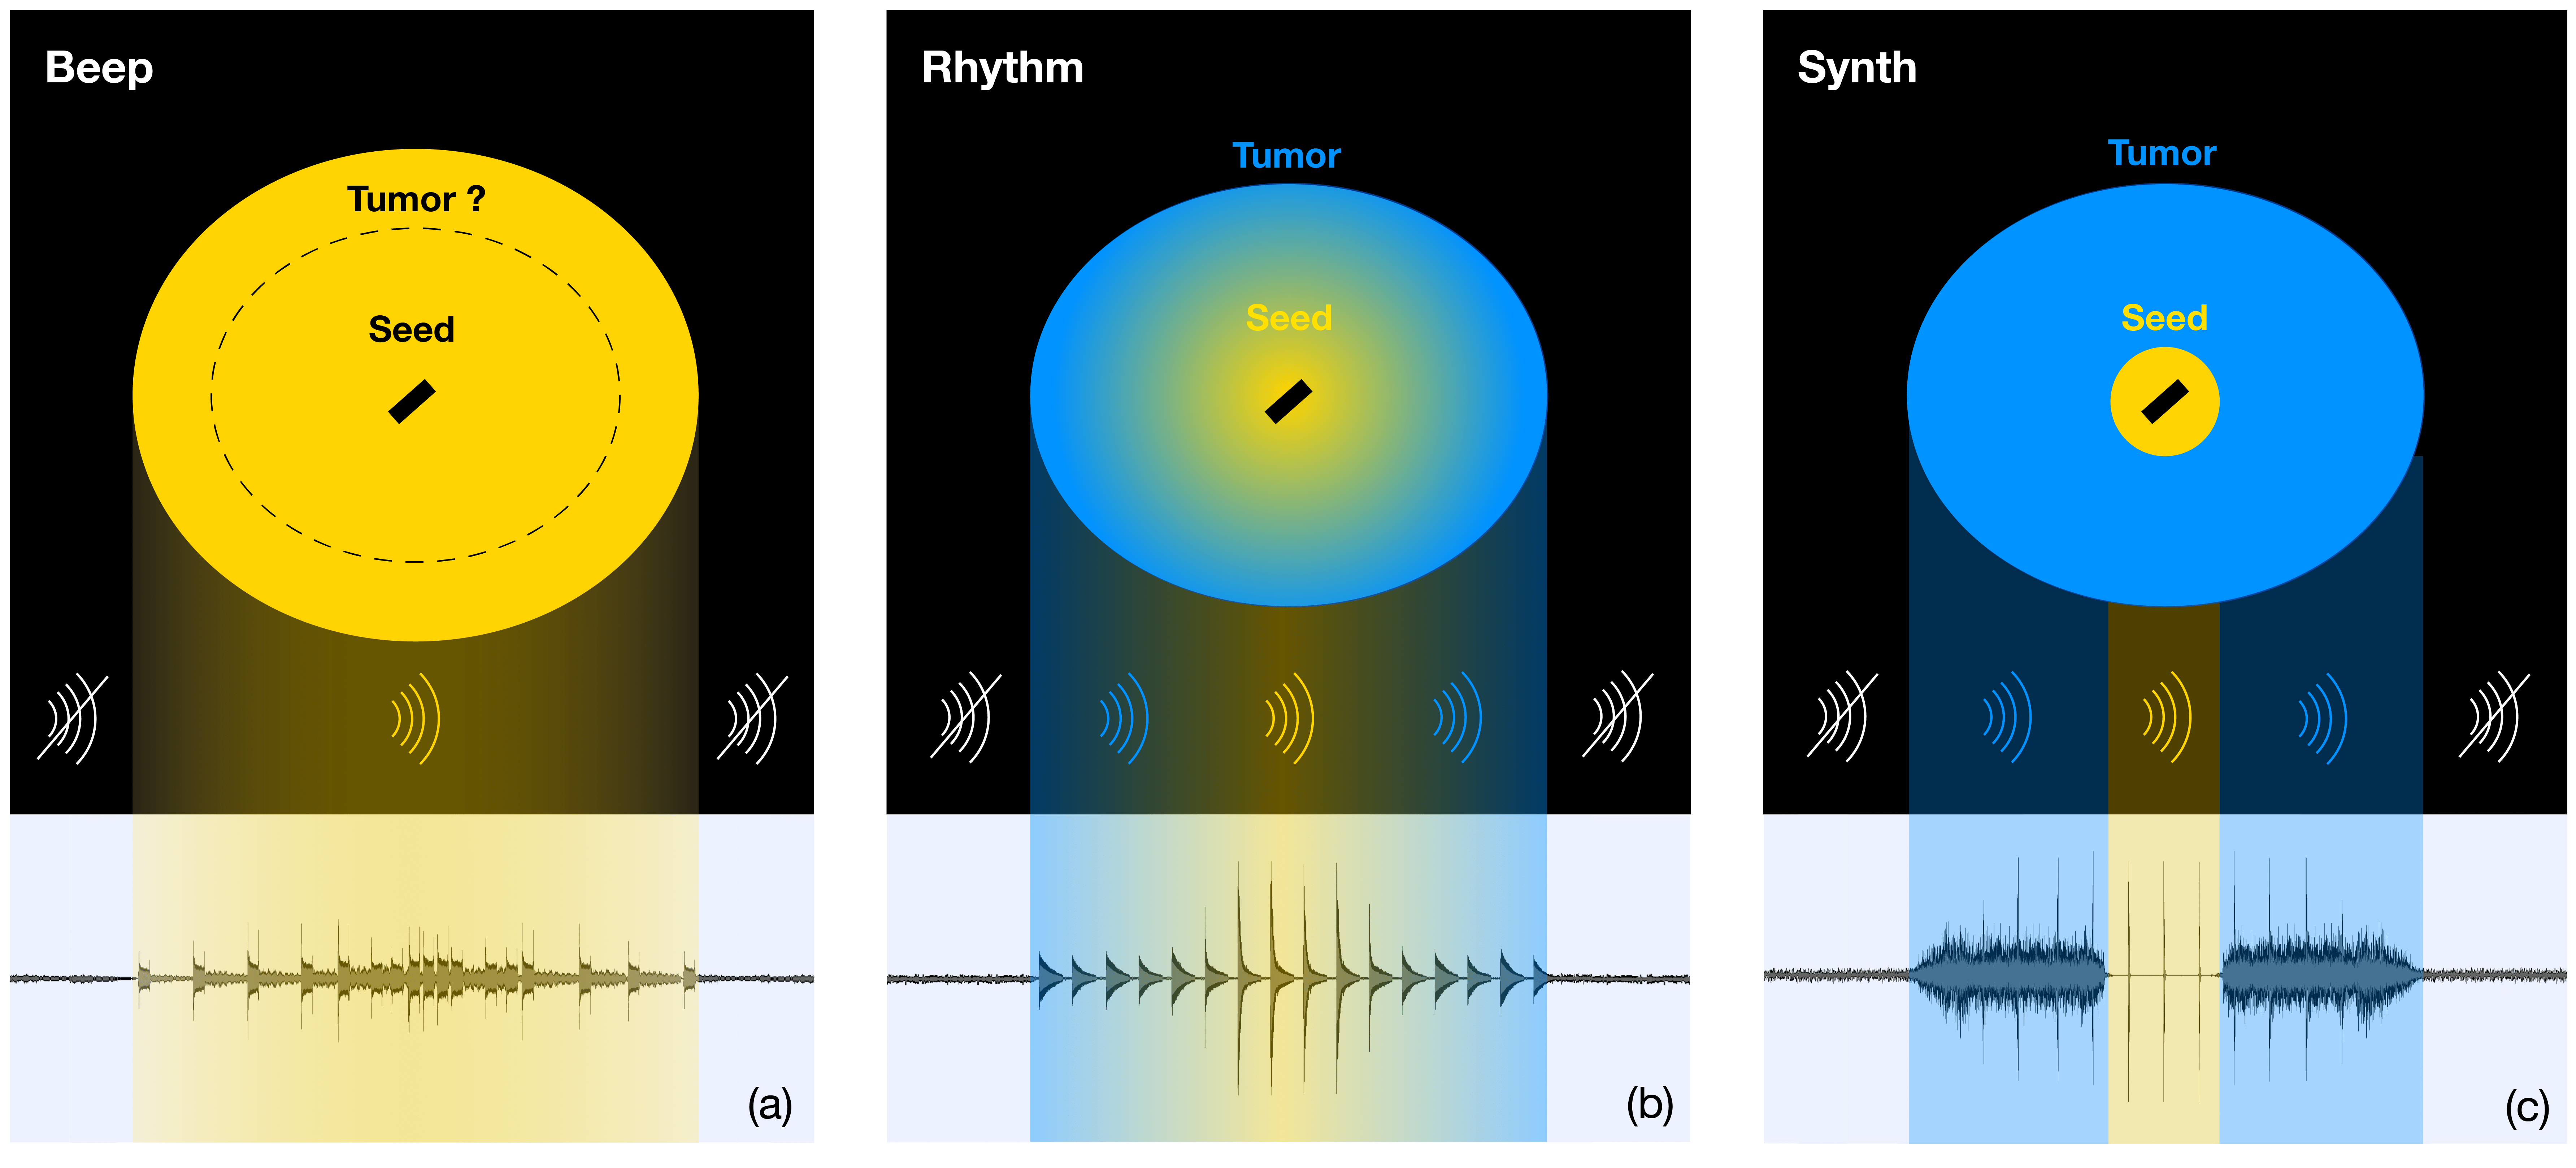
The figure shows three simplified illustrations of the tumor shape and seed. Overlaid atop these illustrations are yellow and blue areas indicating the spatial localization of the sonifications and their sounds’ waveform.
4.2. Apparatus
4.2.1. Hardware and Software Setup
To enable the sonification study, we had to set up a surgical localization system. The system consisted of a Savi Scout® radar localization probe, an electromagnetic (EM) tracking system (the trakSTAR™ EM 6 degrees-of-freedom tracking solution)222trakSTAR™, NDI, Waterloo, Ontario, Canada with a mid-range transmitter, and a graphics processing unit accelerated laptop for running the sonification and tracking software. The transmitter of the EM tracking system was placed on a table and faced the area where the user performed the instructed task (Figure 2(a)).
The EM tracking system was connected to the laptop via USB, and the open-source library Plus Toolkit333Plus Toolkit (https://plustoolkit.github.io/) was used for real-time streaming of the position tracking and sensor data to Unity444Unity (https://unity.com/) (Long Term Support Release 2020.3.21f1). In Unity, the distance between the radar localization probe and a virtual 3D model of a tumor was computed using the closestPoint() method, which returns the closest point on the surface of the tumor object from the probe tooltip as a point in 3D space. The distance between this closest point on the surface of the tumor and the tip of the probe, as well as the distance between the probe and the virtual seed, were streamed to Wekinator555Wekinator (http://www.wekinator.org/), an interactive machine learning system for music composition (Fiebrink and Cook, 2010). Wekinator used a Neural Network to map the distance measures from Unity to the output parameters used for sound synthesis in ChucK666ChucK (https://chuck.stanford.edu/), an audio programming language for real-time sound synthesis (Wang et al., 2003). Unity, Wekinator, and ChucK communicated via Open Sound Control (OSC), a network protocol for interactive computer music (Wright, 2005).
4.2.2. Tracking and Registration
While the Savi Scout® system provides audible feedback on the proximity of the probe to the implanted seed, it does not provide numerical information on the position and orientation required for our study. Therefore, we required a tracking method providing real-time position and orientation of the probe to train the sonification model accurately. Clinical navigation systems often use external tracking hardware. Besides optical tracking solutions, EM tracking is a popular alternative. EM tracking detects the position and orientation of a wired sensor inside a magnetic field created by a field transmitter. While the accuracy of EM tracking is susceptible to the presence of ferrous metals and conductive materials that may distort the magnetic field, we chose EM tracking over optical tracking to avoid line-of sight issues(Figueras-Benítez et al., 2014).
The Savi Scout® probe was tracked using a 0.9 mm diameter, six degrees-of-freedom sensor at the tip of a shielded flexible cable. We fixed the position of the EM sensor on the probe using a 3D printed holder. We also 3D printed a custom board to hold a 15x15 cm white drawing paper in place. The OBJ files of the 3D prints were imported into Unity for alignment.
We performed a rigid registration of the virtual board to the 3D printed physical board. First, four fiducial markers were placed on the physical board by tapping the corners with the tracked probe. Then, four corresponding virtual fiducials were placed onto the corners of the virtual board in Unity to achieve the rigid registration. The physical board was fixed to a table, allowing the setup to stay steady during the experiment.
4.3. Sonification
The distance to sound mapping was done in Wekinator using a multilayer perceptron Neural Network with two hidden layers per input parameter. The model was trained on 80 to 100 recordings of the probe position for each sonification model and the manually set desired sound parameter values. For the purpose of this study, three sonification models were created: one mimicking the clinical status quo (Beep) and two newly proposed shape sonifications (Rhythm, Synth).
4.3.1. Beep (status quo)
The distance between the tip of the probe and the location of a virtual seed (point) inside the tumor object was used as input to the Neural Network. Two output parameters were mapped to the volume and frequency of a beeping sound (Figure 3 (a)). The baseline beep sonification used a sine wave oscillator at 440 Hertz (Hz). As the distance between the probe and the tumor decreased, the frequency of the beeps increased. This condition imitated the current sound feedback used by the Savi Scout® system. No information about the tumor shape or margin location was included in this condition.
4.3.2. Rhythm
The first of the two proposed shape sonification models used both the distance to the tumor margin and the distance to the seed as input parameters to convey both the shape and point information within the same beating sound (Figure 3 (b)). Rhythm used a constant beat with a change in instrument to indicate the tumor margin and seed location to the user. The sound was synthesized using the ModalBar instrument in ChucK. The pitch was set to 330 Hz. When the probe was positioned above the tumor border, our system synthesized a distinct marimba beat. When the probe was above the seed location, a higher-pitched and clearer xylophone beat was played. For any location inside the tumor between the border and the inside seed location, the two sounds of the marimba and xylophone beat were interpolated. Four output parameters from Wekinator were mapped to the volume and timbre of the two beat sounds.
4.3.3. Synth
The second shape sonification used the same input parameters as Rhythm to create two distinct sounds: a continuous sound to represent the shape and a beat to represent the seed location (Figure 3 (c)). This sonification separated the areas of interest into discrete zones. The Synth sonification model played a continuous synthesizer sound (musical note C4) when the probe was above the tumor area and no sound when the probe was outside the area. For the seed location, a ticking beat sound (ChucK ModalBar at 660 Hz) was synthesized to indicate the point of interest. Three output parameters from the Neural Network were mapped to the volume and timbre of the ticking seed sound and the volume of the continuous tumor sound.
4.4. Procedure
The three sonifications (Beep, Rhythm, Synth) were presented to each participant in a random order. We began the study session by administering a pre-task questionnaire, including questions on demographic background, medical expertise, and video game experience. After the pre-task questionnaire, the tutorial phase began. The localization task and respective sonification concept were explained to the participant, followed by a trial run, which was not time-constrained. The tutorial phase was followed by the testing phase. The volunteer was tasked to mark the tumor margin and seed location on a paper sheet based on the sound feedback. The paper was exchanged after each tumor. Since the Beep condition lacked information about the tumor shape, the participant received a piece of paper with a picture of the tumor and seed showing the seed location relative to the tumor. For each sonification, the participant was asked to localize six shapes randomly selected from a pool of 15. Once six tumors were located, a post-task questionnaire was filled out by the participant. The questionnaire consisted of a raw NASA-TLX (Task Load Index) questionnaire (Hart and Staveland, 1988) to evaluate the participants’ perceived task load, a System Usability Scale (SUS) (Lewis, 2018) to assess the user-perceived usability of the sonification, and several study-specific questions aimed at collecting qualitative feedback regarding their subjective impressions of the sonifications. This process was then reiterated twice more for the remaining sonifications.
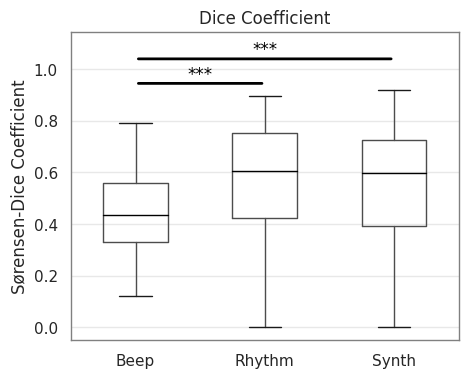
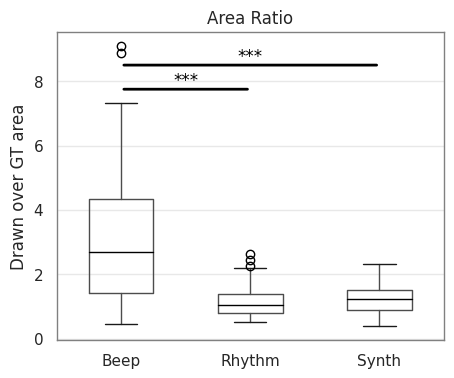
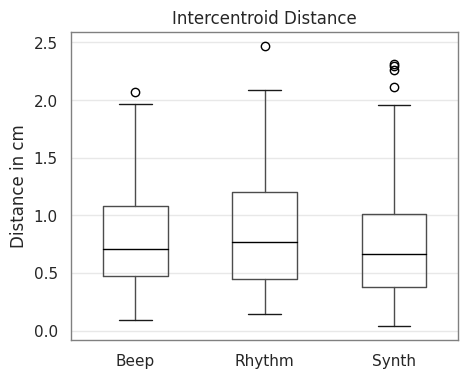
Box plots of Sørensen-Dice coefficient (a), area ratio (b) and intercentroid distance (c) for the three sonification conditions Beep, Rhythm and Synth evaluated in Study 1.
4.5. Data Analysis
To evaluate the accuracy of the shape sonification, we captured images of the 15 different tumor shapes in Unity in 2D view. The shapes’ size, orientation, and location with respect to the drawing paper were visible on the images. The images were resized to 15x15 cm to match the size of the paper. In a next step, we used Matlab to segment the images of the virtual tumor shapes to obtain a ground truth (Figure 5). By applying a threshold to the red color channel, we obtained the segmented shape of the ground truth tumors. Similarly, the corresponding ground truth for the seed locations was extracted from the Unity images.
The 15x15 cm sheets of paper used by the participants to draw the tumor shapes were scanned and later segmented in Matlab. Segmentation of the drawn tumors and corresponding seeds was achieved by finding connected components in the binary images using 8-connected neighborhoods. The tumor in each image was isolated as the largest circular connected component, while the corresponding seed was isolated as the largest connected component inside the drawn tumor area (Figure 5). To isolate the drawn tumor, the circularity component was calculated using the following equation:
| (1) |
where represents the area of the object, represents the perimeter, and is a parameter calculated from the perimeter.
The Sørensen–Dice coefficient, area ratio, and intercentroid distance were calculated to compare the drawn shape (DS) to the ground truth (GT) using the following equations (Sokal et al., 1963):
| (2) |
| (3) |
| (4) |
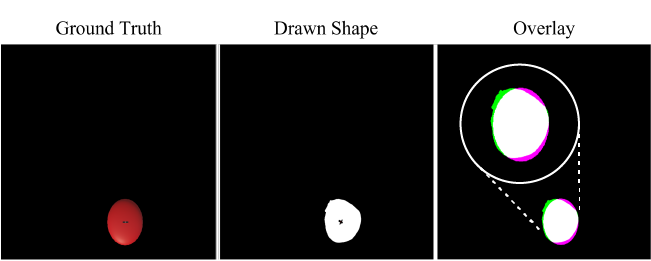
Three black rectangles are displayed next to each other. The left-most includes a red tumor object, the center one a white surface with rough edges, and the right one an overlay of the two shapes and the resulting overlaps.
4.6. Results
4.6.1. Accuracy
The accuracy data measured using the Sørensen Dice coefficient (1), area ratio (2), and intercentroid distance (3) were not normally distributed. Out of the 72 datapoints (six repetitions per participant) twelve outliers were removed using the interquartile range method. Since the study followed a within-subject design, a Friedman test was used to determine significance between conditions for the three measures of accuracy. The Friedman test showed a significant difference between conditions for the Dice coefficient (p0.001) and the area ratio (p0.001). No significant difference in intercentroid distance between sonifications was reported (Figure 4(c)(c)). A paired Wilcoxon test with Holm correction was chosen to compare between conditions. The pairwise tests showed a significantly increased Dice coefficient (p0.001) for both proposed shape sonifications (Rhythm and Synth) over the point sonification (Beep) (Figure 4(c)(a)). Likewise, a significantly smaller area ratio (p0.001) was recorded for the novel shape sonifications over Beep (Figure 4(c)(b)). The significant increase in Dice coefficient proves that the use of the shape sonifications results in a larger overlap of the ground truth tumor shape and the drawn tumor shape, indicating an increased localization accuracy when using shape sonification. Means and standard deviations of all accuracy measures are summarized in Table 1.
4.6.2. Usability
The responses to the NASA-TLX questionnaire on subjective workload were normally distributed. No values were outside the mean three std, so no outliers were excluded from the sample. A repeated measures ANOVA showed no significant difference between conditions for the overall task load. Out of the NASA-TLX subscales, a significant difference was found for the performance scale. Paired samples t-tests showed a significant reduction (p0.05) in the subjectively-perceived performance of Rhythm and Synth over Beep. A Shapiro-Wilk test showed that the SUS questionnaire data was not normally distributed. The interquartile range method was used to identify and remove one outlier. A Friedman test indicated a significant difference between conditions (p0.001). A post-hoc paired Wilcoxon test with Holm correction was used to compare sonifications. The pairwise Wilcoxon test showed that the Synth sonification’s usability was perceived as significantly better than Beep (p0.001) and Rhytm (p0.05). A comparison of Rhythm and Beep did not yield significant differences in usability scores. The Beep condition received the worst usability rating. Table 1 lists means and standard deviations of the NASA-TLX and SUS scores for all sonifications.
n = 12 Beep Rhythm Synth Sørensen–Dice Coefficient 0.44 0.17 0.57 0.23 0.57 0.21 Area Ratio 3.04 1.99 1.15 0.49 1.23 0.46 Intercentroid Distance (cm) 0.79 0.41 0.89 0.54 0.81 0.59 NASA-TLX - Overall 36.26 10.36 42.03 12.16 35.81 17.02 NASA-TLX - Mental Demand 51.25 29.63 39.28 18.28 35.45 17.85 NASA-TLX - Physical Demand 18.00 14.95 25.38 19.75 21.87 17.19 NASA-TLX - Temporal Demand 33.18 24.33 30.83 20.36 15.00 9.35 NASA-TLX - Performance 32.92 21.47 55.36 21.52 65.00 25.66 NASA-TLX - Effort 37.50 22.61 53.93 19.82 43.64 21.02 NASA-TLX - Frustration 49.17 31.32 46.79 23.91 28.64 26.62 System Usability Scale 57.24 13.85 65.00 19.66 85.47 10.15
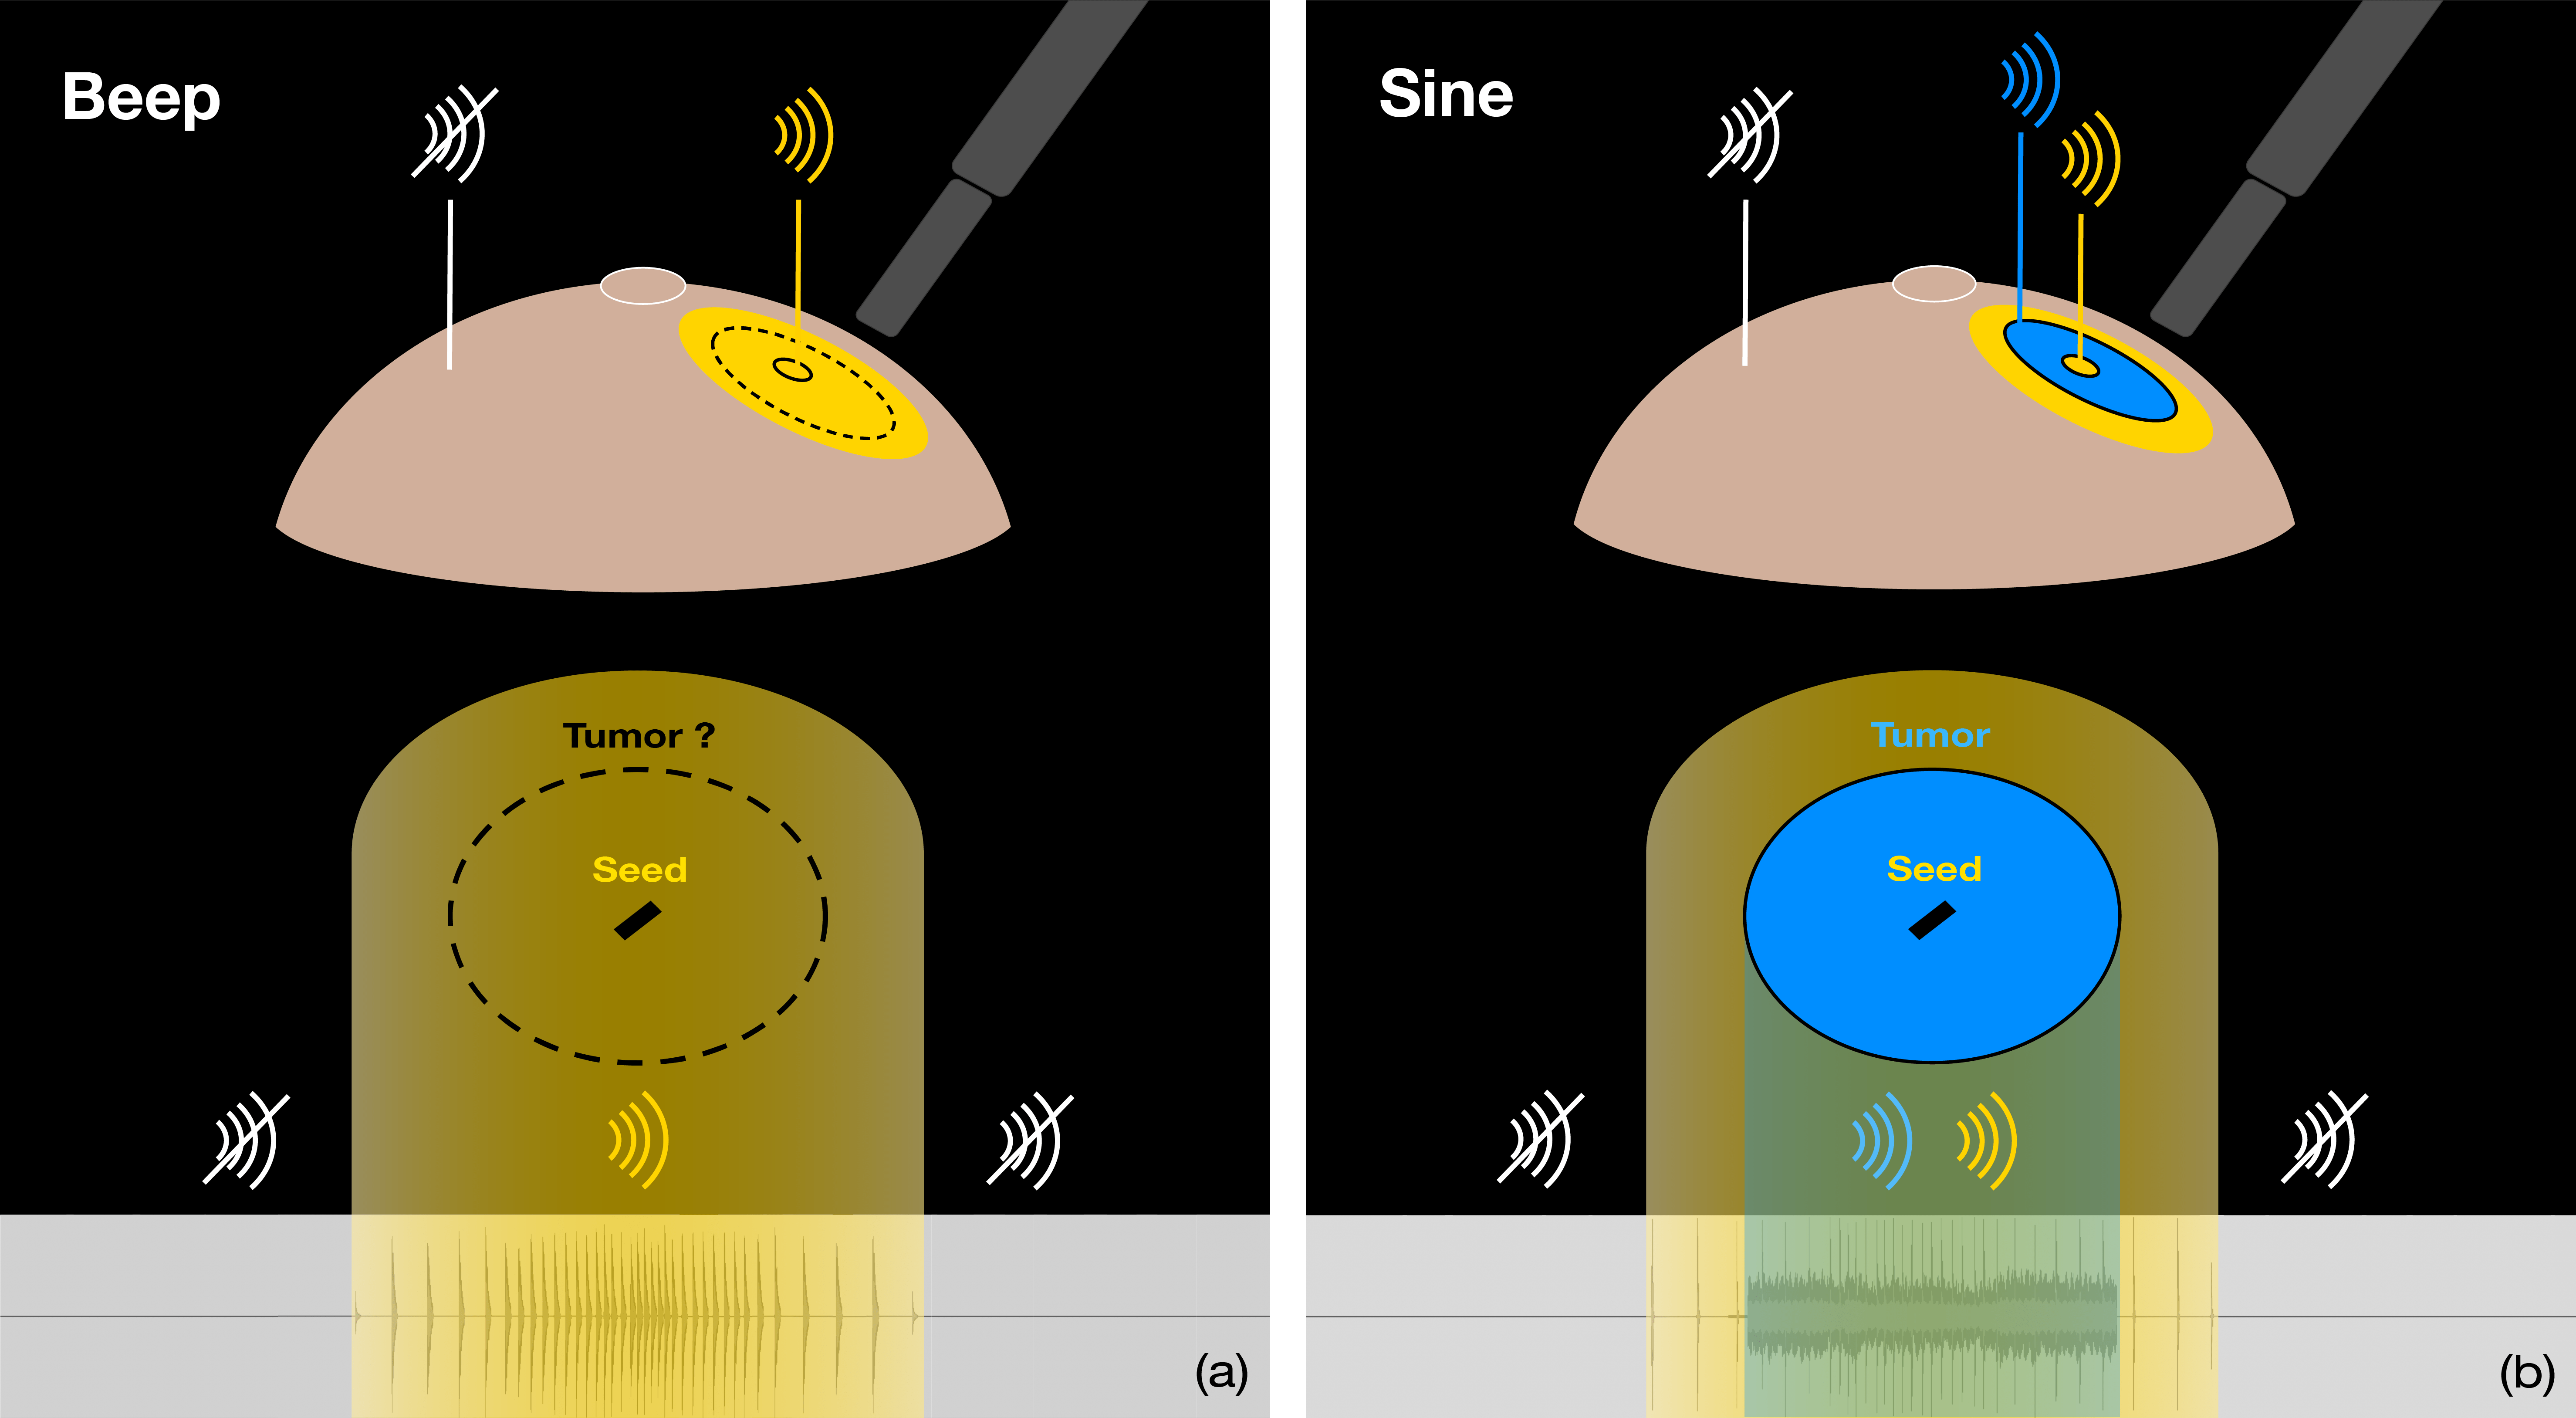
Sub-figure (a) and (b) show a three-dimensional view of the breast in a lying down position paired with a schematic drawing of the tumor and the seed. Sub-figure (a) shows a yellow area over the entire tumor shape. A sound wave image associated with the yellow area is the sound used in the Beep sonification. Sub-figure (b) shows a yellow ring around the tumor and a yellow area around the seed inside the tumor. The remainder of the tumor is colored blue. The yellow and blue areas are again associated with their respective waveform images.
4.6.3. Qualitative Feedback
We asked the participants to rank the three sonifications. 75% of the participants ranked Synth first. 58% of the participants ranked them in this order: Synth, Rhythm, Beep. They elaborated that the continuous sound representing the tumor shape and the ticking sound representing the seed were more easily distinguishable in the Synth than the Rhythm sonification. To quote three participants: ”I really like the consistent [Synth] sound, it made the boundary easier to find.”, ”The [Rhythm] sounds were very pleasant, but I got confused about which tone indicated the seed.”, ”[Rhythm] was hard to use to trace the outline.”. To improve the most preferred Synth sonification, three participants suggested adding a ”distinct sound in the exact location of the seed” to increase the localization accuracy. The Beep sonification was perceived as ”fast and intuitive”, however, the sonification provided no ”tumor shape information nor a direction to seed from [the] current position”.
4.7. Discussion
Our results show that the use of shape sonification leads to a significant increase in localization accuracy. The Sørensen–Dice coefficient reports a greater overlap of the drawn tumor and the ground truth tumor for both novel shape sonifications compared to the clinical standard simulated by the Beep sonification. Besides measuring shape overlap, we also evaluated the area ratio. We were able to report a substantially decreased area ratio of drawn shapes over ground truth shapes for both shape sonifications compared to the status quo sonification. Due to breast surgeons describing their mental model of the tumor location at the time of initial localization as that of a 2D shape on the surface of the breast, the preliminary sonification models were initially tested on a 2D plane. However, this experiment setup deviates from the real scenario, where the system is used on the curved surface of the breast.
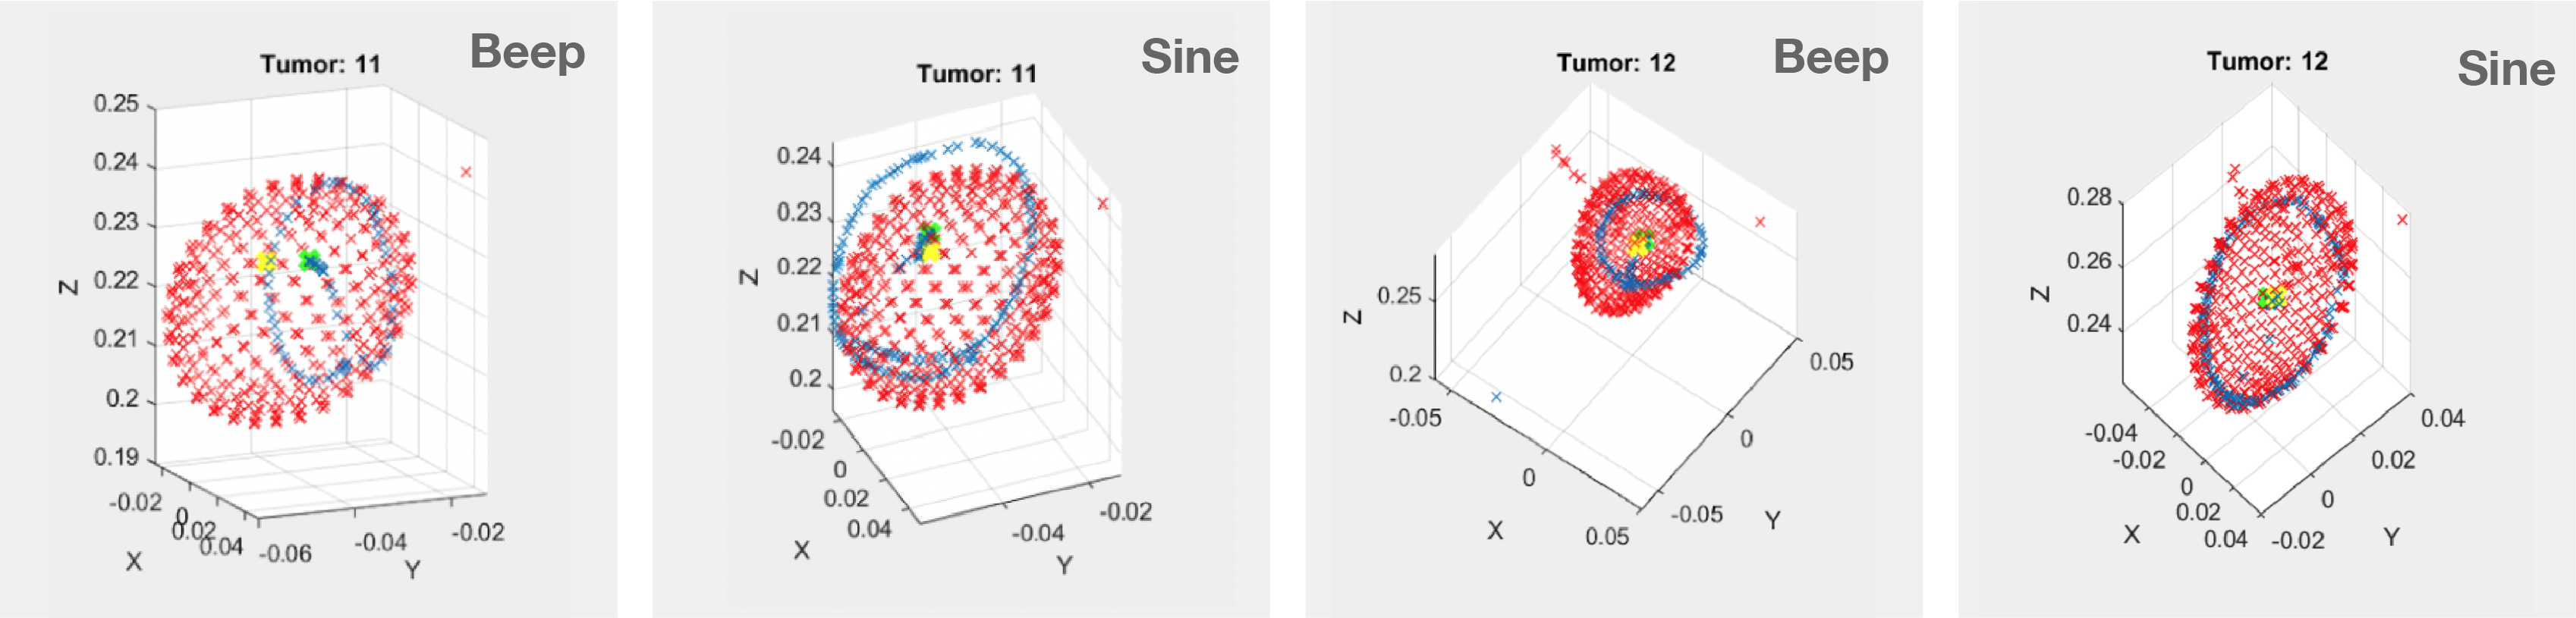
Four plots of location recordings represented as small crosses located in a 3D coordinate system are shown. The drawn marking using the Beep sonification is not as aligned with the ground truth tumor as the Sine sonification marking. The ground truth and drawn seed locations are located close to each other for all four plots.
5. Study 2 - 3D Surface
A second study was conducted to evaluate the auditory displays on a model of the breast. By using a breast phantom, the experimental setup simulated the surgical scene, and the results are more applicable to clinical research.
5.1. Participants
A total of 21 volunteers with a mean age of 26.5 3.4 years participated in the study. Twelve indicated to be men and 9 to be women. The study included a radiologist, three postdoctoral researchers in Radiology, one medical student, nine graduate students in Bioengineering, four students studying Management, and three students specializing in Product Design. None of the participants reported to have any hearing impairments. Four participants indicated prior experience in using the interactive shape sonification.
5.2. Apparatus
This study used the same hardware and software setup as Study 1 except for the use of a silicone breast model instead of a paper sheet for task execution (Figure 2(b)). For fabrication of the silicone breast phantom, we first poured a mold using casting silicone by Pixiss777Pixiss, Grand Rapids, MI, United States. The 3B Scientific888American 3B Scientific, Tucker, GA, United States Breast Self Examination Model 1 acted as the male part in the mold-making process. After the mold had cured for 12 hours, we used Smooth-On999Smooth-On, Macungie, PA, United States Ecoflex™ 00-20, a ”stretchy” silicone mixed with beige silicone pigment to pour the breast phantom. Silicone was chosen to replicate the physical properties of breast tissue, namely deformability and flexibility. A digital 3D model of the breast was segmented from an MRI scan of the breast phantom. The OBJ file was imported into Unity for registration.
In order to facilitate the marking of the tumor shape on the model’s surface, we covered the phantom with cling wrap. After marking two to three tumors, we replaced the cling wrap to prevent overlapping markings. To secure the breast phantom in place, we used a custom 3D-printed board with a recess designed to match the breast model’s shape. Both the OBJ files of the board and the breast were imported into Unity. The same rigid registration process as in Study 1 was performed to align the virtual and real experiment setups.
5.3. Sonification
The sonifications were implemented the same way as in Study 1. For this study, the status quo auditory feedback (Beep) was compared to one new shape sonification (Sine).
5.3.1. Beep (status quo)
Again, only the distance between probe and seed was sonified by Beep (Figure 6(a)). The sonification model from Study 1 was slightly changed to enhance its similarity to the current clinical sound feedback. Instead of the sine wave oscillator, the ChucK ModalBar instrument was used at 200 Hz. In addition, the frequency of the beat was increased. Three output parameters from Wekinator were mapped to sound volume and beat frequency.
5.3.2. Sine
Once more, the distance from the probe to the tumor margin and the seed was mapped to sound parameters to enable the Sine shape sonification (Figure 6(b)). As Synth had performed best in Study 1, we decided to further refine it for Study 2. Qualitative feedback from the study indicated that Synth had led to frustration during rough tumor localization. This was caused by the absence of sound feedback whenever the probe was outside the tumor area. This led us to include a beat sound into Sine to indicate the probe’s distance to the seed even outside the tumor area. Similar to Beep, the beat frequency increased as the probe approached the seed. The well-received discrete sonification of the tumor shape via a continuous synthesizer sound was kept in the Sine sonification. Three output parameters from Wekinator were mapped to the volume and beat frequency of the seed sound as well as the volume of the tumor sound.
5.4. Procedure
The two conditions (Beep and Sine) were presented to each participant in a random order. We again began the study session by administering the pre-task questionnaire, followed by the tutorial phase. During the testing phase, the volunteers were tasked to mark the tumor margin, including the seed location on the silicone breast model. Once eight tumors were located, the participants filled out the post-task questionnaire. The same process was repeated for the second condition.
5.5. Data Analysis
The same measures as in Study 1 were collected. Due to a shift in experiment setup from a 2D to a 3D surface, the location of the margin and seed were recorded by tracing the drawn markings with the tracked probe. These locations were stored in the Unity coordinate frame and later processed in Matlab. To obtain the ground truth (GT), we bottom-up projected the virtual 3D tumors located inside the virtual breast onto the breast model’s surface in Unity. We stored this projection for each of the 15 different tumor objects. To compute the Sørensen–Dice coefficient, area ratio, and intercentroid distance in Matlab, the 3D GT and 3D marking recording (Figure 7) were projected onto a 2D plane that best fits the 3D shape. The plane is calculated by minimizing the sum of the quadratic distances between the plane and the points constituting the 3D shape, and the fit is performed by computing the eigenvalues and vectors associated with the distribution of points.
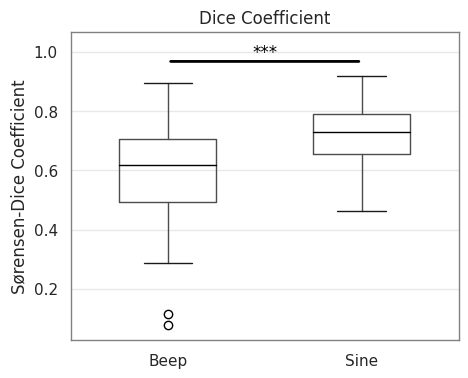
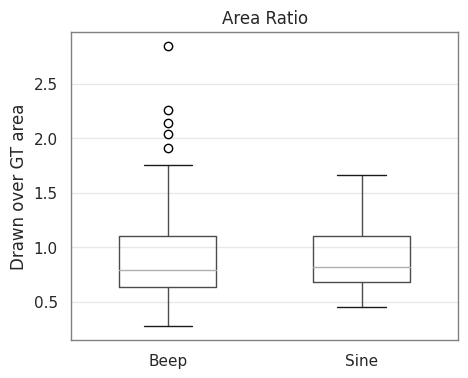
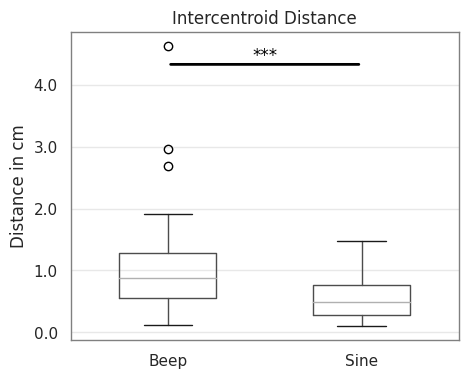
Box plots of Sørensen-Dice coefficient (a), area ratio (b) and intercentroid distance (c) for the two sonification conditions Beep and Sine evaluated in Study 2.
5.6. Results
5.6.1. Accuracy
A Shapiro-Wilk test showed a non-normal distribution for all accuracy measures in Study 2. Eight outliers were removed using the interquartile range method. A Wilcoxon signed-rank test was used to determine significance. The shape sonification (Sine) achieved a significantly better (p 0.001) Dice coefficient (Figure 8(a)) and significantly reduced (p 0.001) intercentroid distance (Figure 8(b)) over Beep. The analysis showed no significant difference (p = 0.67) in area ratio between Beep and Sine (Figure 8(c)). Thus, the shape sonification (Sine) was able to improve the accuracy of the localization task for both the tumor margin (Dice coefficient) and the seed location (intercentroid distance).
5.6.2. Usability
A Shapiro-Wilk test showed normality of the NASA-TLX data. Values outside the mean three std were identified as outliers and one sample was excluded from the data. A paired samples t-test showed no significant difference between sonifications for the overall NASA-TLX score (p = 0.08). Out of the NASA-TLX subscales, only ’Effort’ showed a significant difference. Beep resulted in significantly less (p 0.05) effort than Sine. The SUS results were not normally distributed. Zero outliers were identified using the interquartile range method. A Wilcoxon signed-rank test did not show significance. The accuracy and usability measures’ means and standard deviations are reported in Table 2.
n = 21 Beep Sine Sørensen–Dice Coefficient 0.60 0.16 0.72 0.10 Area Ratio 0.92 0.44 0.90 0.29 Inter-centroid Distance (cm) 0.99 0.62 0.56 0.34 NASA-TLX - Overall 36.92 13.67 44.35 12.68 NASA-TLX - Mental Demand 37.86 5.55 51.00 4.57 NASA-TLX - Physical Demand 23.57 3.12 28.50 4.57 NASA-TLX - Temporal Demand 26.67 4.56 28.42 3.79 NASA-TLX - Performance 60.25 5.71 71.05 4.74 NASA-TLX - Effort 43.57 5.01 58.95 3.78 NASA-TLX - Frustration 32.38 6.46 30.50 4.92 System Usability Scale 76.25 16.23 77.50 20.05
5.6.3. Qualitative Feedback
The reported lower system usability of Beep was also reflected in the qualitative feedback from the post-study questionnaire. Participants enjoyed that Beep was ”intuitive and easy to use”, ”much faster”, and ”not mentally challenging”. However, they disliked that no information about the size and shape of the tumor was provided. One participant wrote that Beep ”lacks precision and information”. The person further mentioned that this results in a ”lack of confidence using it”. Another participant said: ”I was not confident about my drawings, especially the size and boundaries of the tumor.”. Frustration was also expressed by another volunteer, who stated: ”Discriminating between when I was near the seed vs when I was actually on it was rather taxing. It was also taxing to mentally translate the margin area through visuals alone.”. When asked how they would improve the Beep sound feedback, a few people suggested distinguishing between being near the seed versus being directly on top of it.
86% of the participants indicated to prefer the shape sonification (Sine) over Beep. The participants positively mentioned the Sine sonification’s pleasantness of the sound, the accuracy gained through the information on the tumor margin, and the distinct nature of the two sounds. They reported to like the ”clear separation along the border”, the ”continuous positive feedback if within the border”, and that the ”seed detection is easily distinguishable from the closeness sound”. One participant also mentioned: ”It’s very fun to use and offers more accuracy in identifying the tumor boundaries and seed.”. The participants negatively pointed out the system’s latency which caused a slight delay in the uptake of the sound. They further missed directional information: ”I did not like that I got no directional cues - am I bottom left? am I top right?”. When asked about ways to improve Sine, two participants mentioned making the tumor margin even more distinguishable: ”The sound of the outline needs to be more obvious.”, ”I would […] make the device more sensitive to the outline of the tumor.”.
5.7. Discussion
To summarize, the Sine shape sonification resulted in significantly improved localization accuracy over Beep. The task load data showed that Beep was significantly less effort to use than Sine. Although Sine received a higher system usability rating, no significant difference in usability was found. However, given that shape sonification introduces another parameter and thus adds complexity to the Sine condition, an increase in effort and a slight reduction in usability is not surprising. Furthermore, the use of shape sonification due to careful construction of the outline based on auditory feedback inevitably increases task time. One should investigate whether the sonification design or the prolonged task time is the primary driver of reduced usability in this scenario. Eliminating the slight latency present in the technical setup should additionally improve the system’s usability.
Although the breast model enabled a replication of the real use scenario, the silicone was not soft enough to provide realistic breast tissue properties. A study interested in yielding clinically applicable results should look into alternative breast models. While this study included two volunteers with medical expertise, no breast surgeons were present. To gain insights into the sonifications’ perception among the intended users of the system, we conducted a third and final study with breast surgeons.
6. Study 3 - 3D Surface with Breast Surgeons
To further inform the development of the new auditory display and to test the system’s suitability for the surgical task, we evaluate the refined shape sonification with the intended users of the system – the breast surgeons. Contrary to our prior studies, we also determined the shape sonification’s influence on the accuracy of tumor excision.
6.1. Participants
A total of four attending breast surgeons with a mean age of 44 9 years std participated in the study, all four of which were women. None of them had a hearing impairment. All four surgeons indicated extensive experience using the Savi Scout® seed based localization system during lumpectomy.
6.2. Apparatus
Except for a change in the breast model, the hardware and software setup was identical to the prior studies (Figure 2(c)). In this study, the breast phantoms were comprised of agar, glycerol, and red food coloring. Agar and glycerol were selected for their replicability and compatibility with various imaging modalities such as ultrasound and MRI (Oglat et al., 2018). The fabrication of the 16 agar phantoms consisted of continuously stirring a mixture of 3% agar, 9.5% glycerol, and 87.5% distilled water on a hot plate for 8 minutes while ensuring that the mixture did not boil. Drops of red food coloring were added to make the tumors indistinguishable from the breast model mass. 16 tumors were poured from the same mixture as the breast model. However, a 1:200 diluted MRI contrast agent (Feraheme) was added to the mixture for visibility of the tumor mass on MRI imaging. The tumors were inserted into the breast pour after a curing time of about one hour. Diverse tumor shapes and sizes, as well as placements inside the breast, were chosen for a realistic scenario. The phantoms were wrapped in cling wrap and stored in a refrigerator to prevent the agar from drying.
Before and after the study, a General Electric MRI scanner was used to scan all 16 agar models. The pre-study scans were then utilized to segment and save the breast and tumor volumes as OBJ files. These virtual objects were subsequently imported into Unity to align the real and virtual experimental setups. This enabled us to determine the probe’s position in relation to the breast and tumor.
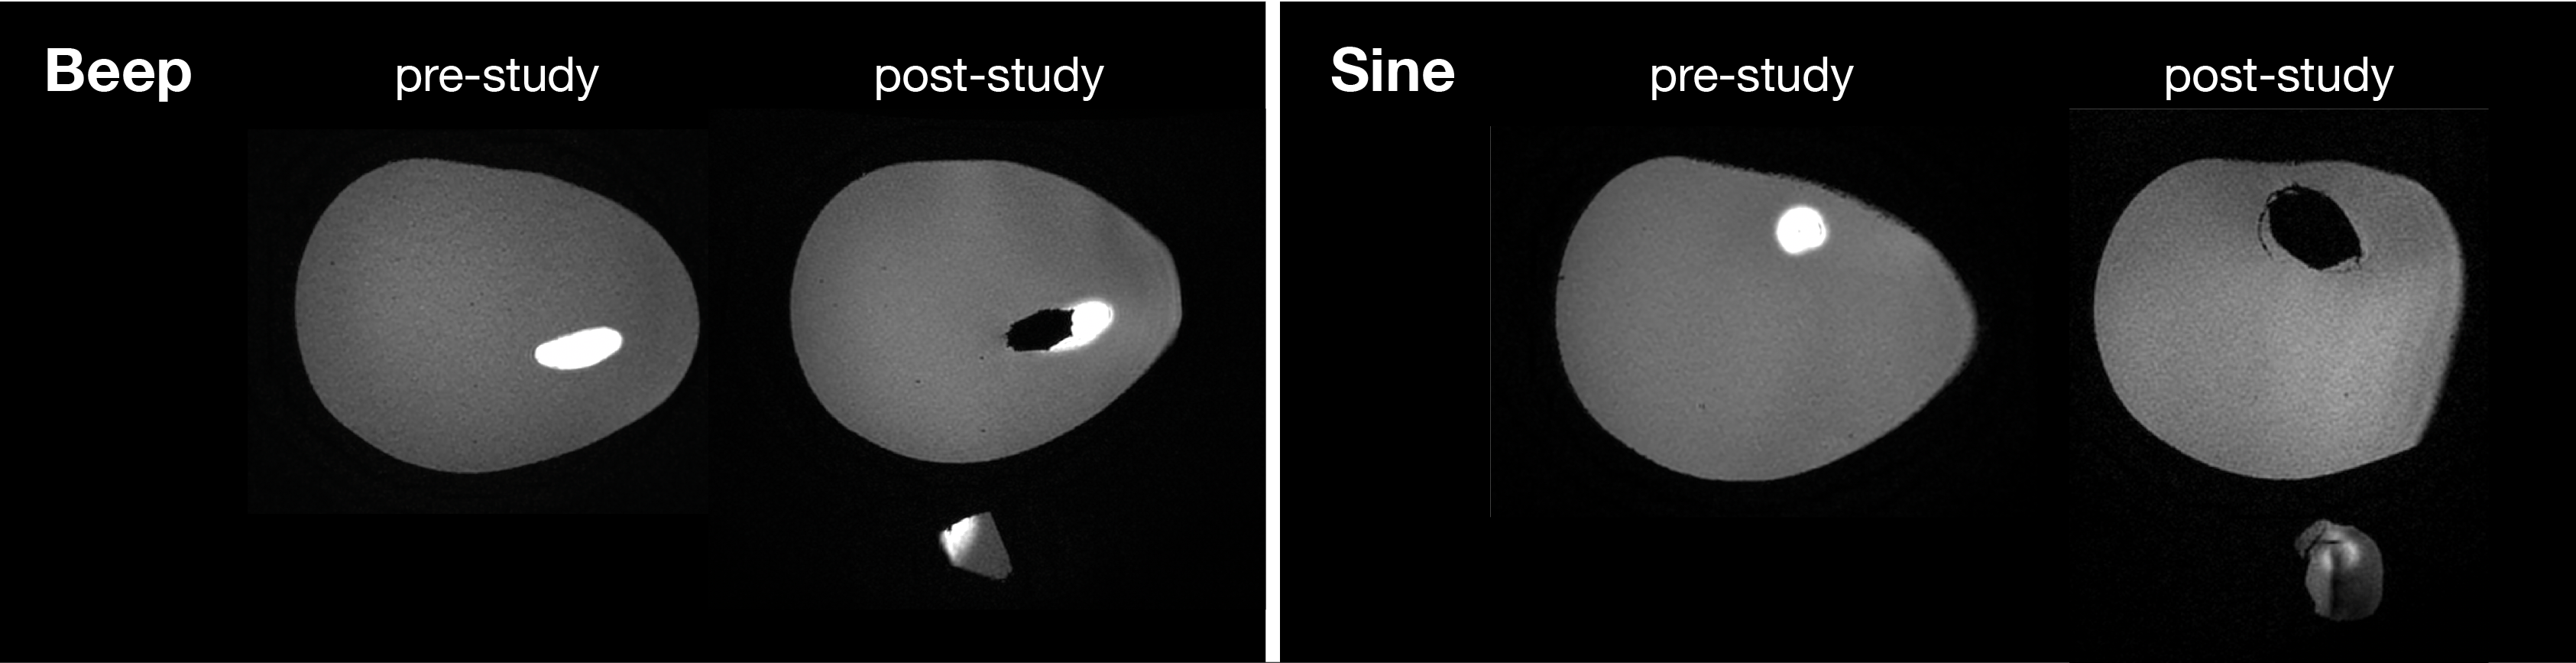
Beep was used for localization on the left breast, and Sine was used on the right breast.
6.3. Sonification
6.4. Procedure
Each surgeon filled out the pre-task questionnaire followed by an explanation and initial training step using the first sonification. Then, the surgeon was asked to first mark the tumor margin and seed location on the surface of the agar breast model, transfer the marking from the cling wrap onto the agar using a small spatula, and lastly, excise the tumor volume from the breast model using a scalpel and a small spoon-like tool. After they marked and removed the tumors from two breast models, they filled out the post-task questionnaire for the sonification that they had just used. The same process was repeated for the second sonification on two more breast models.
6.5. Data Analysis
The pre- and post-study MRI scans were used to determine the calculated resection ratio (CRR), a measure used in clinical research to define the amount of excess healthy breast tissue resected during lumpectomy (Haloua et al., 2016; Krekel et al., 2011; Shin et al., 2017). CRR is calculated by dividing the total resection volume (TRV) over the optimal resection volume (ORV). ORV was defined as the tumor volume, including a 2mm safety margin of healthy tissue. TRV and ORV were obtained by segmenting the 3D tumor and excision volumes from the MRI scans using Horos101010Horos (https://horosproject.org/), an open-source medical image viewer.
All other quantitative (Dice coefficient, area ratio, intercentroid distance) and qualitative measures (pre- and post-study questionnaire) were recorded and analyzed as in Study 2.
6.6. Results
6.6.1. Accuracy
A Shapiro-Wilk test showed a non-normal distribution for all accuracy measures in Study 3. Zero outliers were identified using the interquartile range method. A Wilcoxon signed-rank test showed a significantly improved Dice coefficient (p ¡ 0.001) of Sine over Beep. No significant difference in area ratio, intercentroid distance, or calculated resection ratios was found. Figure 9 shows two exemplary post-study MRI scans for Beep and Sine.
n = 4 Beep Sine Sørensen–Dice Coefficient 0.51 0.20 0.74 0.12 Area Ratio 1.57 0.82 1.17 0.73 Inter-centroid Distance (cm) 0.83 0.44 0.58 0.29 CRR (cm3) (TRV/ORV) 2.54 1.10 2.43 1.58 NASA-TLX - Overall 29.72 16.98 30.83 18.94 NASA-TLX - Mental Demand 42.50 2.38 38.75 3.86 NASA-TLX - Physical Demand 10.00 0.82 8.75 0.50 NASA-TLX - Temporal Demand 11.25 0.50 20.00 3.92 NASA-TLX - Performance 45.00 5.72 63.33 2.89 NASA-TLX - Effort 23.33 2.52 31.67 3.21 NASA-TLX - Frustration 46.25 4.11 22.50 4.20 System Usability Scale 65.63 11.43 85.63 10.68
6.6.2. Usability
A Shapiro-Wilk test showed a non-normal distribution of the NASA-TLX and SUS data. The interquartile range method was used to identify outliers, and one sample was removed from the data. Due to the small sample size of four surgeons, the Wilcoxon signed-rank test showed no significant difference between the two sonifications for neither task load nor system usability. However, the shape sonification Sine achieved a better usability rating than Beep. The accuracy and usability measures’ means and standard deviations are reported in Table 3.
6.6.3. Qualitative Feedback
This improvement was also echoed by the qualitative feedback we received in the post-task questionnaire. Their feedback on the sonification they routinely use in surgery (Beep) was that: ”It only helps localize the seed, so I have to estimate and guess tumor size and shape.”.Another surgeon wrote: ”It was harder to distinguish the edge of the lesion with as much confidence as when the Sine was on.”.
When asked to rank the two sonifications by preference, all surgeons reported preferring Sine. They liked that the ”[tumor] mass was integrated into the sounds” and that ”the dual sounds” gave them a ”second way to verify that the target is within the specimen.” They further said about Sine: ”It helps give shape and size approximation of the targeted tumor.”.
6.7. Discussion
A comparison of the results from the surgeon study to the non-surgeon study (Study 2) shows differences in usability results. While non-surgeons rated the task load of Sine (44.3512.68) to be higher than Beep, the surgeons’ task load rating of Sine (30.8318.94) was much lower and rated as almost equally demanding as Beep (29.7216.98). Sine received a better usability rating (85.6310.68) than Beep (65.6311.43) by the surgeons. Although the small number of participants does not allow for a generalized claim, the trend in the reported data shows the great potential of shape sonification in improving the usability of the breast cancer localization task.
Overall, Study 3 was limited by the small sample size. A study with more breast surgeons should be performed to achieve significant results. A future study should also look into ways to improve the breast models’ flexibility and thus increase the similarity with breast tissue. In addition, the wet surface of the agar model resulted in movement of the cling wrap. This, in turn, added imprecision to the accuracy results. An alternative method for surface markings should be considered.
7. Discussion
Our study results were able to verify H1. Shape sonification increased the accuracy of the breast tumor localization task. All three studies reported a significantly improved Dice coefficient, indicating a greater overlap of the ground truth (GT) and drawn tumor shapes. Study 1 additionally reported a significantly reduced area ratio while, Study 2 showed a significantly reduced distance between the GT and drawn seed location.
The increased localization accuracy suggests shape sonification’s potential to reduce the reoperation rate due to tumor-positive margins. A comparable experiment on breast tumor localization using visual Augmented Reality guidance reports an average Dice coefficient of 0.2 (Perkins, 2020). Our proposed shape sonifications achieved an average Dice coefficient of 0.57, 0.72, and 0.74 in Studies 1, 2, and 3, respectively, proving superior accuracy.
We were furthermore able to partially confirm H2. Study 1 demonstrated significantly increased usability of the Synth shape sonification over the current clinical sound feedback. The combination of two distinct sounds - a continuous and a beat sound - improved discrimination between margin and seed location. Studies 2 and 3 showed no significant differences in task load or usability between shape sonification and the status quo auditory feedback. This effect might be attributed to the added complexity and increased task time that comes with reconstructing a shape from sound feedback.
Interestingly, the breast surgeons in Study 3 reported improved usability of the shape sonification (85.6310.68) over Beep, the status quo sonification (65.6311.43). Moreover, shape sonification was ranked as the preferred option in all three studies. This gives hope that improvements to the sonification design can enhance the usability of the breast cancer localization task and make sound-based guidance systems more user-friendly than current alternatives.
We were not able to prove H3’s claim of reduced over-excision ratios when using shape sonification. Due to the limited number of breast surgeons at our University hospital and the copious resources needed to fabricate and obtain MRI scans of the breast models, our sample size was too small to achieve statistical significance. Although insignificant, our data shows a slight reduction in the removal of excess healthy breast tissue (2.431.58) over the current auditory feedback (2.541.10). The results for both sonifications fall within the clinically reported average ratios of 2.3 to 2.5 of total resection volume over ideal resection volume (Buchholz et al., 2014; Krekel et al., 2011). This non-significant reduction of the resection ratio can be attributed to the lack of depth feedback during excision. This might have led surgeons to take more volume than necessary to ensure resection of the entire tumor mass.
7.1. Design Implications
The presented auditory display was designed with the intention of smooth integration into the surgical workflow of a lumpectomy. Instead of replacing current localization systems and forcing the surgical team to adapt to a new workflow, the proposed sonifications build on the current seed-based localization system, requiring only minor adjustments on the side of the breast surgeon. Due to the introduction of additional tumor margin sonification, the localization task will likely be prolonged. However, the consecutive surgical task of tumor excision might shorten, as gradual excision due to guessing the tumor margin location can be eliminated. These benefits of the presented auditory display over the traditional method will hopefully allow for fast and easy adoption into clinical routine.
While the introduced medical application led us to design an interactive shape sonification that prioritizes precise localization and reconstruction of a shape’s contours, previous shape sonification works in the field of Human-computer interaction (HCI) have focused on 2D shape recognition (Sanchez, 2010; Gerino et al., 2015), 3D object recognition (Auvray et al., 2007; Gholamalizadeh et al., 2017), image understanding (Yoshida et al., 2011; Meijer, 1992) or curvature perception (Alonso-Arevalo et al., 2012; Boyer et al., 2015). However, our evaluation has revealed general findings on shape sonification that contribute to the investigation of auditory displays in the field of HCI:
-
(1)
Shape sonification can provide sub-centimeter precision in localizing the contour of a 2D shape.
-
(2)
Encoding proximity to two objects in two sounds is preferred over one sound as it reduces the task load.
-
(3)
The use of distinguishable concurrent sounds (e.g. a beat and a continuous sound) can lead to improved usability of an auditory display for visuospatial tasks.
These findings are not only applicable to surgical sonification but are also of relevance to the design of sensory substitution devices. Like the works by Meijer [(1992)], Auvray et al. [(2007)], and Gerino et al. [(2015)], who present visual-to-auditory sensory substitution devices for the blind or visually impaired, our sonification technique could also provide visuospatial information to people with vision impairment. Sonified representations of a map, an image, or a user interface could be generated and explored using the presented interactive shape sonification. However, a user study with people with congenital blindness or visually impaired individuals who lost their eyesight later in life would be imperative to understand how blind people perceive and interact with the presented sonification techniques. Besides the design of accessible technologies, our technique could be used to enrich multi-sensory interactions in Mixed Reality by creating more engaging sensory experiences. Shape sonification could, for example, enhance spatial understanding of virtual objects that are occluded or out of sight.
7.2. Limitations
Current breast cancer localization systems do not incorporate tumor margin information as only the location of the seed is known at the time of surgery. In our studies, we were able to bypass this issue by using breast models that allowed only slight deformation and by simulating the use of a radiological image acquired in the same position as the patient is in during surgery (e.g. supine MRI). However, this setup does not correspond to the real circumstances. To bridge the gap between experimental and patient application, a sophisticated tracking system is required. Advanced biomechanical modeling of breast tissue deformation enables these tracking systems for breast surgery. Modeling breast tissue deformation is a field of research on its own, which, for example, works by Samani et al. [(2001)], Gavaghan et al. [(2008)], Eiben et al. [(2016)] or Alcañiz et al. [(2022)] are addressing. An integration of the valuable research results from this field and our work will be the key to a user-friendly and robust solution for breast cancer localization in clinical practice.
A limiting factor of our hardware and software setup is the use of three networks that stream data between the different software applications. This setup has caused a noticeable latency on the user’s end and influenced the usability of the sonifications. Future studies might examine alternative technical setups for realizing the location to sound mapping while avoiding latency issues.
Another observed limitation of our study design is the user-dependent accuracy of the drawn markings. This accuracy was influenced by the individual strategies the participants adopted for marking. The need to remove the probe from the current position to mark the location in the center underneath the tip of the probe added to the imprecision of the drawn outlines. While this task design was consciously chosen as it represents the current clinical practice, it might be worth investigating how the marking of the tumor location can be improved. Methods to increase marking accuracy might include tracking the pen.
7.3. Future Work
Future work on an auditory display for breast cancer localization should, first of all, prioritize the integration of depth information into the design. Information on the tumor’s exact position and depth within the located column of breast tissue is crucial in achieving the desired clinical outcomes. Including depth information might significantly impact the resection ratio and thus decrease the amount of excess healthy breast tissue unnecessarily removed today.
Secondly, the future design of such sonification models could benefit from including directional cues. These cues might make the localization and marking process faster and reduce user frustration. Yet this addition might increase the sonification’s complexity and lead to a higher cognitive load.
Lastly, the issue of realistic simulation of breast tissue properties in an experimental setup should be tackled. This would include not only the use of breast models made from more flexible materials, but also a method for reliably registering and tracking the material’s deformation over the course of the study.
8. Conclusion
The field of breast cancer localization is evolving, with surgical guidance systems showing great potential for improving patient outcomes. Compared to current localization systems that only provide sound feedback on the location of a marker implanted inside the tumor, our approach provides more comprehensive guidance through additional sonification of tumor margins.
In three user studies, we demonstrated that the proposed shape sonification significantly enhances localization accuracy. We were furthermore able to show that breast surgeons utilizing shape sonification experienced improved usability compared to the current clinical auditory feedback.
We showed evidence of the accuracy of auditory displays, reinforcing their potential as a substitution or addition to conventional, visual user interfaces. Our work presents an exemplary use case for shape sonification in a surgical precision task and hopefully helps to promote broader application of auditory displays and multimodal, e.g., audio-visual and audio-haptic, interfaces in surgical applications and beyond.
Acknowledgements.
We would like to thank the breast surgeons at Stanford Women’s Cancer Center for their feedback and support throughout this project. We would further like to thank the Stanford Department of Neuroscience and the Department of Radiology for providing the workspace, materials and devices needed to make this project possible.References
- (1)
- Alcañiz et al. (2022) Patricia Alcañiz, César Vivo de Catarina, Alessandro Gutiérrez, Jesús Pérez, Carlos Illana, Beatriz Pinar, and Miguel A Otaduy. 2022. Soft-tissue simulation of the breast for intraoperative navigation and fusion of preoperative planning. Frontiers in Bioengineering and Biotechnology 10 (2022), 976328.
- Alonso-Arevalo et al. (2012) Miguel A Alonso-Arevalo, Simon Shelley, Dik Hermes, Jacqueline Hollowood, Michael Pettitt, Sarah Sharples, and Armin Kohlrausch. 2012. Curve shape and curvature perception through interactive sonification. ACM Transactions on Applied Perception (TAP) 9, 4 (2012), 1–19.
- Auvray et al. (2007) Malika Auvray, Sylvain Hanneton, and J Kevin O’Regan. 2007. Learning to perceive with a visuo—auditory substitution system: localisation and object recognition with ‘The Voice’. Perception 36, 3 (2007), 416–430.
- Black et al. (2017) David Black, Julian Hettig, Maria Luz, Christian Hansen, Ron Kikinis, and Horst Hahn. 2017. Auditory feedback to support image-guided medical needle placement. International Journal of Computer Assisted Radiology and Surgery 12 (2017), 1655–1663.
- Bork et al. (2015) Felix Bork, Bernhard Fuers, Anja-Katharina Schneider, Francisco Pinto, Christoph Graumann, and Nassir Navab. 2015. Auditory and visio-temporal distance coding for 3-dimensional perception in medical augmented reality. In 2015 IEEE International Symposium on Mixed and Augmented Reality. IEEE, 7–12.
- Boyer et al. (2015) Eric O Boyer, Lucyle Vandervoorde, Frederic Bevilacqua, and Sylvain Hanneton. 2015. Touching sounds: audio virtual surfaces. In 2015 IEEE 2nd VR Workshop on Sonic Interactions for virtual Environments (SIVE). IEEE, 1–5.
- Buchholz et al. (2014) Thomas A Buchholz, Mark R Somerfield, Jennifer J Griggs, Souzan El-Eid, M Elizabeth H Hammond, Gary H Lyman, Ginny Mason, and Lisa A Newman. 2014. Margins for breast-conserving surgery with whole-breast irradiation in stage I and II invasive breast cancer: American Society of Clinical Oncology endorsement of the Society of Surgical Oncology/American Society for Radiation Oncology consensus guideline. Journal of clinical oncology 32, 14 (2014), 1502–1506.
- Costa et al. (2023) Nuno Costa, Luís Ferreira, Augusto RVF de Araújo, Bruno Oliveira, Helena R Torres, Pedro Morais, Victor Alves, and João L Vilaça. 2023. Augmented Reality-Assisted Ultrasound Breast Biopsy. Sensors 23, 4 (2023), 1838.
- Cox et al. (2016) Charles E Cox, Norbert Garcia-Henriquez, M Jordan Glancy, Pat Whitworth, John M Cox, Melissa Themar-Geck, Ronald Prati, Michelle Jung, Scott Russell, Kristie Appleton, et al. 2016. Pilot study of a new nonradioactive surgical guidance technology for locating nonpalpable breast lesions. Annals of surgical oncology 23 (2016), 1824–1830.
- De La Cruz et al. (2019) LM De La Cruz, PTR Thiruchelvam, J Shivani, J Trina, SA Blankenship, and CS Fisher. 2019. Saving the male breast: a systematic literature review of breast-conservation surgery for male breast cancer. Annals of Surgical Oncology 26 (2019), 3939–3944.
- De la Flor et al. (2022) Miriam De la Flor, Cinthia Delgado, Salomé Martínez, Meritxell Arenas, María Gómez, and Rosaura Reig. 2022. Rate of effect of surgical margins after breast conserving surgery and estimation of direct costs. Cirugía Española (English Edition) 100, 11 (2022), 702–708.
- Eiben et al. (2016) Björn Eiben, Vasileios Vavourakis, John H Hipwell, Sven Kabus, Thomas Buelow, Cristian Lorenz, Thomy Mertzanidou, Sara Reis, Norman R Williams, Mohammed Keshtgar, et al. 2016. Symmetric biomechanically guided prone-to-supine breast image registration. Annals of biomedical engineering 44 (2016), 154–173.
- Fentiman et al. (2006) Ian S Fentiman, Alain Fourquet, and Gabriel N Hortobagyi. 2006. Male breast cancer. The Lancet 367, 9510 (2006), 595–604.
- Fiebrink and Cook (2010) Rebecca Fiebrink and Perry R Cook. 2010. The Wekinator: a system for real-time, interactive machine learning in music. In Proceedings of The Eleventh International Society for Music Information Retrieval Conference (ISMIR 2010)(Utrecht), Vol. 3. Citeseer, 2–1.
- Figueras-Benítez et al. (2014) George Figueras-Benítez, Luis Urbano, A Acero, Monica Huerta, and Miguel Castro. 2014. Surgical navigation systems: A technological overview. In VII International Conference on Electrical Engineering, Vol. 1.
- Fisher et al. (2002) Bernard Fisher, Stewart Anderson, John Bryant, Richard G Margolese, Melvin Deutsch, Edwin R Fisher, Jong-Hyeon Jeong, and Norman Wolmark. 2002. Twenty-year follow-up of a randomized trial comparing total mastectomy, lumpectomy, and lumpectomy plus irradiation for the treatment of invasive breast cancer. New England Journal of Medicine 347, 16 (2002), 1233–1241.
- Gavaghan et al. (2008) David J Gavaghan, Jonathan P Whiteley, S Jonathan Chapman, J Michael Brady, and Pras Pathmanathan. 2008. Predicting tumor location by modeling the deformation of the breast. IEEE Transactions on Biomedical Engineering 55, 10 (2008), 2471–2480.
- Gerino et al. (2015) Andrea Gerino, Lorenzo Picinali, Cristian Bernareggi, Nicolò Alabastro, and Sergio Mascetti. 2015. Towards large scale evaluation of novel sonification techniques for non visual shape exploration. In Proceedings of the 17th International ACM SIGACCESS Conference on Computers & Accessibility. 13–21.
- Gholamalizadeh et al. (2017) Torkan Gholamalizadeh, Hossein Pourghaemi, Ahmad Mhaish, and Damien Jade Duff. 2017. Sonification of 3d object shape for sensory substitution: An empirical exploration. In 10ème conférence Advances in Computer-Human Interactions (ACHI2017). 18–24.
- Gouveia et al. (2021) Pedro F Gouveia, Joana Costa, Pedro Morgado, Ronald Kates, David Pinto, Carlos Mavioso, Joao Anacleto, Marta Martinho, Daniel Simoes Lopes, Arlindo R Ferreira, et al. 2021. Breast cancer surgery with augmented reality. The Breast 56 (2021), 14–17.
- Haloua et al. (2016) MH Haloua, JH Volders, NMA Krekel, E Barbé, C Sietses, K Jóźwiak, S Meijer, and MP Van den Tol. 2016. A nationwide pathology study on surgical margins and excision volumes after breast-conserving surgery: there is still much to be gained. The Breast 25 (2016), 14–21.
- Hart and Staveland (1988) Sandra G. Hart and Lowell E. Staveland. 1988. Development of NASA-TLX (Task Load Index): Results of Empirical and Theoretical Research. Advances in Psychology, Vol. 52. North-Holland, 139–183. https://doi.org/10.1016/S0166-4115(08)62386-9
- Isaacs et al. (2016) Abby J Isaacs, Mary L Gemignani, Andrea Pusic, and Art Sedrakyan. 2016. Association of breast conservation surgery for cancer with 90-day reoperation rates in New York state. JAMA surgery 151, 7 (2016), 648–655.
- Jeevan et al. (2012) R Jeevan, DA Cromwell, M Trivella, G Lawrence, O Kearins, J Pereira, C Sheppard, CM Caddy, and JHP Van Der Meulen. 2012. Reoperation rates after breast conserving surgery for breast cancer among women in England: retrospective study of hospital episode statistics. British Medical Journal 345 (2012).
- Kasem and Mokbel (2020) Iham Kasem and Kefah Mokbel. 2020. Savi Scout® radar localisation of non-palpable breast lesions: systematic review and pooled analysis of 842 cases. Anticancer Research 40, 7 (2020), 3633–3643.
- Krekel et al. (2011) Nicole Krekel, Barbara Zonderhuis, Sandra Muller, Herman Bril, Henk-Jan van Slooten, Elly de Lange de Klerk, Petrousjka van den Tol, and Sybren Meijer. 2011. Excessive resections in breast-conserving surgery: a retrospective multicentre study. The Breast Journal 17, 6 (2011), 602–609.
- Lan et al. (2018) Lu Lan, Yan Xia, Rui Li, Kaiming Liu, Jieying Mai, Jennifer Anne Medley, Samilia Obeng-Gyasi, Linda K Han, Pu Wang, and Ji-Xin Cheng. 2018. A fiber optoacoustic guide with augmented reality for precision breast-conserving surgery. Light: Science & Applications 7, 1 (2018), 2.
- Landercasper et al. (2014) Jeffrey Landercasper, Eric Whitacre, Amy C Degnim, and Mohammed Al-Hamadani. 2014. Reasons for re-excision after lumpectomy for breast cancer: insight from the American Society of Breast Surgeons Mastery SM database. Annals of Surgical Oncology 21 (2014), 3185–3191.
- Lewis (2018) James R. Lewis. 2018. The System Usability Scale: Past, Present, and Future. International Journal of Human–Computer Interaction 34, 7 (2018), 577–590.
- Mango et al. (2016) Victoria Mango, Richard Ha, Ameer Gomberawalla, Ralph Wynn, and Sheldon Feldman. 2016. Evaluation of the SAVI SCOUT surgical guidance system for localization and excision of nonpalpable breast lesions: a feasibility study. American journal of roentgenology 207, 4 (2016), W69–W72.
- Matinfar et al. (2022) Sasan Matinfar, Mehrdad Salehi, Daniel Suter, Matthias Seibold, Navid Navab, Shervin Dehghani, Florian Wanivenhaus, Philipp Fürnstahl, Mazda Farshad, and Nassir Navab. 2022. Sonification as a Reliable Alternative to Conventional Visual Surgical Navigation. arXiv preprint arXiv:2206.15291 (2022).
- McCahill et al. (2012) Laurence E McCahill, Richard M Single, Erin J Aiello Bowles, Heather S Feigelson, Ted A James, Tom Barney, Jessica M Engel, and Adedayo A Onitilo. 2012. Variability in reexcision following breast conservation surgery. Jama 307, 5 (2012), 467–475.
- McEvoy et al. (2018) Maureen P McEvoy, Jeffrey Landercasper, Himani R Naik, and Sheldon Feldman. 2018. Update of the American Society of Breast Surgeons Toolbox to address the lumpectomy reoperation epidemic. Gland Surgery 7, 6 (2018), 536.
- Meijer (1992) Peter BL Meijer. 1992. An experimental system for auditory image representations. IEEE Transactions on Biomedical Eengineering 39, 2 (1992), 112–121.
- Oglat et al. (2018) Ammar A Oglat, MZ Matjafri, Nursakinah Suardi, Mohammad A Oqlat, Mostafa A Abdelrahman, Ahmad A Oqlat, Omar F Farhat, Batool N Alkhateb, Raed Abdalrheem, Muntaser S Ahmad, et al. 2018. Chemical items used for preparing tissue-mimicking material of wall-less flow phantom for doppler ultrasound imaging. Journal of medical ultrasound 26, 3 (2018), 123.
- Perkins (2020) Stephanie Liu Perkins. 2020. A Mixed-Reality System for Breast Surgical Planning in the Operating Room: Magnetic Resonance Imaging Development and Initial Clinical Evaluation. Stanford University.
- Perkins et al. (2017) Stephanie L. Perkins, Michael A. Lin, Subashini Srinivasan, Amanda J. Wheeler, Brian A. Hargreaves, and Bruce L. Daniel. 2017. A Mixed-Reality System for Breast Surgical Planning. In 2017 IEEE International Symposium on Mixed and Augmented Reality (ISMAR-Adjunct). 269–274.
- Roodaki et al. (2017) Hessam Roodaki, Navid Navab, Abouzar Eslami, Christopher Stapleton, and Nassir Navab. 2017. Sonifeye: Sonification of visual information using physical modeling sound synthesis. IEEE transactions on Visualization and Computer Graphics 23, 11 (2017), 2366–2371.
- Samani et al. (2001) Abbas Samani, Jonathan Bishop, Martin J Yaffe, and Donald B Plewes. 2001. Biomechanical 3-D finite element modeling of the human breast using MRI data. IEEE transactions on medical imaging 20, 4 (2001), 271–279.
- Sanchez (2010) Javier Sanchez. 2010. Recognizing shapes and gestures using sound as feedback. In CHI’10 Extended Abstracts on Human Factors in Computing Systems. 3063–3068.
- Schulman et al. (2017) Amanda M Schulman, Jennifer A Mirrielees, Glen Leverson, Jeffrey Landercasper, Caprice Greenberg, and Lee G Wilke. 2017. Reexcision surgery for breast cancer: an analysis of the American Society of Breast Surgeons (ASBrS) Mastery SM database following the SSO-ASTRO “no ink on tumor” guidelines. Annals of Surgical Oncology 24 (2017), 52–58.
- Schütz et al. (2022) Laura Schütz, Emmanuelle Weber, Wally Niu, Bruce Daniel, Jennifer McNab, Nassir Navab, and Christoph Leuze. 2022. Audiovisual augmentation for coil positioning in transcranial magnetic stimulation. Computer Methods in Biomechanics and Biomedical Engineering: Imaging & Visualization (2022), 1–8.
- Shin et al. (2017) Young Duck Shin, Young Jin Choi, Dae Hoon Kim, Sung Su Park, Hanlim Choi, Dong Ju Kim, Sungmin Park, Hyo Yung Yun, and Young Jin Song. 2017. Comparison of outcomes of surgeon-performed intraoperative ultrasonography-guided wire localization and preoperative wire localization in nonpalpable breast cancer patients undergoing breast-conserving surgery: a retrospective cohort study. Medicine 96, 50 (2017).
- Sokal et al. (1963) Robert R Sokal, Peter Henry Andrews Sneath, et al. 1963. Principles of numerical taxonomy. Principles of numerical taxonomy. (1963).
- Soni et al. (2023) Abhishek Soni, Diptajit Paul, Monica Verma, Paramjeet Kaur, Ashok Chauhan, and Vivek Kaushal. 2023. Male breast cancer: a budding and unaddressed issue. Oncology in Clinical Practice (2023).
- Tayeh et al. (2020) Salim Tayeh, Ritika Gera, Nicholas Perry, Michael Michell, Anmol Malhotra, and Kefah Mokbel. 2020. The use of magnetic seeds and radiofrequency identifier tags in breast surgery for non-palpable lesions. Anticancer Research 40, 1 (2020), 315–321.
- Tommasini et al. (2022) Fabián C Tommasini, Diego A Evin, Fernando Bermejo, Mercedes X Hüg, M Virginia Barrios, and Augusto Pampaluna. 2022. Recurrence analysis of sensorimotor trajectories in a minimalist perceptual task using sonification. Cognitive Processing 23, 2 (2022), 285–298.
- van den Doel et al. (2004) Kees van den Doel, Daniel Smilek, Adam Bodnar, Christian Chita, Richard Corbett, Dmitry Nekrasovski, and Joanna McGrenere. 2004. Geometric shape detection with soundview. In Proceedings of ICAD 04-Tenth Meeting of the International Conference on Auditory Display.
- Wang et al. (2003) Ge Wang, Perry R Cook, et al. 2003. ChucK: A concurrent, on-the-fly, audio programming language. In Proceedings of the 2003 International Computer Music Conference.
- Wazir et al. (2020) Umar Wazir, Salim Tayeh, Nicholas Perry, Michael Michell, Anmol Malhotra, and Kefah Mokbel. 2020. Wireless breast localization using radio-frequency identification tags: the first reported European experience in breast cancer. In Vivo 34, 1 (2020), 233–238.
- Wehring et al. (2023) Spencer Wehring, Ashley Roark, Alfred Watson Jr, and Tamara Ortiz-Perez. 2023. Pictorial Review of Male Breast Disease. Current Breast Cancer Reports (2023), 1–16.
- Wilke et al. (2014) Lee G Wilke, Tomasz Czechura, Chih Wang, Brittany Lapin, Erik Liederbach, David P Winchester, and Katharine Yao. 2014. Repeat surgery after breast conservation for the treatment of stage 0 to II breast carcinoma: a report from the National Cancer Data Base, 2004-2010. JAMA surgery 149, 12 (2014), 1296–1305.
- Wright (2005) Matthew Wright. 2005. Open Sound Control: an enabling technology for musical networking. Organised Sound 10, 3 (2005), 193–200.
- Yoshida et al. (2011) Tsubasa Yoshida, Kris M Kitani, Hideki Koike, Serge Belongie, and Kevin Schlei. 2011. EdgeSonic: image feature sonification for the visually impaired. In Proceedings of the 2nd Augmented Human International Conference. 1–4.
- Ziemer et al. (2017) Tim Ziemer, David Black, and Holger Schultheis. 2017. Psychoacoustic sonification design for navigation in surgical interventions. In Proceedings of Meetings on Acoustics 173EAA, Vol. 30. Acoustical Society of America, 050005.