ChartBench: A Benchmark for Complex Visual Reasoning in Charts
Abstract
Multimodal Large Language Models (MLLMs) demonstrate impressive image understanding and generating capabilities. However, existing benchmarks employ limited charts that deviate from real-world scenarios, posing challenges in accurately assessing the chart comprehension of MLLMs. To overcome this constraint, we propose ChartBench, an exhaustive chart benchmark specifically designed to evaluate MLLMs’ chart comprehension and data reliability through complex visual reasoning. ChartBench encompasses a wide spectrum, including 42 categories, 2.1K charts, and 16.8K question-answer pairs. Diverging from previous benchmarks, ChartBench avoids employing data point annotation charts or metadata prompts directly. Instead, it compels MLLMs to derive values akin to human understanding by leveraging inherent chart elements such as color, legends, or coordinate systems. Additionally, we propose an enhanced evaluation metric, Acc+, which facilitates the evaluation of MLLMs without needing labor-intensive manual efforts or costly evaluations based on GPT. Our extensive experimental evaluation involves 12 widely-used open-sourced and 2 proprietary MLLMs, revealing the limitations of MLLMs in interpreting charts and providing valuable insights to encourage closer scrutiny of this aspect.
1 Introduction
In light of the groundbreaking advancements in Large Language Models (LLMs) (Radford et al., 2021; Brown et al., 2020; Chowdhery et al., 2023; Touvron et al., 2023a), Multimodal Large Language Models (MLLMs) (Li et al., 2023c; Liu et al., 2023b; Zhu et al., 2023) have emerged as the predominant approach in the realm of multimodal learning, exhibiting powerful perceptual and reasoning abilities. Notably, the MLLMs demonstrate a strong grasp of the overall visual semantic comprehension and can even appreciate the humor in memes (OpenAI, 2023; Wang et al., 2023). However, MLLMs still face challenges in effectively reading, comprehending, and summarizing articles that contain embedded charts (Masry et al., 2022; Han et al., 2023; Li and Tajbakhsh, 2023). In contrast to natural images, which are typically construed based on discernible objects, relative positions, or interactions, charts convey nuanced semantic meanings through visual logic such as trend lines or color-coded legends. They provide detailed and intricate data narratives in visual formats. Hence, it is essential to assess the chart comprehension ability and data reliability of MLLMs in understanding these visual representations.
Prior works like ChartQA (Masry et al., 2022) have tried to address this issue, but suffer from some limitations. 1) They primarily focus on the 3 regular chart types (e.g., line, pie, and bar charts), neglecting more intricate formats such as scatter or combination charts which are equally prevalent in real-world scenarios. Robust MLLMs should be able to adeptly handle a diverse of chart types. 2) They heavily depend on point annotation charts or meta table data as textual prompts (Masry et al., 2022; Han et al., 2023) to evaluate MLLMs, where they can easily obtain candidate answers and overlook the charts’ visual logic. 3) The employed evaluation metrics (judgment or fill-in-the-blank questions accompanied by lenient error ranges), potentially yield inflated baseline performance, which is required to be refined to enhance assessment objectivity and precision.
We propose ChartBench to scale up chart types and assess the chart perception and conception capabilities of MLLMs. As shown in Figure 1, ChartBench gathers over 2000 topics and corresponding data crawling from web sources or generated by GPTs (Radford et al., 2019). Our ChartBench encompasses 9 major categories and 42 subcategories of charts (see appendix for visualizations), which are created by auto-drawing tools or Matplotlib. Like charts in Figure 1, ChartBench strives to minimize data point annotated charts, thereby demanding MLLMs to engage in intricate visual logical reasoning. MLLMs are expected to derive the values of queried entities by utilizing color or coordinates, without resorting to OCR for generating answer candidates.
ChartBench provides thorough assessments covering both the perception and conception aspects. The evaluation includes 4 distinct categories of chart question-answering tasks: Chart Type Recognition (CR), Value Extraction (VE), Value Comparison (VC), and Global Conception (GC) (refer to Figure. 3 for visualizations). To ensure rigorous and precise evaluations, we introduce a new metric Acc+ inspired by MME (Fu et al., 2023a). The Acc+ metric requires MLLMs to provide accurate judgments for both positive and negative perspectives for the base assertions. This novel metric offers two advantages. 1) it strives to maintain consistency between positive and negative queries, differing solely in the Ground Truth (GT) value. This precautionary measure minimizes the likelihood of lucky guesses resulting from random choices, as MLLMs might produce the same responses for both query types if they fail to comprehend the chart. 2) the GT values for negative queries are derived from other data within the same chart, eliminating unrealistic scenarios and enhancing the validity of the evaluation process.
We evaluate the zero-shot performance of 12 mainstream open-sourced and 2 closed-sourced MLLMs. The findings indicate that MLLMs generally demonstrate limited reasoning abilities when faced with complex charts, raising concerns about the reliability of their data interpretation. Even high-performing MLLMs like GPT-4V (OpenAI, 2023) require multi-step manual guidance to reach accurate answers, as illustrated in the appendix. A detailed examination of ChartBench sheds light on the reasons behind the suboptimal performance of MLLMs on charts, highlighting the meticulous curation of ChartBench to explore the nuances of chart reasoning. Additionally, we propose a handcrafted Chain-of-Thought (CoT) prompt called ChartCoT (see Figure. 4) to guide MLLMs in interpreting charts akin to human understanding. This straightforward yet effective enhancement is intended to stimulate more innovative proposals in future studies. Our contributions can be summarized as follows:
-
•
We introduce ChartBench, significantly expanding the variety and quantity of chart types. Notably, ChartBench avoids direct labeling of data points or using table data as textual prompts, promoting MLLMs to derive answers through visual reasoning.
-
•
We propose a novel Acc+ metric to significantly reduce randomly guessing cases, providing a more accurate and efficient evaluation method.
-
•
We present a simple yet effective baseline ChartCoT that guides MLLMs to interpret charts more similarly to humans. ChartCoT also leads to a significant improvement in MLLMs’ chart comprehension abilities.
-
•
Through extensive experiments, we demonstrate that existing MLLMs exhibit inadequacies in chart comprehension. These findings unveil potential directions for optimizing future MLLMs in this aspect.
2 Related Works
2.1 Multi-modal LLMs
Since the emergence of Transformer (Vaswani et al., 2017), LLMs have developed explosively (Radford et al., 2018; Brown et al., 2020; Zhang et al., 2022; Chowdhery et al., 2023; Touvron et al., 2023a, b). With instruction tuning, LLMs can bridge the gap between the autoregressive prediction training objective and the goal of following human instructions (Ouyang et al., 2022; Li et al., 2023a; Wang et al., 2022). By extending LLMs to multi-modal learning area, MLLMs have emerged as the dominant approach. VisualGPT (Chen et al., 2022) shows promising results in utilizing LLMs as Vision-Language (V-L) decoders. Flamingo (Alayrac et al., 2022) aligns features from a frozen vision encoder within a pre-trained LLM, exhibiting excellent few-shot learning capabilities. BLIP2 (Li et al., 2023c) proposes Q-Former to efficiently align features from vision encoder and LLM by multiple pertaining objectives. Mini-GPT4 (Zhu et al., 2023; Chen et al., 2023a), mPLUG-Owl (Ye et al., 2023a), and InstructBLIP (Dai et al., 2023) extend language-only instruction tuning to multi-modal tasks using Q-Former. LLaVA (Liu et al., 2023b, a) maps visual features into the LLaMA embedding space by a linear projection layer, while concurrently fine-tuning with LLaMA (Touvron et al., 2023a). The closed-source Baidu ERNIE 111Baidu ERNIE: https://yiyan.baidu.com/ and GPT-4V (OpenAI, 2023) further demonstrate satisfactory image understanding capabilities. Despite the impressive achievements of existing MLLMs (Ding et al., 2021; Du et al., 2022; Zhang et al., 2023; Bai et al., 2023b; Chen et al., 2023b; Lin et al., 2023) in common multi-modal tasks like VQA (Antol et al., 2015) and image captioning (Vinyals et al., 2015), their emphasis lies predominantly on images in the broader context, neglecting the comprehension of chart data in specialized domains. Only limited research (Masry et al., 2022; Li and Tajbakhsh, 2023; Han et al., 2023) has focused on the chart comprehension of MLLMs.
2.2 Multi-modal Benchmarks
MLLMs have been evaluated on numerous traditional benchmarks (Goyal et al., 2017; Hudson and Manning, 2019; Xu et al., 2023; Ye et al., 2023b; Fu et al., 2023a; Yu et al., 2023; Li et al., 2023b; Liu et al., 2023c), which typically cover generic-world data, while largely ignoring the requirement for complex visual chart understanding and reasoning. HallusionBench (Guan et al., 2023) exposes the susceptibility of formidable models like GPT-4V (OpenAI, 2023) and LLaVA-1.5 (Liu et al., 2023a) to severe V-L hallucinations when confronted with complex charts. VisText (Tang et al., 2023) introduces a comprehensive benchmark, which incorporates multi-level and fine-grained chart labelling, covering aspects such as chart construction, summary statistics, relations, and complex trends. However, its chart variety is limited. SciCap (Hsu et al., 2021), Chart2Text (Kantharaj et al., 2022), AutoChart (Zhu et al., 2021), and ChartSumm (Rahman et al., 2023) address chart-to-text summarization tasks. However, these approaches either rely on small datasets that require costly manual labelling, or generate rigid templates that are challenging to apply in practical scenarios. ChartQA (Masry et al., 2022) and PlotQA (Methani et al., 2020) examine the numerical reading abilities of MLLMs, but their difficulty level is low, as MLLMs are only require OCR to obtain suitable candidate answers. In contrast, our ChartBench provides more diverse charts and challenging questions, demanding MLLMs to thoroughly comprehend the visual information conveyed by the charts.
3 ChartBench
This section presents detailed explanations of the ChartBench. Unlike existing benchmarks, ChartBench focuses primarily on perception capability and visual logical reasoning ability. Specifically, we emphasize evaluating the value extraction capability of unlabeled data in charts, rather than straightforward OCR or localization problems. We evaluate the MLLMs’ fundamental visual reasoning ability directly, without converting the charts into textual descriptions and conducting further textual reasoning.
| Benchmarks | Types | Charts | QAs | Visual |
| ChartQA | 3 | 1.6K | 2.5K | ✗ |
| PlotQA | 3 | 33.6K | 4.3M | ✗ |
| ChartLlama | 10 | 2.1K | 3.5K | ✗ |
| ChartBench (ours) | 42 | 2.1K | 16.8K | ✓ |
3.1 Design Principles
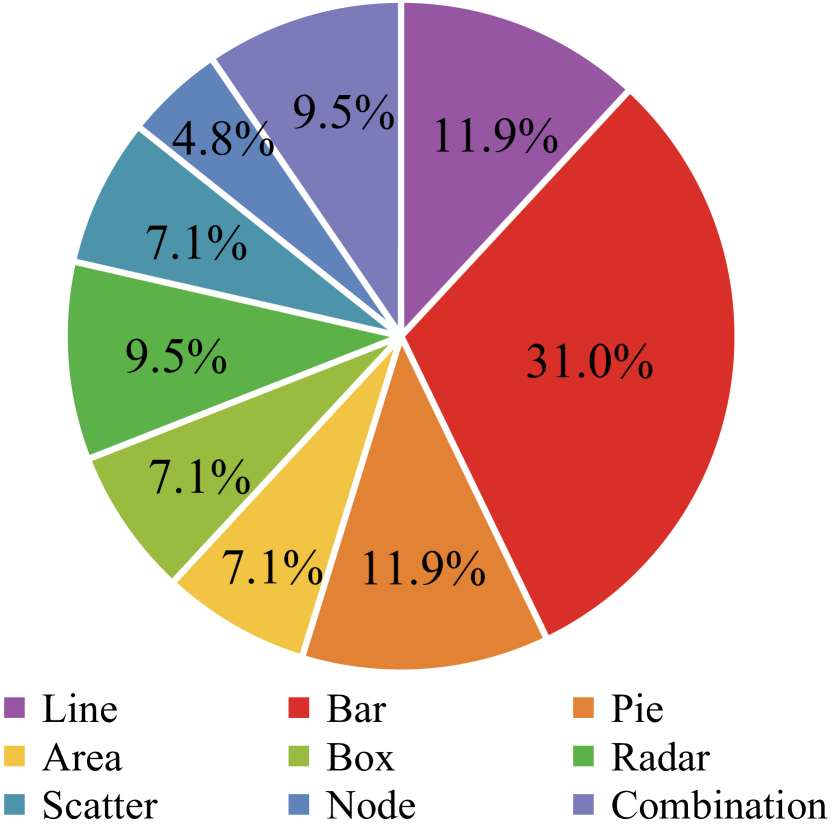
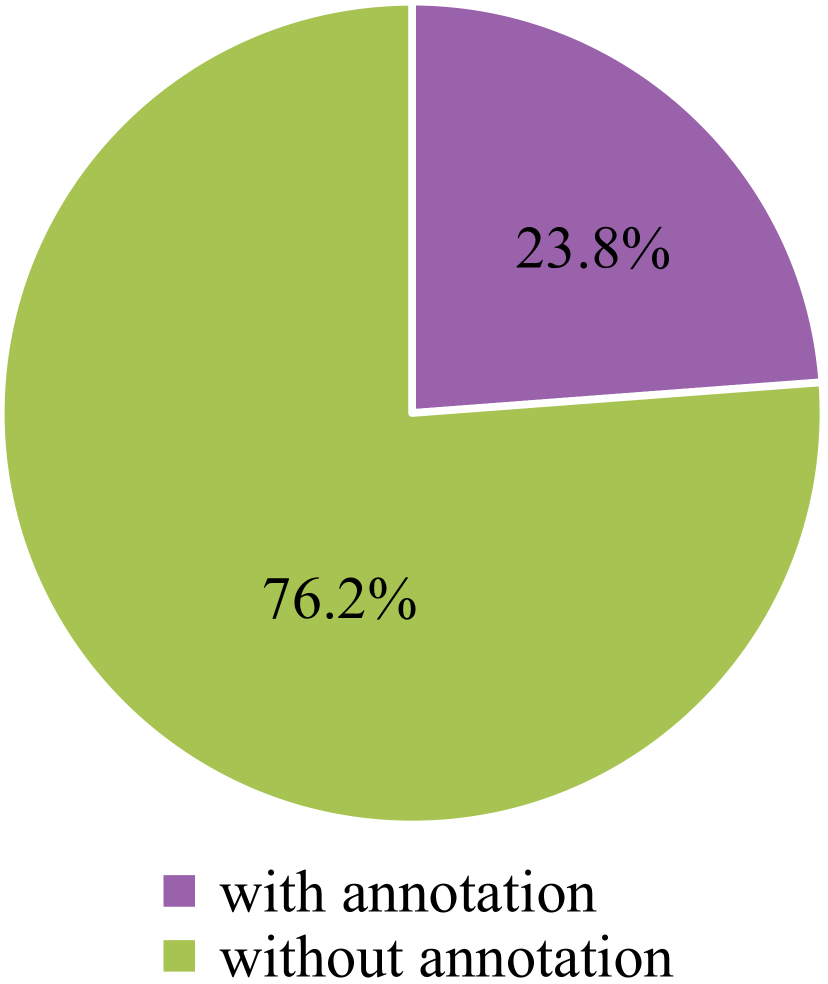
ChartBench distinguishes itself from existing benchmarks through two fundamental design principles. 1) Wider range of chart types. ChartBench expands the 3 common chart types (line, bar, and pie) in ChartQA to a representative set of 9 chart types in the real world (see Figure. 1&2(a)). The regular categories constitute 54.8% while the newly added categories account for 45.2%. ChartBench further subdivides each major category into multiple subcategories, enabling a more fine-grained analysis of MLLM performance. 2) More intuitive visual logic. Previous benchmarks only provide annotated charts, even including the metatable data as input prompts, allowing MLLMs to infer correct answers based solely on textual logic. In contrast, ChartBench includes a larger proportion of unlabeled charts (accounting for 76.2% in Figure. 2(b)). Take the chart in Figure. 3 for example. MLLMs are required to depend on the color or point shape to recognize categories and their corresponding coordinate systems, and accurately determine values similar to humans, instead of solely relying on OCR for extraction. This pipeline provides a more realistic assessment of MLLMs’ ability in chart visual reasoning.
3.2 Data Source and Preparation
To design charts that closely resemble the real world, we collect multiple sets of themes and data suitable for scientific research from Kaggle. To ensure data privacy and security, we anonymize all real names or other identifiable entities. To ensure a diverse range of charts, we carefully curate various data formats and predominantly rely on online plotting websites specifically designed for scientific research purposes, enabling us to create authentic charts. To ensure a diverse range of chart types, we utilize ChatGPT (Radford et al., 2019) to generate virtual yet realistic themes and data and complement this with Matplotlib to enhance chart diversity further. Subsequently, we undergo expert review to eliminate defective samples (e.g., label occlusions). This process yields both the metadata and rendered chart images.
3.3 Chart Taxonomy
Previous benchmarks (e.g., ChartQA (Masry et al., 2022)) lack chart diversity and focus mainly on the bar, line, and pie charts. To address it, ChartBench provides a total of 9 major categories (see Figure.2(a) for distributions) and 42 subcategories of charts, including regular and specialized ones. Importantly, ChartBench collects numerous unannotated charts. Hence, MLLMs are required to infer with visual logic based on chart legends, axis correspondences, and other visual cues. To facilitate more comprehensive comparisons, we introduce dedicated categories with annotated data for each major class (see Figure.2(b) for distributions), aligning with the approach taken in ChartQA. Especially, ChartBench primarily focuses on 1) regular charts including line, bar, and pie plots; 2) addition charts including scatter, radar, area, node, box, and combination charts. Please refer to the appendix for detailed descriptions and thumbnail visualizations.
3.4 Automatic QA Generation
Specifically, ChartBench focuses on the MLLMs’ ability in two categories: perception and conception (Fu et al., 2023a). Perception tasks primarily entail perceiving and processing raw data to extract valuable features and information. Conversely, cognitive tasks involve processing and comprehending abstract concepts and higher-level information.
Perception tasks
primarily encompass two types of QAs: 1) Chart type Recognition (CR, Figure. 3 A) task aims to evaluate the MLLMs’ capability to identify chart types accurately. 2) Value Extraction (VE, Figure. 3 B) task aims to assess whether MLLMs can correctly extract the relevant values when confronted with complex visual logic. Without annotated data, MLLMs are required to rely on legends, axes, and corresponding graphical elements to provide answers.
Conception tasks
include two types of QAs: 1) Value Comparison (VC, Figure. 3 C) task assesses the visual reasoning of MLLMs, wherein they are not required to recognize all the chart’s metadata. Instead, they solely rely on the graphical elements to ascertain the comparison answer. 2) Global Conception (GC, Figure. 3 D) task assesses the capacity to perceive global indicators, such as maximum values, from a holistic standpoint. Importantly, the MLLMs are not required to identify all the chart metadata or element layouts. On the contrary, simply observing graphic elements and identifying key components is sufficient to arrive at accurate conclusions.
| Models | Regular Type | Extra Type | Acc+ | |||||||
| Line | Bar | Pie | Area | Box | Radar | Scatter | Node | Combin. | ||
| Open source MLLMs | ||||||||||
| VisualGLM | 10.80 | 1.96 | 0.00 | 1.17 | 8.50 | 0.25 | 3.33 | 15.50 | 5.13 | 3.79 |
| Shikra | 7.40 | 10.62 | 4.50 | 6.00 | 11.33 | 11.88 | 4.17 | 8.50 | 3.63 | 8.11 |
| InstructBLIP | 24.40 | 15.04 | 19.10 | 4.33 | 7.33 | 2.00 | 12.50 | 9.00 | 2.38 | 12.49 |
| CogVLM | 10.50 | 14.58 | 17.90 | 12.50 | 9.67 | 16.00 | 14.33 | 16.00 | 6.13 | 13.30 |
| Internlm-XComposer | 16.00 | 20.42 | 21.50 | 4.50 | 14.50 | 15.00 | 12.00 | 8.50 | 5.13 | 15.49 |
| SPHINX | 18.40 | 15.54 | 23.40 | 12.00 | 8.17 | 19.00 | 17.17 | 31.00 | 25.88 | 17.89 |
| BLIP2 | 29.60 | 17.35 | 24.90 | 6.17 | 10.67 | 17.63 | 22.00 | 33.00 | 28.00 | 20.24 |
| ChartLlama | 28.90 | 19.35 | 22.10 | 16.50 | 13.33 | 25.00 | 28.50 | 25.50 | 26.38 | 22.26 |
| MiniGPT-v2 | 26.70 | 21.54 | 20.20 | 21.67 | 24.67 | 25.88 | 28.17 | 15.50 | 27.13 | 23.55 |
| LLaVA-v1.5 | 34.40 | 24.73 | 19.10 | 26.83 | 25.67 | 28.63 | 26.00 | 33.50 | 27.38 | 26.39 |
| mPLUG-Owl-bloomz | 37.50 | 24.73 | 26.10 | 21.33 | 25.83 | 26.50 | 24.17 | 28.50 | 27.50 | 26.78 |
| Qwen-VL-Chat | 41.00 | 20.96 | 40.00 | 28.83 | 24.17 | 35.00 | 19.50 | 18.50 | 25.50 | 28.18 |
| Closed source MLLMs | ||||||||||
| ERNIE | 44.00 | 45.00 | 57.00 | 45.00 | 30.00 | 40.00 | 51.67 | 70.00 | 56.25 | 46.95 |
| GPT-4V | 74.00 | 41.54 | 63.00 | 33.30 | 46.67 | 57.50 | 70.00 | 100.00 | 56.25 | 54.39 |
3.5 Evaluate Metrics
To quantitatively analyze the performance of MLLMs, we have explored various instruction designs and evaluation metrics. Acknowledging the potential variability in MLLMs’ adherence to instructions, we employ the yes/no metric in MME (Fu et al., 2023a), which is posed from both positive and negative perspectives.
Improved Acc+.
Considering a base query and chart , we expend the to right and wrong judgement with the given query prompt. ChartBench requires the MLLM to determine whether the queries are correct or not and provide boolean outputs and . Because of the concise output constraint, no additional language model is required to determine the output (like GPT score (Fu et al., 2023b)). Instead, we directly employ regular expression matching to ascertain the model’s reply. Note that 1) and only differ on the GT value, which yields similar sentence token sequences. 2) Obtaining and involves two independent inferences, not sequential ones. 3) the non-GT in is randomly selected from the metadata. Based on the definitions, we propose the improved Acc+ metric. Given base queries in ChartBench, we have:
| (1) |
where , and are and, not and indicator function, respectivly. Only when the MLLM accurately answers questions and simultaneously can one ascertain its genuine comprehension of the query chart.
Confusion Rate (CoR).
Based on the Acc+, we further propose the CoR metric to evaluate the cases in which MLLMs fail to understand the chart. Given a chart and base query, the only difference between positive and negative is the numerical value of the ground truth. Hence, the queried textual features are quite similar, causing MLLMs to provide identical responses for both positive and negative if they fail to understand the chart .
| (2) |
where is the XOR operation. Generally, the expected probability of random guessing is 25% for vanilla Acc+. However, for the MLLM that has insufficient chart recognition capabilities, the CoR tends to be 100%, and thus the Acc+ tends to be 0% instead of 25% baseline.
3.6 ChartCoT
As shown in Figure. 4, we propose a simple yet effective baseline (ChartCoT) based on Chain of Thought (Wei et al., 2022) to enhance the visual reasoning capability without parameter training. Specifically, we design a series of questions that decompose user inquiries and employ prompts to guide MLLMs to imitate human visual reasoning for chart recognition. It is highly effective in scenarios where table data or OCR is not available. More intuitive approaches would be to directly instruct tune with the ChartBench data. However, this would result in data leakage and unfair comparisons on ChartBench, as observed in ChartLlama (Han et al., 2023) and MVBench (Li et al., 2023d).
4 Experiments
4.1 Implementation Details
We locally deploy 12 open-source MLLMs and conduct evaluations on A100-40G GPUs. The details of each MLLM can be found in the appendix, including inference speed and memory cost. To maintain consistency, we strictly utilize a single GPU to evaluate the Chat version of each MLLM with the corresponding system prompt. We employ the zero-shot evaluation manner to avoid any potential data leakage and guarantee fair comparisons. It is to highlight that the choice of prompts remarkably influences the MLLMs’ response. Hence, we extensively conduct experiments with several commonly used prompts (see detail in the appendix) and select the one yielding the best Acc+ metric.
4.2 Models
We evaluate 12 main-stream open-source models and 2 closed-source models using ChartBench. The open-source models include BLIP2 (Li et al., 2023c), CogVLM-Chat (Wang et al., 2023), InstructBLIP (Dai et al., 2023), InternLM-XComposer (Zhang et al., 2023), LLaVA-v1.5 (Liu et al., 2023a), MiniGPT-v2 (Chen et al., 2023a), mPLUG-Owl-bloomz (Ye et al., 2023a), Qwen-VL-Chat (Bai et al., 2023b), Shikra (Chen et al., 2023b), SPHINX (Lin et al., 2023), VisualGLM (Du et al., 2022; Ding et al., 2021), ChartLlama (Han et al., 2023), while the closed-source models contain Baidu ERNIE and GPT-4V OpenAI (2023). We compile the architecture and size of the open-source models and provide information on the memory usage and inference time in the appendix. To keep it concise, we group bridge modules like Qformer under the Visual branch. Note that the closed-source models do not provide efficient multi-model APIs, so we randomly sample 1/10 charts and QA pairs from each sub-group for manual evaluation.
4.3 Qualitative results
Results of Chart Types.
Table. 2 illustrates the performance of MLLMs across different types of charts as well as the overall Acc+ metric. In general, the current MLLMs demonstrate limited proficiency in chart recognition and encounter significant challenges. For certain chart types (e.g., radar or combination chart), some MLLMs achieve close to 0% Acc+, indicating their inability to extract key information from charts and insensitivity to both positive and negative interrogations. Note that the Acc+ metric approaches 0% under random guessing, as discussed in Section 3.5. We also provide results of the vanilla accuracy metric in the appendix, where the metric baseline should be 50%.
Specifically, Qwen-VL-Chat and mPLUG-Owl demonstrate satisfying chart recognition capabilities, which may be attributed to their instruct tuning chart data. The corresponding performance falls short in comparison to their reported results in ChartQA (Masry et al., 2022; Han et al., 2023). Because their chart recognition relies on OCR ability rather than robust visual logical reasoning. In ChartBench, the proportion of annotated charts is notably low (23.8% in Figure. 2(b)) and thus the majority of queries demand MLLMs to employ visual logical reasoning, which is quite challenging for these models. VisualGLM and Shikra perform poorly, possibly due to their smaller LLM sizes and weaker visual encoding branches. MLLMs exhibit satisfactory performance on regular charts, but there is still substantial potential for improvement when it comes to handling more intricate graphics.
Results of Task Types.
Table. 3 presents the performance of MLLMs on perception and conception tasks, which are introduced in Section 3.4. All MLLMs achieve high performance on the CR task, indicating their ability to recognize basic chart types. LLaVA-v1.5, mPLUG-Owl, and Qwen-VL-Chat demonstrate significant advantages in the VC and GC conception tasks, benefiting from their chart-tuning data. VE is the most challenging task, which is the key distinction between ChartBench and ChartQA. VE task cannot be resolved merely through basic OCR and demands a series of visual and textual logical reasoning steps to reach the ultimate answer. Despite demonstrating strong overall performance, models like BLIP2 and ChartLlama struggle with the VE task. This observation emphasizes the requisition to prioritize and enhance these MLLMs’ visual logical reasoning capabilities. Closed-source models outperform open-source models, partly due to their larger model size and broader data coverage. Additionally, they leverage additional recognition tools rather than end-to-end inference, which is further elaborated in the appendix.
| Models | Task Type | Acc+ | |||
| CR | VE | VC | GC | ||
| Open source MLLMs | |||||
| VisualGLM | 15.17 | 0.00 | 0.00 | 0.00 | 3.79 |
| Shikra | 2.15 | 11.90 | 10.63 | 7.76 | 8.11 |
| InstructBLIP | 49.90 | 0.00 | 0.05 | 0.00 | 12.49 |
| CogVLM | 29.41 | 2.39 | 14.29 | 7.12 | 13.30 |
| Internlm-XComposer | 42.59 | 6.98 | 2.49 | 9.90 | 15.49 |
| SPHINX | 38.15 | 9.90 | 14.15 | 9.37 | 17.89 |
| BLIP2 | 59.51 | 3.85 | 13.95 | 3.66 | 20.24 |
| ChartLlama | 49.51 | 8.34 | 20.54 | 10.63 | 22.26 |
| MiniGPT-v2 | 29.02 | 22.29 | 24.59 | 18.29 | 23.55 |
| LLaVA-v1.5 | 46.98 | 15.90 | 26.15 | 16.54 | 26.39 |
| mPLUG-Owl-bloomz | 32.20 | 23.02 | 25.37 | 26.54 | 26.78 |
| Qwen-VL-Chat | 52.54 | 10.78 | 27.46 | 21.95 | 28.18 |
| Closed source MLLMs | |||||
| ERNIE | 65.37 | 43.90 | 32.20 | 46.34 | 46.95 |
| GPT-4V | 96.10 | 29.27 | 47.32 | 44.88 | 54.39 |
| Models | Task Type | CoR | |||
| CR | VE | VC | GC | ||
| Open source MLLMs | |||||
| VisualGLM | 80.20 | 99.81 | 99.90 | 99.85 | 94.94 |
| Shikra | 94.25 | 77.56 | 83.46 | 80.73 | 84.00 |
| InstructBLIP | 36.05 | 100.00 | 99.80 | 99.90 | 83.94 |
| CogVLM | 69.36 | 94.88 | 80.58 | 90.49 | 83.83 |
| ChartLlama | 78.48 | 84.98 | 73.32 | 84.68 | 80.36 |
| Internlm-XComposer | 56.64 | 84.87 | 96.54 | 77.95 | 79.00 |
| BLIP2 | 37.51 | 91.07 | 80.59 | 91.66 | 75.21 |
| SPHINX | 51.51 | 80.98 | 77.51 | 81.27 | 72.82 |
| Qwen-VL-Chat | 41.90 | 85.03 | 62.83 | 74.78 | 66.13 |
| mPLUG-Owl-bloomz | 58.64 | 67.26 | 61.66 | 61.66 | 62.30 |
| LLaVA-v1.5 | 36.78 | 66.88 | 57.02 | 67.51 | 57.05 |
| MiniGPT-v2 | 49.03 | 55.41 | 53.70 | 62.10 | 55.06 |
| Closed source MLLMs | |||||
| ERNIE | 19.03 | 45.85 | 41.47 | 48.29 | 38.66 |
| GPT-4V | 2.93 | 64.88 | 35.61 | 48.78 | 38.05 |
4.4 Further Study
Confuse Rate.
Table.4 presents the CoR metric, which reflects the proportion of the chart that the MLLM completely fails to comprehend. Qwen-VL-Chat demonstrates the highest Acc+, albeit with a lower CoR compared to models such as MiniGPT-v2. The best-performing MiniGPT-v2 exhibits 55.06% CoR, indicating that the random guessing cases are common for open-source models due to their inability to accurately understand charts. For closed-source MLLMs, although GPT-4V outperforms ERNIE in terms of Acc+, their CoR are similar. A more granular analysis reveals that ERNIE performs better on challenging VE tasks, which happens to be the weakest area for GPT-4V.
Data annotations.
The motivation behind ChartBench is to examine MLLMs’ understanding of unlabeled charts. Table.5 presents the performance of all MLLMs on annotated and unannotated charts. It is noteworthy that 1) almost all models perform significantly better on annotated charts compared to unannotated ones. This is because MLLMs heavily rely on OCR to obtain answer candidates, thereby improving answer accuracy, which is not applicable to unannotated charts. 2) The larger the performance gap between models, such as Qwen-VL-Chat (+16.00%) and GPT-4V (+31.39%), the better their overall performance. This indicates that MLLMs’ Acc+ is primarily boosted by annotated charts, while unannotated charts notably increase the difficulty of ChartBench.
Chart Chain of Thought.
To encourage MLLMs to think like humans, we propose a simple handcraft ChartCoT in Section 3.6. Table. 6 demonstrates the performance improvement of ChartCoT on open-source models Qwen-VL-Chat and MiniGPT-v2. The effectiveness of ChartCoT is significant, as evidenced by the improvement in Acc+ and CoR metrics across all subtasks. In particular, we observe remarkable improvement in both metrics for VE and GC tasks by highlighting the significance of chart elements, such as legends. ChartCoT also notably enhances the performance on unlabeled charts and significantly reduces the chart confusion rate. It is worth noting that the effectiveness of ChartCoT is limited on MLLMs that are not particularly adept at following instructions, as overly complex instructions tend to confuse these models instead.
| Models | w/i | w/o | Acc+ | |
| Closed source MLLMs | ||||
| VisualGLM | 7.22 | 2.83 | +4.39 | 3.79 |
| Shikra | 4.17 | 9.22 | -5.05 | 8.11 |
| InstructBLIP | 14.28 | 11.98 | +2.30 | 12.49 |
| CogVLM | 17.67 | 12.08 | +5.59 | 13.30 |
| Internlm-Xcomposer | 11.94 | 16.48 | -4.54 | 15.49 |
| SPHINX | 23.22 | 16.39 | +6.83 | 17.89 |
| ChartLlama | 21.83 | 13.08 | +8.75 | 19.06 |
| BLIP2 | 28.94 | 17.80 | +11.14 | 20.24 |
| MiniGPT-v2 | 23.83 | 23.47 | +0.36 | 23.55 |
| LLaVA-v1.5 | 29.72 | 25.45 | +4.27 | 26.39 |
| mPLUG-owl-bloomz | 28.67 | 26.25 | +2.42 | 26.78 |
| Qwen-VL-Chat | 40.67 | 24.67 | +16.00 | 28.18 |
| Open source MLLMs | ||||
| ERNIE | 51.11 | 45.78 | +5.33 | 46.95 |
| GPT-4V | 78.89 | 47.50 | +31.39 | 54.39 |
Chart resolution.
The visual branch of MLLMs typically scales images to a fixed pixel size, e.g., Qwen-VL-Chat is 224px and LLaVA-v1.5 is 336px by default. To investigate the impact of resolution, we select part annotated regular charts from ChartBench and adjust them to 5-level resolutions using Matplotlib while keeping the font size unchanged. We ensure that each resolution is clear and legible for humans. Figure. 5 illustrates the performance of Qwen-VL-Chat and LLaVA-v1.5 at different resolutions. As the resolution increases, the scaled annotations gradually become unreadable for OCR, resulting in a decline in MLLMs’ performance. Qwen-VL-Chat exhibits larger performance drops than LLaVA-v1.5, indicating a greater reliance on OCR.
5 Discussion
Why no instruction tuning?
Instruction tuning has been empirically validated as a technique that enables MLLMs to efficiently and rapidly acquire domain-specific knowledge, as demonstrated by several studies. However, chart comprehension is not a proprietary domain-specific knowledge but rather a general skill that MLLMs should possess. Furthermore, employing instruction tuning may lead to potential data leakage, inevitably causing MLLMs to overfit the inherent patterns present in ChartBench excessively. Therefore, we intuitively address this issue by employing the CoT approach. More generalized solutions are required to enhance MLLMs’ chart understanding abilities.
MLLM Limitations.
MLLMs exhibit several common deficiencies in chart comprehension. Firstly, as MLLMs are typically trained on images & descriptive statements, they tend to prioritize providing descriptive responses to charts rather than confirming factual data. This is the exact opposite of the graph recognition logic in which humans first identify specific elements and then make a general answer. Secondly, some MLLMs fail to effectively follow complex instructions, which hinders their application of intricate CoT strategies. Thirdly, data hallucinations. The performance in the VE task indicates that the data extracted from charts is not yet entirely reliable. This leads to hallucinatory errors when the answers involve specific value numbers.
Possible directions.
1) Pre-training. Considering the exceptional performance exhibited by Qwen-VL-Chat and LLaVA-v1.5, it is imperative to incorporate sufficient charts and relevant tasks during the model pre-training, which effectively guides the MLLMs in acquiring comprehensive chart comprehension abilities. 2) API/Model integration: We observe that GPT-4V utilizes multiple additional APIs for assistant, including OCR and image2text. Although this manner increases response time, the successful retrieval from the APIs significantly enhances GPT-4V’s ability to provide accurate answers. A comprehensive discussion on this topic will be provided in the appendix. 3) CoT: ChartCoT has proven that CoT can greatly enhance chart comprehension for MLLMs. However, this requires MLLMs to possess strong instruction-following abilities and the ability to automatically design the thinking logic prompt for MLLMs, rather than manually designing fixed patterns. We leave this for future work.
| Metric | MiniGPT-v2 | Qwen-VL-Chat | |||||
| Base | CoT | Base | CoT | ||||
| Acc+ | CR | 29.02 | 36.76 | +7.74 | 52.54 | 64.54 | +12.00 |
| VE | 22.29 | 29.22 | +6.93 | 10.78 | 15.85 | +5.07 | |
| VC | 24.59 | 25.14 | +0.55 | 27.46 | 28.44 | +0.98 | |
| GC | 18.29 | 26.37 | +8.08 | 21.95 | 29.22 | +7.27 | |
| All | 23.55 | 29.37 | +5.82 | 28.18 | 34.51 | +6.33 | |
| w/i | 23.47 | 29.77 | +6.30 | 40.67 | 48.89 | +8.22 | |
| w/o | 23.83 | 29.26 | +5.43 | 24.67 | 30.47 | +5.80 | |
| CoR | CR | 49.03 | 43.11 | 5.92 | 41.90 | 31.66 | 10.24 |
| VE | 55.41 | 52.27 | 3.14 | 85.03 | 78.24 | 6.79 | |
| VC | 53.70 | 51.72 | 1.98 | 62.83 | 61.86 | 0.97 | |
| GC | 62.10 | 55.12 | 6.98 | 74.78 | 66.73 | 8.05 | |
| All | 55.06 | 50.55 | 4.51 | 66.13 | 59.63 | 6.50 | |
| w/i | 55.73 | 51.28 | 4.45 | 69.67 | 64.02 | 5.65 | |
| w/o | 52.67 | 50.32 | 2.35 | 53.56 | 44.00 | 9.56 | |
6 Conclusion
In this paper, we introduce ChartBench to investigate the chart comprehension abilities of MLLMs. ChartBench expands chart types remarkably and requires MLLMs to infer values using visual cues, such as color and legends, to assess their chart comprehension. Additionally, we propose improved metrics for effective and accurate assessments without manual effort or costly GPT evaluation. We further provide an effective and general CoT strategy to enhance MLLMs’ performance. The evaluation of mainstream MLLMs highlights their limitations on charts and provides valuable insights. We aim to raise awareness about the requirement to improve MLLMs’ chart comprehension abilities. The ChartBench and corresponding code will be public for research.
ChartBench: A Benchmark for Complex Visual Reasoning in Charts
Supplementary Material
In this supplementary, we provide additional results and discussions to make our paper self-contained. Specifically, we present 1). details of zero-shot prompts in Section A, 2). detailed MLLM architectures in Section B, 3). evaluation on GPT-4V to show its features in Section C, 4). more experimental comparisons and results in Section D, 5). leaderboards to visualize the ranking of MLLMs on ChartBench in Section E, 6). discussions on social impact and ethics in Section F, and 7). thumbnails to visualize all chart types of ChartBench in Section G.
Appendix A Zero-shot Prompt
| Prompt Style | Model | Prompt Example |
| BLIP2 style | BLIP2 CogVLM MiniGPT-v2 Internlm-Xcomposer |
Question: According to this chart, the Rainfall in Millimeters of Months Jul is around 100.0. Please answer yes or no. Answer: |
| LLaVA style | LLaVA-v1.5 ChartLlama |
You are a data analyst, good at dealing with chart data. Please determine whether the user’s judgments on this chart are correct. You only need to answer [yes] or [no].
The judgment from the User is: According to this chart, the Rainfall in Millimeters of Months Jul is around 100.0. Please answer yes or no. Your Answer: |
| LLaVA style no or yes | Qwen-VL-Chat SPHINX |
You are a data analyst, good at dealing with chart data. Please determine whether the user’s judgments on this chart are correct. You only need to answer [no] or [yes].
The judgment from the User is: According to this chart, the Rainfall in Millimeters of Months Jul is around 100.0. Please answer no or yes. Your Answer: |
| LLaVA style ICL | InstructBLIP mPLUG-Owl-bloomz Shikra VisualGLM |
You are a data analyst, good at dealing with chart data. Please determine whether the user’s judgments on this chart are correct. You only need to answer [yes] or [no].
Here is an example: User: <image> User: The figure is a line chart. You: yes. Following the above example: The query from the User is: According to this chart, the Rainfall in Millimeters of Months Jul is around 100.0. Your Answer: |
During the evaluation on ChartBench, we observe that the zero-shot performance of MLLMs is heavily influenced by the prompt templates, which indirectly reflects the current lack of robustness in MLLMs. To ensure fairness, we select the most appropriate templates used by each MLLM’s official implementation for testing. In Table 7, we provide the corresponding mappings between the MLLMs and the prompt templates that yielded the best Acc+ metric.
It is worth noting that the MLLMs tend to randomly answer the judgment questions in ChartBench if they cannot accurately comprehend the chart. Specifically, we observe a tendency for these models to favor the first option (e.g., yes in a yes-or-no scenario). Therefore, we provide two sets of LLaVA-style prompt templates, differing only in the order of the yes-or-no options. We have performed similar operations on other templates as well, but none of the MLLMs exhibited optimal performance on these prompt templates. Therefore, we did not include specific details about them in Table 7.
ICL stands for In Context Learning. We only adopt the template format as shown in Table 7 to standardize the output of MLLMs. We do not conduct actually ICL for our evaluations. In other words, for LLaVA-style ICL, we just adopt a single-turn dialogue, and only the queried chart is provided as the image input.
Appendix B MLLM Architecture
| Models | Size | LLM Branch | Size | Visual Branch | Size | Mem. (GB) | Time (s) |
| BLIP2 | 12.1B | FlanT5-XXL | 11B | EVA-CLIP-g/14 | 1B | 39.60 | 0.176 |
| CogVLM-Chat | 17B | Vicuna-7B | 7B | EVA-02-CLIP-E/14 | 4.4B | 39.60 | 1.455 |
| InstructBLIP | 8.2B | Vicuna-7B | 7B | EVA-CLIP-g/14 | 1B | 36.50 | 0.895 |
| InternLM-XComposer | 8.2B | InternLM-Chat-7B | 7B | EVA-CLIP-g/14 | 1B | 22.20 | 0.707 |
| LLaVA-v1.5 | 13.4B | Vicuna-13B | 13B | CLIP ViT-L/14@336px | 304M | 16.50 | 0.534 |
| MiniGPT-v2 | 8.1B | LLaMA2-Chat-7B | 7B | EVA-ViT-g/14 | 1B | 17.20 | 0.236 |
| mPLUG-Owl-bloomz | 7.4B | Bloomz-7B | 7B | CLIP ViT-L/14 | 304M | 16.00 | 0.284 |
| Qwen-VL-Chat | 9.6B | Qwen-7B | 7.7B | OpenCLIP ViT-G/14 | 1.9B | 21.00 | 0.269 |
| Shikra | 7.4B | Vicuna-7B | 7B | CLIP ViT-L/14 | 304M | 15.60 | 0.561 |
| SPHINX | 15.7B | LLaMA-13B | 13B | Mixed | 2.7B | 29.6 2 | 0.581 |
| VisualGLM | 7.8B | ChatGLM-6B | 6.2B | EVA-CLIP-g/14 | 1B | 16.00 | 0.201 |
| ChartLlama | 13.4B | Vicuna-13B | 13B | CLIP ViT-L/14@336px | 304M | 29.00 | 0.593 |
BLIP2 (Li et al., 2023c) proposes a lightweight Query Transformer to leverage off-the-shelf frozen image encoders and LLMs, which is pre-trained via a two-stage strategy. We test BLIP-2 ViT-g FlanT5-xxl (Fang et al., 2023; Chung et al., 2022).
CogVLM-Chat (Wang et al., 2023) bridges the gap between the frozen vision encoder and LLM by integrating a visual expert module in the transformer block. We test the version CogVLM-Chat-17B, which leverages Vicuna-7B finetuned from LLaMA2 (Touvron et al., 2023b) and EVA-02-CLIP-E/14 (Sun et al., 2023) as unimodal encoders.
InstructBLIP (Dai et al., 2023) extends the framework of instruction tuning to the BLIP2, and demonstrates its appealing ability of generalization. We carry out evaluations on version IntructBLIP-7B, which uses EVA-CLIP-g/14 as vision encoder and Vicuna-7B as text encoder.
InternLM-XComposer (Zhang et al., 2023) is an instruction-tuned MLLM based on InternLM (Team, 2023). It is empowered by tuning on extensive multi-modal multilingual concepts with carefully crafted strategies. We test the released version of InternLM-XComposer-7B with InternLM-Chat-7B (Team, 2023) and EVA-CLIP-g/14.
LLaVA-v1.5 (Liu et al., 2023a) is a variant of LLaVA (Liu et al., 2023b) with exquisite modifications. We test the version of LLaVA-v1.5-13B with Vicuna-13B and CLIP ViT-L/14@336px (Radford et al., 2021).
MiniGPT-v2 (Chen et al., 2023a) proposes a three-stage training paradigm and uses unique identifiers for different tasks, building a unified interface for multiple vision-language tasks. We test MiniGPT-v2-7B version, leveraging LLaMA2-Chat-7B and EVA-ViT-g/14 as unimodal encoders.
mPLUG-Owl-bloomz (Ye et al., 2023a) equips LLM with visual abilities by modularized learning of LLM, visual knowledge module, and visual abstractor module. We conduct evaluations on mPLUG-Owl-bloomz-7B version with Bloomz-7B (Muennighoff et al., 2022) and CLIP ViT-L/14.
Qwen-VL-Chat (Bai et al., 2023b) is trained with alignment techniques, which support more flexible interaction, such as multiple image inputs, multi-round question answering and creative capability. We test the version of Qwen-VL-Chat-7B with Qwen-7B (Bai et al., 2023a) and OpenCLIP ViT-G/14 (Ilharco et al., 2021; Cherti et al., 2023).
Shikra (Chen et al., 2023b) proposes to tackle spatial coordinate inputs and outputs in natural language without extra plug-in models or vocabularies. We test the version Shikra-7B which uses Vicuna-7B and CLIP ViT-L/14.
SPHINX (Lin et al., 2023) showcases the superior capability of multi-modal understanding with a joint mixing of model weights, tuning tasks, visual embeddings, and sub-images of different scales. We conduct the test on version SPHINX-13B, whose visual branch (note as mixed in Table. 8) is a mixture of QFormer, OpenCLIP ViT-L/14, OpenCLIP ConvNeXt-XXL and DINOv2-ViT-g/14 (Oquab et al., 2023) and LLM branch is LLaMA-13B (Touvron et al., 2023a).
VisualGLM (Du et al., 2022; Ding et al., 2021) is an open-source, multi-modal dialogue language model. We test VisualGLM-6B based on ChatGLM-6B (Du et al., 2022) and EVA-CLIP-g/14.
ChartLlama (Han et al., 2023) proposes to endow LLaVA-v1.5 with the capability of chart understanding and generation. We evaluate ChartLlama-13B, which uses Vicuna-13B and CLIP ViT-L/14@336px.
Appendix C Evaluation on GPT-4V
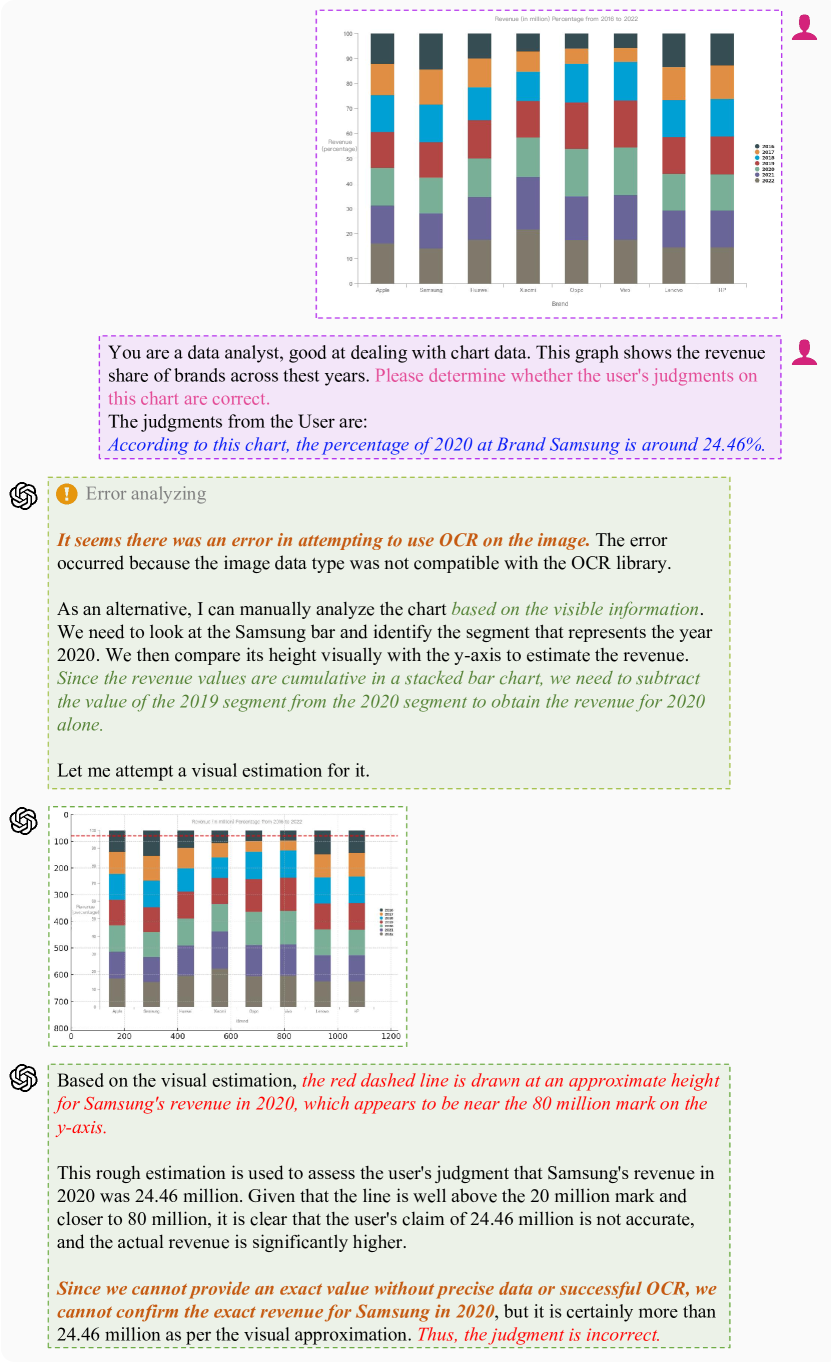
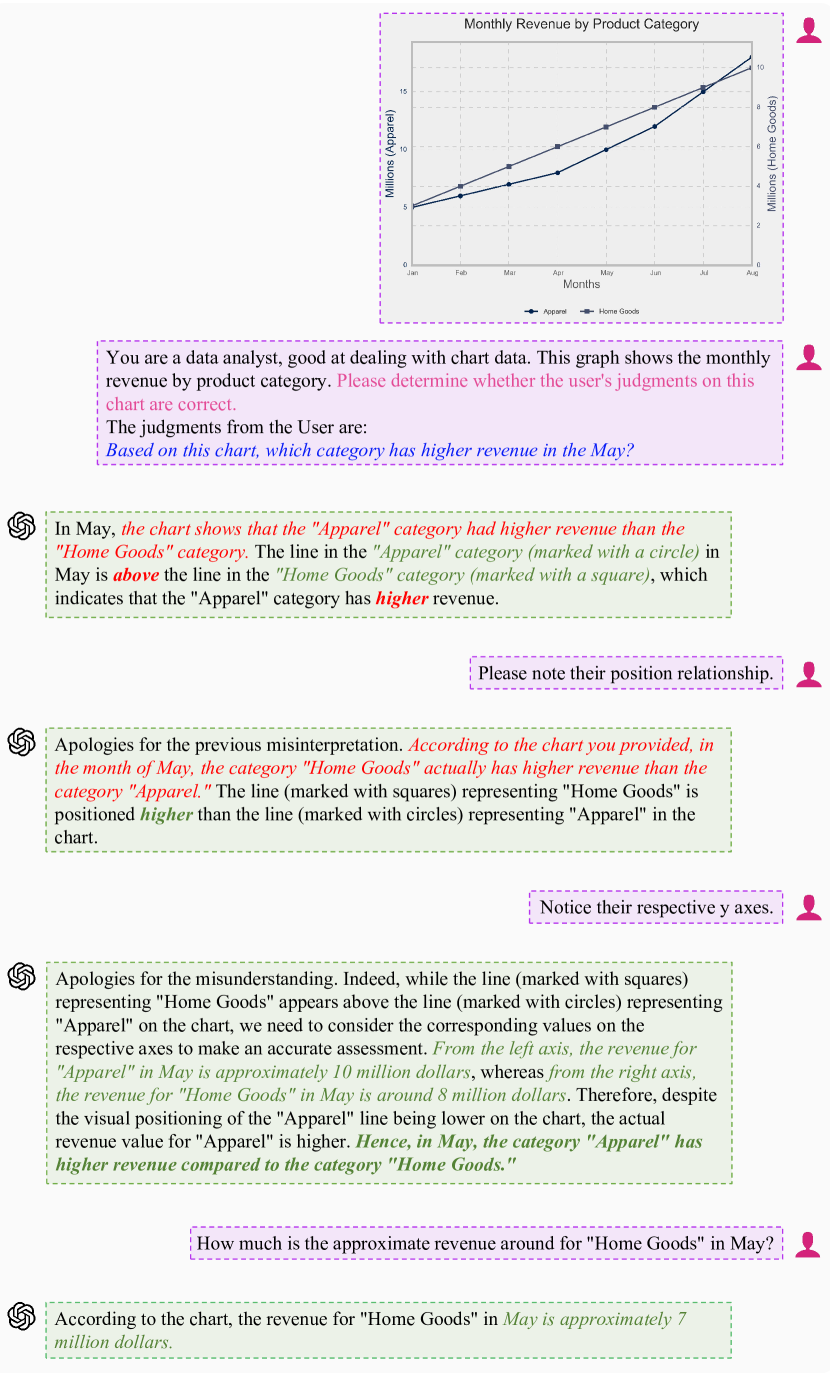
As the top-performing proprietary model, Figure 6 showcases some characteristics of GPT-4V in chart comprehension. Firstly, GPT-4V goes beyond a single end-to-end MLLM by integrating multiple APIs to aid in chart cognition (highlight orange in Figure 6(a)). The performance of GPT-4V is inherently influenced by the output of these APIs, thereby imposing limitations. For instance, when OCR results are unavailable, its ability to interpret visual information significantly declines. Secondly, GPT-4V can proactively acknowledge its limitations, such as recognizing its inability to determine specific values solely based on visual information. Thirdly, while GPT-4V possesses strong chart comprehension capabilities, it requires multi-step guidance from humans (Figure 6(b)). This accounts for its shortcomings in zero-shot performance on ChartBench.
Appendix D Additional Results
In this section, we provide additional experimental results. This paper proposes the improved Acc+ metric to enhance the naive accuracy metric. We present the evaluation results of MLLMs using the Accuracy metric in Table 9 & 10. Combined with the findings in Tables 2 & 3, it demonstrates that Acc+ can more accurately reflect the chart comprehension abilities of MLLMs. ChartBench expands upon the previous benchmark by including a wider range of chart types and showcases the performance of MLLMs on specific charts and overall. Furthermore, we present the performance of MLLMs on ChartQA, highlighting the necessity of incorporating diverse chart types to comprehensively assess MLLMs. The goal of ChartBench is to enable MLLMs to perceive, understand, and interpret charts like humans. Therefore, we survey to investigate human understanding of charts through questionnaires. We hope that as MLLMs advance, their capabilities will surpass human-level understanding.
D.1 Results of Accuracy Metric
| Models | Regular Type | Extra Type | Acc. | |||||||
| Line | Bar | Pie | Area | Box | Radar | Scatter | Node | Combin. | ||
| Shikra | 49.85 | 49.88 | 51.85 | 49.67 | 52.08 | 51.81 | 45.50 | 46.00 | 50.63 | 50.11 |
| MiniGPT-v2 | 52.80 | 50.21 | 48.40 | 50.25 | 52.67 | 52.25 | 53.92 | 39.00 | 54.25 | 51.08 |
| VisualGLM | 55.40 | 50.98 | 49.70 | 47.92 | 53.75 | 49.00 | 49.00 | 55.75 | 52.44 | 51.26 |
| SPHINX | 55.35 | 53.40 | 53.30 | 53.00 | 51.25 | 54.50 | 53.75 | 62.75 | 58.50 | 54.30 |
| InstructBLIP | 62.15 | 56.33 | 58.90 | 48.50 | 50.08 | 47.50 | 55.50 | 54.25 | 47.19 | 54.46 |
| LLaVA-v1.5 | 60.00 | 54.58 | 46.70 | 57.67 | 54.92 | 58.63 | 55.58 | 48.00 | 55.38 | 54.91 |
| ChartLlama | 56.35 | 54.50 | 57.50 | 57.25 | 52.75 | 58.50 | 56.25 | 37.25 | 53.69 | 55.18 |
| CogVLM | 54.30 | 56.27 | 57.20 | 55.33 | 53.08 | 55.13 | 56.42 | 55.50 | 51.13 | 55.22 |
| Internlm-Xcomposer | 55.70 | 57.38 | 55.60 | 51.17 | 54.42 | 53.50 | 54.08 | 54.00 | 51.25 | 55.70 |
| BLIP2 | 62.80 | 57.33 | 61.05 | 52.42 | 53.58 | 56.69 | 58.58 | 41.00 | 61.44 | 57.85 |
| mPLUG-owl-bloomz | 64.20 | 57.33 | 57.05 | 55.17 | 56.67 | 58.63 | 55.75 | 54.75 | 57.94 | 57.93 |
| Qwen-VL-Chat | 69.00 | 57.77 | 67.70 | 63.17 | 57.50 | 63.63 | 56.75 | 55.50 | 58.63 | 61.25 |
| Models | Task Type | Acc. | |||
| CR | VE | VC | GC | ||
| Shikra | 49.27 | 50.68 | 52.37 | 48.12 | 50.11 |
| MiniGPT-v2 | 53.54 | 50.00 | 51.44 | 49.34 | 51.08 |
| VisualGLM | 55.27 | 49.90 | 49.95 | 49.93 | 51.26 |
| SPHINX | 63.90 | 50.39 | 52.90 | 50.00 | 54.30 |
| InstructBLIP | 67.93 | 50.00 | 49.95 | 49.95 | 54.46 |
| LLaVA-v1.5 | 65.37 | 49.34 | 54.66 | 50.29 | 54.91 |
| ChartLlama | 60.27 | 51.71 | 55.24 | 53.51 | 55.18 |
| CogVLM | 64.10 | 49.83 | 54.59 | 52.37 | 55.22 |
| Internlm-Xcomposer | 70.90 | 49.41 | 50.76 | 48.88 | 55.70 |
| BLIP2 | 78.27 | 49.39 | 54.24 | 49.49 | 57.85 |
| mPLUG-owl-bloomz | 61.51 | 56.66 | 56.20 | 57.37 | 57.93 |
| Qwen-VL-Chat | 73.49 | 53.29 | 58.88 | 59.34 | 61.25 |
Accuracy is the most widely used evaluation criterion for true/false or multiple-choice questions, but it has inherent limitations. Firstly, for difficult questions, accuracy struggles to distinguish between genuine answers and random guesses, both of which can yield performance close to the baseline (e.g., 50% for true/false questions, 25% for four-choice questions). Secondly, accuracy places high demands on data scale. In the case of the accuracy metric, if the test sample approaches infinity, the performance of random guessing would converge to the baseline. Conversely, with a small data scale, random guessing might produce results significantly higher than the baseline. Although ChartBench provides 16.8K QA pairs (consisting of 8.4K original questions and their counterparts), this quantity still cannot completely eliminate the occurrence of the situations above (e.g., the accuracy of MiniGPT-v2 on Node chart in Table 9).
In Table 9 and Table 10, we present the results using Accuracy (abbreviated as Acc.) as the metric. Overall, Qwen-VL-Chat continues to demonstrate the best performance, consistent with the trend shown by Acc+ in Table 2. However, there are differences between accuracy and Acc+ in terms of specific details. InternLM-Xcomposer achieves 55.70% accuracy in Table 9, ranking fourth among all MLLMs. However, its Acc+ performance is only 15.49% (Table 2), indicating that a significant portion of its correct answers are the result of random guessing. This is further confirmed by the CoR metric in Table 4. From Table 10, it can be observed that accuracy does not effectively differentiate between tasks of varying difficulty, as it shows results close to the baseline of 50% across all four tasks. However, compared with Table 3, it is evident that the VE and GC tasks are notably more challenging, as they require MLLMs to rely on more visual cues for reasoning. The above analysis demonstrates that the improved Acc+ metric enables more robust evaluations.
Our improved metric, Acc+, effectively addresses the two limitations of accuracy mentioned above. The Acc+ metric requires MLLMs to provide accurate judgments for both positive and negative perspectives regarding the base assertions. This innovative metric offers two distinct advantages. Firstly, it ensures consistency between positive and negative queries, with the only difference being the Ground Truth value. This precautionary approach reduces the chance of lucky guesses resulting from random choices, as MLLMs may produce identical responses for both query types if they fail to comprehend the chart. Secondly, the GT values for negative queries are derived from other data within the same chart, eliminating unrealistic scenarios and enhancing the validity of the evaluation process. Generally, the expected probability of random guessing is 25% for vanilla Acc+. However, for the MLLM that has insufficient chart recognition capabilities, the CoR tends to be 100%, and thus the Acc+ tends to be 0% instead of 25% baseline. This characteristic enables Acc+ to accurately reflect the model’s chart comprehension ability even when the dataset is small in size.
D.2 Results of ChartQA
| Models | Human | Augmented | Average | ||||||
| Line | Bar | Pie | Average | Line | Bar | Pie | Average | ||
| ChartLlama | 68.75 | 53.63 | 65.79 | 58.40 | 79.84 | 94.55 | 100.00 | 93.12 | 75.76 |
| Qwen-VL-Chat | 54.41 | 38.38 | 43.42 | 42.48 | 55.04 | 77.48 | 80.00 | 75.20 | 58.84 |
| CogVLM | 48.90 | 29.41 | 34.21 | 34.24 | 17.83 | 29.88 | 25.00 | 28.56 | 31.40 |
| LLaVA-v1.5 | 39.71 | 19.01 | 16.45 | 23.20 | 9.30 | 14.26 | 15.00 | 13.76 | 18.48 |
| SPHINX | 35.66 | 17.68 | 16.45 | 21.44 | 10.08 | 11.35 | 10.00 | 11.20 | 16.32 |
| MiniGPT-v2 | 33.09 | 16.22 | 11.18 | 19.28 | 9.30 | 10.99 | 10.00 | 10.80 | 15.04 |
| Internlm-XComposer | 31.99 | 13.20 | 9.21 | 16.80 | 9.30 | 9.17 | 20.00 | 9.36 | 13.08 |
| VisualGLM | 32.35 | 14.89 | 7.24 | 17.76 | 9.30 | 7.81 | 5.00 | 7.92 | 12.84 |
| InstructBLIP | 29.78 | 11.86 | 10.53 | 15.60 | 10.08 | 9.81 | 10.00 | 9.84 | 12.72 |
| Shikra | 25.00 | 13.68 | 13.82 | 16.16 | 8.53 | 7.27 | 0.00 | 7.28 | 11.72 |
| mPLUG-Owl-bloomz | 22.79 | 10.53 | 6.58 | 12.72 | 7.75 | 5.72 | 5.00 | 5.92 | 9.32 |
| BLIP2 | 14.34 | 9.69 | 7.24 | 10.40 | 6.20 | 5.18 | 0.00 | 5.20 | 7.80 |
| Models | Line | Bar | Pie | Average | |||||
| ChartBench | ChartQA | ChartBench | ChartQA | ChartBench | ChartQA | ChartBench | ChartQA | ||
| Shikra | 7.40 | 25.00 | 10.62 | 13.68 | 4.50 | 13.82 | 7.51 | 16.16 | |
| MiniGPT-v2 | 26.70 | 33.09 | 21.54 | 16.22 | 20.20 | 11.18 | 22.81 | 19.28 | |
| VisualGLM | 10.80 | 32.35 | 1.96 | 14.89 | 0.00 | 7.24 | 4.25 | 17.76 | |
| SPHINX | 18.40 | 35.66 | 15.54 | 17.68 | 23.40 | 16.45 | 19.11 | 21.44 | |
| InstructBLIP | 24.40 | 29.78 | 15.04 | 11.86 | 19.10 | 10.53 | 19.51 | 15.60 | |
| LLaVA-v1.5 | 34.40 | 39.71 | 24.73 | 19.01 | 19.10 | 16.45 | 26.08 | 23.20 | |
| ChartLlama | 28.90 | 68.75 | 19.35 | 53.63 | 22.10 | 65.79 | 23.45 | 58.40 | |
| CogVLM | 10.50 | 48.90 | 14.58 | 29.41 | 17.90 | 34.21 | 14.33 | 34.24 | |
| Internlm-XComposer | 16.00 | 31.99 | 20.42 | 13.20 | 21.50 | 9.21 | 19.30 | 16.80 | |
| BLIP2 | 29.60 | 14.34 | 17.35 | 9.69 | 24.90 | 7.24 | 23.95 | 10.40 | |
| mPLUG-Owl-bloomz | 37.50 | 22.79 | 24.73 | 10.53 | 26.10 | 6.58 | 29.44 | 12.72 | |
| Qwen-VL-Chat | 41.00 | 54.41 | 20.96 | 38.38 | 40.00 | 43.42 | 33.99 | 42.48 | |
ChartQA is a canonical benchmark utilized in prior research to appraise the competency of multi-modal models to comprehend chart data. It comprises two subsets, namely Human and Augmented, and encompasses solely three chart types, viz., line, bar, and pie. To ascertain the indispensability of ChartBench and the rationality of our benchmark design and evaluation, we initially scrutinize the vanilla accuracy (Acc.) of each MLLM on ChartQA. We employ the test-split in ChartQA for evaluation, circumventing the prompt engineering process, and directly utilizing the original query without any modification as the prompt input to MLLMs. Thereafter, we evaluate the correctness of the results utilizing rule-based and regular expression matching. For numerical questions, we employ the relax accuracy metric akin to ChartQA, signifying that the difference between the model’s answer and the ground truth is within 5% to be regarded as correct. As tabulated in Table 11, we report the zero-shot Acc regarding chart types and dataset split. Conspicuously, for bar charts, we report the average accuracy of MLLMs on horizontal and vertical bars.
Table 11 evinces that despite the relatively simple chart understanding task with specific data point annotations in ChartQA, most of the MLLMs remain woefully deficient in this regard. However, it is evident that incorporating chart data in training augments the ability of MLLMs to comprehend charts, as demonstrated by the relatively superior performance of ChartLlama and Qwen-VL-Chat in Table 11. In contrast to the results in Table 9, Table 11, despite utilizing the most rudimentary accuracy as the evaluation metric, does not converge to a specific baseline. It is attributable to the question-answer pairs’ design in ChartQA, which employs annotated metadata and open-ended answers instead of the binary yes/no format. While this design ostensibly appears to appraise the model’s ability to comprehend charts, we contend that it is fraught with several inconveniences. 1) open-ended answers render the verification of MLLM’s correctness excessively laborious, sometimes necessitating third-party (human or GPT) intervention. However, the ChartBench design we propose only necessitates the model to answer yes/no, streamlining the judgment process while enhancing efficiency and accuracy. 2) the chart data in ChartQA entail specific numerical annotations, which may prompt MLLMs to rely solely on OCR-based visual judgments instead of utilizing other implicit information in the chart (e.g., color coordinates and legends) for logical inference. This inevitably reduces the task’s complexity. The performance of ChartLlama in Table 9 and 11 clearly illustrates ChartQA’s predisposition to MLLMs that rely heavily on OCR. 3) ChartQA’s design constraints necessitate the utilization of less-convincing metrics such as vanilla accuracy and BLEU score to assess MLLMs’ ability to comprehend charts.
D.3 Results of Human Evaluation
| Models | Regular Type | Extra Type | Acc+ | |||||||
| Line | Bar | Pie | Area | Box | Radar | Scatter | Node | Combin. | ||
| Qwen-VL-Chat | 41.00 | 20.96 | 40.00 | 28.83 | 24.17 | 35.00 | 19.50 | 18.50 | 25.50 | 28.18 |
| GPT-4V | 74.00 | 41.54 | 63.00 | 33.30 | 46.67 | 57.50 | 70.00 | 100.00 | 56.25 | 54.39 |
| Human Evaluation | 90.63 | 88.69 | 87.86 | 86.61 | 84.56 | 89.86 | 89.29 | 88.75 | 85.64 | 88.46 |
| Models | Task Type (Acc+) | Task Type (CoR) | ||||||||
| CR | VE | VC | GC | ALL | CR | VE | VC | GC | ALL | |
| Qwen-VL-Chat | 52.54 | 10.78 | 27.46 | 21.95 | 28.18 | 41.90 | 85.03 | 62.83 | 74.78 | 66.13 |
| GPT-4V | 96.10 | 29.27 | 47.32 | 44.88 | 54.39 | 2.93 | 64.88 | 35.61 | 48.78 | 38.05 |
| Human Evaluation | 93.68 | 84.56 | 88.68 | 86.91 | 88.46 | 1.34 | 5.82 | 4.72 | 3.52 | 3.85 |
The motivation behind ChartBench is to evaluate the understanding capability of MLLMs regarding charts. While MLLMs have exhibited high performance on previous benchmarks, they still encounter significant hallucination issues in practical applications due to the unreliable nature of the data they extract from charts. Therefore, ChartBench aims to truly reflect MLLM’s ability to interpret visual data and approach or even surpass human-level performance. To achieve this, we have provided evaluation results of human performance on ChartBench.
To ensure a fair and objective evaluation, we conduct an online survey, which consists of 10 randomly selected subcategories from ChartBench for each questionnaire. 1 chart and 4 assertions are selected from each subcategory for respondents to assess their accuracy. To obtain reliable evaluation results, the survey participants mainly consist of undergraduate and graduate students with chart reading ability, as well as other researchers in the campus and company. We encourage participants to use large-screen devices for better chart display and kindly request their patient and diligent responses. On average, it takes approximately 15 minutes and 17 seconds to complete each survey. To avoid cases of random guessing, we still employ the Acc+ evaluation metric. Incomplete responses are discarded, and we ensure that each subcategory has valid answers. In total, we have collected 68 valid surveys.
Table 13 presents the results of human evaluations, revealing some insightful observations. Firstly, the VE task appears to be more challenging compared to other tasks. The human eye faces challenges in determining the values of unmarked data points. While the coordinate system offers potential inference, excessively fine granularity can diminish respondents’ confidence. Secondly, there is not a significant variation in human performance across different chart types. Once individuals grasp the correct interpretation methods for charts, they can demonstrate similar proficiency across each chart category. Thirdly, even in some relatively straightforward tasks, such as identifying chart types, humans are unable to achieve 100% accuracy. This limitation could be attributed to constraints within our survey methodology. For instance, certain descriptions may have confused the respondents, or the length of the test might have led to hastily completed surveys.
Appendix E Leaderboards
To obtain a more nuanced insight into the perceptual capacities of diverse MLLMs in the context of varied categories of charts, in this section, we devise several leaderboards to evaluate their performance across multiple task types.
In Table 14 15 16 17, we present the leaderboards of MLLMs on ChartBench, which includes 3 regular types of charts and 6 extra types of charts, utilizing the Acc+ metric. Additionally, we showcase the Acc+ and CoR leaderboards of MLLMs for 4 chart comprehension tasks while also displaying their rankings on w/i and w/o annotation data.
E.1 Leaderboards on Chart Type
| No. | Model | Acc+ |
| 1 | GPT-4V | 74.00 |
| 2 | ERNIE | 44.00 |
| 3 | Qwen-VL-Chat | 41.00 |
| 4 | mPLUG-Owl-bloomz | 37.50 |
| 5 | LLaVA-v1.5 | 34.40 |
| 6 | BLIP2 | 29.60 |
| 7 | ChartLlama | 28.90 |
| 8 | MiniGPT-v2 | 26.70 |
| 9 | InstructBLIP | 24.40 |
| 10 | SPHINX | 18.40 |
| 11 | Internlm-XComposer | 16.00 |
| 12 | VisualGLM | 10.80 |
| 13 | CogVLM | 10.50 |
| 14 | Shikra | 7.40 |
| No. | Model | Acc+ |
| 1 | ERNIE | 45.00 |
| 2 | GPT-4V | 41.54 |
| 3 | LLaVA-v1.5 | 24.73 |
| 4 | mPLUG-Owl-bloomz | 24.73 |
| 5 | MiniGPT-v2 | 21.54 |
| 6 | QWen-VL-Chat | 20.96 |
| 7 | Internlm-XComposer | 20.42 |
| 8 | ChartLlama | 19.35 |
| 9 | BLIP2 | 17.35 |
| 10 | SPHINX | 15.54 |
| 11 | InstructBLIP | 15.04 |
| 12 | CogVLM | 14.58 |
| 13 | Shikra | 10.62 |
| 14 | VisualGLM | 1.96 |
| No. | Model | Acc+ |
| 1 | GPT-4V | 63.00 |
| 2 | ERNIE | 57.00 |
| 3 | Qwen-VL-Chat | 40.00 |
| 4 | mPLUG-Owl-bloomz | 26.10 |
| 5 | BLIP2 | 24.90 |
| 6 | SPHNIX | 23.40 |
| 7 | ChartLlama | 22.10 |
| 8 | Internlm-XComposer | 21.50 |
| 9 | MiniGPT-v2 | 20.20 |
| 10 | InstructBLIP | 19.10 |
| 11 | LLaVA-v1.5 | 19.10 |
| 12 | CogVLM | 17.90 |
| 13 | Shikra | 4.50 |
| 14 | VisualGLM | 0.00 |
| No. | Model | Acc+ |
| 1 | ERNIE | 45.00 |
| 2 | GPT-4V | 33.30 |
| 3 | QWen-VL-Chat | 28.83 |
| 4 | LLaVA-v1.5 | 26.83 |
| 5 | MiniGPT-v2 | 21.67 |
| 6 | mPLUG-Owl-bloomz | 21.33 |
| 7 | ChartLlama | 16.50 |
| 8 | CogVLM | 12.50 |
| 9 | SPHINX | 12.00 |
| 10 | BLIP2 | 6.17 |
| 11 | Shikra | 6.00 |
| 12 | Internlm-XComposer | 4.50 |
| 13 | InstructBLIP | 4.33 |
| 14 | VisualGLM | 1.17 |
| No. | Model | Acc+ |
| 1 | GPT-4V | 46.67 |
| 2 | ERNIE | 30.00 |
| 3 | mPLUG-Owl-bloomz | 25.83 |
| 4 | LLaVA-v1.5 | 25.67 |
| 5 | MiniGPT-v2 | 24.67 |
| 6 | QWen-VL-Chat | 24.17 |
| 7 | Internlm-XComposer | 14.50 |
| 8 | ChartLlama | 13.30 |
| 9 | Shikra | 11.33 |
| 10 | BLIP2 | 10.67 |
| 11 | CogVLM | 9.67 |
| 12 | VisualGLM | 8.50 |
| 13 | SPHNIX | 8.17 |
| 14 | InstructBLIP | 7.33 |
| No. | Model | Acc+ |
| 1 | GPT-4V | 57.50 |
| 2 | ERNIE | 40.00 |
| 3 | QWen-VL-Chat | 35.00 |
| 4 | LLaVA-v1.5 | 28.63 |
| 5 | mPLUG-Owl-bloomz | 26.50 |
| 6 | MiniGPT-v2 | 25.88 |
| 7 | ChartLlama | 25.00 |
| 8 | SPHNIX | 19.00 |
| 9 | BLIP2 | 17.63 |
| 10 | CogVLM | 16.00 |
| 11 | Internlm-XComposer | 15.00 |
| 12 | Shikra | 11.88 |
| 13 | InstructBLIP | 2.00 |
| 14 | VisualGLM | 0.25 |
| No. | Model | Acc+ |
| 1 | GPT-4V | 70.00 |
| 2 | ERNIE | 51.67 |
| 3 | ChartLlama | 28.50 |
| 4 | MiniGPT-v2 | 28.17 |
| 5 | LLaVA-v1.5 | 26.00 |
| 6 | mPLUG-Owl-bloomz | 24.17 |
| 7 | BLIP2 | 22.00 |
| 8 | QWen-VL-Chat | 19.50 |
| 9 | SPHNIX | 17.17 |
| 10 | CogVLM | 14.33 |
| 11 | InstructBLIP | 12.50 |
| 12 | Internlm-XComposer | 12.00 |
| 13 | Shikra | 4.17 |
| 14 | VisualGLM | 3.33 |
| No. | Model | Acc+ |
| 1 | GPT-4V | 100.00 |
| 2 | ERNIE | 70.00 |
| 3 | LLaVA-v1.5 | 33.50 |
| 4 | BLIP2 | 33.00 |
| 5 | SPHINX | 31.00 |
| 6 | mPLUG-Owl-bloomz | 28.50 |
| 7 | ChartLlama | 25.50 |
| 8 | QWen-VL-Chat | 18.50 |
| 9 | CogVLM | 16.00 |
| 10 | VisualGLM | 15.50 |
| 11 | MiniGPT-v2 | 15.50 |
| 12 | InstructBLIP | 9.00 |
| 13 | Shikra | 8.50 |
| 14 | Internlm-XComposer | 8.50 |
| No. | Model | Acc+ |
| 1 | ERNIE | 56.25 |
| 2 | GPT-4V | 56.25 |
| 3 | BLIP2 | 28.00 |
| 4 | mPLUG-Owl-bloomz | 27.50 |
| 5 | LLaVA-v1.5 | 27.38 |
| 6 | MiniGPT-v2 | 27.13 |
| 7 | ChartLlama | 26.38 |
| 8 | SPHINX | 25.88 |
| 9 | QWen-VL-Chat | 25.50 |
| 10 | CogVLM | 6.13 |
| 11 | VisualGLM | 5.13 |
| 12 | Internlm-XComposer | 5.13 |
| 13 | Shikra | 3.63 |
| 14 | InstructBLIP | 2.38 |
| No. | Model | Acc+ |
| 1 | GPT-4V | 59.51 |
| 2 | ERNIE | 48.67 |
| 3 | QWen-VL-Chat | 33.99 |
| 4 | mPLUG-Owl-bloomz | 29.44 |
| 5 | LLaVA-v1.5 | 26.08 |
| 6 | BLIP2 | 23.95 |
| 7 | ChartLlama | 23.45 |
| 8 | MiniGPT-v2 | 22.81 |
| 9 | InstructBLIP | 19.51 |
| 10 | Internlm-XComposer | 19.30 |
| 11 | SPHINX | 19.11 |
| 12 | CogVLM | 14.33 |
| 13 | Shikra | 7.51 |
| 14 | VisualGLM | 4.25 |
| No. | Model | Acc+ |
| 1 | GPT-4V | 60.62 |
| 2 | ERNIE | 48.82 |
| 3 | LLaVA-v1.5 | 28.00 |
| 4 | mPLUG-Owl-bloomz | 25.64 |
| 5 | QWen-VL-Chat | 25.25 |
| 6 | MiniGPT-v2 | 23.84 |
| 7 | ChartLlama | 22.24 |
| 8 | BLIP2 | 19.58 |
| 9 | SPHINX | 18.87 |
| 10 | CogVLM | 12.44 |
| 11 | Internlm-XComposer | 9.94 |
| 12 | Shikra | 7.59 |
| 13 | InstructBLIP | 6.26 |
| 14 | VisualGLM | 5.65 |
| No. | Model | Acc+ |
| 1 | GPT-4V | 54.39 |
| 2 | ERNIE | 46.95 |
| 3 | QWen-VL-Chat | 28.18 |
| 4 | mPLUG-Owl-bloomz | 26.78 |
| 5 | LLaVA-v1.5 | 26.39 |
| 6 | MiniGPT-v2 | 23.55 |
| 7 | ChartLlama | 22.26 |
| 8 | BLIP2 | 20.24 |
| 9 | SPHINX | 17.89 |
| 10 | Internlm-XComposer | 15.49 |
| 11 | CogVLM | 13.30 |
| 12 | InstructBLIP | 12.49 |
| 13 | Shikra | 8.11 |
| 14 | VisualGLM | 3.79 |
Table 14 presents an overview of MLLMs’ performance across various chart types, along with the overall Acc+ metric. Generally, the current MLLMs exhibit a constrained ability in chart recognition, encountering notable challenges. For specific chart types, such as radar or combination charts, certain MLLMs achieve close to 0% in Acc+, signaling their difficulty in extracting crucial information from charts and their insensitivity to both positive and negative queries. It’s essential to highlight that the Acc+ metric tends toward 0% in situations of random guessing, as elaborated in Section 3.5. Particularly, Qwen-VL-Chat and mPLUG-Owl-bloomz showcase commendable proficiency in recognizing charts, a capability likely attributed to their precise tuning with chart data. However, their performance in this aspect falls below what has been reported in ChartQA. This discrepancy can be traced back to their reliance on OCR skills rather than robust visual logical reasoning. In the context of ChartBench, where the proportion of annotated charts is notably low, these models face a significant challenge. The majority of queries in ChartBench necessitate MLLMs to employ visual logical reasoning, a task that proves quite demanding for models like Qwen-VL-Chat and mPLUG-Owl-bloomz. On the other hand, VisualGLM and Shikra exhibit subpar performance, potentially due to their smaller LLM size and less robust visual encoding branch. While MLLMs generally demonstrate satisfactory performance on regular charts, there remains considerable room for improvement, particularly in handling more intricate graphics.
E.2 Leaderboards on Task Type
| No. | Model | Acc+ |
| 1 | GPT-4V | 96.10 |
| 2 | ERNIE | 65.37 |
| 3 | BLIP2 | 59.51 |
| 4 | QWen-VL-Chat | 52.54 |
| 5 | InstructBLIP | 49.90 |
| 6 | ChartLlama | 49.51 |
| 7 | LLaVA-v1.5 | 46.98 |
| 8 | Internlm-XComposer | 42.59 |
| 9 | SPHINX | 38.15 |
| 10 | mPLUG-Owl-bloomz | 32.20 |
| 11 | CogVLM | 29.41 |
| 12 | MiniGPT-v2 | 29.02 |
| 13 | VisualGLM | 15.17 |
| 14 | Shikra | 2.15 |
| No. | Model | Acc+ |
| 1 | ERNIE | 43.90 |
| 2 | GPT-4V | 29.27 |
| 3 | mPLUG-Owl-bloomz | 23.02 |
| 4 | MiniGPT-v2 | 22.29 |
| 5 | LLaVA-v1.5 | 15.90 |
| 6 | Shikra | 11.90 |
| 7 | QWen-VL-Chat | 10.78 |
| 8 | SPHINX | 9.90 |
| 9 | ChartLlama | 8.34 |
| 10 | Internlm-XComposer | 6.98 |
| 11 | BLIP2 | 3.85 |
| 12 | CogVLM | 2.39 |
| 13 | VisualGLM | 0.0 |
| 14 | InstructBLIP | 0.0 |
| No. | Model | Acc+ |
| 1 | GPT-4V | 47.32 |
| 2 | ERNIE | 32.20 |
| 3 | Qwen-VL-Chat | 27.46 |
| 4 | LLaVA-v1.5 | 26.15 |
| 5 | mPLUG-Owl-bloomz | 25.37 |
| 6 | MiniGPT-v2 | 24.59 |
| 7 | ChartLlama | 20.54 |
| 8 | CogVLM | 14.29 |
| 9 | SPHNIX | 14.15 |
| 10 | BLIP2 | 13.95 |
| 11 | Shikra | 10.63 |
| 12 | Internlm-XComposer | 2.49 |
| 13 | InstructBLIP | 0.05 |
| 14 | VisualGLM | 0.00 |
| No. | Model | Acc+ |
| 1 | ERNIE | 46.34 |
| 2 | GPT-4V | 44.88 |
| 3 | mPLUG-Owl-bloomz | 26.54 |
| 4 | QWen-VL-Chat | 21.95 |
| 5 | MiniGPT-v2 | 18.29 |
| 6 | LLaVA-v1.5 | 16.54 |
| 7 | ChartLlama | 10.63 |
| 8 | Internlm-XComposer | 9.90 |
| 9 | SPHINX | 9.37 |
| 10 | Shikra | 7.76 |
| 11 | CogVLM | 7.12 |
| 12 | BLIP2 | 3.66 |
| 13 | VisualGLM | 0.0 |
| 14 | InstructBLIP | 0.0 |
Table 15 outlines the performance of MLLMs on perception and conception tasks introduced in Section 3.4. Most MLLMs exhibit notable success in the CR task, showcasing their proficiency in recognizing fundamental chart types. Notably, LLaVA-v1.5, mPLUG-Owl-bloomz, and Qwen-VL-Chat demonstrate substantial advantages in the VC and GC conception tasks, leveraging their chart-tuned data. The most challenging task, VE, serves as a key distinction between ChartBench and ChartQA. Unlike basic OCR, the VE task requires a series of visual and textual logical reasoning steps to arrive at the correct answer. Despite strong overall performance, models such as BLIP2 and ChartLlama face difficulties in the VE task. This underscores the importance of prioritizing and enhancing the visual logical reasoning capabilities of these MLLMs. In terms of model comparison, closed-source models outperform their open-source counterparts, partly attributed to their larger model size and broader data coverage.
E.3 Leaderboards on CoR Metric
| No. | Model | CoR |
| 1 | GPT-4V | 2.93 |
| 2 | ERNIE | 19.03 |
| 3 | InstructBLIP | 36.05 |
| 4 | mPLUG-Owl-bloomz | 36.78 |
| 5 | BLIP2 | 37.51 |
| 6 | MiniGPT-v2 | 41.90 |
| 7 | QWen-VL-Chat | 49.03 |
| 8 | ChartLlama | 51.51 |
| 9 | SPHINX | 56.64 |
| 10 | LLaVA-v1.5 | 58.64 |
| 11 | CogVLM | 69.36 |
| 12 | Internlm-XComposer | 78.48 |
| 13 | VisualGLM | 80.20 |
| 14 | Shikra | 94.25 |
| No. | Model | CoR |
| 1 | ERNIE | 45.85 |
| 2 | QWen-VL-Chat | 55.41 |
| 3 | GPT-4V | 64.88 |
| 4 | mPLUG-Owl-bloomz | 66.88 |
| 5 | LLaVA-v1.5 | 67.26 |
| 6 | Shikra | 77.56 |
| 7 | ChartLlama | 80.98 |
| 8 | SPHINX | 84.87 |
| 9 | Internlm-XComposer | 84.98 |
| 10 | MiniGPT-v2 | 85.03 |
| 11 | BLIP2 | 91.07 |
| 12 | CogVLM | 94.88 |
| 13 | VisualGLM | 99.81 |
| 14 | InstructBLIP | 100.00 |
| No. | Model | CoR |
| 1 | GPT-4V | 35.61 |
| 2 | ERNIE | 41.47 |
| 3 | Qwen-VL-Chat | 53.70 |
| 4 | mPLUG-Owl-bloomz | 57.02 |
| 5 | LLaVA-v1.5 | 61.66 |
| 6 | MiniGPT-v2 | 62.83 |
| 7 | Internlm-XComposer | 73.32 |
| 8 | ChartLlama | 77.51 |
| 9 | CogVLM | 80.58 |
| 10 | BLIP2 | 80.59 |
| 11 | Shikra | 83.46 |
| 12 | SPHNIX | 96.54 |
| 13 | InstructBLIP | 99.80 |
| 14 | VisualGLM | 99.90 |
| No. | Model | CoR |
| 1 | ERNIE | 48.29 |
| 2 | GPT-4V | 48.78 |
| 3 | LLaVA-v1.5 | 61.66 |
| 4 | QWen-VL-Chat | 62.10 |
| 5 | mPLUG-Owl-bloomz | 67.51 |
| 6 | MiniGPT-v2 | 74.78 |
| 7 | SPHINX | 77.95 |
| 8 | Shikra | 80.73 |
| 9 | ChartLlama | 81.27 |
| 10 | Internlm-XComposer | 84.68 |
| 11 | CogVLM | 90.49 |
| 12 | BLIP2 | 91.66 |
| 13 | VisualGLM | 99.85 |
| 14 | InstructBLIP | 99.90 |
Table 16 showcases the CoR metric, which signifies the portion of the chart that the MLLM fails to comprehend entirely. Qwen-VL-Chat exhibits the highest Acc+, albeit with a lower CoR compared to models like MiniGPT-v2. The top-performing MiniGPT-v2 demonstrates a CoR of 55.06%, underscoring the prevalence of random guessing cases for open-source models due to their challenges in accurately understanding charts. In the case of closed-source MLLMs, although GPT-4V outperforms ERNIE in terms of Acc+, their CoR values are similar. A more detailed examination reveals that ERNIE excels in challenging VE tasks, which happen to be the weaker area for GPT-4V.
E.4 Leaderboards on with/without Annotated Charts
| No. | Model | Acc+ |
| 1 | GPT-4V | 78.89 |
| 2 | ERNIE | 51.11 |
| 3 | QWen-VL-Chat | 40.67 |
| 4 | LLaVA-v1.5 | 29.72 |
| 5 | ChartLlama | 28.94 |
| 6 | mPLUG-Owl-bloomz | 28.67 |
| 7 | MiniGPT-v2 | 23.83 |
| 8 | SPHINX | 23.22 |
| 9 | BLIP2 | 21.83 |
| 10 | CogVLM | 17.67 |
| 11 | InstructBLIP | 14.28 |
| 12 | Internlm-XComposer | 11.94 |
| 13 | VisualGLM | 7.22 |
| 14 | Shikra | 4.17 |
| No. | Model | Acc+ |
| 1 | GPT-4V | 47.95 |
| 2 | ERNIE | 45.78 |
| 3 | mPLUG-Owl-bloomz | 26.25 |
| 4 | LLaVA-v1.5 | 25.45 |
| 5 | QWen-VL-Chat | 24.67 |
| 6 | MiniGPT-v2 | 23.47 |
| 7 | ChartLlama | 17.80 |
| 8 | Internlm-XComposer | 16.48 |
| 9 | SPHINX | 16.39 |
| 10 | BLIP2 | 13.08 |
| 11 | CogVLM | 12.08 |
| 12 | InstructBLIP | 11.98 |
| 13 | Shikra | 9.22 |
| 14 | VisualGLM | 2.83 |
The rationale behind ChartBench is to assess the comprehension of unlabeled charts by MLLMs. In Table 17, the performance of all MLLMs on both annotated and unannotated charts is presented. It is important to note that: 1) Virtually all models exhibit significantly superior performance on annotated charts when compared to unannotated ones. This discrepancy arises because MLLMs heavily depend on OCR to acquire answer candidates, thereby enhancing answer accuracy—an advantage not applicable to unannotated charts. 2) The larger the performance gap between models, such as Qwen-VL-Chat (+16.00%) and GPT-4V (+31.39%), the more favorable their overall performance. This suggests that the Acc+ of MLLMs is primarily elevated by annotated charts, while unannotated charts notably intensify the challenge presented by ChartBench.
Appendix F Ethical Statement
This study upholds rigorous ethical standards to ensure the credibility and confidentiality of the findings. All data underwent thorough de-identification procedures to protect privacy and maintain anonymity. The study followed ethical guidelines and obtained informed consent from participants while prioritizing their rights and autonomy. Transparency and accountability were maintained throughout the research process to minimize biases and conflicts of interest. No academic ethical issues or misconduct were encountered, and the authors affirm their unwavering commitment to upholding ethical research practices and promptly addressing any unintentional errors or oversights.
Appendix G Chart Type Thumbnails
ChartBench primarily focuses on the following evaluation aspects: 1) Bar charts are the most common and have been the focus of ChartQA and ChartLLaMA. ChartBench includes basic variations such as horizontal and vertical bar orientations, data complexity (single and multiple groups of data), and different representations (regular, percentage, stacked, and 3D bar charts). 2) Line charts are commonly used chart types to reflect data trends. ChartBench includes error line charts as well as regular single or multiple groups, with or without annotations line charts. 3) Pie charts primarily show the data proportional distribution. ChartBench includes single, nested, doughnut pie charts, and irregular sector charts. 4) Radar charts have a straightforward distribution structure and are used to represent multiple attributes of an entity. ChartBench incorporates diverse data complexities (single or multiple groups) and representations (with or without fillings). 5) Box charts primarily depict the statistical distribution of a substantial volume of data points. ChartBench collects horizontal and vertical box plots, as well as authentic candlestick charts depicting real stock prices. 6) Scatter charts mainly depict the distribution of discrete data. ChartBench includes simple single or multi-group scatter plots, 3D bubble plots, and scatter plots with interpolated smoothing lines. 7) Area charts employ color fillings to visually convey the magnitude and distribution of data. ChartBench encompasses single or multiple groups area plots, stacked and percentage stacked area charts. 8) Node charts primarily illustrate the logical relationships between nodes. ChartBench includes directed and undirected graphs, as well as simple and complex node-link diagrams. 9) Combination charts combine the above-mentioned chart types. ChartBench includes dual coordinate system charts (e.g. line and bar charts), multi-level pie charts, and combinations between bar and pie charts.
References
- Alayrac et al. [2022] Jean-Baptiste Alayrac, Jeff Donahue, Pauline Luc, et al. Flamingo: a visual language model for few-shot learning. In NeurIPS, volume 35, pages 23716–23736, 2022.
- Antol et al. [2015] Stanislaw Antol, Aishwarya Agrawal, Jiasen Lu, et al. Vqa: Visual question answering. In ICCV, pages 2425–2433, 2015.
- Bai et al. [2023a] Jinze Bai, Shuai Bai, Yunfei Chu, et al. Qwen technical report. arXiv preprint arXiv:2309.16609, 2023.
- Bai et al. [2023b] Jinze Bai, Shuai Bai, Shusheng Yang, et al. Qwen-vl: A frontier large vision-language model with versatile abilities. arXiv preprint arXiv:2308.12966, 2023.
- Brown et al. [2020] Tom Brown, Benjamin Mann, Nick Ryder, et al. Language models are few-shot learners. In NeurIPS, volume 33, pages 1877–1901, 2020.
- Chen et al. [2022] Jun Chen, Han Guo, Kai Yi, et al. Visualgpt: Data-efficient adaptation of pretrained language models for image captioning. In CVPR, pages 18030–18040, June 2022.
- Chen et al. [2023a] Jun Chen, Deyao Zhu, Xiaoqian Shen, et al. Minigpt-v2: large language model as a unified interface for vision-language multi-task learning. arXiv preprint arXiv:2310.09478, 2023.
- Chen et al. [2023b] Keqin Chen, Zhao Zhang, Weili Zeng, et al. Shikra: Unleashing multimodal llm’s referential dialogue magic. arXiv preprint arXiv:2306.15195, 2023.
- Cherti et al. [2023] Mehdi Cherti, Romain Beaumont, Ross Wightman, et al. Reproducible scaling laws for contrastive language-image learning. In CVPR, pages 2818–2829, 2023.
- Chowdhery et al. [2023] Aakanksha Chowdhery, Sharan Narang, Jacob Devlin, et al. Palm: Scaling language modeling with pathways. Journal of Machine Learning Research, 24(240):1–113, 2023.
- Chung et al. [2022] HyungWon Chung, Le Hou, Shayne Longpre, et al. Scaling instruction-finetuned language models. arXiv preprint arXiv:2210.11416, 2022.
- Dai et al. [2023] Wenliang Dai, Junnan Li, Dongxu Li, et al. Instructblip: Towards general-purpose vision-language models with instruction tuning. arXiv preprint arXiv:2305.06500, 2023.
- Ding et al. [2021] Ming Ding, Zhuoyi Yang, Wenyi Hong, et al. Cogview: Mastering text-to-image generation via transformers. In NeurIPS, volume 34, pages 19822–19835, 2021.
- Du et al. [2022] Zhengxiao Du, Yujie Qian, Xiao Liu, et al. Glm: General language model pretraining with autoregressive blank infilling. In ACL, pages 320–335, 2022.
- Fang et al. [2023] Yuxin Fang, Wen Wang, Binhui Xie, et al. Eva: Exploring the limits of masked visual representation learning at scale. In CVPR, pages 19358–19369, 2023.
- Fu et al. [2023a] Chaoyou Fu, Peixian Chen, Yunhang Shen, et al. Mme: A comprehensive evaluation benchmark for multimodal large language models. arXiv preprint arXiv:2306.13394, 2023.
- Fu et al. [2023b] Jinlan Fu, See-Kiong Ng, Zhengbao Jiang, and Pengfei Liu. Gptscore: Evaluate as you desire. arXiv preprint arXiv:2302.04166, 2023.
- Goyal et al. [2017] Yash Goyal, Tejas Khot, Douglas Summers-Stay, et al. Making the v in vqa matter: Elevating the role of image understanding in visual question answering. In CVPR, pages 6904–6913, 2017.
- Guan et al. [2023] Tianrui Guan, Fuxiao Liu, Xiyang Wu, et al. Hallusionbench: An advanced diagnostic suite for entangled language hallucination & visual illusion in large vision-language models. arXiv preprint arXiv:2310.14566, 2023.
- Han et al. [2023] Yucheng Han, Chi Zhang, Xin Chen, et al. Chartllama: A multimodal llm for chart understanding and generation. arXiv preprint arXiv:2311.16483, 2023.
- Hsu et al. [2021] Ting-Yao Hsu, C Lee Giles, and Ting-Hao’Kenneth’ Huang. Scicap: Generating captions for scientific figures. arXiv preprint arXiv:2110.11624, 2021.
- Hudson and Manning [2019] Drew A Hudson and Christopher D Manning. Gqa: A new dataset for real-world visual reasoning and compositional question answering. In CVPR, pages 6700–6709, 2019.
- Ilharco et al. [2021] Gabriel Ilharco, Mitchell Wortsman, Ross Wightman, et al. OpenCLIP. https://github.com/mlfoundations/open_clip, 2021.
- Kantharaj et al. [2022] Shankar Kantharaj, Rixie Tiffany Ko Leong, Xiang Lin, et al. Chart-to-text: A large-scale benchmark for chart summarization. arXiv preprint arXiv:2203.06486, 2022.
- Li and Tajbakhsh [2023] Shengzhi Li and Nima Tajbakhsh. Scigraphqa: A large-scale synthetic multi-turn question-answering dataset for scientific graphs. arXiv preprint arXiv:2308.03349, 2023.
- Li et al. [2023a] Bo Li, Yuanhan Zhang, Liangyu Chen, et al. Otter: A multi-modal model with in-context instruction tuning. arXiv preprint arXiv:2305.03726, 2023.
- Li et al. [2023b] Bohao Li, Rui Wang, Guangzhi Wang, et al. Seed-bench: Benchmarking multimodal llms with generative comprehension. arXiv preprint arXiv:2307.16125, 2023.
- Li et al. [2023c] Junnan Li, Dongxu Li, Silvio Savarese, et al. BLIP-2: bootstrapping language-image pre-training with frozen image encoders and large language models. In ICML, volume 202, pages 19730–19742, 2023.
- Li et al. [2023d] Kunchang Li, Yali Wang, Yinan He, et al. Mvbench: A comprehensive multi-modal video understanding benchmark. arXiv preprint arXiv:2311.17005, 2023.
- Lin et al. [2023] Ziyi Lin, Chris Liu, Renrui Zhang, et al. Sphinx: The joint mixing of weights, tasks, and visual embeddings for multi-modal large language models. arXiv preprint arXiv:2311.07575, 2023.
- Liu et al. [2023a] Haotian Liu, Chunyuan Li, Yuheng Li, et al. Improved baselines with visual instruction tuning. arXiv preprint arXiv:2310.03744, 2023.
- Liu et al. [2023b] Haotian Liu, Chunyuan Li, Qingyang Wu, and Yong Jae Lee. Visual instruction tuning. In NeurIPS, 2023.
- Liu et al. [2023c] Yuan Liu, Haodong Duan, Yuanhan Zhang, et al. Mmbench: Is your multi-modal model an all-around player? arXiv preprint arXiv:2307.06281, 2023.
- Masry et al. [2022] Ahmed Masry, Do Xuan Long, Jia Qing Tan, et al. Chartqa: A benchmark for question answering about charts with visual and logical reasoning. In ACL, 2022.
- Methani et al. [2020] Nitesh Methani, Pritha Ganguly, Mitesh M Khapra, and Pratyush Kumar. Plotqa: Reasoning over scientific plots. In CVPR, pages 1527–1536, 2020.
- Muennighoff et al. [2022] Niklas Muennighoff, Thomas Wang, Lintang Sutawika, et al. Crosslingual generalization through multitask finetuning. arXiv preprint arXiv:2211.01786, 2022.
- OpenAI [2023] OpenAI. Gpt-4 technical report. ArXiv, abs/2303.08774, 2023.
- Oquab et al. [2023] Maxime Oquab, Timothée Darcet, Théo Moutakanni, et al. Dinov2: Learning robust visual features without supervision. arXiv preprint arXiv:2304.07193, 2023.
- Ouyang et al. [2022] Long Ouyang, Jeffrey Wu, Xu Jiang, et al. Training language models to follow instructions with human feedback. NeurIPS, 35:27730–27744, 2022.
- Radford et al. [2018] Alec Radford, Karthik Narasimhan, Tim Salimans, Ilya Sutskever, et al. Improving language understanding by generative pre-training. OpenAI blog, 2018.
- Radford et al. [2019] Alec Radford, Jeff Wu, Rewon Child, et al. Language models are unsupervised multitask learners. OpenAI Blog, 1(8):9, 2019.
- Radford et al. [2021] Alec Radford, Jong Wook Kim, Chris Hallacy, et al. Learning transferable visual models from natural language supervision. In ICML, pages 8748–8763. PMLR, 2021.
- Rahman et al. [2023] Raian Rahman, Rizvi Hasan, Abdullah Al Farhad, et al. Chartsumm: A comprehensive benchmark for automatic chart summarization of long and short summaries. arXiv preprint arXiv:2304.13620, 2023.
- Sun et al. [2023] Quan Sun, Yuxin Fang, Ledell Wu, et al. Eva-clip: Improved training techniques for clip at scale. arXiv preprint arXiv:2303.15389, 2023.
- Tang et al. [2023] Benny J. Tang, Angie Boggust, and Arvind Satyanarayan. VisText: A Benchmark for Semantically Rich Chart Captioning. In ACL, 2023.
- Team [2023] InternLM Team. Internlm: A multilingual language model with progressively enhanced capabilities. https://github.com/InternLM/InternLM-techreport, 2023.
- Touvron et al. [2023a] Hugo Touvron, Thibaut Lavril, Gautier Izacard, et al. Llama: Open and efficient foundation language models. arXiv preprint arXiv:2302.13971, 2023.
- Touvron et al. [2023b] Hugo Touvron, Louis Martin, Kevin Stone, et al. Llama 2: Open foundation and fine-tuned chat models. arXiv preprint arXiv:2307.09288, 2023.
- Vaswani et al. [2017] Ashish Vaswani, Noam Shazeer, Niki Parmar, et al. Attention is all you need. In NIPS, 2017.
- Vinyals et al. [2015] Oriol Vinyals, Alexander Toshev, Samy Bengio, and Dumitru Erhan. Show and tell: A neural image caption generator. In CVPR, pages 3156–3164, 2015.
- Wang et al. [2022] Yizhong Wang, Yeganeh Kordi, Swaroop Mishra, et al. Self-instruct: Aligning language model with self generated instructions. arXiv preprint arXiv:2212.10560, 2022.
- Wang et al. [2023] Weihan Wang, Qingsong Lv, Wenmeng Yu, et al. Cogvlm: Visual expert for pretrained language models. arXiv preprint arXiv:2311.03079, 2023.
- Wei et al. [2022] Jason Wei, Xuezhi Wang, Dale Schuurmans, et al. Chain-of-thought prompting elicits reasoning in large language models. In NeurIPS, volume 35, pages 24824–24837, 2022.
- Xu et al. [2023] Peng Xu, Wenqi Shao, Kaipeng Zhang, et al. Lvlm-ehub: A comprehensive evaluation benchmark for large vision-language models. arXiv preprint arXiv:2306.09265, 2023.
- Ye et al. [2023a] Qinghao Ye, Haiyang Xu, Guohai Xu, et al. mplug-owl: Modularization empowers large language models with multimodality. arXiv preprint arXiv:2304.14178, 2023.
- Ye et al. [2023b] Qinghao Ye, Haiyang Xu, Guohai Xu, et al. mplug-owl: Modularization empowers large language models with multimodality. arXiv preprint arXiv:2304.14178, 2023.
- Yu et al. [2023] Weihao Yu, Zhengyuan Yang, Linjie Li, et al. Mm-vet: Evaluating large multimodal models for integrated capabilities. arXiv preprint arXiv:2308.02490, 2023.
- Zhang et al. [2022] Susan Zhang, Stephen Roller, Naman Goyal, et al. Opt: Open pre-trained transformer language models. arXiv preprint arXiv:2205.01068, 2022.
- Zhang et al. [2023] Pan Zhang, Xiaoyi Dong Bin Wang, Yuhang Cao, Chao Xu, et al. Internlm-xcomposer: A vision-language large model for advanced text-image comprehension and composition. arXiv preprint arXiv:2309.15112, 2023.
- Zhu et al. [2021] Jiawen Zhu, Jinye Ran, Roy Ka-wei Lee, et al. Autochart: A dataset for chart-to-text generation task. arXiv preprint arXiv:2108.06897, 2021.
- Zhu et al. [2023] Deyao Zhu, Jun Chen, Xiaoqian Shen, et al. Minigpt-4: Enhancing vision-language understanding with advanced large language models. arXiv preprint arXiv:2304.10592, 2023.