[1,2]\fnmDouglas J. \surJerolmack
1]\orgdivDepartment of Earth and Environmental Sciences, \orgnameUniversity of Pennsylvania, \orgaddress\cityPhiladelphia, \postcode19104, \statePA, \countryUSA
2]\orgdivDepartment of Mechanical Engineering and Applied Mechanics, \orgnameUniversity of Pennsylvania, \orgaddress\cityPhiladelphia, \postcode19104, \statePA, \countryUSA
Origins of complexity in the rheology of Soft Earth suspensions
Abstract
When wet soil becomes fully saturated by intense rainfall, or is shaken by an earthquake, it may fluidize catastrophically [1]. Sand-rich slurries are treated as granular suspensions, where failure is related to an unjamming transition and friction is controlled by particle concentration [2] and pore pressure [3]. Mud flows are modeled as complex fluids akin to gels, where yielding and shear-thinning behaviors arise from inter-particle attraction and clustering [4, 5]. Here we show that the full range of complex flow behaviors previously reported for natural debris flows – dense slurries of soil and water – can be reproduced with suspensions made only of water, sand and clay. Going from sand-rich to clay-rich suspensions, we observe a continuous transition from brittle (Coulomb-like) to ductile (perfect plastic) yielding that is characterized by (i) a decrease in the stress drop associated with yielding, (ii) an increase in the shear-thinning exponent from zero to 1/2, and (iii) a decrease in the normal force. We propose a general constitutive relation for soil suspensions, with a particle rearrangement time that is controlled by yield stress. Our experimental results are supported by models for yielding of idealized amorphous solids [6, 7], suggesting that the paradigm of non-equilibrium phase transitions can help to understand and even predict complex behaviors of Soft Earth suspensions.
keywords:
dense suspensions, soft matter, geophysical flows, Soft Earth GeophysicsEarth’s surface is covered in heterogeneous and soft particulate material that we call soil. To first order, we may consider Soft Earth suspensions – and their associated geophysical flows – to be composed of three ingredients: frictional particles (sand/silt), cohesive particles (clay, fine silt, organic material), and water [8]. Apparently solid soil can suddenly lose rigidity when stressed; for example, earthquake-induced liquefaction, the collapse of earth dams, or the failure of water-soaked hillsides that forms landslides and debris flows [1, 9]. Whether and how soil yields and flows under environmental loads is exquisitely sensitive to the relative proportions of the three main ingredients [10]. Here we focus on debris flows: dense, viscous and fast-flowing suspensions of soil. With the increasing frequency and intensity of extreme weather and wildfire due to climate change, the hazard posed by debris flows is growing [11]. Debris flows are complex and transient phenomena, where shear stress, flow speed, particle size and water content co-evolve [3]. Controlled laboratory tests are useful for taming this complexity by fixing variables, allowing determination of the constitutive relations among shear stress (), solids volume fraction () and shear rate (). Measured ‘flow curves’ are typically fit with the phenomenological Hershel-Bulkley equation, , where is a yield stress below which flow cannot occur, is the flow index and is an empirical constant. Previous studies have established that debris flows are typically shear thinning ( and have a significant yield stress (), and that these properties are sensitive to particle concentration [12, 13]. Even under idealized conditions, however, laboratory studies have not provided a clear picture on how debris-flow material composition controls flow behavior. The physical meaning of and are ambiguous, which limits extrapolation of results beyond the laboratory.
Some physical insight has been gained by classifying debris flows into two end-member types based on soil composition: “Granular” and “Cohesive” [14, 15]. Granular debris flows are composed mostly of frictional, cohesionless soil – i.e, sand and larger particles. Our previous work demonstrated that weakly cohesive debris-flow materials from the California Coast Range could be described by constitutive relations developed for idealized granular suspensions [16], by accounting for two material-specific quantities associated with jamming of granular media: the jamming fraction () above which flow cannot occur, and the yield stress [2]. Using these quantities to normalize the data, we found the resultant flow behavior of debris-flow materials was well described by a dimensionless Bingham model: elastic-like behavior at low shear rate/stress, viscous flow behavior (i.e., ) at high shear rate/stress, and a rapid transition between them consistent with discontinuous, Coulomb-like failure (Fig. 1) This picture is incompatible, however, with the Cohesive debris-flow end member. Clay-rich debris-flow materials from the French Alps were shown to yield gradually and continuously, with much smaller than one [4] – flow curves cannot be fit with the same Bingham model (Fig. 1). Yielding dynamics of clay suspensions are strongly related to attractive interaction among particles, and these suspensions may exhibit solid-like behavior even at low [17, 18, 19]. Clay suspensions also exhibit hysteresis and thixotropy, that change with the strength of inter-particle attraction (e.g., particle surface charge and solution ionic strength) [20, 17]. All of these behaviors are reminiscent of gels, in which inter-particle attraction and clustering – rather than friction and jamming – determine yield and flow properties [20].

Motivated by industrial applications, there is increasing interest in examining the rheologic behaviors of granular materials suspended in complex fluids such as gels [22, 23, 24, 25] and emulsions [26]. While progress has been made in extending constitutive models to such complex mixtures [26, 25], no study has probed the transition from granular suspension to gel. Some insight on the possible nature of this transition can be gained by examining yielding in other amorphous solids. A numerical study discovered that a transition from brittle yielding typical of “hard” glass materials, to ductile yielding common in “soft” glassy materials, can arise within an amorphous solid by changing its degree of annealing – i.e., the initial stability of the material [6]. Theoretical analysis of elasto-plastic models – which are commonly used to describe soft glassy materials like emulsions, gels and foams – has constrained the value in the vicinity of yielding [27, 7]. The reported rheologies of debris-flow materials summarized earlier indicate that there must be a transition from frictional to cohesive control, as the relative proportion of clay to sand is increased in a suspension. Flow curves suggest that this corresponds to a transition from brittle, Coulomb-type failure to ductile, plastic failure (Fig. 1b,c). Here we build a minimal experimental system to examine this transition: suspensions of water, frictional sand and cohesive kaolin clay. Carefully controlled rheologic tests reveal a continuous transition from brittle to ductile yielding as the relative proportion of clay to sand is increased. The transition appears to be related to percolation of cohesive-particle networks. Our model Soft Earth suspensions capture the full range of previously reported debris-flow rheologies, and are used to build a physically-based constitutive relation with parameters that are related to material properties.
Developing a generic constitutive relation
The dimensionless Bingham model that we previously developed for weakly cohesive debris-flow slurries [2] has the form , where the dimensionless shear stress is , and the dimensionless viscous stress is the inverse Bingham number. Note that can also be interpreted as a dimensionless shear rate , where is a material relaxation timescale [4]. In this model, elastic deformation produces a constant at low , while viscous dissipation becomes dominant for large . The abrupt transition from solid to viscous-flow states in this model corresponds to a brittle yielding behavior expected for frictional or highly annealed materials (Fig. 1c). We found that the effective viscosity followed the rheology of dense granular suspensions, i.e., depends on the distance from jamming, , where and is a material-dependent jamming fraction [2]. The yield stress was also found to be a function of the distance from jamming. This model cannot describe clay-rich suspensions, however, that exhibit ductile yielding (Fig. 1). Caggioni suggested a generic constitutive relation for soft glassy materials: , where the three terms on the right hand side are elastic, plastic and viscous dissipation, respectively [28]. The value was chosen as the typical plastic yielding exponent for amorphous solids, and is a material-specific relaxation time or, equivalently, is a critical strain rate for yielding [29, 30]. Their model was validated against experiments of various yield-stress fluids.
While the value for the plastic yielding exponent is commonly taken to be , theoretical studies indicate that may vary depending on material properties [7]. More broadly, if brittle materials correspond to and ductile materials have , what is the proper description for intermediate materials? For granular suspensions we posit the following: as the proportion of attractive particles (clay) increases from (pure sand suspensions), there is a percolation-like transition where the yielding behavior becomes progressively more ductile once stress transmission is dominated by cohesive elements. This means that, beyond a critical value of , the transitional (yielding) region of the flow curve grows with increasing (Fig. 1c). In terms of the constitutive equation, this gradual transition from brittle to increasingly ductile behavior would correspond to increasing . To describe this behavior, we propose a generic dimensionless constitutive relation that builds on the models above:
| (1) |
In this expression the dimensionless shear rate . The coefficient describes the onset of plastic yielding of the suspension. For sand-rich granular suspensions we expect , and that is a timescale associated with the viscous dissipation of particle motion as described by the model of Boyer et al. [16]. For clay-rich suspensions, however, should be a material relaxation time that increases with the strength of inter-particle attraction [4] – as observed for soft microgel pastes [31]. More, clay-rich suspensions are expected to have a limiting value of for ductile materials. Below we use , and as fitting parameters, and examine how they change across a transition from sand-rich (frictional) to clay-rich (cohesive) suspensions.
Measuring and understanding Soft Earth suspension rheologies
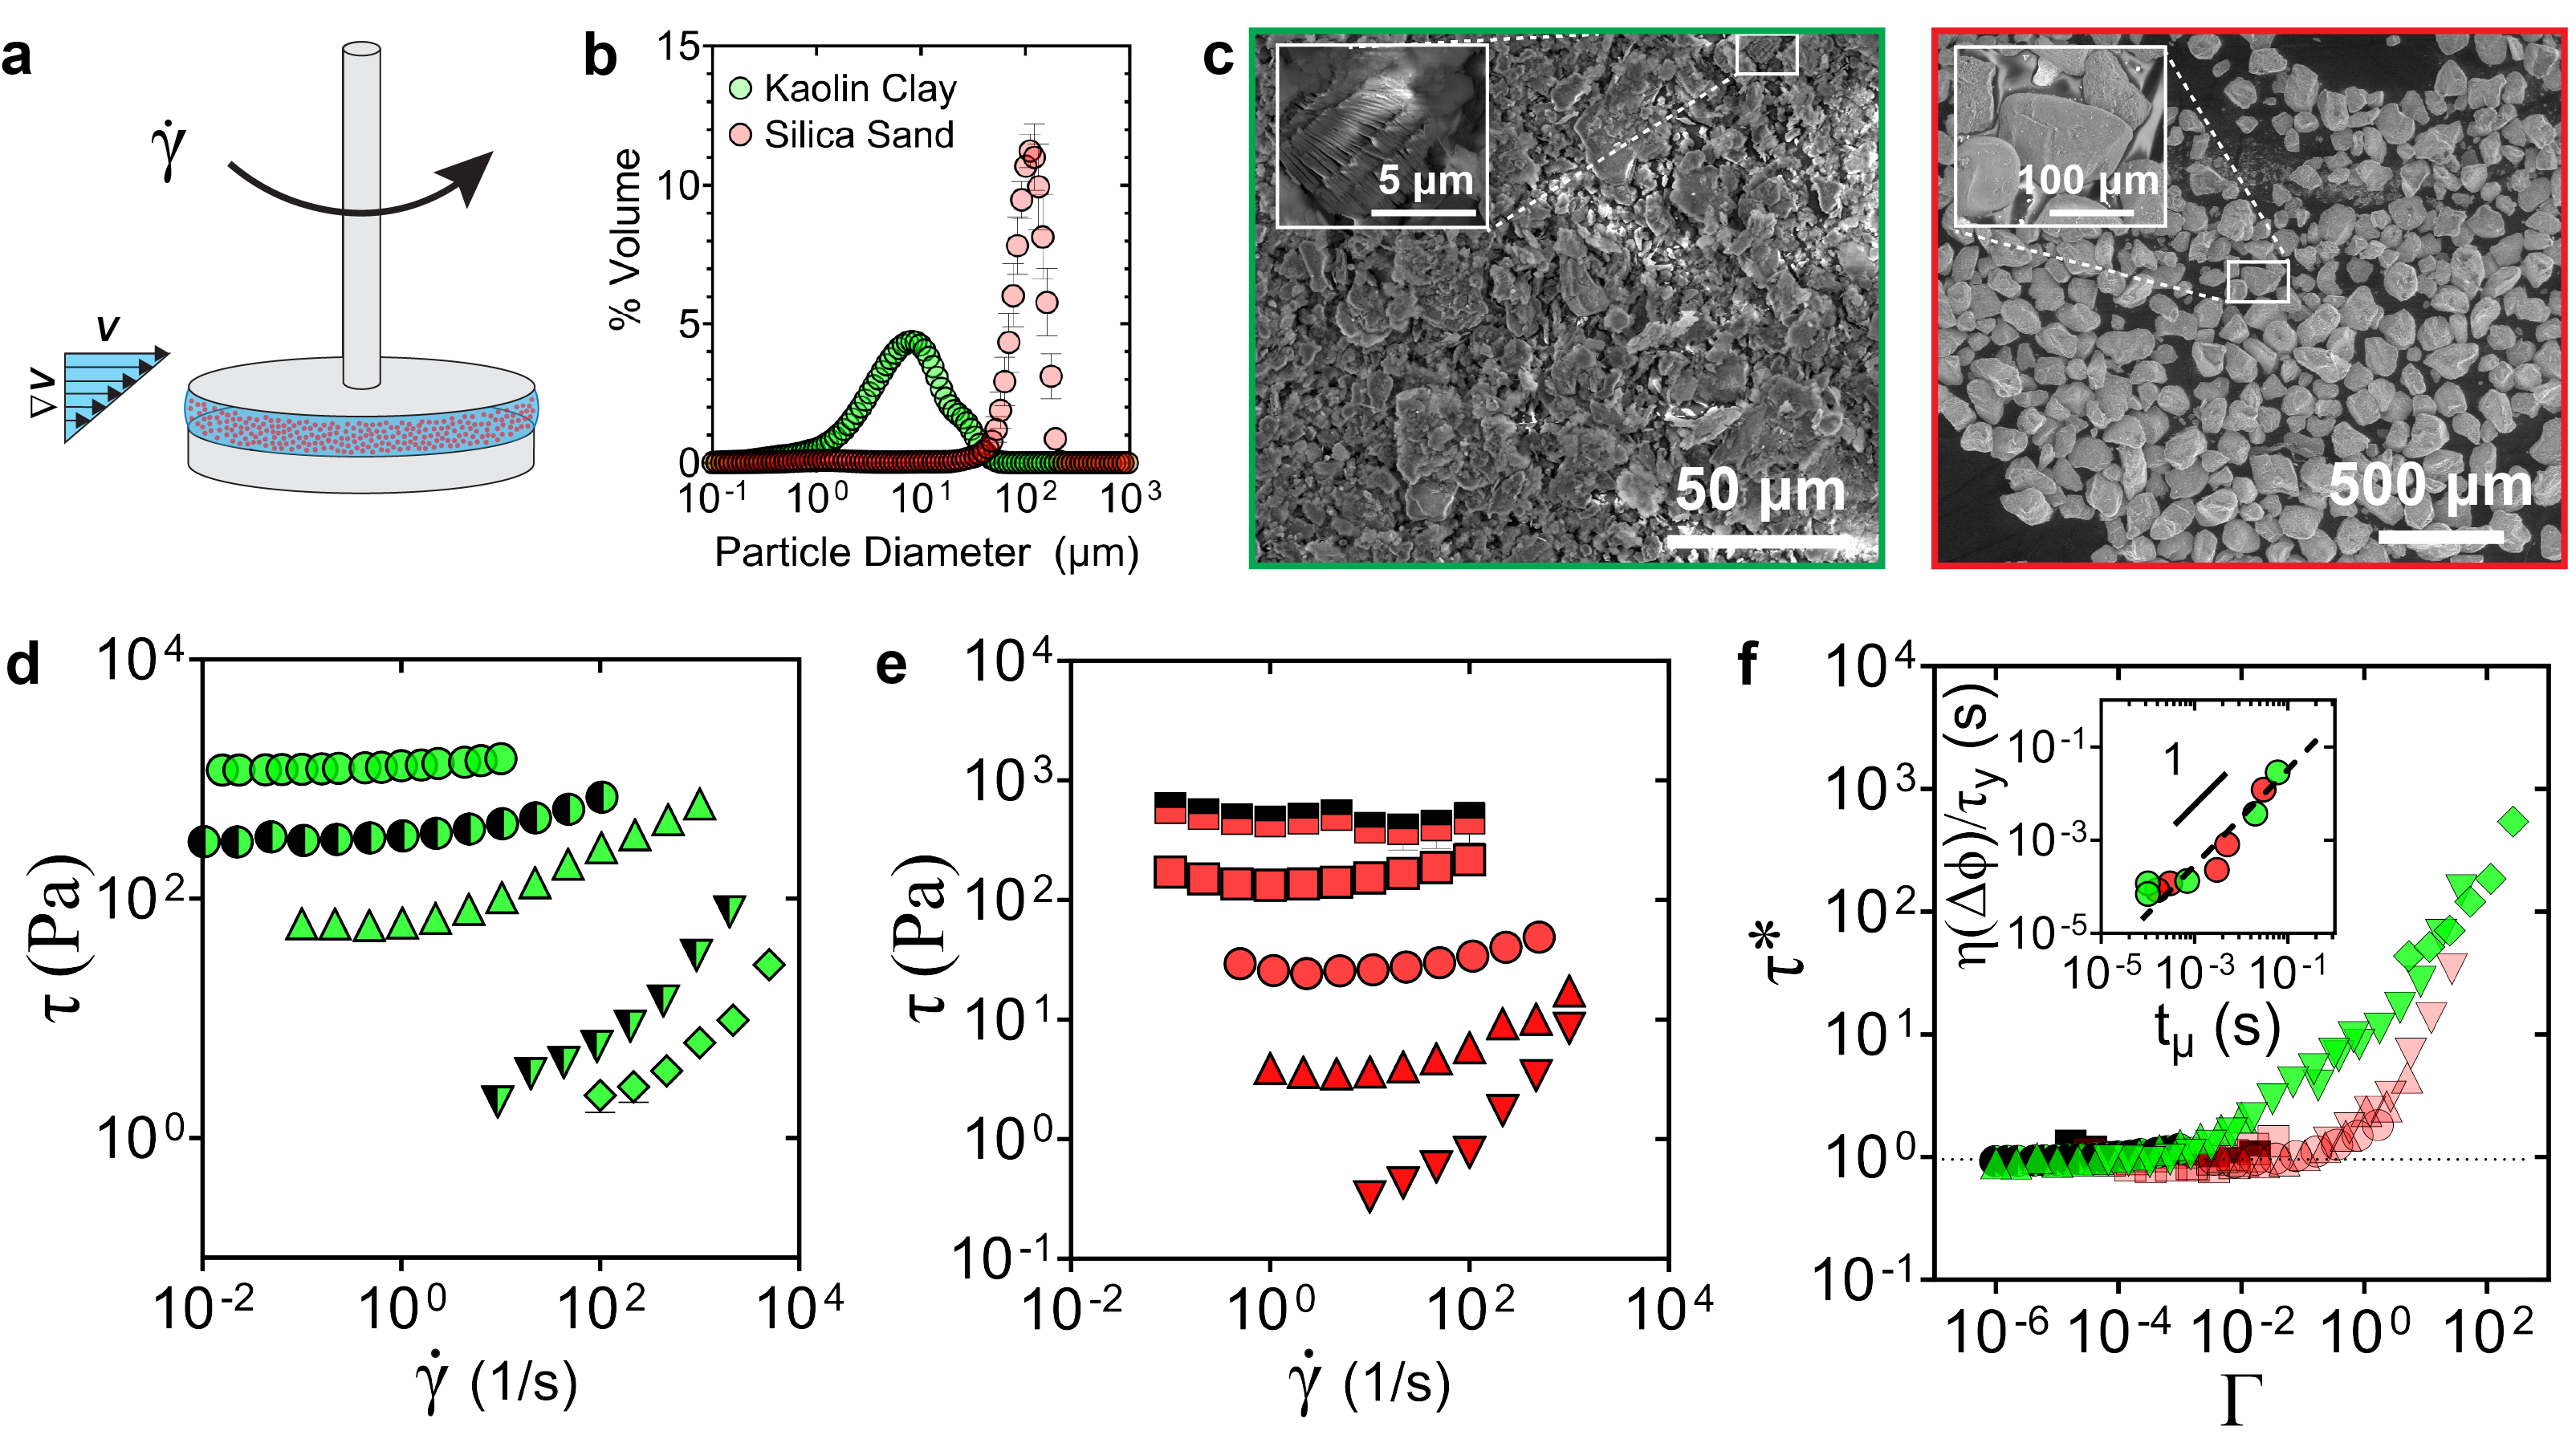
We perform rheological experiments in a stress-controlled, parallel-plate rheometer (Fig. 2a). This setup allows us to vary the gap height, and measure both shear and normal stresses. Following previous protocol [2], we were careful to avoid the effects of suspension wall slip, jamming/shear banding, particle sedimentation, and particle ejection at the air-suspension interface. These factors place limits on the experimentally accessible ranges of shear rates, volume fractions, and clay concentrations, as discussed below. Pre-shear protocols ensured that steady-shear flow curves were reproducible; detailed information about sample preparation and rheological measurements appears in the “Methods” section.
We create model Soft Earth suspensions by varying the proportions of de-ionized water, silica sand and kaolin clay (see Fig. 2b for particle size distributions). The total solids volume fraction (sand + clay) is denoted by , and the relative clay fraction is defined . Previous zeta potential () measurements of the same kaolin particles in de-ionized water found mV, which corresponds to moderately strong aggregation [32]. We find that below and , the yield stress of the suspension is insufficient to prevent sedimentation of sand particles; this sets an experimental lower limit for our sand-rich suspensions. The upper limit of for sand-rich () suspensions is the point at which the sample becomes difficult to process – i.e., it jams. For pure clay suspensions (), varies from a lower limit to an upper achievable limit . Steady-shear flow curves ( vs. ) are generated for each suspension (Fig. 2), following a protocol we established previously for debris-flow slurries [2].
The yield stress for each suspension is obtained from a fit of the Herschel-Bulkley equation to the steady-shear flow curve, whereas for each suspension is chosen such that all curves of differing values for a given value of collapse and yielding is centered around . We also perform transient tests to examine yielding, where strain is applied at a constant rate . In the quasi-static regime (), the stress build-up with applied strain, , provides a measure of elasticity, while the nature and magnitude of the stress drop at yielding indicates how brittle or ductile yielding is [6].
Sand-rich () suspensions show the same flow behavior as debris-flow slurries from the California Coast Range, which had comparable clay and sand content [2]. Cohesion contributes to a yield stress at low (dimensionless shear-rate), while for large the samples behave like a granular (frictional) suspension (Fig 2e). The sand-rich suspensions for all values of can be collapsed onto a dimensionless Bingham curve, i.e., (Fig 2f). As expected, yield stress increases with , and there is no appreciable plastic dissipation stress (). More, we find that (Fig. 2f inset); that is, the experimentally determined timescale for collapsing the flow curves corresponds to the particle rearrangement timescale in a yield-stress fluid. Transient tests for nearly-jammed suspensions () show a sharp stress drop (Fig. 3c) that is characteristic of brittle yielding. Our sand-rich suspensions jam around , consistent with typical granular materials [16] and the California Coast Range materials [2]. For volume fractions we observe a positive normal force (Fig. 4b), consistent with force-chain formation and dilatancy in granular suspensions [33]; the importance of this will be discussed below. Qualitatively and quantitatively, dense sand-rich suspensions exhibit brittle yielding behavior.
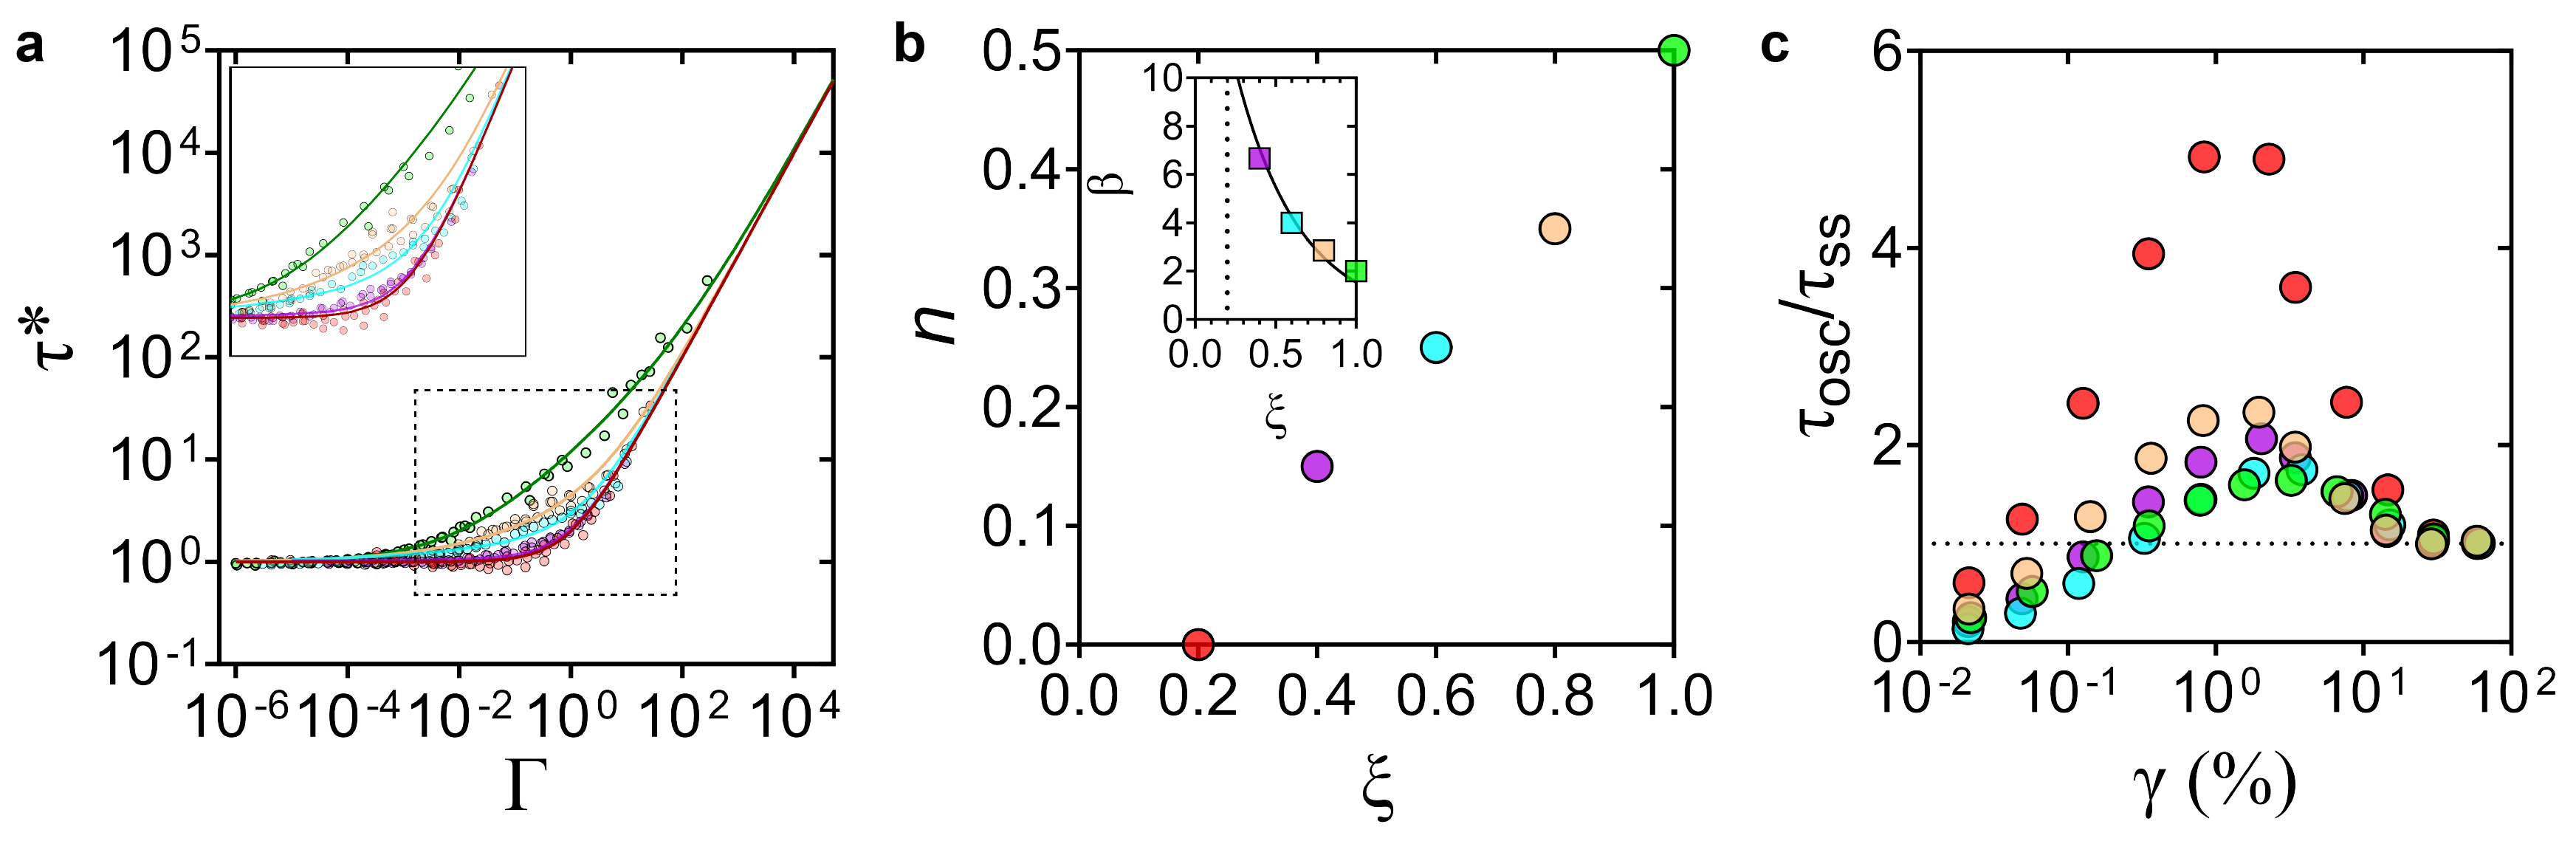
Pure clay () suspensions are markedly different from sand-rich ones, and exhibit flow curves similar to the clay-rich French Alps debris-flow materials. In the dilute regime () the suspension flow curve behaves like a Newtonian fluid (Fig 2d). As is increased, the yield stress rapidly increases and the material jams at roughly . Clay suspensions are known to jam at significantly lower volume fractions than granular suspensions, due to attractive particle networks that percolate across the sample [20, 4]. Similar to the sand-rich suspensions, for all clay suspensions with a yield stress (), we find that (Fig 2f inset). When non-dimensionlized, the pure clay data for all can be collapsed onto a single curve; this curve, however, is distinct from the sand-rich data. In particular, there is the marked emergence of an intermediate yielding regime – spanning almost three orders of magnitude in – indicating ductile behavior (Fig 2f). Fitting the collapsed data to Eq. 1, we find consistent with soft glassy materials, and . We suspect that the exponent is related to the mechanism of plastic dissipation, while the coefficient is determined by the strength of inter-particle attraction. To test this idea, we conduct additional experiments with identical clay and water content, but varying ionic strength through the addition of 0.001 M and 0.1 M NaCl. Salt screens the repulsive net charge of clay particles and facilitates stronger aggregation [32, 34]. As expected, we find that increases systematically with ionic strength, but remains constant (Extended Data Fig. 1, Table 1). Quasi-static strain tests of nearly-jammed clay-rich suspensions () show a very small stress drop after yielding (Fig. 3c), and negligible normal force (Fig. 4b). In sum, clay suspensions exhibit all of the hallmarks of ductile yielding, and do not show any effects of granular suspensions. Our results support the characterization of clay suspensions as a gel.
We can now examine the transition from brittle to ductile behavior as relative clay content is systematically changed between and . Transient shear tests show that as increases, the stress drop associated with yielding systematically decreases (Fig. 3c, Extended Data Fig. 2). For steady-shear flow curves, we observe that the failure envelope – defined by the range in associated with the transitional regime between purely elastic and pure viscous flow (Methods) – increases systematically with increasing (Fig. 4a). Fitting Eq. 1 to the data, we observe that increases with from a lower limit of at to a maximum of at (Fig. 3). We also observe that increases systematically with clay content (Extended Data Fig. 3, Table. 1), consistent with our proposal that this parameter is related to the strength of cohesive bonds. Previous studies have mapped gelation in colloid and polymer systems to percolation [35, 36, 37]. If the percolation interpretation is relevant for our system, it implies that increasing corresponds to increasing the cluster size of the attractive clay network – and that the brittle-ductile transition occurs when these cohesive particle networks percolate across the sample. Normal forces become negligible for , suggesting that granular force chains are unable to percolate the sample for larger clay concentrations (Fig. 4). A different take on criticality is to examine the behavior of the “yielding exponent”, defined in elasto-plastic models as [7]. In this view, in the fully ductile regime corresponding to pure clay suspensions (). As decreases toward a critical value associated with sand-rich suspensions, diverges as yielding becomes increasingly discontinuous (Fig. 3b inset). In the limit that , which corresponds to roughly for our suspensions, suspension yielding is discontinuous and reduces to classical Coulomb failure.
Discussion and Implications
The origins of complex flow behaviors for Soft Earth suspensions arise from two critical points. First is the well known jamming transition, in which viscosity diverges with increasing volume fraction as [16, 2, 38]. The second, revealed here, is the ductile to brittle transition wherein as from above. Sand-rich slurries match the behavior of granular debris flows; they exhibit brittle yielding corresponding to a rapid transition from frictional to viscous stress dissipation. These suspensions are compressible, and effects like Reynolds dilation and transient pore pressure must be considered for simulating debris flows [3]. Even suspensions with moderate clay content () still behave as granular suspensions; however, the yield stress arising from cohesion must be taken into account [2]. Clay-rich slurries reproduce the observed rheology of Cohesive debris flows; ductile yielding arises due to strong plastic stress dissipation. Strong cohesion acts as a confining pressure [39] that likely shuts off Reynolds dilation and the associated pore pressure effects; these suspensions can be modeled as gels, where normal forces are negligible (Fig. 4b). Two important concepts emerging from granular and suspension rheology are used to build the constitutive Eq. 1. First, there are elastic, plastic and viscous stresses that arise from the distinct material components – frictional sand, attractive clays, and water – and these stresses are additive [39, 28, 40]. Second, rheologies can be assembled by nondimensionalizing the shear rate with an appropriate microscopic rearrangement timescale [16]. In contrast to (cohesionless) granular suspensions, however, the yield stress – rather than the confining pressure – is the relevant quantity. Thus, the microscopic timescale . Field-scale debris flows may introduce inertial effects for both particles (collisions) and fluid (turbulence) [2] that are not considered here. Exploring the inertial regime for cohesive suspensions – as has been done recently for granular suspensions [40] – is a logical next step.
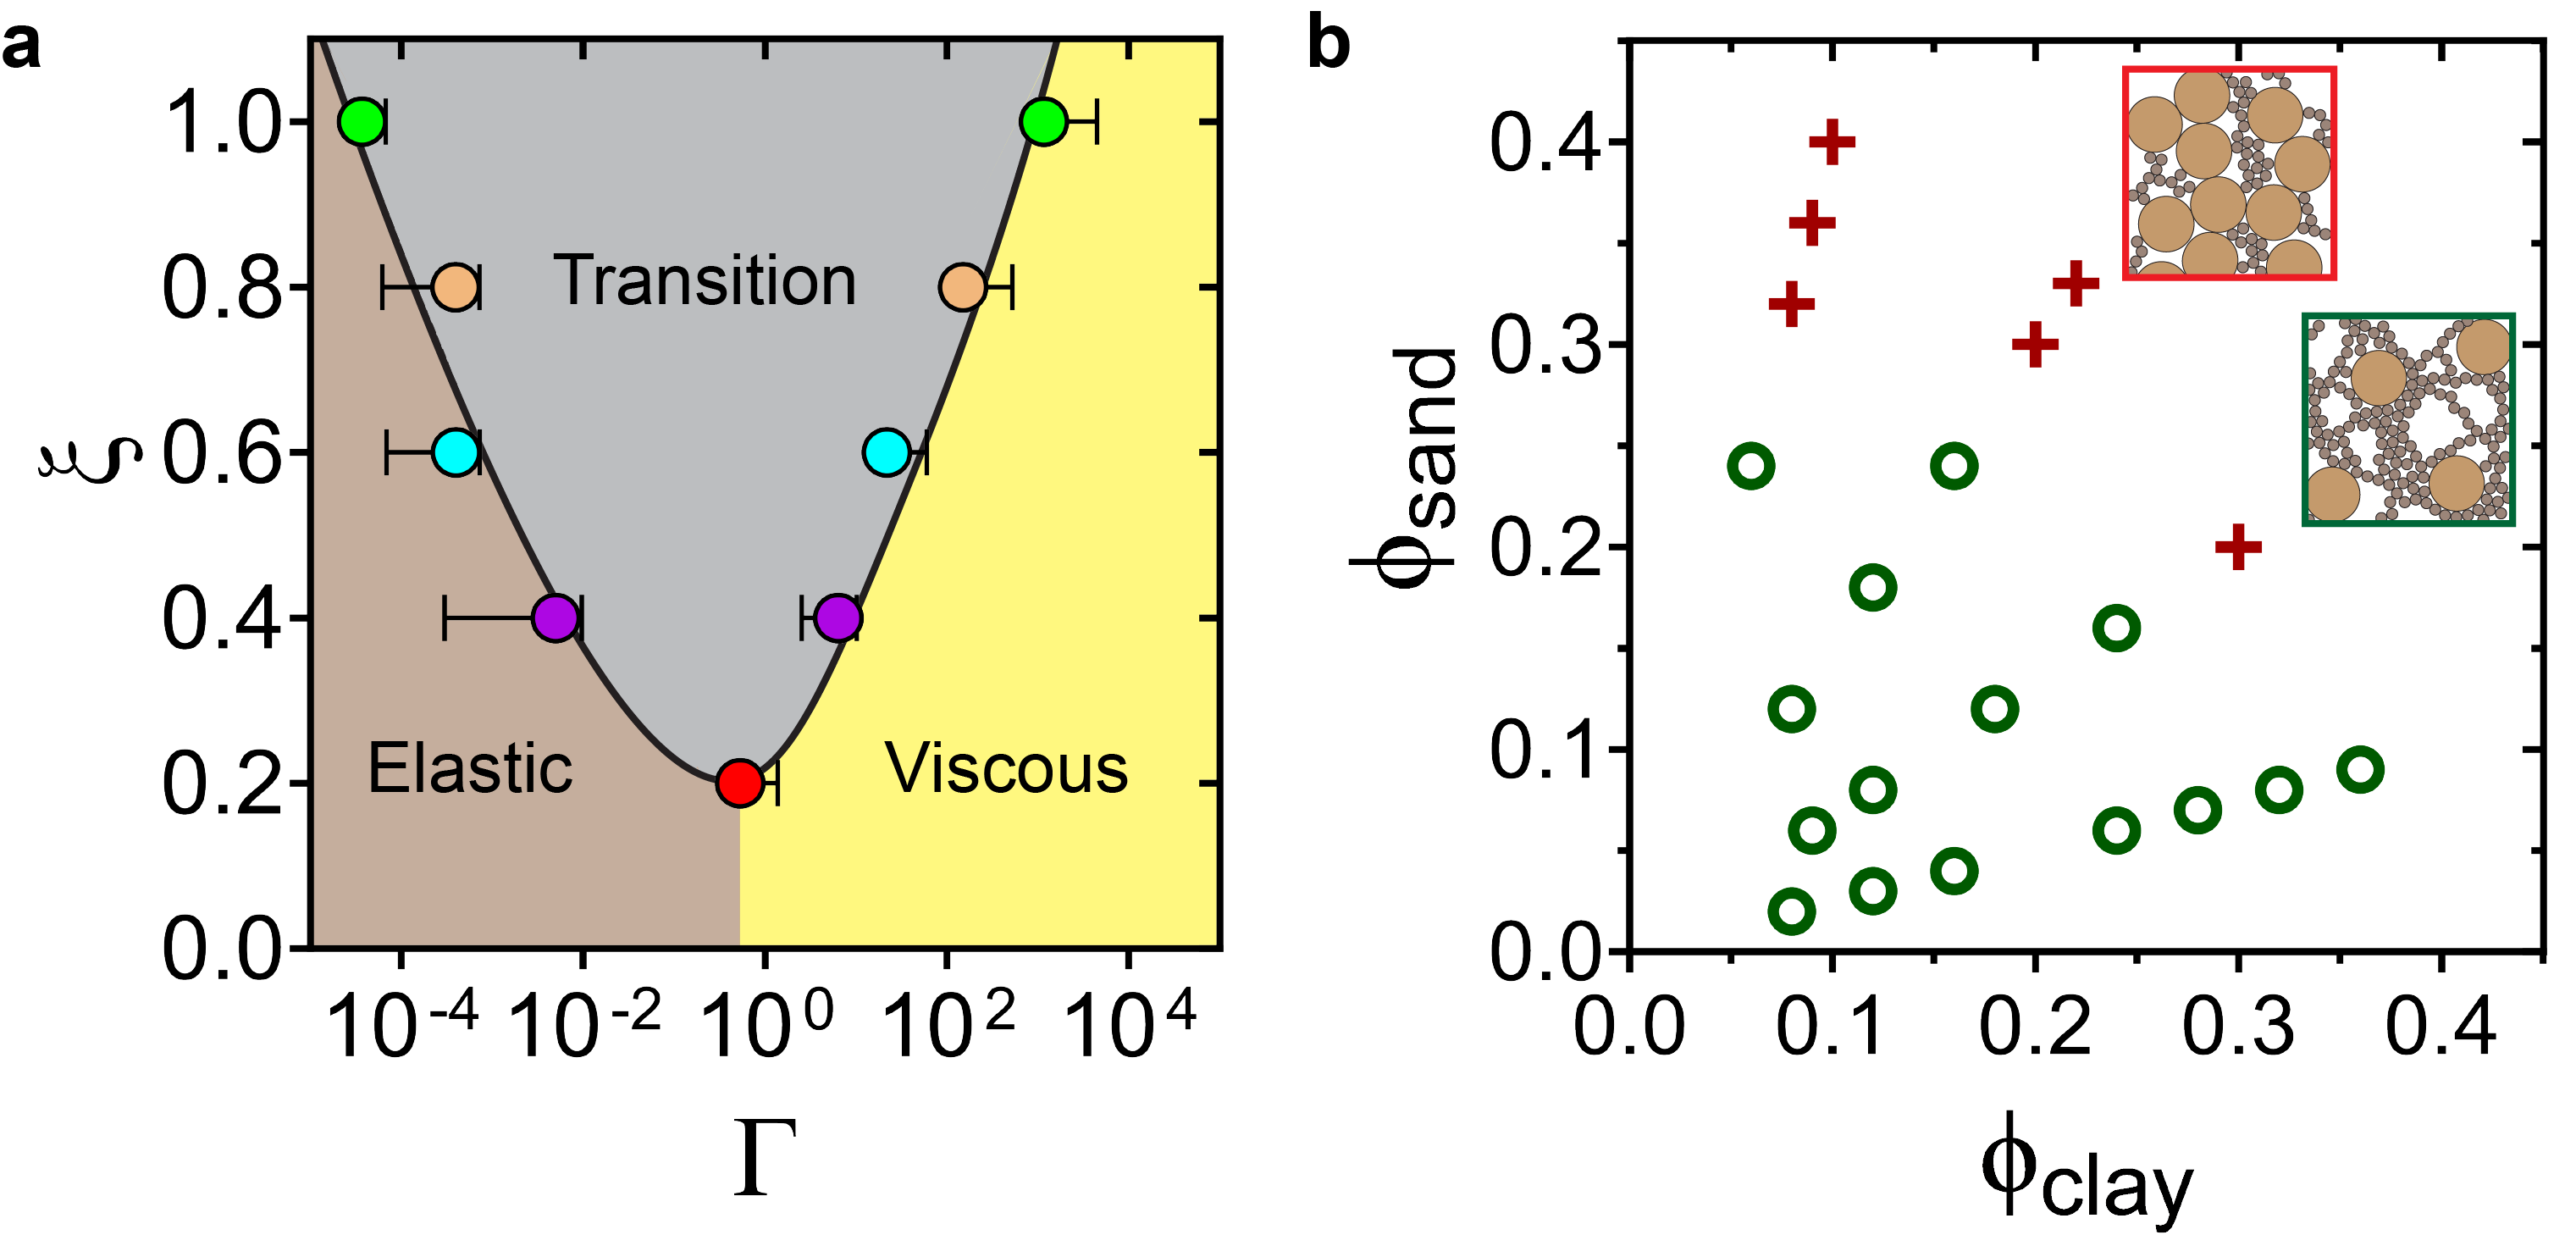
The brittle-ductile transition in our suspensions appears to be due to a handoff from frictional to cohesive control, when clay aggregates percolate the sample. This transition is manifest as a continuous increase in plasticity, and decrease in granular effects such as a normal force, as the relative clay concentration for dense suspensions is increased (Fig. 4). There are currently no modeling studies to directly compare to our results. Some of our observations could be anticipated from simulations of idealized amorphous solids, however, which helps to understand the origins of this transition. Granular simulations found that frictional particles exhibit brittle yielding, while the same particles without friction showed ductile failure [41]. A different simulation study of an idealized glass found that increasing the lengthscale of inter-particle interactions was sufficient to drive a transition from brittle to ductile failure [42]. Our brittle and ductile suspensions exhibit similar behavior to highly and poorly annealed glasses, respectively [6]. These results suggest that adding clay may lubricate contacts among sand grains [15], increase the lengthscale of cooperative particle motion [20], and/or maintain “soft spots” that do no anneal under shear [6]. Although these mechanisms are different, they all act to delocalize failure and prevent formation of a slip plane – which is the origin of brittle failure. Probing the brittle-ductile transition in an optically-transparent cohesive-frictional mixture, such as clear particles suspended in a gel [25], would allow visualization of the microscopic dynamics underlying failure; we leave this for future work.
We conclude with considering the consequences of our findings for yielding behavior in the Soft Earth. Sudden liquefaction of soil, due to seismic shaking or rainfall, is typically limited to water-saturated sand-rich materials that exhibit brittle failure due to pore-pressure induced dilation [3, 9]. Cohesive soils tend to form slow “earthflows” that creep ductily [43]. Shale, a type of sedimentary rock, has been shown to undergo a transition from brittle to ductile failure when the fraction of cohesive materials (clay + organics) exceeds 0.35 [44], consistent with our data and a percolation-like transition. Finally, deep in the Earth’s lithosphere the rock becomes soft, and the accompanying brittle-to-ductile transition exerts a strong control on the source, rupture dynamics and magnitude of earthquakes [45]. While these geophysical problems involve disparate materials, scales and stresses, the discovered connections – from idealized amorphous solids to our model Soft Earth suspensions to natural debris-flow materials – embolden us to seek commonality in failure across more Earth materials.
Methods
Grain size measurements Particle size distributions were measured using a Beckman-Coulter Particle Size Analyzer LS13-320. Grain size was determined in 114 log-spaced bins over the range 0.04 m to 2000 m. The particle size distributions in both kaolin clay and silica sand contained a single mode, and thus had distinct average particle size population. Microscopic images of silica sand and kaolin clay were obtained using Scanning Electron Microscope (FEI Quanta 600 Environmental Scanning Electron Microscope). The images were acquired at an accelerating voltage of 15 kV and a water vapor pressure of 0.75 torr.
Sample preparation Model Soft Earth suspensions were prepared at desired final concentrations () by mixing the three components – sand, clay, and water – in varying proportions. First, a pre-determined amount of kaolin clay was mixed with de-ionized water for 30 mins in a high-shear mixer. The mixture was left overnight to allow the clay particles to absorb water and reach an equilibrium state. Second, the silica sand was added to the mixture and further mixed in the high-shear mixer for 10 mins to ensure uniform distribution. For sample preparation purposes we use density of particles (both sand and clay) and deionized water as 2650 kg/m3 and 1000 kg/m3 respectively.
Rheological characterizations All rheological measurements are carried out using a TA Instruments DHR-3 Model stress-controlled rheometer using a 40mm parallel-plate setup at 250C. To reduce the sample slip effects in the boundaries during our measurements, both the top plate and the bottom plate were modified by attaching a 50-Grit size serrated surfaces. This translated to a roughness length scale 300 m, which is three times the average sand particle size. We maintain a gap height of 1mm for all the experiments ( 10 times the largest particle size), which is shown to reduce particle confinement effects during the shear flow [46].
Establishing reproducible rheological measurements All suspensions were pre-sheared to ensure that the samples did not have a shear history, allowing us to generate reproducible steady-shear and stress-growth rheological measurements. In the first step, samples were sheared using a large-amplitude oscillatory protocol ( = 500%, = 10 rad/s) to minimize the directional bias in the microstructures that come from steady shear protocols [47]. The breaking of the internal structure was monitored using the macroscopic elastic modulus (), which decreased and then plateaued within 60s, for all our samples. During the second step, the sample was allowed to recover. The recovery time was estimated using a small-amplitude oscillatory protocol ( = 0.05%, = 1 rad/s), which resembles near-equilibrium rheology measurements [48]. We monitored the value of the elastic modulus, which grew as the suspension structure recovered, and plateaued to a constant value for all our samples within 30-80s.
Steady shear and transient rheological characterizations Following the pre-shear protocols above, the steady-shear flow curves were obtained by: applying a constant shear rate, waiting for the stress to equilibrate to determine shear stress , and then repeating the same for all shear rates. The maximum and minimum shear stress limits in our flow curves were set by the interfacial and gravitational stresses in the particle scale, respectively. The interfacial stress is set by , where is the stress at the air-water interface and is the average radius ( 50 m) for the larger particle set (silica sand). This value sets the shear stress beyond which particles may eject out of the fluid-air interface. The lower shear stress limit is set by the gravitational force acting on a particle scale given by , where is the density difference between particle and the suspending fluid (1650 kg/m3) and is acceleration due to gravity (9.8 m/s2). Below this stress, the sedimentation effects due to settling of silica grains is important [2]. Transient rheological characterizations were performed using oscillatory amplitude sweep protocol at constant oscillations ( rad/s). Samples prepared close to their respective jamming points () were loaded on the rheometer, followed by a percentage amplitude sweep from 0.01 - 100 %, to generate the shear stress-strain () curves.
References
- \bibcommenthead
- [1] Iverson, R. M., Reid, M. E. & LaHusen, R. G. Debris-flow mobilization from landslides. Annual Review of Earth and Planetary Sciences 25, 85–138 (1997).
- [2] Kostynick, R. et al. Rheology of debris flow materials is controlled by the distance from jamming. Proceedings of the National Academy of Sciences 119, e2209109119 (2022).
- [3] Iverson, R. M. & George, D. L. A depth-averaged debris-flow model that includes the effects of evolving dilatancy. i. physical basis. Proceedings of the Royal Society A: Mathematical, Physical and Engineering Sciences 470, 20130819 (2014).
- [4] Coussot, P. Structural similarity and transition from newtonian to non-newtonian behavior for clay-water suspensions. Physical Review Letters 74, 3971 (1995).
- [5] Ancey, C. & Jorrot, H. Yield stress for particle suspensions within a clay dispersion. Journal of Rheology 45, 297–319 (2001).
- [6] Ozawa, M., Berthier, L., Biroli, G., Rosso, A. & Tarjus, G. Random critical point separates brittle and ductile yielding transitions in amorphous materials. Proceedings of the National Academy of Sciences 115, 6656–6661 (2018).
- [7] Lin, J. & Wyart, M. Microscopic processes controlling the herschel-bulkley exponent. Physical review E 97, 012603 (2018).
- [8] Jerolmack, D. J. & Daniels, K. E. Viewing earth’s surface as a soft-matter landscape. Nature Reviews Physics 1, 716–730 (2019).
- [9] Huang, Y. & Yu, M. Hazard analysis of seismic soil liquefaction (Springer, 2017).
- [10] Huang, Y. & Zhao, L. The effects of small particles on soil seismic liquefaction resistance: current findings and future challenges. Natural hazards 92, 567–579 (2018).
- [11] Kean, J. W. & Staley, D. M. Forecasting the frequency and magnitude of postfire debris flows across southern california. Earth’s Future 9, e2020EF001735 (2021).
- [12] Major, J. J. & Pierson, T. C. Debris flow rheology: Experimental analysis of fine-grained slurries. Water Resources Research 28, 841–857 (1992).
- [13] Coussot, P. & Piau, J. M. On the behavior of fine mud suspensions. Rheologica acta 33, 175–184 (1994).
- [14] Coussot, P. & Meunier, M. Recognition, classification and mechanical description of debris flows. Earth-Science Reviews 40, 209–227 (1996).
- [15] Ancey, C. Plasticity and geophysical flows: A review. Journal of non-Newtonian fluid mechanics 142, 4–35 (2007).
- [16] Boyer, F., Guazzelli, É. & Pouliquen, O. Unifying suspension and granular rheology. Physical review letters 107, 188301 (2011).
- [17] Ran, R. et al. Understanding the rheology of kaolinite clay suspensions using bayesian inference. Journal of Rheology 67, 241–252 (2023).
- [18] Coussot, P., Nguyen, Q. D., Huynh, H. & Bonn, D. Avalanche behavior in yield stress fluids. Physical review letters 88, 175501 (2002).
- [19] Bonn, D., Coussot, P., Huynh, H., Bertrand, F. & Debrégeas, G. Rheology of soft glassy materials. Europhysics Letters 59, 786 (2002).
- [20] Bonn, D., Denn, M. M., Berthier, L., Divoux, T. & Manneville, S. Yield stress materials in soft condensed matter. Reviews of Modern Physics 89, 035005 (2017).
- [21] Guy, B., Richards, J., Hodgson, D., Blanco, E. & Poon, W. Constraint-based approach to granular dispersion rheology. Physical review letters 121, 128001 (2018).
- [22] Jiang, Y., Makino, S., Royer, J. R. & Poon, W. C. Flow-switched bistability in a colloidal gel with non-brownian grains. Physical Review Letters 128, 248002 (2022).
- [23] Li, Y., Royer, J. R., Sun, J. & Ness, C. Impact of granular inclusions on the phase behavior of colloidal gels. Soft Matter 19, 1342–1347 (2023).
- [24] Jiang, Y. & Seto, R. Colloidal gelation with non-sticky particles. Nature Communications 14, 2773 (2023).
- [25] Kammer, C., Blackwell, B., Arratia, P. E. & Ponte Castañeda, P. A homogenization model for the rheology and local field statistics of suspensions of particles in yield stress fluids. Journal of Rheology 66, 535–549 (2022).
- [26] Dagois-Bohy, S., Hormozi, S., Guazzelli, E. & Pouliquen, O. Rheology of dense suspensions of non-colloidal spheres in yield-stress fluids. Journal of Fluid Mechanics 776, R2 (2015).
- [27] Bocquet, L., Colin, A. & Ajdari, A. Kinetic theory of plastic flow in soft glassy materials. Physical review letters 103, 036001 (2009).
- [28] Caggioni, M., Trappe, V. & Spicer, P. T. Variations of the herschel–bulkley exponent reflecting contributions of the viscous continuous phase to the shear rate-dependent stress of soft glassy materials. Journal of Rheology 64, 413–422 (2020).
- [29] Lin, C.-R. & Chen, W.-J. The links-nodes-blobs model for shear-thinning-yield-stress fluids. Colloid and Polymer Science 277, 1019–1025 (1999).
- [30] Domenech, T. & Velankar, S. S. On the rheology of pendular gels and morphological developments in paste-like ternary systems based on capillary attraction. Soft matter 11, 1500–1516 (2015).
- [31] Cloitre, M., Borrega, R., Monti, F. & Leibler, L. Glassy dynamics and flow properties of soft colloidal pastes. Physical Review Letters 90, 068303 (2003).
- [32] Seiphoori, A., Gunn, A., Kosgodagan Acharige, S., Arratia, P. E. & Jerolmack, D. J. Tuning sedimentation through surface charge and particle shape. Geophysical Research Letters 48, e2020GL091251 (2021).
- [33] Gamonpilas, C., Morris, J. F. & Denn, M. M. Shear and normal stress measurements in non-brownian monodisperse and bidisperse suspensions. Journal of Rheology 60, 289–296 (2016).
- [34] Israelachvili, J. N. Surface forces (CRC Press, 2022).
- [35] De Gennes, P.-G. On a relation between percolation theory and the elasticity of gels. Journal de Physique Lettres 37, 1–2 (1976).
- [36] Del Gado, E., de Arcangelis, L. & Coniglio, A. Elastic properties at the sol-gel transition. Europhysics Letters 46, 288 (1999).
- [37] Stauffer, D., Coniglio, A. & Adam, M. Gelation and critical phenomena (Springer, 2005).
- [38] Pradeep, S., Nabizadeh, M., Jacob, A. R., Jamali, S. & Hsiao, L. C. Jamming distance dictates colloidal shear thickening. Physical Review Letters 127, 158002 (2021).
- [39] Vo, T. T., Nezamabadi, S., Mutabaruka, P., Delenne, J.-Y. & Radjai, F. Additive rheology of complex granular flows. Nature communications 11, 1476 (2020).
- [40] Tapia, F., Ichihara, M., Pouliquen, O. & Guazzelli, É. Viscous to inertial transition in dense granular suspension. Physical Review Letters 129, 078001 (2022).
- [41] Karimi, K., Amitrano, D. & Weiss, J. From plastic flow to brittle fracture: Role of microscopic friction in amorphous solids. Physical Review E 100, 012908 (2019).
- [42] Dauchot, O., Karmakar, S., Procaccia, I. & Zylberg, J. Athermal brittle-to-ductile transition in amorphous solids. Physical Review E 84, 046105 (2011).
- [43] Evans, S., Bovis, M. & Hutchinson, J. Landslides of the flow type. Environmental & Engineering Geoscience 7, 221–238 (2001).
- [44] Wang, J. et al. Effect of clay and organic matter content on the shear slip properties of shale. Journal of Geophysical Research: Solid Earth 124, 9505–9525 (2019).
- [45] Kato, A. & Ben-Zion, Y. The generation of large earthquakes. Nature Reviews Earth & Environment 2, 26–39 (2021).
- [46] Peyla, P. & Verdier, C. New confinement effects on the viscosity of suspensions. Europhysics Letters 94, 44001 (2011).
- [47] Choi, J. & Rogers, S. A. Optimal conditions for pre-shearing thixotropic or aging soft materials. Rheologica Acta 59, 921–934 (2020).
- [48] Pradeep, S., Wessel, A. & Hsiao, L. C. Hydrodynamic origin for the suspension viscoelasticity of rough colloids. Journal of Rheology 66, 895–906 (2022).
Declarations
Acknowledgments We thank Jamie Ford (Nanoscale Characterization Facility, Singh Center for Nanotechnology) and John Ruck (UPenn) for their help with particle characterizations; and Robert Kostynick (Washington U), Alban Sauret, Eckart Meiburg and Tom Dunne (UC Santa Barbara) for their inspiration and feedback. Research was supported by National Science Foundation (NSF) Materials Research Science and Engineering Center (NSF-DMR-1720530) and Army Research Office (ARO Grant W911NF2010113) grants to D.J. and P.A., and by grant NSF PHY-1748958 to the Kavli Institute for Theoretical Physics (KITP).
Author contributions S.P. led all aspects of this study: the conceptual framework, experimental design and execution, and analysis of results. P.A. and D.J. were co-equal supervisors of the work, and participated in data analysis and interpretation. The manuscript was written collaboratively by all authors.
Competing interests Authors declare no competing interests.
![[Uncaptioned image]](/html/2312.15092/assets/ED_Fig_1.png)
Extended Data Fig. 1: Steady shear rheological flow curves of kaolin clay () with a, 0.001 M and b, 0.1 M NaCl. Respective volume fractions () are indicated by different shapes (diamonds, = 0.10; invert triangles with right-half black, = 0.15; invert triangles, = 0.20; triangles with right-half black, = 0.25; triangles, = 0.30). The non-dimensionalized flow curves () are shown in plots c,d, respectively. Corresponding model fits for the equation , with best fit values for the parameters and , are shown alongside the collapsed plots in the figures c,d.
![[Uncaptioned image]](/html/2312.15092/assets/ED_Fig_2.png)
Extended Data Fig. 2: The stress overshoot as a function of changing sand-clay concentration (). The inset shows the unscaled data for Fig. 3c. The colors indicated correspond to the values in Fig. 3.
![[Uncaptioned image]](/html/2312.15092/assets/ED_Fig_3.png)
Extended Data Fig. 3: Steady shear rheological flow curves of sand-clay suspension mixtures at a, , b, , and c, . Respective volume fractions () are indicated by different shapes (diamonds, = 0.10; invert triangles with right-half black, = 0.15; invert triangles, = 0.20; triangles with right-half black, = 0.25; triangles, = 0.30; circle with left-half black, = 0.35; circles, = 0.40; circles with top-half black, = 0.55; squares, = 0.50; squares with top-half black, = 0.55). The non-dimensionalized flow curves () are shown in plots d, e, and f, respectively. Corresponding model fits for the equation , with best fit values for the parameters and , are shown alongside the collapsed plots in c,d, with the fit values of and .
![[Uncaptioned image]](/html/2312.15092/assets/ED_Table_1.png)
Extended Data Table. 1: The average fit values for the coefficient and shear-thinning exponent for sand-clay suspensions at varying values and for clay suspensions at varying salt (NaCl) concentrations.