PlayMolecule Viewer: a toolkit for the visualization of molecules and other data
Abstract
PlayMolecule Viewer is a web-based data visualization toolkit designed to streamline the exploration of data resulting from structural bioinformatics or computer-aided drug design efforts. By harnessing state-of-the-art web technologies such as WebAssembly, PlayMolecule Viewer integrates powerful Python libraries directly within the browser environment, which enhances its capabilities of managing multiple types of molecular data. With its intuitive interface, it allows users to easily upload, visualize, select, and manipulate molecular structures and associated data. The toolkit supports a wide range of common structural file formats and offers a variety of molecular representations to cater to different visualization needs. PlayMolecule Viewer is freely accessible at open.playmolecule.org, ensuring accessibility and availability to the scientific community and beyond.
1 Introduction
Molecular visualization is an essential tool for computational chemists and biologists, enabling them to explore and understand complex protein structures and unravel vital insights for drug discovery [1, 2, 3]. The visual inspection of three-dimensional models helps to understand the relationship between protein structure and function. It also allows exploring protein active sites and functional hot spots that can be targeted in drug design, among others.
Traditionally, molecular viewers have predominantly existed as desktop applications due to the demanding nature of 3D graphics [4, 5, 6, 7, 8]. However, their accessibility and applicability are often hindered by the need to install specialized software. In contrast, web-based tools have emerged as a valuable alternative for the analysis of macromolecular structures [9, 10, 11, 12, 13, 14, 15, 16]. Web-based molecular viewers offer several advantages, such as platform independence and no software installation requirements. These viewers provide a user-friendly and accessible platform, enabling scientists and non-scientific communities alike to engage with molecular visualization and expand the reach of protein research.
The emergence of WebAssembly [17], a web technology that allows running code written in multiple languages in any modern browser, has significantly expanded the capabilities of web-based applications. This includes the ability to run scripts written in interpreted languages such as Python directly within the browser [18]. WebAssembly holds great potential for advancing web applications in the realm of molecular sciences [19, 20, 21], with several tools already using this technology in their development [22, 23, 24, 25].
In this context, we introduce PlayMolecule Viewer, a web-based data visualization toolkit designed to facilitate the visualization and comprehension of results from structural bioinformatics or computer-aided drug design efforts. This toolkit allows users to easily upload, visualize, select and manipulate molecular structures and associated data. By incorporating WebAssembly [17], it leverages the strengths of Python libraries directly within the browser environment. This enhances its capabilities in managing multiple data types, ranging from static and dynamic structures to data tables and plots. This versatility allows users to integrate their data into PlayMolecule Viewer, gaining valuable insights from their molecular structures.
2 Features
2.1 Visualization of molecule structures
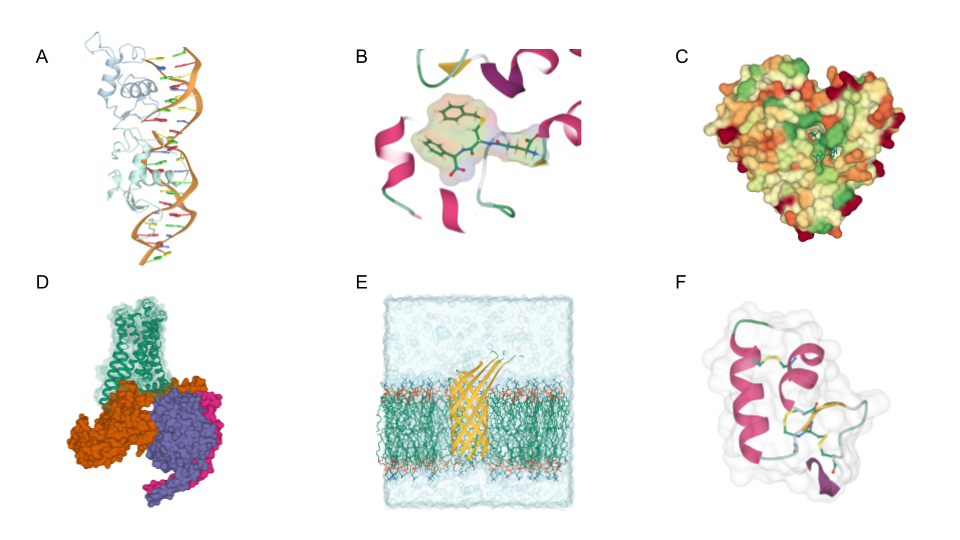
PlayMolecule Viewer provides comprehensive support for loading various types of molecule data, including protein structures and small molecules, molecular dynamics trajectories, and volumetric data. All the main file formats are supported (see section 2.7). This flexibility enables researchers to analyze a wide range of structural data within the application.
Loaded structures are displayed in the ”3D Viewer Controls” panel (Fig. 1). This panel allows users to efficiently organize their uploaded structures into groups, focus the visualization on specific structures of interest, and control their representations. Thanks to the implementation of the mol* toolkit [10], PlayMolecule Viewer offers a diverse set of molecular structure representations, such as ball and stick, spacefill, or cartoon, that can be combined to create complex and informative molecular views. Additionally, multiple color schemes are available, providing further visualization options for the structures. Users can also select and control the representations of structure subsets (see section 2.2), enhancing their ability to focus on and analyze particular regions of interest (Fig. 2).
Depending on the file type, additional options are provided. For example, when working with trajectories, users can play and pause the animation, while for volumetric data, they can adjust the isovalue to visualize desired regions. Additionally, when dealing with collections of small molecules, users have control over the visualization of each compound.

2.2 Making selections
Making selections is a fundamental aspect of data visualization, enabling users to create compelling, informative, and complex visualizations. For that, PlayMolecule Viewer uses the VMD selection language [6], which is based on keywords with associated values (Table 1).
| Keyword | Type | Description |
|---|---|---|
| all | bool | Everything |
| name | str | Atom name |
| type | str | Atom type |
| index | num | Atom number, starting at 0 |
| serial | num | Atom number, starting at 1 |
| element | str | Atomic element symbol |
| chain | str | One-character chain identifier |
| protein | bool | Protien atoms |
| nucleic | bool | Nucleic acid atoms |
| backbone | bool | Backbone of a protein or nucleic acid. |
| sidechain | bool | Non-backbone atoms and bonds |
| water | bool | All water atoms |
| resname | str | Residue name |
| resid | num | Residue id |
| segname | str | Segment name |
| x, y, z | float | x, y, or z coordinates |
Atoms can be selected on the basis of a boolean keyword, such as protein, water, and backbone. For instance, the selection ”protein” will display all protein atoms. Selections can also be formulated as a keyword followed by a list or a range of values. Some examples are ”name CA” (all atoms with the name CA), ”resname ALA PHE ASP” (all atoms in either alanine, phenylalanine, or asparagine) or ”resid 50 to 100” (atoms with residue index from 50 to 100).
Selections can also be combined with the boolean operators and and or, and modified by not. For instance, “protein and chain A and not name H” corresponds to all protein atoms in chain A that are not hydrogen.
Finally, advanced criteria such as regular expressions (e.g. ”name ’C.*’ ” to select all atoms with names starting with C) and spacial selection (e.g. ”same residue as within 5 of resname BEN” to select residues within 5 Å of the residues named BEN) are also accepted, adding an extra layer of versatility to the selection processes.
More information on atom selection can be found at open.playmolecule.org/docs/selection.
2.3 Integration of Tabular Data
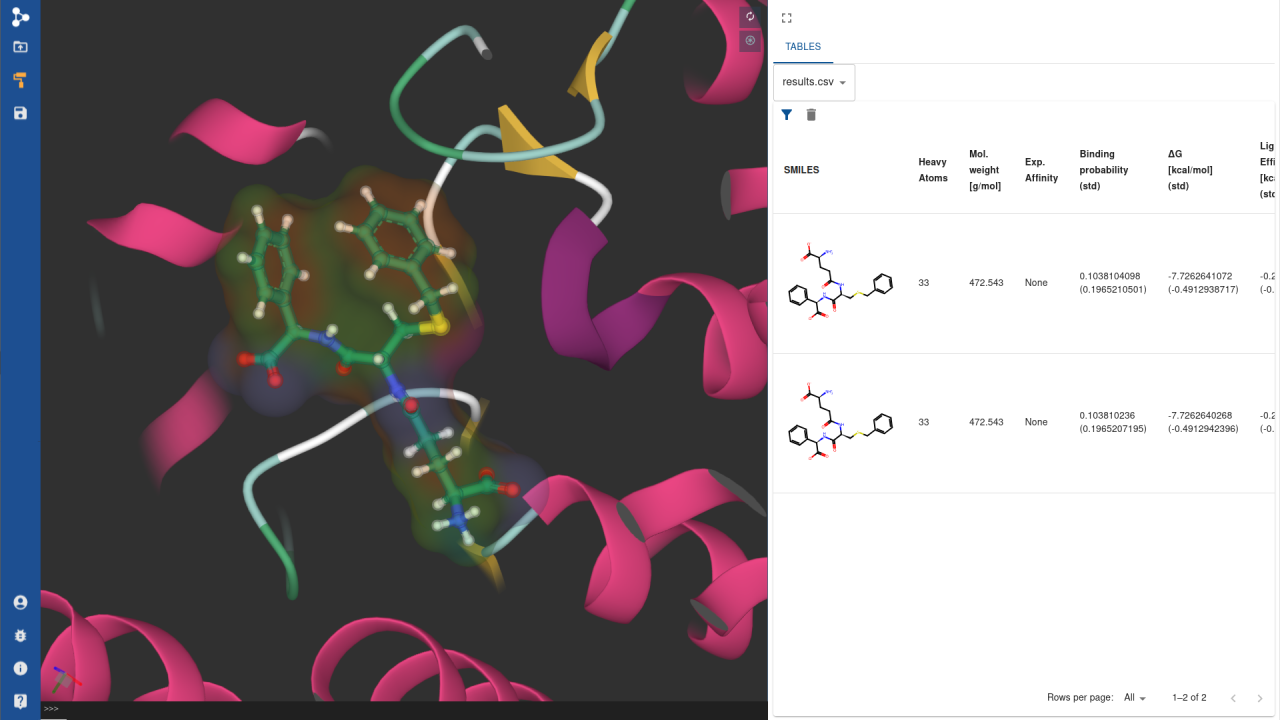
In addition to molecular structures, PlayMolecule Viewer allows users to upload tables in CSV format (Fig. 3). This feature is useful, among others, when working with libraries of small molecules. Notably, if the table includes a column labeled ”SMILES”, the application automatically converts the SMILES notation into a visual depiction of the small molecule.
Moreover, the tables generated offer interactive features. For instance, users can enrich the table by adding a column named ”Path” containing the filenames of loaded molecular structures. When a table row is clicked, the viewer automatically focuses on the corresponding structures, facilitating the navigation between tabular data and their associated molecular representations. This interactivity enhances the user experience and streamlines the understanding and exploration of complex molecular datasets.
2.4 Integration of Static and Interactive Plots
PlayMolecule Viewer offers the visualization of both static or interactive plots, allowing users to integrate complex data representations with their molecular structures (Fig. 4). Users can upload static plots as plain images. Moreover, they can display interactive plots by uploading a configuration file in the format of Apache ECharts Echarts [26], a popular JavaScript charting library that provides a wide range of chart types and customization options, covering from line and scatter plots to heat maps and graphs. For its correct recognition, the plot configuration file should have the extension .plot.json.
These data visualization capabilities can be useful to display time-dependent properties of molecular systems alongside a molecular dynamics trajectory, providing a comprehensive view of dynamic behaviors. Additionally, displaying energy landscapes or binding affinity profiles together with protein structures can aid in the understanding of protein conformations.

2.5 Python Terminal for Interactive Molecular Analysis
Thanks to the implementation of Pyodide [18], a Python distribution for the browser based on WebAssembly [17], PlayMolecule Viewer includes a Python terminal that allows users to interact with the loaded molecules using Moleculekit [27]. Users can execute Python code within the terminal, enabling them to obtain information about the molecules, apply filters, perform calculations, and more. This powerful feature enhances the flexibility and interactivity of the viewer, allowing users to gain deeper insights into their molecules without leaving the application.
For instance, we can access a specific system loaded in PlayMolecule Viewer by employing the get_system(system_index) function, where system_index corresponds to the 0-based position of the system within the viewer. This returns a Moleculekit molecule object, which grants us access to the extensive functionalities of this library. Thus, we can retrieve specific properties of the system, such as the sequence or the protein residues in contact with the ligand. In the case of trajectories, users can extract additional data, such as the number of frames:
Moreover, it is possible to modify the system. For example, users can apply filters or translations and align to another molecule:
2.6 Save and Load Viewer Sessions
To facilitate work continuity, PlayMolecule Viewer enables users to save their session state by clicking on ”Save Viewer State.” This feature captures in a session file the current configurations, including the chosen representations, selections, and any modifications made to the structures. Users can later reload the session file, restoring their previous visualization settings and ensuring a seamless continuation of their analysis.
2.7 Data formats accepted by PlayMolecule Viewer
PlayMolecule Viewer is currently able to load and visualize multiple file formats:
-
•
Topology and coordinate files: prmtop, prm, psf, mae, mol2, gjf, xyz, pdb, ent, pdbqt, GROMACS [28] top, crd, cif, rtf, prepi, sdf, mmtf, mmtf.gz, and coor.
-
•
Volumetric data, such as molecular densities: cube
-
•
Trajectories: xtc, xsc, netcdf, dcd, trr, and binpos
-
•
Tables: csv
-
•
Interactive plots: Echarts [26] configuration path with extension plot.json.
-
•
Static plots or other images: png and svg
3 Implementation
PlayMolecule Viewer is developed using TypeScript [29] and the React library [30], which provide a solid foundation for building a robust and user-friendly web application.
Leveraging the power of Pyodide [18], this toolkit can execute Python code directly within the browser environment, which enables the integration of powerful Python libraries for efficient data manipulation. This is the case of Moleculekit [27], a Python library for the manipulation of biomolecular structures. Using Moleculekit [27], PlayMolecule Viewer can accept a wide range of file formats which ensures compatibility with various molecular data sources and enhances the application’s flexibility. Additionally, Pandas [31] is employed to generate tables based on CSV files. The creation of molecular representations based on the loaded structures is handled by the mol* [10] visualization toolkit. Moreover, we use RDKitJS [25] to generate depictions of small molecules based on SMILES.
Due to the resource-intensive nature of these tools and the single-thread design of the JavaScript language, PlayMolecule Viewer makes use of the WebWorker [32] API, which allows long-running background tasks, such as the Python interpreter, to execute independently from the user interface thread. Overall, this modular architecture provides PlayMolecule Viewer with a user-friendly interface and wide data processing capabilities.
4 PlayMolecule Viewer as a standalone application
In addition to the web platform, PlayMolecule Viewer is also available as a standalone application. This version brings several notable advantages compared to its web-based counterpart, including offline accessibility and enhanced performance. The standalone application benefits from direct access to the user’s local file system, simplifying the process of loading files into the viewer. Users have the option to load files through command-line operations, reducing the steps necessary to input data. For example, pmview ”directory/*.pdb” will open all PDB files in a given directory.
The PlayMolecule Viewer standalone application can be installed using conda (conda install pmview -c acellera).
5 Comparative overview: PlayMolecule Viewer and other browser-based molecular viewers
Numerous web-based molecular viewers have been developed to date [9, 10, 11, 12, 13, 14, 15, 16]. Most function primarily as embeddable libraries, while also offering full web application versions. Focusing on web applications, a majority of these tools primarily support static structures, but not molecular dynamics trajectories. To our knowledge, besides PlayMolecule Viewer, to this date only mol* Viewer [10] and NGL Viewer [9] (on which mol* is built) support the visualization of molecular dynamics trajectories uploaded by the user. Mol* Viewer and NGL Viewer offer an extensive range of options for visualizing and inspecting molecular structures, surpassing PlayMolecule Viewer in certain aspects. For instance, mol* Viewer provides features like sequence view, a wider array of customization options, and advanced rendering capabilities. In contrast, PlayMolecule Viewer prioritizes ease of use, featuring a simplified interface and comprehensive, accessible documentation.
A significant distinction of PlayMolecule Viewer from other existing online viewers lies in its WebAssembly [17] implementation, enabling Python execution within the browser. This implementation significantly broadens its capability to handle different types of molecular data. Particularly, it facilitates the support of multiple structure file formats, thanks to the Moleculekit library [27], as well as enabling the integration of interactive tables and plots, thanks to libraries such as Pandas [31] and Numpy [33]. While some viewers support the integration of annotations such as protein domains and single nucleotide variations [15, 14], few, if any, support the visualization of user-generated tables and plots, thereby providing flexibility for integration with other analysis results. Additionally, PlayMolecule Viewer includes a Python console, a unique feature for interacting with and analyzing the uploaded systems. While some online viewers feature consoles for modifying molecular visualizations [15, 12, 14], as far as our knowledge extends, none include a dedicated Python console.
Overall, the strengths of PlayMolecule Viewer lie in its beginner-friendly interface, WebAssembly implementation allowing Python execution in the browser, and the incorporation of a Python console for system interaction and analysis, setting it apart from other browser-based molecular viewers.
6 Conclusions
By leveraging cutting-edge web technologies such as WebAssembly [17], PlayMolecule Viewer emerges as a powerful and versatile web application for interactive molecular data visualization. Accessible through a user-friendly interface, it allows users to explore a wide range of structure file formats, including molecular dynamics simulations, as well as data tables and plots. With a rich set of molecular representation types and color schemes, together with selection and superimposition capabilities, users can create complex molecular views. The ability to save visualization states ensures easy recovery of previous work. Notably, the toolkit incorporates a Python terminal, enabling users to interact with loaded molecules using the Moleculekit [27] Python library. PlayMolecule Viewer is freely available at open.playmolecule.org.
7 Data and Software Availability
PlayMolecule Viewer is freely accessible to all users at open.playmolecule.org. The terms of use can be found at open.playmolecule.org/docs/termsofuse.
The standalone application can be installed via conda install pmview -c acellera. Creating an exclusive conda environment for the viewer prior to the installation is recommended.
8 Acknowledgments
The project PID2020-116564GB-I00 has been funded by MCIN/ AEI /10.13039/50110001103. Grant PTQ2021-011670 funded by MCIN/AEI/ 10.13039/501100011033. This project has received funding from the European Union’s Horizon 2020 research and innovation programme under grant agreement No 823712.
References
- [1] Cameron Mura, Colin M. McCrimmon, Jason Vertrees and Michael R. Sawaya “An Introduction to Biomolecular Graphics” In PLoS Computational Biology 6 PLOS, 2010 DOI: 10.1371/JOURNAL.PCBI.1000918
- [2] Arthur J. Olson “Perspectives on structural molecular biology visualization: from past to present” In Journal of molecular biology 430 NIH Public Access, 2018, pp. 3997 DOI: 10.1016/J.JMB.2018.07.009
- [3] Seán I. O’Donoghue et al. “Visualization of macromolecular structures” In Nature Methods 2010 7:3 7 Nature Publishing Group, 2010, pp. S42–S55 DOI: 10.1038/nmeth.1427
- [4] Matthieu Chavent et al. “GPU-powered tools boost molecular visualization” In Briefings in Bioinformatics 12 Oxford Academic, 2011, pp. 689–701 DOI: 10.1093/BIB/BBQ089
- [5] Schrödinger, LLC “The PyMOL Molecular Graphics System, Version 1.8”, 2015
- [6] William Humphrey, Andrew Dalke and Klaus Schulten “VMD: Visual molecular dynamics” In Journal of molecular graphics 14 Elsevier, 1996, pp. 27–28 DOI: 10.1016/0263-7855(96)00018-5
- [7] Elmar Krieger and Gert Vriend “YASARA View—molecular graphics for all devices—from smartphones to workstations” In Bioinformatics 30 Oxford University Press, 2014, pp. 2981 DOI: 10.1093/BIOINFORMATICS/BTU426
- [8] Eric F. Pettersen et al. “UCSF Chimera—A visualization system for exploratory research and analysis” In Journal of Computational Chemistry 25 John Wiley & Sons, Ltd, 2004, pp. 1605–1612 DOI: 10.1002/JCC.20084
- [9] Alexander S. Rose and Peter W. Hildebrand “NGL Viewer: A web application for molecular visualization” In Nucleic Acids Research 43, 2015, pp. W576–W579 DOI: 10.1093/nar/gkv402
- [10] David Sehnal et al. “Mol* Viewer: modern web app for 3D visualization and analysis of large biomolecular structures” In Nucleic Acids Research 49 Oxford Academic, 2021, pp. W431–W437 DOI: 10.1093/NAR/GKAB314
- [11] Nicholas Rego and David Koes “3Dmol.js: molecular visualization with WebGL” In Bioinformatics 31 Oxford Academic, 2015, pp. 1322–1324 DOI: 10.1093/BIOINFORMATICS/BTU829
- [12] “Jmol: an open-source Java viewer for chemical structures in 3D” Accessed: 2023-12-08, http://www.jmol.org/
- [13] Christopher R. Reynolds, Suhail A. Islam and Michael J.E. Sternberg “EzMol: A Web Server Wizard for the Rapid Visualization and Image Production of Protein and Nucleic Acid Structures” Computation Resources for Molecular Biology In Journal of Molecular Biology 430.15, 2018, pp. 2244 –2248 DOI: https://doi.org/10.1016/j.jmb.2018.01.013
- [14] Gert Jan Bekker, Haruki Nakamura and Akira R. Kinjo “Molmil: A molecular viewer for the PDB and beyond” In Journal of Cheminformatics 8 BioMed Central Ltd., 2016, pp. 42 DOI: 10.1186/s13321-016-0155-1
- [15] Jiyao Wang et al. “iCn3D, a web-based 3D viewer for sharing 1D/2D/3D representations of biomolecular structures” In Bioinformatics 36 Oxford University Press, 2020, pp. 131 DOI: 10.1093/BIOINFORMATICS/BTZ502
- [16] David Sehnal et al. “LiteMol suite: interactive web-based visualization of large-scale macromolecular structure data” In Nature Methods 2017 14:12 14 Nature Publishing Group, 2017, pp. 1121–1122 DOI: 10.1038/nmeth.4499
- [17] “WebAssembly Core Specification” Accessed: 2023-12-08, https://www.w3.org/TR/wasm-core-1/, 2019
- [18] “Pyodide” Accessed: 2023-12-08, https://pyodide.org
- [19] A ; Wang, J D Durrant, Ann Wang and Jacob D Durrant “Open-Source Browser-Based Tools for Structure-Based Computer-Aided Drug Discovery” In Molecules 2022, Vol. 27, Page 4623 27 Multidisciplinary Digital Publishing Institute, 2022, pp. 4623 DOI: 10.3390/MOLECULES27144623
- [20] Luciano A. Abriata “Web Apps Come of Age for Molecular Sciences” In Informatics 2017, Vol. 4, Page 28 4 Multidisciplinary Digital Publishing Institute, 2017, pp. 28 DOI: 10.3390/INFORMATICS4030028
- [21] Piotr Grzesik, Dariusz R. Augustyn, Wyciślik and Dariusz Mrozek “Serverless computing in omics data analysis and integration” In Briefings in Bioinformatics 23 Oxford Academic, 2022 DOI: 10.1093/BIB/BBAB349
- [22] Chen Jiang, Xi Jin, Ying Dong and Ming Chen “Kekule.js: An Open Source JavaScript Chemoinformatics Toolkit” In Journal of Chemical Information and Modeling 56 American Chemical Society, 2016, pp. 1132–1138 DOI: 10.1021/ACS.JCIM.6B00167/SUPPL˙FILE/CI6B00167˙SI˙004.ZIP
- [23] Yuri Kochnev, Erich Hellemann, Kevin C. Cassidy and Jacob D. Durrant “Webina: an open-source library and web app that runs AutoDock Vina entirely in the web browser” In Bioinformatics 36 Oxford Academic, 2020, pp. 4513–4515 DOI: 10.1093/BIOINFORMATICS/BTAA579
- [24] Yuri Kochnev and Jacob D. Durrant “FPocketWeb: protein pocket hunting in a web browser” In Journal of Cheminformatics 14 BioMed Central Ltd, 2022, pp. 1–7 DOI: 10.1186/S13321-022-00637-0/FIGURES/3
- [25] “RDKit.js” Accessed: 2023-12-12, https://www.rdkitjs.com/
- [26] Deqing Li et al. “ECharts: A declarative framework for rapid construction of web-based visualization” In Visual Informatics 2.2, 2018, pp. 136–146 DOI: https://doi.org/10.1016/j.visinf.2018.04.011
- [27] S Doerr, M J Harvey, Frank Noé and G De Fabritiis “HTMD: High-Throughput Molecular Dynamics for Molecular Discovery.” In Journal of chemical theory and computation 12, 2016, pp. 1845–52 DOI: 10.1021/acs.jctc.6b00049
- [28] H. J.C. Berendsen, D. Spoel and R. Drunen “GROMACS: A message-passing parallel molecular dynamics implementation” In Computer Physics Communications 91 North-Holland, 1995, pp. 43–56 DOI: 10.1016/0010-4655(95)00042-E
- [29] “TypeScript” Accessed: 2023-12-12, https://www.typescriptlang.org/
- [30] “React” Accessed: 2023-12-12, https://react.dev/
- [31] McKinney “Data Structures for Statistical Computing in Python” In Proceedings of the 9th Python in Science Conference, 2010, pp. 56 –61 DOI: 10.25080/Majora-92bf1922-00a
- [32] “WebWorker Specification” Accessed: 2023-12-08, https://html.spec.whatwg.org/multipage/workers.html, 2023
- [33] Charles R. Harris et al. “Array programming with NumPy” In Nature 585.7825 Springer ScienceBusiness Media LLC, 2020, pp. 357–362 DOI: 10.1038/s41586-020-2649-2