Quantitative comparison of cell-cell detachment force in different experimental setups
Abstract
We compare three different setups for measuring cell-cell adhesion. We show that the measured strength depends on the type of setup that is used. For identical cells different assays measure different detachment forces. This can be understood from the fact that cell-cell detachment is a global property of the system. We also analyse the role of external force and line tension on contact angle and cell-cell detachment. Comparison with experiment suggests that the current data are essentially dynamical in nature. We dedicate this article to Fyl Pincus who for many of us is an example to be followed not only for outstanding science but also for a marvelous human behavior.
I Introduction
Integrity of a tissue is maintained by cell-cell adhesion mediated by specific proteins Bell et al. (1984); Van Roy and Berx (2008). The adhesion sites provide mechanical connectivity but also act as signaling hubs in the cell and are vital for tissue development and homeostasis. It has been shown that a differential expression of these adhesion proteins is essential for cell sorting Maître and Heisenberg (2011); Maître et al. (2012) and plays a central role in determining cell shape Hannezo et al. (2014).
Quantifying cell-cell adhesion is critical to understanding tissue mechanics. Significant experimental and theoretical progress have been made in our understanding of the molecular processes underlying cell-cell adhesion. It has been long understood that adhesion mediated by specific linker proteins differs fundamentally from nonspecific adhesion Bell (1978); Bell et al. (1984); Bongrand (1999). In the former case, the contact angle is set by the osmotic pressure difference of the mobile linkers between the adhesion zone and the plasma membrane Bell et al. (1984); Brochard-Wyart and de Gennes (2002). Imaging of protein distribution on the surface has shed light on the spatio-temporal dynamics of the adhesion molecules that has further lead to a fruitful dialogue between theory and experiments on cell-cell adhesion.
A complementary approach to understanding adhesion has been to study cell-cell detachment. Different in-vitro assays have been designed to measure the response of a cell to shear force (due to fluid flow) or pulling (micropipette or a plate) with the aim to understand the parameters that determine the ability to cell to stay attached, either to another cell or to a substrate Kashef and Franz (2015); Décavé et al. (2002).
The aim of this work is to synthesize these studies and highlight the differences in the measurement of detachment force for seemingly similar experimental setup and to compute the correlation between adhesion and detachment force. We compare three different setups used to measure the force required to detach two adherent cells: pipette-pipette Evans (1985a, b); Evans et al. (1991); Chu et al. (2004); Simson et al. (1998), plate-plate Puech et al. (2006); Desprat et al. (2005); Chaudhuri et al. (2009), plate-pipette Prechtel et al. (2002) (Fig. 1).
In this article we restrict our theoretical analysis to quasi-static conditions. This work follows closely Ref. Brochard-Wyart and de Gennes (2003). We analyze cell geometry, cell-cell detachment force, and force dependence of the contact angle. We provide analytical results for detachment force and cell shape in the pipette-pipette setup and compare it with that for the plate-plate and plate-pipette setups. We show that the detachment force depends not only of the cell specific parameters like adhesion tension and cell surface tension but also strongly depends on the parameters of the experimental setup like pipette radius or cell-plate adhesion. For example, the detachment force for the same cells is always smaller when a pipette instead of a plate is used to hold the cells.
II Cell shape and detachment force
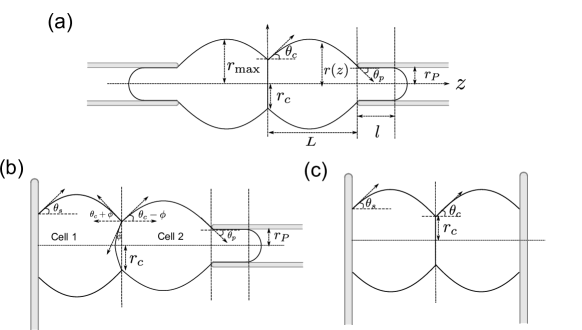
We consider a doublet of identical cells adhering to each other. We take the cells to have a constant isotropic surface tension and a fixed volume. The cell interior is treated as an incompressible fluid. The cells are also either sticking to a plate or sucked into a pipette, in such a way that the three contact planes–cell-cell, cell-plate, or the cell-pipette–are parallel (with their normal along -axis). Fig 1 shows the three setups that we analyze.
At steady-state the stress in the cell interior, given by the hydrostatic pressure, and the cell tension can be taken to be constant. As the problem is axis symmetric, the shape of the cell is completely specified by the function (see Fig. 1). For all , the total force on the cross-section of the cell, perpendicular to axis should be equal to the external force, applied along -axis, which reads Brochard-Wyart and de Gennes (2003):
| (1) |
where is the radius of the cell at , is the cell tension, is the pressure difference between the inside and outside of the cell, is the angle between the tangent to the cell surface at and the axis, and is the external force applied on the cell. Positive value of implies pulling force on the cells. The force balance along the local normal of the cell is given by the Young-Laplace equation: , where is the mean curvature, which is a constant. Substituting this in Eq. 1 we get:
| (2) |
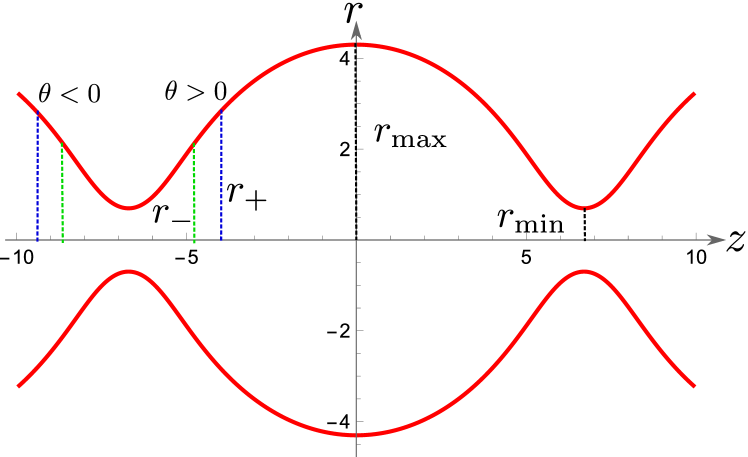
where we have defined and . Note that both and can be negative. Eq. 2 gives us the full cell shape (see Appendix A). In Fig. 2 the shape obtained from Eq. 1 is plotted for a given value of and . For a given , from Eq. 2 we get
| (3) |
This solution is invariant under the change of sign of . The roots are shown in Fig. 2 for a given value of and . For a given radius there are two angles of equal magnitude and opposite sign, and for a given angle there are two radii. The shape of the cell doublet is obtained by imposing the right boundary condition. For cell-cell contact this is determined by the force balance in the contact plane. For the simple case of a constant adhesion energy this imposes a constant contact angle given by:
| (4) |
where is the adhesion tension and is the contact angle. The effect of external force on contact angle is discussed in more details below. The contact radius is given by Eq. 3 with , this implies we need to further specify which of the two solutions is the contact radius at the boundary. On the other side the boundary condition is given by the size of the pipette, or by the adhesion strength of the cell-plate contact.
The roots in Eq. 2 are real when . For , there is no solutions to the shape equation. When there is an angle imposed at the boundary, like contact angle due to cell-cell adhesion, then the value of maximum force is Brochard-Wyart and de Gennes (2003). Above this value of force, one of the assumptions of the model breaks down. If the tension remains constant then the cell needs to detach. This relation was first analyzed in Ref. Brochard-Wyart and de Gennes (2003), where the detachment force is characterized in terms of the contact radius and the maximum radius.
The contact radius at detachment is . The force needed to detach the cell-cell contact reads:
| (5) |
Note that, depending on the setup, both and can be a function of .
III Detachment force for micropipette setup
We now analyze, in detail, the case of two adhered cells pulled apart by pipettes Fig. 1(a)). For a cell to be held in a pipette we need where is the pressure difference between the inside and the outside of the pipette. To know the pressure inside the cell we need to know the shape of the cell in the pipette, the cell tension in the pipette, and boundary conditions between the cell and the pipette. For simplicity and since in experiments careful coating ensures the absence of adhesion, we ignore any adhesion between the cell and the pipette. As a result, the extremity of the tongue inside the pipette is a hemisphere, which corresponds to zero contact angle. Furthermore, we consider quasi-static situations and we take the cell tension to be uniform inside and outside the pipette.
The external force applied along the z axis on a plane perpendicular to the pipette is
| (6) |
where is the external force applied on the pipette, and is the radius of the pipette. Using the Young-Laplace equation inside the pipette we get . There is an important observation to be made here, for a cell of a given tension, the pressure inside the cell is fixed by the pressure and the radius of the pipette.
| (7) |
We see that and are not independent, the mean curvature of the cell can be varied by changing the pipette radius or the pressure in the pipette. From Eq. 6 and Eq. 7 we see that changing changes but it does not lead to a change in . However, changing leads to a change in both and .
Since the radius of the pipette is fixed, the angle between the pipette and the cell at cell-pipette contact changes in response to the applied force. Eq. 2 evaluated at gives the angle at the pipette, which reads
| (8) |
We define the force for which as the cell-pipette detachment force. Substituting Eq. 7 in Eq. 8, the detachment force for cell-pipette contact reads:
| (9) |
Thus we see that the cell-pipette detachment force depends on the pipette pressure and size. Substituting the value of from Eq. 7 in Eq. 5 the cell-cell detachment force reads:
| (10) |
The cell-cell detachment depends not only on the adhesion strength and cell tension (that defines ) but also on the pipette size and the pipette pressure.
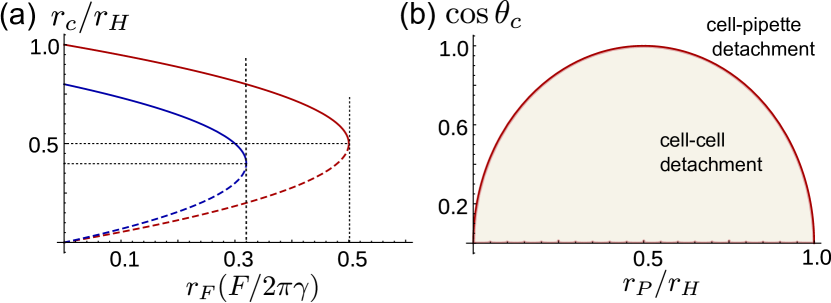
Whether it is the cell-cell contact or the cell-pipette contact that detaches first depends on the size of the pipette and the contact angle. If then the cell-cell contact detaches before the cell-pipette contact. Fig 3 (b) shows the region in which cell-cell detachment happens before cell-pipette detachment for different contact angles and pipette radius. The ratio of the cell-cell contact size at detachment and for zero force, as obtained from Eq. 2 is exactly half.
IV Comparison between micropipette and microplate setups
In the microplate setups the cells are adhered to a plate Yoneda (1964, 1986); Yang and Jiang (2017, 2018) (Fig. 1(b)). Superficially the microplate and the micropipette setups look similar, in both cases the cell shape is given by Eq. 2 and the detachment criterion is given by Eq. 5. However, there is one fundamental difference, the value of in the cell-pipette setup is set by the pipette radius and pipette pressure (Eq. 7), whereas in the cell-plate setup needs to be determined self-consistently from the constraint on the cell volume. One can even think of the micropipette setup as a constant pressure ensemble and the microplate setup as a constant volume ensemble.
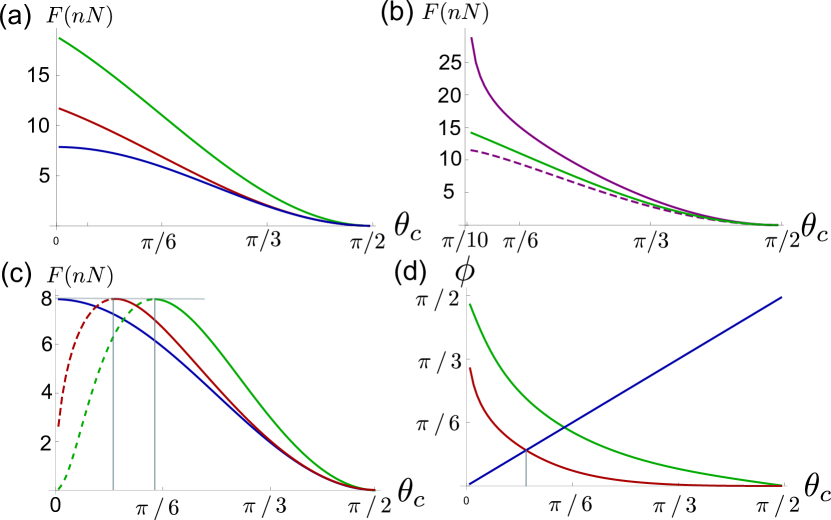
Fig. 4 (a) shows the comparison between the detachment force for the same cells in pipette-pipette and plate-plate setup. For a given contact angle, the detachment force measured by the latter is consistently higher than the detachment force measured by the former setup. This can be understood by noting that the value of is larger in the case of plate-plate setup than that in the case of pipette-pipette setup, and from Eq. 5 we see that the detachment force is proportional to .
In the cell-plate setup the detachment force depends on the contact angle, cell tension, cell volume, and cell-plate adhesion, whereas in the cell-pipette setup the detachment force depends on the contact angle, cell tension, pipette radius, and pipette pressure. Fig. 4 (a) shows the effect of cell volume on the detachment force. The bigger the cell, the smaller is the hydrostatic pressure difference(larger ); hence, bigger is the detachment force. 4 (b) shows the effect of the cell-plate contact angle on the cell-cell detachment force. The detachment force is larger for smaller contact angle. This dependence of detachment force on the cell-plate contact angle can be understood from the inverse relation between the cell-plate contact angle and for a given cell-cell contact angle. We also note that for the micropipette setup the detachment force is the same for positive and negative . However, for the microplate setup it is not the case. This is because the pressure in the cell is not the same for the positive and negative value of ; the pressure in the cells with negative is smaller than that of the cells with positive .
We now discuss the case when one cell is pulled by a pipette while the other is attached to a substrate (Fig. 1(c)). When the cell plate contact angle is zero, the plate-pipette setup also corresponds to the cell detachment experiments on cell-triplets Maître et al. (2012). This system is asymmetric even if the two cells are identical. For identical volume and tension the two cells have different hydrostatic pressures and as a result the cell-cell interface is curved. The radius of curvature of the interface is given by , where is the tension in the adhesion plane, and are the hydrostatic pressures in the cells attached to plate and pipette, respectively. From the geometry we get (see Fig. 1(b)). For simplicity we take the surface tension of the two cells to be the same. Substituting , , and we get: . We want to compute the angle at the point of cell-cell detachment. The effective contact angle for the cell attached to the pipette is . The detachment condition gives , and the detachment force is . Substituting we get after few steps of algebra . Substituting and in term of in the volume conservation equation of the cell attached to the microplate we obtain .
Fig. 4 (c) shows the comparison between the detachment force for the same cells in pipette-pipette and plate-pipette setups for two different cell sizes. We see that the detachment force is consistently larger for the plate-pipette setup when (bold part of the curve) and just like the microplate setup the lager cell has larger detachment force. Fig. 4 (d) shows the as a function of contact angle for two different cell sizes. The dotted part of the plot in Fig. 4 (c) corresponds to the value of for which at detachment, i.e, the effective contact angle is less than zero. For these values of contact angle the detachment force for the plate-pipette can be smaller than that of the pipette-pipette.
To summarise, the detachment force measured by the pipette-pipette setup is smaller than that in the plate-plate setups. The difference decreases with increasing contact angle. The detachment force for the plate-pipette setup as a function of contact angle is non-monotonic, it can be smaller than the pipette-pipette detachment force for contact angles smaller than a threshold. This result shows the subtlety involved in interpreting the detachment force as a proxy of adhesion strength.
V Force dependence of contact angle
The above analysis shows that for the same contact angle different experimental setups measure different detachment force. We now take a closer look at what sets the contact angle and whether taking the contact angle to be constant under changing external force is justified.
A prevailing idea is that when the cells are pulled apart the adhesion molecules are stretched and are more likely to detach than they are in the absence of force. Since the adhesion strength is determined by the number of adhered molecules the adhesion tension then decreases with increase in force Bell (1978); Yang and Jiang (2017). Although this sounds reasonable, one flaw in this argument is that the applied force is not directly felt by the adhesion molecules.
Here we present a simple model of adhesion which includes linkers that can bind and unbind. When the linkers can freely diffuse on the cell surface, the adhesion leads to a decrease in cell tension given by the two dimensional osmotic pressure difference between the contact plane and the free cell surface Bell et al. (1984); Brochard-Wyart and de Gennes (2002). In the simple case of dilute bound linkers the osmotic pressure is , where is the density of bound linkers Bell et al. (1984); Brochard-Wyart and de Gennes (2002). Substituting in Eq. 4 gives us the contact angle.
For quasistatic pulling rates, the density of bound linkers is given by a Boltzmann distribution , where , is the Bolztmann constant, the length of the linkers, the length at zero force, and the stiffness. In practice the quasistatic pulling rate is obtained when it is much slower than the time it takes for the linker density to reach equilibrium. Away from the periphery of the adhesion zone the membrane is flat, the only force on the linkers is the hydrostatic pressure difference between the cell and the adhesion zone. The force balance reads which gives
| (11) |
Substituting in Eq. 4 and using Eq. 11 the contact angle reads
| (12) |
For the micropipette experiment the value of can be maintained constant while changing the applied force. In this case the contact angle is constant but it depends on the experimental condition. For the microplate experiment the value of the contact angle indeed depends on the applied force as the cell pressure depends on it. The limit gives us the upper limit of the detachment force and , where is the radius of the free cell, gives us the lower limit on the detachment force.
For , , , we get . This shows that the effect of hydrostatic pressure difference on adhesion strength can be appreciable for physiologically relevant parameter values.
VI Detachment force with line tension
A clever experiment allowing to visualize the distribution of E-cadherin, actin and myosin at the cell-cell interface, shows that under quasistatic conditions, these three molecules are essentially expelled from the bulk of the contact region and concentrated in a ring with an actin-myosin distribution reminiscent of stress fibers Engl et al. (2014). This structure is very likely to be contractile. To include its effect on the adhesion mechanics we add a line tension term in the Eq. 4. The force balance in the direction tangent to the contact place now reads
| (13) |
where is the line tension, which can be positive or negative. Positive line tension leads to a weaker adhesion compare to that without it. Substituting the contact angle obtained from Eq. 13 in Eq. 2 we get
| (14) |
where we have defined ,, and .
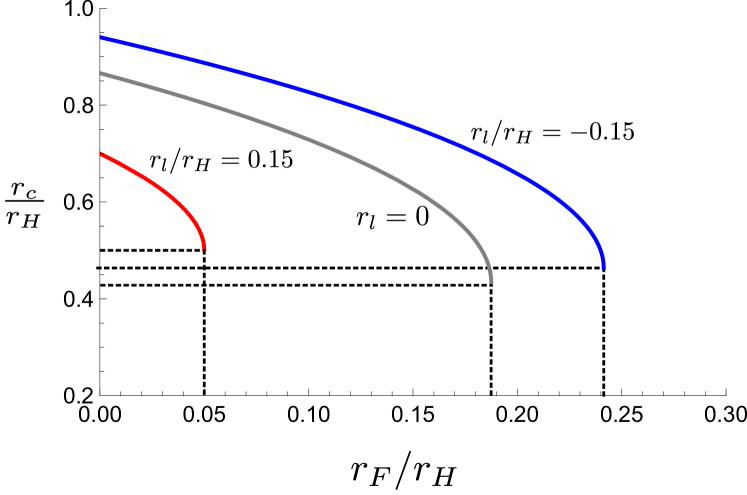
From Fig. 5 we see that for positive line tension the cells detach at a smaller force and smaller contact radius in comparison to the cell without line tension. For the particular choice of of Fig. 5 the relative reduction in contact radius is only of a few percent whereas the detachment force has changed by a large factor. , where is tension in the contractile ring that is effectively treated as line tension and is the width of the ring. For , and we get that is used to plot Fig. 5.
VII Discussion
The main conclusion of this work is that the different experimental setups discussed in this article measure different detachment forces for the same doublet of cells, and in no case measure an adhesion energy. The detachment force measured in the microplate setup is always larger than that measured in the micropipette one, whereas in the mixed case the detachment force has an intermediate value. We can infer the adhesion tension ( in Eq. 4) in all cases if we know some of the geometric and mechanical parameters related to the cell and the setup. To compute the adhesion tension in the pipette-pipette and plate-plate cases the knowledge of different combination of parameters is required. The detachment force in the former case, depends on adhesion tension, surface tension, pipette radius, and hydrostatic pressure in the tube. Thus to infer adhesion tension the only cell parameter needed is cell tension. For the plate-plate setup we need to know the cell volume as well as the cell tension to infer the adhesion tension. One must keep in mind though, that is not the adhesion energy but rather the 2D osmotic pressure of adhesion molecules.
Although generally the focus of the experiments is on adhesion tension, the detachment force is an important physiological parameter in its own right. These two quantities are related but can be independently modulated.
Our analysis is valid for circularly symmetric geometries and includes cases where the cortex in the contact zone is strongly depleted, except in a narrow zone close to the edge of the cell-cell contact. In this case the line tension introduced in Eq. 13 plays an important role. Cases, with phase separated domains would require a different analysis Bruinsma and Sackmann (2001).
In this work we consider pulling rates slow enough that the cell tension can be taken to be constant. For a finite pulling rate the cortical tension can be approximated as the sum of a static part given essentially by the cell cortex contractility and a dynamical term due to cortex viscosity , that is , where , where is 3d viscosity of the cortex, is cortical thickness, and is the cell surface area. We can approximate , where is the timescale of pulling. Taking with contractility of the cortex , we get . For we get . For strong adhesion the detachment force is which leads for slow pulling rates detachment forces on the order of for of few micrometers. Such detachment forces are consistent with some measurements Maître et al. (2012). Note that the dynamics of the linkers of the cortex in the contact place can only lead to a lower detachment force not higher than obtained in the limit . A detachment force of the order of , as noted in other experiments Chu et al. (2004), implies that there is a significant viscous contribution to the stress. A complete dynamic model is outside the scope of this work but could be studied using the framework of active surfaces Berthoumieux et al. (2014); Mietke et al. (2019).
VIII Acknowledgement
Saint Pierre and le Roi des cons thank Fyl Pincus for illuminating and friendly discussions which inspired them more than once.
ASV received support from the grants ANR-11-LABX-0038, ANR-10-IDEX-0001-02.
The authors thank Virgile Viasnoff for useful discussions.
Author contribution statement:
ASV, JP, and PS designed the study. ASV, under the supervision of JP and PS, performed the theoretical and numerical analysis. ASV, JP and PS wrote the manuscript.
Data availability statement: we do not analyse or generate any datasets, because our work proceeds within a theoretical and mathematical approach.
Appendix A Shape for constant curvature
We can obtain the shape of the cell form Eq. 1 Yoneda (1964); Fischer-Friedrich et al. (2014). The shape is of constant curvature surface shown in Fig. 2. The shape is axissymmetric, we parametrize it by arc length starting from at the cell-cell contact to at the cell-pipette contact. Using Eq. 1 and we get
| (15) |
The positive and negative sign corresponds to positive and negative , respectively. After integration this gives
| (16) |
where and . Note that . The constant of integration is chosen such that corresponds to .
| (17) |
where . Using Eq. 1 and , we get
| (18) |
Upon integration this gives
| (19) |
where and are incomplete elliptic integrals of the first and second kind, respectively. We have set the origin of -axis at . Assuming the pipette and the cell-cell contact to line on the opposite side of the maximum and within the two minimum, the distance between the cell-cell contact and the pipette is , where and are obtained from 16 for and , respectively. The separation between the pipettes is given by
| (20) | |||||
The negative sign is obtained using the relation .
The surface area and the volume of the cell can also be obtained in term of elliptic integrals Yang and Jiang (2017). Note Eq. 20 is the expression of length for both plate and the pipette setup. Since is know for the pipette setup this equation gives us the separation for a given force. However, for the plate setup, we need an additional equation to compute . A constraint of volume provides this additional constraint that can be used to compute .
The surface area of the cell outside the pipette is given by
| (21) |
Substituting and integrating we get:
| (22) |
The volume of the cell outside the pipette is given by
| (23) |
References
- Bell et al. (1984) G. I. Bell, M. Dembo, and P. Bongrand, Biophysical journal 45, 1051 (1984).
- Van Roy and Berx (2008) F. Van Roy and G. Berx, Cellular and molecular life sciences 65, 3756 (2008).
- Maître and Heisenberg (2011) J. L. Maître and C. P. Heisenberg, Current Opinion in Cell Biology 23, 508 (2011).
- Maître et al. (2012) J.-L. Maître, H. Berthoumieux, S. F. G. Krens, G. Salbreux, F. Jülicher, E. Paluch, and C.-P. Heisenberg, Science 338, 253 (2012).
- Hannezo et al. (2014) E. Hannezo, J. Prost, and J.-F. Joanny, Proceedings of the National Academy of Sciences 111, 27 (2014).
- Bell (1978) G. I. Bell, Science 200, 618 (1978).
- Bongrand (1999) P. Bongrand, Reports on progress in Physics 62, 921 (1999).
- Brochard-Wyart and de Gennes (2002) F. Brochard-Wyart and P.-G. de Gennes, Proceedings of the National Academy of Sciences 99, 7854 (2002).
- Kashef and Franz (2015) J. Kashef and C. M. Franz, Developmental biology 401, 165 (2015).
- Décavé et al. (2002) E. Décavé, D. Garrivier, Y. Bréchet, F. Bruckert, and B. Fourcade, Physical review letters 89, 108101 (2002).
- Evans (1985a) E. Evans, Biophysical Journal 48, 175 (1985a).
- Evans (1985b) E. Evans, Biophysical Journal 48, 185 (1985b).
- Evans et al. (1991) E. Evans, D. Berk, and A. Leung, Biophysical journal 59, 838 (1991).
- Chu et al. (2004) Y.-S. Chu, W. A. Thomas, O. Eder, F. Pincet, E. Perez, J. P. Thiery, and S. Dufour, The Journal of cell biology 167, 1183 (2004).
- Simson et al. (1998) D. Simson, F. Ziemann, M. Strigl, and R. Merkel, Biophysical journal 74, 2080 (1998).
- Puech et al. (2006) P.-H. Puech, K. Poole, D. Knebel, and D. J. Muller, Ultramicroscopy 106, 637 (2006).
- Desprat et al. (2005) N. Desprat, A. Richert, J. Simeon, and A. Asnacios, Biophysical journal 88, 2224 (2005).
- Chaudhuri et al. (2009) O. Chaudhuri, S. H. Parekh, W. A. Lam, and D. A. Fletcher, Nature methods 6, 383 (2009).
- Prechtel et al. (2002) K. Prechtel, A. Bausch, V. Marchi-Artzner, M. Kantlehner, H. Kessler, and R. Merkel, Physical review letters 89, 028101 (2002).
- Brochard-Wyart and de Gennes (2003) F. Brochard-Wyart and P.-G. de Gennes, Comptes Rendus Physique 4, 281 (2003).
- Yoneda (1964) M. Yoneda, Journal of Experimental Biology 41, 893 (1964).
- Yoneda (1986) M. Yoneda, Methods in cell biology 27, 421 (1986).
- Yang and Jiang (2017) Y. Yang and H. Jiang, Physical review letters 118, 208102 (2017).
- Yang and Jiang (2018) Y. Yang and H. Jiang, Journal of the Mechanics and Physics of Solids 112, 594 (2018).
- Engl et al. (2014) W. Engl, B. Arasi, L. Yap, J. Thiery, and V. Viasnoff, Nature cell biology 16, 584 (2014).
- Bruinsma and Sackmann (2001) R. Bruinsma and E. Sackmann, Comptes Rendus de l’Académie des Sciences-Series IV-Physics-Astrophysics 2, 803 (2001).
- Berthoumieux et al. (2014) H. Berthoumieux, J.-L. Maître, C.-P. Heisenberg, E. K. Paluch, F. Jülicher, and G. Salbreux, New Journal of Physics 16, 065005 (2014).
- Mietke et al. (2019) A. Mietke, F. Jülicher, and I. F. Sbalzarini, Proceedings of the National Academy of Sciences 116, 29 (2019).
- Fischer-Friedrich et al. (2014) E. Fischer-Friedrich, A. A. Hyman, F. Jülicher, D. J. Müller, and J. Helenius, Scientific reports 4, 6213 (2014).