EnergiBridge: Empowering Software Sustainability through Cross-Platform Energy Measurement
Abstract.
In the continually evolving realm of software engineering, the need to address software energy consumption has gained increasing prominence. However, the absence of a platform-independent tool that facilitates straightforward energy measurements remains a notable gap. This paper presents EnergiBridge, a cross-platform measurement utility that provides support for Linux, Windows, and MacOS, as well as Intel, AMD, and Apple ARM CPU architectures. In essence, EnergiBridge serves as a bridge between energy-conscious software engineering and the diverse software environments in which it operates. It encourages a broader community to make informed decisions, minimize energy consumption, and reduce the environmental impact of software systems.
By simplifying software energy measurements, EnergiBridge offers a valuable resource to make green software development more lightweight, education more inclusive, and research more reproducible. Through the evaluation, we highlight EnergiBridge’s ability to gather energy data across diverse platforms and hardware configurations.
EnergiBridge is publicly available on GitHub: https://github.com/tdurieux/EnergiBridge, and a demonstration video can be viewed at: https://youtu.be/-gPJurKFraE.
1. Introduction
Software engineering is a dynamic and ever-evolving field, focused on creating, maintaining, and evolving software systems to meet the ever-growing demands of modern society. A fundamental aspect of this discipline is to gauge the evolution of software and ensure its ongoing reliability and efficiency. As software projects grow in complexity and scale, it becomes imperative to employ rigorous metrics to assess their quality, performance, and sustainability.
Among the metrics that have gained prominence in the last decade are code coverage and linter scores. Moreover, as the world increasingly turns its attention to energy conservation and sustainability, the software engineering landscape is adapting to consider these crucial aspects as well (Moises et al., 2018; Jagroep et al., 2017). Understanding and measuring the energy consumption of software has become a pressing concern, with implications for environmental impact, cost efficiency, and the overall sustainability of software systems (Guldner et al., 2021).
One significant challenge in this endeavor is the diversity of the environments in which software operates. Software is executed on a wide range of operating systems and hardware configurations, making it difficult to employ uniform measurement techniques. Often, existing approaches are limited to specific processor brands or rely on specialized and complex energy consumption APIs that frequently lack comprehensive documentation, as seen with RAPL (Weaver, 2023). This complexity makes it difficult to be adopted by practitioners, who generally lack the knowledge for such measurements (Pinto and Castor, 2017; Pang et al., 2015).
To address these challenges, we introduce EnergiBridge, a cross-platform energy measurement tool. EnergiBridge is designed to support multiple operating systems, including Linux, Windows, and Mac OS, as well as a wide spectrum of CPU architectures: Intel, AMD, and Apple ARM. Our primary goal is to simplify the process of measuring energy consumption across diverse platforms, providing software engineers with a unified toolset, at a relevant abstraction level, for assessing the energy consumption of their software. The goal is also to provide a tool that can be easily used in education to promote the energy aspect of software.
The ultimate objective of EnergiBridge is to democratize the consideration of energy consumption in software development. We envision EnergiBridge as a user-friendly solution that empowers a broader community of software practitioners to incorporate energy efficiency as a fundamental criterion in their software design and development processes. By bridging the gap between energy-conscious software engineering and the diverse technology landscape, we aspire to contribute to a more sustainable and environmentally responsible software ecosystem.
The contributions of this paper are the following:
-
•
EnergiBridge: a tool to measure energy consumption in different ecosystems.
-
•
A replication package that allows the replication of the energy measurement of Chrome execution.
-
•
Ready-to-use setup to measure the energy consumption of different applications.
EnergiBridge is publicly available on our repository: https://github.com/tdurieux/EnergiBridge and the replication package is available at https://github.com/tdurieux/EnergiBridge-experiments.
2. Related Works
In contrast to physical power monitors, which are hardware-based external meters and very meticulous to set up (e.g., requiring custom physical connections between the device or component under study and the power monitor, as well as time synchronization between software execution and monitoring), energy profilers are software-based energy measurement tools that are intended to be easier to set up (Cruz, 2021). However, they often operate only under very specific environments and are limited to one or two platforms or processor architectures. Hence, they limit their usage to a specific execution context. Additionally, the tool output is not standardized and needs to be adapted for each analyzed platform and CPU.
Table 1 presents the tools that we identify as the most commonly used for collecting energy consumption metrics, and their platform applicability. This table illustrates the need for a cross-platform tool that can gather energy measurement data on different platforms and support the developers. This constant is reinforced by the fact that some of those tools are now deprecated by Intel.
Compared to the state of the art, EnergiBridge offers significantly broader support for operating systems and CPU platforms, making it compatible with a much larger population.
| Tool | Windows | Linux | Mac OS | ||||
| Intel | AMD | ARM | Intel | AMD | Intel | ARM | |
| Intel Power Gadget | ✓ | ✓ | |||||
| Intel PowerLog | ✓ | ✓ | |||||
| Mx Power Gadget | ✓ | ||||||
| Powerstat | ✓ | ||||||
| PowerTOP | ✓ | ✓ | |||||
| Perf | ✓ | ✓ | |||||
| Likwid | ✓ | ||||||
| Syspower | ✓ | ||||||
| Powercfg | ✓ | ✓ | ✓ | ||||
| EnergiBridge | ✓ | ✓ | ✓ | ✓ | ✓ | ✓ | |
3. Purposes
EnergiBridge presents a versatile range of use cases regarding its usage purposes, making it a valuable asset for various scenarios within the software engineering domain.
1. Research and Practice: EnergiBridge is designed to be easy to use, catering to the needs of both researchers and practitioners in the software engineering community. Researchers can use it to study the energy profiles of software applications, leading to a deeper understanding of performance bottlenecks and optimization opportunities. EnergiBridge enables reproducibility of such studies in different setups or environments without requiring any change on the tools being used or the format of the energy data being analyzed. Practitioners, on the other hand, can seamlessly integrate EnergiBridge into their development workflows to monitor and enhance the energy efficiency of their software products, ultimately reducing operational costs and environmental impact.
2. Educational Initiatives: In educational settings, students use a variety of platforms which makes it complex to provide a unique tool for everyone. Moreover, educators do not always have access to devices with all the same setups that students use. The alternative of enforcing a unique environment is also suboptimal, as it is less inclusive for students who are not able to get the same environment on their personal computers. EnergiBridge addresses this problem, and lets the education focus on the impact of software consumption instead of spending time discussing how to install different software or how to interpret the different outputs. It simplifies energy measurement and analysis, making it an excellent educational tool for instructors and students alike.
3. Cross-Platform Energy Collection: A use case for EnergiBridge is enabling the collection of software energy consumption across diverse platforms. This use case allows developers to analyze the behavior of their software on different operating systems and hardware configurations. It is not necessarily possible to compare the measured value but it is possible to compare the general energy curve of the system as well as the evolution of the energy consumption of the software.
The versatility of EnergiBridge extends its utility across these diverse use cases and purposes, underscoring its significance as a valuable resource in the software engineering landscape.
4. EnergiBridge
EnergiBridge is a user-friendly tool designed for seamless integration by developers. The interface and output are uniform across platforms, therefore simplifying the integration and training process. We also provide the executable of EnergiBridge for Windows, Linux, and MacOS directly through GitHub releases, making it accessible to new users and reducing the initial setup overhead.
To achieve this uniform interface, EnergiBridge is developed in Rust and relies on low-level system calls to collect the energy consumption and reduce the execution overhead that would emerge from merging existing tools together. On Mac, it relies on System Management Controller (SMC) to read CPU temperature and the system power usage. For Intel and AMD CPU, it accesses energy information from the CPU by reading the Model-specific register (MSR). Intel and AMD report the energy in joules while Apple reports the average power in watts. For simplified and uniform usage, we convert all the information into energy using watts – the SI unit for energy consumption per second.
4.1. Usage
The core functionality of EnergiBridge revolves around its command-line interface. Developers can effortlessly invoke the tool by specifying a command to run as a parameter. During the execution of this command, EnergiBridge performs energy measurements at specific intervals. This approach allows for accurate and informative energy consumption analysis. EnergiBridge is used as follows:
Where the options can be:
-
•
-i, –interval <INTERVAL> Duration of the interval between two measurements in milliseconds [default: 100]
-
•
-m, –max-execution <MAX_EXECUTION> The maximum duration of the command execution in seconds. [default: 0]
-
•
–summary Display a summary of the energy consumption during the execution of the command.
In the example below, we demonstrate how to use EnergiBridge to measure the energy consumption of Chrome while running it for 10 seconds:
4.2. Output
The output generated by EnergiBridge is designed with analysis in mind. Instead of providing direct usability, we furnish a CSV file that contains measurements acquired at specified intervals.
Since each system is different, we collect varying information depending on the system, in particular regarding the granularity of the measurements. An AMD CPU on Linux will be able to report the energy consumption of each CPU core while a ARM Mac will only be able to provide the system power consumption. Table 2 presents the different CPU properties and Table 3 presents the GPU properties that are collected on each system by EnergiBridge.
| Property | Windows | Linux | Mac OS | |||||
| Intel | AMD | ARM | Intel | AMD | ARM | Intel | ARM | |
| CPU Usage | ✓ | ✓ | ✓ | ✓ | ✓ | ✓ | ✓ | ✓ |
| Package Power | ✓ | ✓ | ✓ | ✓ | ✓ | ✓ | ✓ | |
| System Power | ✓ | ✓ | ||||||
| Core Frequency | ✓ | ✓ | ✓ | ✓ | ✓ | ✓ | ||
| Core Power | ✓ | |||||||
| Memory Usage | ✓ | ✓ | ✓ | ✓ | ✓ | ✓ | ✓ | ✓ |
| Property | Windows | Linux | Mac OS | |
| Nvidia | Nvidia | AMD/Intel | ARM | |
| GPU Usage | ✓ | ✓ | ||
| GPU Frequency | ✓ | ✓ | ||
| GPU Power | ✓ | ✓ | ✓ | ✓ |
5. Evaluation
In this section, we present the evaluation of EnergiBridge. To do so, we present a use case of EnergiBridge on a cross-platform system. The main purpose of the evaluation is to illustrate the ability of EnergiBridge to capture the energy consumption of software on a cross-platform environment with a wide variety of hardware and software.
5.1. Experimental use case
The evaluation consists of running Chrome for a defined period and measuring its energy consumption and we will measure the difference with the same system running at IDLE (no other programs are running). We select Chrome as it is the most popular browser111https://www.statista.com/statistics/268299/most-popular-internet-browsers/ and multi-platform. The Chrome workload consists of opening new Chrome windows, going to google.com, and waiting for 10 seconds. The IDLE workload consists of measuring the energy consumption for 10 seconds while the system is doing nothing. EnergiBridge (v0.0.4, sha: dab662f) is used as follows:
Table 4 presents the hardware that is used for this evaluation. We aim to use different operating systems and hardware components. During the execution of the evaluation, those systems had all their applications closed and no users were interacting with them.
| OS | CPU | GPU |
| Windows | AMD Ryzen™ 5 5600H | GeForce RTX 3060 Laptop |
| Linux | AMD Ryzen™ 9 7900X | GeForce RTX 4090 |
| Mac ARM | Apple M1 Max | Apple M1 Max |
| Mac Intel | Intel Core i7-9750H | Intel Graphics 630 |
We execute those two workloads (i.e., Chrome and IDLE) 20 times with a random order on each system to collect statistically valid measurements. It is considered a good practice to run the measurements multiple times to ensure that no special situation happens during the collection (e.g., background execution).
Additionally, we provide the replication package of our evaluation 222Replication package: https://github.com/tdurieux/EnergiBridge-experiments. The replication package provides the experiment scripts, collected data, and associated analysis of the experimental use case. The same repository also includes an execution framework for measuring energy across various other application use cases, from browser execution to Large Language Model inference with LLAMA.cpp, which we do not cover in this evaluation.
5.2. Results
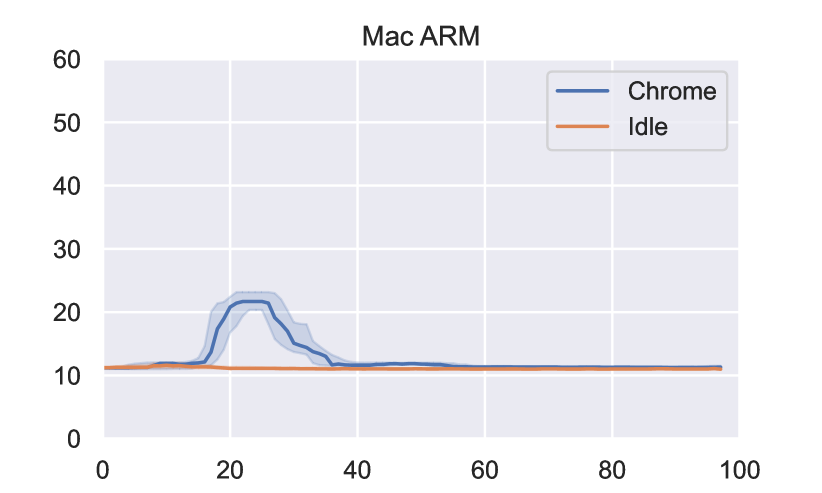
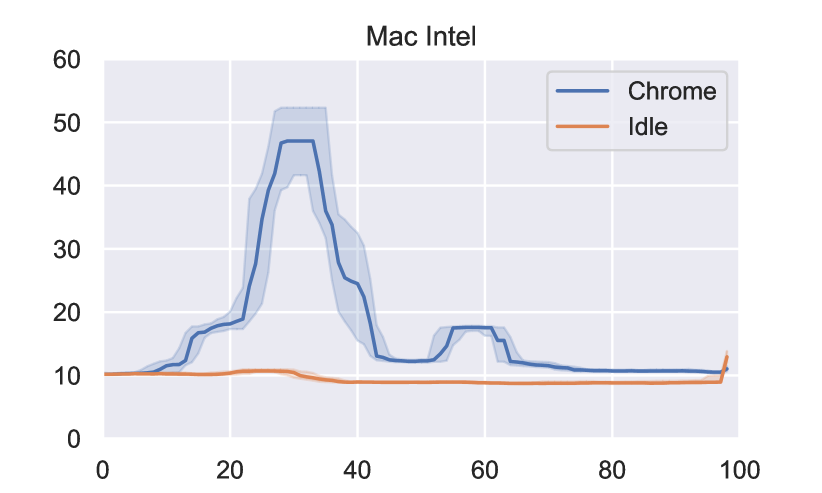
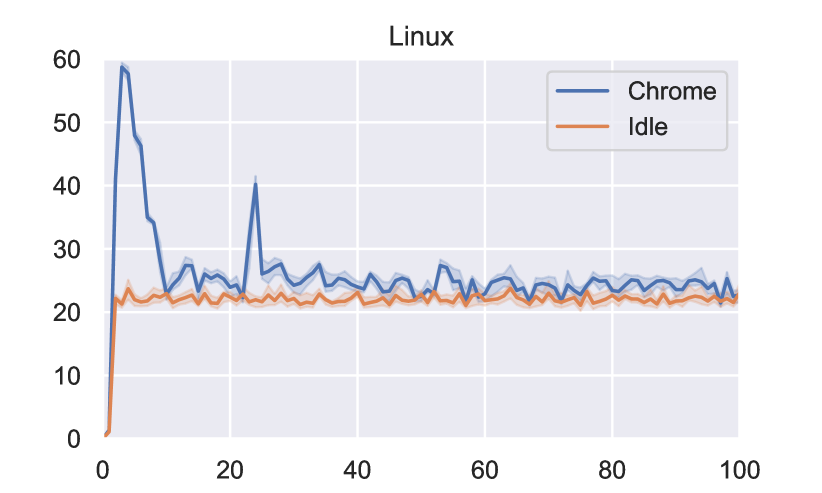
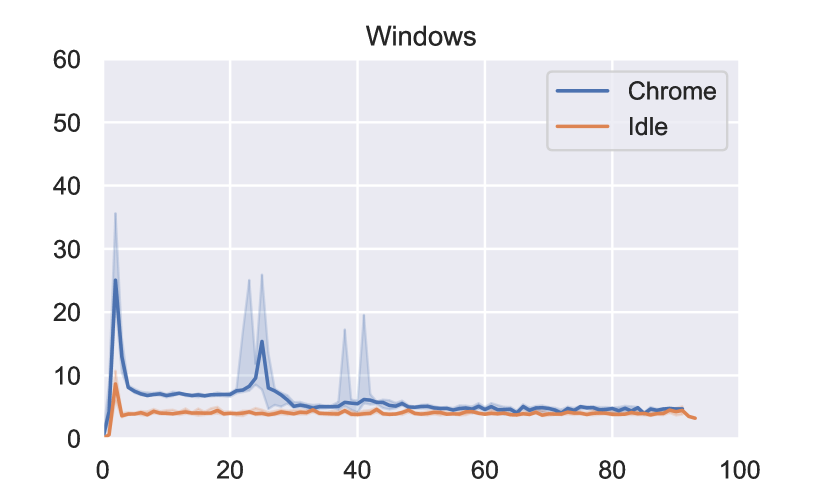
In this section, we present the findings from our evaluation. Figure 1 provides a visual representation of energy consumption, via the power metric, for the Chrome browser and the system in an IDLE state across the four execution configurations (cf. Table 4). The blue area illustrates the interquartile range for the 20 runs, while the line represents the mean power consumption. The vertical axis is measured in watts, and the horizontal axis represents the time evolution, indicated by the index of energy measurements, i.e., samples, taken (one measurement every 100 milliseconds).
Significant differences are evident when comparing the four systems. Notably, the most prominent difference is the scale of power consumption between the systems. Power consumption on Mac ARM is notably lower than that on Mac Intel, the peak is around 20 watts for ARM while the peak is around 50 watts on Intel. We observe that the Linux system is the most consuming hardware configuration and the most powerful one too. However, the overall power consumption is the lowest on Windows. This difference arises from the fact that on Windows and Linux, we measure CPU consumption, while on Mac, we measure the entire system’s energy consumption. A notable observation is that the overall energy consumption of the entire Mac system is lower than the CPU consumption of the Linux machine. Where the idle power consumption on Linux is around 20 watts while the peak on Mac ARM is 20 watts. Note however that we do not use equivalent hardware across different platforms – we provide these observations to showcase the tool and the differences in the studied platforms are not generalizable.
Comparing the results between the IDLE state and Chrome execution, it is evident that the energy consumption peak occurs when Chrome is launched. Notably, the timing of this peak varies across the systems. On Linux, the peak occurs at the beginning, while on Mac, it takes place after approximately 20 samples, and on Windows, it is observed at the beginning and a second one around index 30. This discrepancy highlights the distinct behavior of each operating system.
During this evaluation, we show the ability of EnergiBridge to run on multiple platforms that have a diversity of software and hardware. We demonstrate that interesting patterns can be identified by comparing the execution of Chrome on different platforms. We also aimed to illustrate that EnergiBridge is easy to use and enables students, researchers, and practitioners to easily collect energy data from their software execution.
6. Threat to Validity
Our research and the use of EnergiBridge for energy measurement and system metrics analysis are subject to several potential threats to validity.
Internal Bugs in EnergiBridge: An inherent concern is the possibility of internal bugs within EnergiBridge that may affect the accuracy of energy measurements and system metrics. To counter this threat, we have made EnergiBridge open-source, inviting developers and researchers to inspect and contribute to its codebase. We commit to ongoing maintenance and improvement to ensure its reliability. Furthermore, we intend to use EnergiBridge in the next edition of our course on Sustainable Software Engineering, where the tool will be used in a diverse set of platforms.
Impact of EnergiBridge Execution on Energy Measurement: The execution of EnergiBridge itself has the potential to impact energy measurements, particularly on certain platforms. EnergiBridge exhibits low and consistent energy consumption, thereby minimizing its influence on comparative analyses between two measurements.
Accuracy of Energy Measurements: Another potential threat relates to the accuracy of energy measurements. Ensuring precise measurements is challenging, and variations may occur in particular between systems. This is a limitation of any state-of-the-art software-based energy profiler. We argue that data collected from energy profilers yields results that are still comparable between executions under the same environment. This comparability allows EnergiBridge to effectively evaluate energy consumption trends within the measured system over time.
7. Conclusion
In this paper, we introduce EnergiBridge, the first energy measurement tool that is compatible with Linux, MacOS, and Windows, across a wide range of CPU architectures. EnergiBridge distinguishes itself by relying on low-level system calls to gather energy metrics, while maintaining low resource consumption. It also offers native support for measuring energy consumption on Nvidia GPUs, a feature often absent in other tools.
Our objective in providing EnergiBridge is to simplify the process of collecting energy measurements for students, researchers, and practitioners. The existing landscape for this task is currently complex and varies significantly across platforms, making it challenging to convey and establish a standardized approach to energy consumption measurement.
In our evaluation, we demonstrate EnergiBridge’s capability to collect energy data across diverse operating systems and hardware setups. We aim to emphasize that this process can be relatively straightforward and consistent, irrespective of the platform.
While EnergiBridge lays a robust foundation for cross-platform energy measurement, there is ample room for further enhancement and expansion. In future work, we plan to:
-
•
Explore additional metrics and parameters that can provide deeper insights into software energy consumption.
-
•
Extend support for additional hardware configurations and provide scripts for in-depth analysis of the collected data.
-
•
Incorporate hardware measurements for the entire system and synchronize them with software-based measurements.
References
- (1)
- Cruz (2021) Luís Cruz. 2021. Tools to Measure Software Energy Consumption from your Computer. http://luiscruz.github.io/2021/07/20/measuring-energy.html. https://doi.org/10.6084/m9.figshare.19145549.v1 Blog post.
- Guldner et al. (2021) Achim Guldner, Eva Kern, Sandro Kreten, and Stefan Naumann. 2021. Criteria for Sustainable Software Products: Analyzing Software, Informing Users, and Politics. In Software Sustainability. Springer, New York, NY, USA, 17–42. https://doi.org/10.1007/978-3-030-69970-3_2
- Jagroep et al. (2017) Erik Jagroep, Jordy Broekman, Jan Martijn E.M. van der Werf, Patricia Lago, Sjaak Brinkkemper, Leen Blom, and Rob van Vliet. 2017. Awakening Awareness on Energy Consumption in Software Engineering. In ICSE-SEIS. IEEE, New York, NY, USA, 76–85. https://doi.org/10.1109/ICSE-SEIS.2017.10
- Moises et al. (2018) Ana Carolina Moises, Andreia Malucelli, and Sheila Reinehr. 2018. Practices of Energy Consumption for Sustainable Software Engineering. In IGSC. IEEE, New York, NY, USA, 1–6. https://doi.org/10.1109/IGCC.2018.8752151
- Pang et al. (2015) Candy Pang, Abram Hindle, Bram Adams, and Ahmed E. Hassan. 2015. What Do Programmers Know about Software Energy Consumption? IEEE Software 33, 3 (July 2015), 83–89. https://doi.org/10.1109/MS.2015.83
- Pinto and Castor (2017) Gustavo Pinto and Fernando Castor. 2017. Energy Efficiency: A New Concern for Application Software Developers. Commun. ACM 60, 12 (nov 2017), 68–75. https://doi.org/10.1145/3154384
- Weaver (2023) Vince Weaver. 2023. Linux support for Power Measurement Interfaces. https://web.eece.maine.edu/~vweaver/projects/rapl/rapl_support.html