figurec \newfloatcommandcapbtabboxtable[][\FBwidth]
The SENSEI Collaboration
SENSEI: First Direct-Detection Results on sub-GeV Dark Matter
from SENSEI at SNOLAB
Abstract
We present the first results from a dark matter search using six Skipper-CCDs in the SENSEI detector operating at SNOLAB. With an exposure of 534.9 gram-days from well-performing sensors, we select events containing 2–10 electron-hole pairs. After aggressively masking images to remove backgrounds, we observe 55 two-electron events, 4 three-electron events, and no events containing 4–10 electrons. The two-electron events are consistent with pileup from one-electron events. Among the 4 three-electron events, 2 appear in pixels that are likely impacted by detector defects, although not strongly enough to trigger our “hot-pixel” mask. We use these data to set world-leading constraints on sub-GeV dark matter interacting with electrons and nuclei.
I Introduction
Abundant astrophysical evidence indicates that a substantial fraction of the matter in our universe is composed of non-baryonic dark matter (DM). While many candidate particles with the required properties have been proposed, DM has yet to be detected in the laboratory. DM candidates with a mass of less than a proton (“sub-GeV DM”) are well-motivated and have increasingly been the target of experimental efforts in the last decade [1, 2]. To date, the strongest direct-detection probes of DM with eV-to- MeV masses are searches for electron recoils from DM-electron scattering [3], DM-nucleus scattering through the Migdal effect [4] and bremsstrahlung [5], and DM absorption on electrons [6, 7, 8, 9, 10].
The Skipper Charge-Coupled Device (Skipper-CCD) technology can measure single-electron signals in a pixelated silicon target with high precision [11]. A particle interaction in silicon can excite an electron from the valence band to the conduction band in one of the pixels of the Skipper-CCD, which, given enough energy, can in turn create additional electron-hole pairs (below, simply referred to as “electrons” and denoted as “”). The charge in each pixel is then moved pixel-to-pixel to readout stages located in the corners of the Skipper-CCD, where the pixel charge is measured repeatedly and nondestructively to sub-electron precision. This technology paved the way for the development of SENSEI (Sub-Electron Noise Skipper-CCD Experimental Instrument). The single-electron sensitivity corresponds to energy depositions of (1 eV), which are kinematically well-matched to the signals generated by the sub-GeV DM models described above. As a result, SENSEI [12, 13, 14] and other experiments [15, 16, 17, 18, 19, 20, 21, 22, 23, 24, 25, 26, 27, 28, 29, 30, 31, 32, 33, 34, 35] have begun to carve away at the allowed DM parameter space.
In this letter, we present the first results from a search for DM-electron scattering, DM-nuclear scattering through the Migdal effect, and dark photon DM absorption with the SENSEI apparatus operating in the SNOLAB underground laboratory, based on data taken from September 9, 2022 to April 10, 2023. Supplemental Materials (SM) contain additional details.
II The SENSEI experiment at SNOLAB
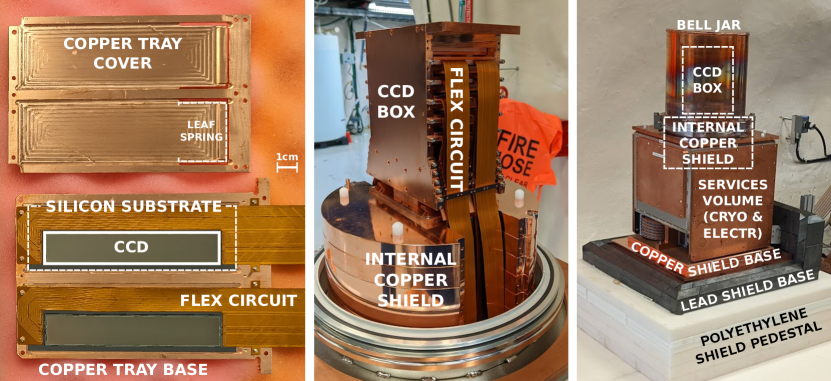
Data were collected using six science-grade Skipper-CCDs designed at LBNL and fabricated at Teledyne DALSA Semiconductor. These Skipper-CCDs, which were used in [36, 37], were fabricated on the same silicon wafers as those used in the previous SENSEI result [14] and have an identical design, except that their overall dimensions and packaging are slightly different. The standard thickness is , which, after repolishing, gives a thickness of [38]. The active area is pixels of , and the active mass is 2.19 g. In normal operation, each CCD is read out through four amplifiers, each of which reads a “quadrant” of 512 rows by 3072 columns. The CCD and a copper-Kapton flex circuit are glued to a silicon substrate and wirebonded. Two such modules are placed in a copper tray, which secures and cools the modules using a copper leaf spring (left panel in Fig. 1).
The SENSEI apparatus at SNOLAB was installed in 2021. The experiment is contained in a vacuum vessel, which is separated into two sections. The upper section holds a “CCD box” with capacity for up to 12 CCD trays (middle panel in Fig. 1). The CCD box is cooled through a cold finger, the temperature of which was maintained in a range of 125–145 K. All major components of the upper section, including a 6-inch shield between the CCD box and the lower section, are made of oxygen-free high conductivity (OFHC) copper. The lower section of the vacuum vessel holds the cryocooler and readout preamplifiers. The vacuum vessel (right panel in Fig. 1) is shielded by a 2-inch inner layer of OFHC copper, a 3-inch middle layer of low-background lead, and a 42-inch outer layer of water tanks and polyethylene (originally built for [39]). The resulting rate of background events in the energy range from 500 eV to 10 keV is 140 events/kg/day/keV (see SM).
Each CCD is biased and read out by the Low Threshold Acquisition (LTA) readout electronics [40]. In order to reduce the “spurious charge” previously seen in these CCDs [14, 41], RC filters are used to shape the voltage waveforms applied to the CCD [42]. We collect 300 samples per pixel, with a single-sample readout time of 48.8.
We refer to one full readout of all six Skipper-CCDs as an “image,” and collect each image following the procedure outlined in [41]. To prepare the CCD we adjust the bias voltages to erase the CCD and suppress dark current [43], then repeatedly and rapidly (in 0.4 seconds/image) shift charge out of the CCD for three hours to eliminate any trapped charge. Then we expose the CCD for 20 hours, and read out every quadrant in parallel in 7.69 hours, which includes a prescan of 8 columns, an overscan of 120 columns, and a vertical overscan of 8 rows. Alternating images in a 2+2 or 1+1 cadence are designated as “commissioning” or “hidden,” and only commissioning images are used to develop the analysis and data quality cuts. This cycle was repeated continuously with interruptions due to declining performance of the cryocooler, for a total of 129 images (70 commissioning and 59 hidden).
III Data reconstruction and selection
The averaging of Skipper samples, baseline subtraction, and clustering are performed as in [14]. We define a pixel to have a thresholded charge of (1, 2, ) if it has a measured charge in the range ((0.7, 1.63], (1.63, 2.5], (, ]), respectively. Given a pixel, a “neighboring” pixel is one of the eight adjacent pixels. A “cluster” or “event” is defined as a contiguous group of neighboring pixels, each possessing a nonzero thresholded charge. The cluster charge is the sum of the thresholded pixel charges.
Of the 24 total quadrants, 12 were rejected based on their performance in the commissioning data. Three have low readout gain or high readout noise that prevents single-electron resolution. Seven have high densities of single-electron events (/pix) after applying all cuts discussed below and averaging over all images, indicating poor CCD performance. Two have multiple events in the 4–10 electron range after cuts, which can be linked to charge transfer inefficiencies that impact these quadrants. The remaining 12 “good” quadrants have readout noises in the range 0.131 to 0.153 and single-electron event densities in the range (1.44–3.43)/pix.
We observe that images collected during periods of higher cold-finger temperature have correspondingly higher densities of single-electron events. To remove these images, we apply a “hot image” selection in two stages, looking only at good quadrants. First, we treat each quadrant independently, and iteratively determine the set of images in which it is hot. A quadrant is marked hot in a given image if, considering the number of unmasked pixels in this quadrant and image, as well as the density of single-electron events in this quadrant across all non-hot images, the Poisson -value meets a threshold such that if charge was uniformly distributed in time, the expected number of images with a good quadrant marked “hot” would be 0.5. Second, an image is considered “good” if no more than one of its quadrants is marked hot. 82 good images (45 commissioning and 37 hidden) survive this selection.
The total exposure before cuts in good quadrants and good images is 534.89 g-days (293.53 commissioning, 241.35 hidden).
IV Data analysis
After selecting good quadrants and good images, the data contain clusters, some of which must be removed if they are more likely to be background than a DM signal. A series of analysis cuts (‘masks’) were developed that each target a particular background source. Each mask removes specific pixels from each image, and clusters are removed from the dataset if they have any pixel that has been masked. These masks were developed exclusively using the commissioning data, and were subsequently applied uniformly to both the commissioning and hidden data for the final analysis. Upon opening the hidden data, we observed that it was not statistically different from the commissioning data.
We apply several masks to the data. The crosstalk, edge, serial register hit, bleeding zone, and halo mask algorithms were previously used in [14], but their parameters have been re-tuned for this analysis (see SM). We here discuss the masks that are either new or substantially different from [14]:
-
•
Readout Noise. We observe time periods with a high level of readout noise, from some source external to the CCD. We mask rows where 6% of pixels have measured charge more than away from an integer value, where is the typical readout noise for the quadrant.
-
•
Bad Pixels and Columns. Defects causing charge leakage or severe charge transfer inefficiency can create excess charge in specific pixels or columns, while amplifier light [41] can create a charge excess in columns near the readout amplifier. We stack all images to identify and mask pixels and columns (or blocks of pixels and columns) with a statistically improbable excess of charge by setting thresholds on the Poisson -values such that if charge was uniformly distributed, the mean number of pixels and columns removed would be 0.5.
-
•
Full-Well Mask. We mask all pixels in the same row as pixels whose charge is near the maximum capacity of the pixels (“full-well events”), as this results in severe charge trapping and bleeding.
-
•
Low-Energy Cluster. After all other analysis masks, we still observe regions with excess charge due to amplifier light or inadequate masking. We therefore mask pixels within pixels of any cluster, but not the cluster itself. Detailed studies using data and simulations show that this mask is consistent with removing events in regions containing higher event densities from understood but inadequately masked detector backgrounds, without suppressing the density of DM-like events (see SM). This mask also prevents double-counting of DM events in non-contiguous pixels.
-
•
Cluster Shape. We observe 9 (21) single-pixel 2 events in commissioning (combined) data, which is a significant excess over the pileup expectation of 3.52 (6.33) events. We do not observe a corresponding excess for the other 2 shapes, as would be expected from a DM origin. The source of this excess is unknown, but it may be associated with unmasked hot pixels, amplifier light (multiple photons emitted in bursts, or single photons above the 2 threshold), or other stray photons above the 2 threshold that are absorbed near the CCD frontside.111The 5 single-pixel 2 events observed in [14] were also in excess of the pileup expectation. To avoid such possible backgrounds, we remove all single-pixel multi- events. We also observe an excess of 2 and 3 “horizontal” clusters in two of the good quadrants across several images (178 2-events versus 1.99 expected from pileup, and 6 3 events versus 0 expected), where several pixels next to each other in the same row contain 1. These are likely associated with charge transfer inefficiencies when draining charge from the readout amplifier. We remove all horizontal clusters in these two quadrants, and all horizontal clusters with 3 or above in any quadrant.
The fraction of pixels that survive masking ranges from 8.6–30.8% across the good quadrants, and is 19.0% overall. The total exposure of unmasked pixels is 100.72 g-days (55.13 commissioning, 45.59 hidden). See SM for cut-by-cut efficiency and exposure.
Our data collection procedure was optimized for clusters containing 2–10, where 10 is chosen arbitrarily above the point where our sensitivity becomes non-competitive with other experiments for all models we investigate. Since we used the same exposure duration for all images and also did not independently measure exposure-independent sources of 1 events (as we did in [14, 41]), we cannot isolate the part of the 1 event density that corresponds to an event rate. Our ability to control dark current was also limited by poor temperature control from the failing cryocooler. Naively dividing counts by exposure for the quadrant with the lowest event density yields an upper bound on the rate of /pix/day, or /g-day, but we do not use the 1 channel to constrain DM.
Observed events, expected pileup backgrounds, efficiencies, and effective exposure after masking are shown in Table 1. We bin events by charge and pixel count; 2 events are additionally binned by the orientation of the cluster (horizontal, vertical, diagonal). We observe zero events containing 11–100 electrons, with the exception of a single 26-electron event, which we find to be consistent with the expected background from Compton scattering.
| Efficiencies | All data | Hidden data | |||||
|---|---|---|---|---|---|---|---|
| Shape | Diff./ID/Geom. | Expo. | Ev. | Bkgd. | Expo. | Ev. | Bkgd. |
| 2e2p, h | 0.15/0.96/0.94 | 13.58 | 10 | 10.66 | 6.12 | 6 | 4.75 |
| 2e2p, v | 0.18/0.96/0.94 | 16.21 | 13 | 12.65 | 7.36 | 6 | 5.61 |
| 2e2p, d | 0.19/0.96/0.93 | 17.82 | 32 | 25.31 | 7.65 | 18 | 11.22 |
| 2e, all | 0.51/0.96/0.94 | 46.61 | 55 | 48.62 | 21.13 | 30 | 21.57 |
| 3e2p | 0.33/0.98/0.96 | 30.87 | 3 | 0.01 | 14.01 | 2 | 0.01 |
| 3e3p | 0.31/0.94/0.90 | 26.84 | 1 | 0.06 | 12.21 | 0 | 0.03 |
| 3e, all | 0.64/0.96/0.93 | 57.71 | 4 | 0.07 | 26.22 | 2 | 0.03 |
| 4e2p | 0.21/0.98/0.96 | 19.51 | 0 | 0.00 | 8.85 | 0 | 0.00 |
| 4e3p | 0.31/0.96/0.92 | 27.60 | 0 | 0.00 | 12.55 | 0 | 0.00 |
| 4e4p | 0.19/0.93/0.88 | 15.93 | 0 | 0.00 | 7.25 | 0 | 0.00 |
| 4e, all | 0.71/0.96/0.92 | 63.03 | 0 | 0.00 | 28.66 | 0 | 0.00 |
| 5e, all | 0.75/0.95/0.91 | 65.56 | 0 | 0.00 | 29.84 | 0 | 0.00 |
| 6e, all | 0.78/0.95/0.90 | 67.31 | 0 | 0.00 | 30.63 | 0 | 0.00 |
| 7e, all | 0.80/0.95/0.89 | 68.53 | 0 | 0.00 | 31.19 | 0 | 0.00 |
| 8e, all | 0.82/0.95/0.89 | 69.52 | 0 | 0.00 | 31.67 | 0 | 0.00 |
| 9e, all | 0.84/0.94/0.88 | 70.30 | 0 | 0.00 | 32.02 | 0 | 0.00 |
| 10e, all | 0.85/0.94/0.88 | 70.89 | 0 | 0.00 | 32.30 | 0 | 0.00 |
The diffusion of charge through the CCD is simulated using the same model and parameters as in [14], since the CCD properties and bias voltage are identical. Due to the charge dependence of the diffusion width [44], this model, fitted on muon tracks, conservatively underestimates the efficiency for low-energy DM events to produce contiguous pixels. Using high-energy clusters, we measure the maximum observed spread, , as a function of cluster charge and confirm that our model slightly overestimates for low-energy clusters. Using this model, we simulate events with a uniform depth distribution and compute the “diffusion efficiency,” i.e. the probability to obtain a cluster passing the Cluster Shape mask given an initial event charge. These simulations contribute a relative uncertainty to the effective exposure of 0.7% in the worst case (for horizontal/vertical 2 events).
We then inject the simulated events in all images. If an injected event survives masking in a particular position, we add the exposure at that position to the effective exposure. In this way, the probability for an event to survive masking is proportional to the fraction of unmasked pixels times the probability that an initially-unmasked event gets masked due to it overlapping a nearby masked region (the “geometric efficiency”) [45]. The exposure is then also weighted by the probability for every pixel of the event to have its charge correctly reconstructed (the “misID efficiency”). This underestimates efficiency and gives a conservative result, since in reality misidentification of a pixel merely changes the cluster charge.
We compute the expected number of 2, 3, and 4 background events due to pileup of 1 events. For each quadrant of each image, we use the numbers of unmasked pixels and 1 events to compute the expected number of pileup events. This accounts correctly for variations in 1 event density between quadrants and images; it underestimates the pileup rate and gives a conservative limit if the 1 event density is not uniform within an image. Our estimate is subject to fluctuations in the number of 1 events and the resulting relative uncertainty on the expected background is 0.9% in the worst case (for diagonal 2 events).
V Dark matter results
We observe 55 2-events and no 4 to 10-events, consistent with pileup background expectations. We do observe, however, four 3-events, expecting only 0.07 pileup events. The 3 events are unlikely to arise from Compton scattering [37, 63, 64] or the partial collection of charge from higher-energy events [65], as these would also produce many events with higher charge. They are also inconsistent with any external origin creating 3 events at either CCD-surface: front-side events would usually form single-pixel clusters while we observe none, and a back-side source would need to first penetrate an opaque layer of in-situ doped polysilicon. However, two of these 3-events occur in positions where we see an excess number of events in stacked images, albeit not enough to have triggered the bad-pixel mask, suggesting that they are due to CCD defects creating localized charge leakage. Since this was determined only after opening the hidden data, we do not remove these from our analysis.
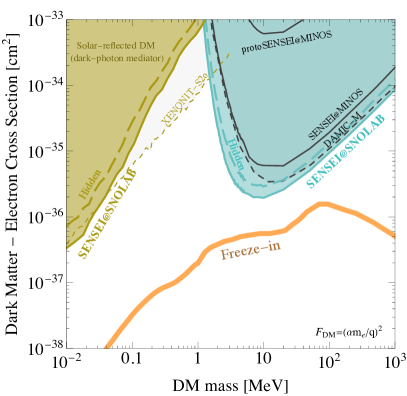
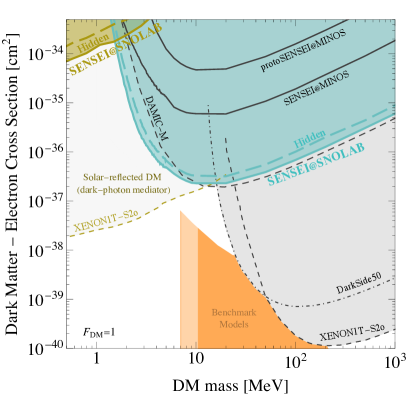
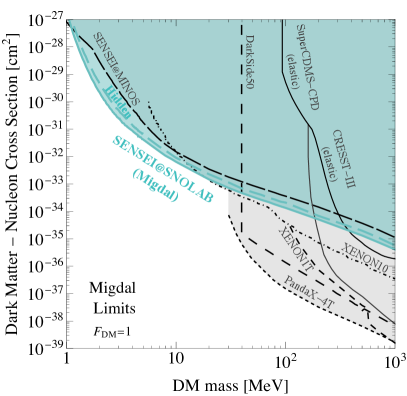
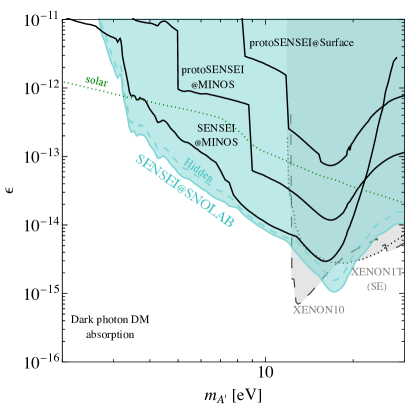
Using the data in Table 1, we show the 90% C.L. limit constraints in Fig. 2 (cyan lines/regions) on halo DM that scatters off electrons for heavy and light mediators [3], DM that scatters off nuclei through the Migdal effect for heavy mediators [4] (and for light mediators in the SM), and DM that is absorbed by electrons [6, 7, 8, 9, 10]. Assuming a dark-photon mediator, we also show bounds on the “solar-reflected DM” component (olive) [66, 67, 68, 69, 70, 49]. Solid (dashed) lines use the combined (hidden-only) data. Our bounds improve on previous bounds for a range of DM models, especially for DM interacting with a light mediator and for dark-photon DM absorption, but also for DM-nuclear interactions below 30 MeV for heavy mediators (and below 40 MeV for light mediators).
As in [14], we use a likelihood-ratio test based on [71] and a toy MC to compute the distribution of the test statistics used for the calculation of the -value, the one difference being that we account for the expected pileup background in each bin as a known background (see SM). The DM-electron scattering rates are from QEDark [72, 46]. A comparison to the DM-electron scattering calculations with DarkELF [73], EXCEED-DM [74, 75], and QCDark [76, 77] is given in the SM. We use the Migdal rates from [56], which uses input from DarkELF [73, 78], and the absorption rates from [79, 80]. For solar-reflected DM, we use the simulations from [49] (using [68, 69, 81]) and the DM-electron scattering cross section from [82]. We use the DM halo parameters in [83]. We follow the ionization model in [84] to compute the number of electrons produced by energy deposits in the CCD. The previous SENSEI limit [14] has been recast with these halo parameters and ionization model.
We also compute model-independent rates of events for each charge , (all following rates are in events/g-day). The maximum-likelihood in the combined (hidden-only) data is (), and the 90% C.L. upper limit is (), a factor of 14 lower than our previous limit [14]. The maximum-likelihood in all (hidden) data is (), and the 90% C.L. upper limit is (). For higher charges where we observe no events, the maximum-likelihood rate is zero and the upper limit is 2.30 events divided by effective exposure.
In summary, we presented world-leading constraints from the SENSEI detector at SNOLAB. The observed 2 events are consistent with pileup expectations from 1 events. Four 3 events are observed, with two of them later found to occur in pixels with an excess number of events in stacked images. The SNOLAB setup has been upgraded with additional detectors for another science run. A larger dataset will allow us to further investigate if the observed 3 events are consistent with excesses in stacked images. A dedicated run will measure the 1 event rate. Further improvements to the data-taking and analysis based on what was learned after opening the hidden data are expected to further increase our sensitivity to low-mass DM.
Acknowledgements.
We thank Ryan Plestid for collaboration on the DM-electron scattering rates for solar-reflected DM to appear in [82]. We are grateful for the support of the Heising-Simons Foundation under Grant No. 79921. This document was prepared by the SENSEI collaboration using the resources of the Fermi National Accelerator Laboratory (Fermilab), a U.S. Department of Energy, Office of Science, Office of High Energy Physics HEP User Facility. Fermilab is managed by Fermi Research Alliance, LLC (FRA), acting under Contract No. DE-AC02-07CH11359. We would like to thank SNOLAB and its staff for support through underground space, logistical and technical services. SNOLAB operations are supported by the Canadian Foundation for Innovation and the Province of Ontario, with underground access provided by Vale at the Creighton mine site. The CCD development work was supported in part by the Director, Office of Science, of the DOE under No. DE-AC02-05CH11231. RE acknowledges support from DOE Grant DE-SC0017938 and Simons Investigator in Physics Award 623940, which also provide support for AS and HX. TV is supported, in part, by the Israel Science Foundation (grant No. 1862/21), by the NSF-BSF (grant No. 2021780) and by the European Research Council (ERC) under the EU Horizon 2020 Programme (ERC-CoG-2015, Proposal No. 682676 LDMThExp). RE and TV acknowledge support from the Binational Science Foundation (grant No. 2020220). IB is grateful for the support of the Alexander Zaks Scholarship, The Buchmann Scholarship, and the Azrieli Foundation. The U.S. Government retains and the publisher, by accepting the article for publication, acknowledges that the U.S. Government retains a non-exclusive, paid-up, irrevocable, world-wide license to publish or reproduce the published form of this manuscript, or allow others to do so, for U.S. Government purposes.Supplemental Materials
In these Supplemental Materials, we provide additional details and information to clarify the main results. We present the high-energy event spectrum in Section I; provide more details in Section II on the masks that were previously used in [14] but were re-tuned for this analysis; provide more details on the low-energy cluster mask in Section III; detail the efficiencies of applying each mask to the data in Section IV; describe our limit-setting procedure in Section V; compare the DM-electron scattering limits using different calculations for the cross section in Section VI; compare the DM-electron scattering limits using the combined bins to the limits using individual bins in Section VII; and give the limit on DM-nucleus scattering via a light mediator from the Migdal effect in Section VIII.
I High-Energy Event Spectrum
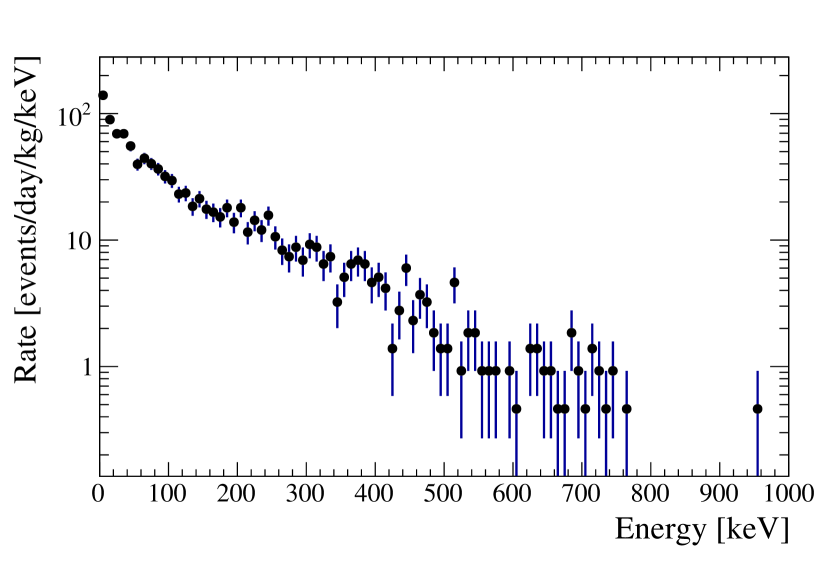
The high-energy event spectrum from 500 eV to 1 MeV is shown in Fig. 3. In the energy range from 500 eV to 10 keV, the background event rate is 140 events/kg/day/keV, which is a factor of 24 smaller than the background rate of the SENSEI detector located in the MINOS cavern [14].
II Additional Mask Details
Several of the masks used in our analysis have been employed previously in [14], but their parameters have been re-tuned for this analysis. We discuss these previously-used masks below, which are for crosstalk, edge events, serial register hits, bleeding zones, and “halos” around high-energy clusters.
-
•
Crosstalk. A pixel is masked if it is read at the same time as another pixel (on a different quadrant) containing 700 electrons, which can produce fake signals due to electronic crosstalk.
-
•
Edge Mask. We remove 30 pixels around all edges of a quadrant, which corresponds to applying the Low-Energy Cluster mask for any possible clusters located just outside of the quadrant.
-
•
Serial Register Hit. An event that hits the serial register can create an isolated horizontal line of charge [36], which we identify and remove.
-
•
Bleeding Zone Mask. To mask spurious events from charge transfer inefficiencies, we mask all (50) pixels upstream in the vertical (horizontal) direction of any pixel containing more than 100.
- •
III Discussion of Low-Energy Cluster Mask
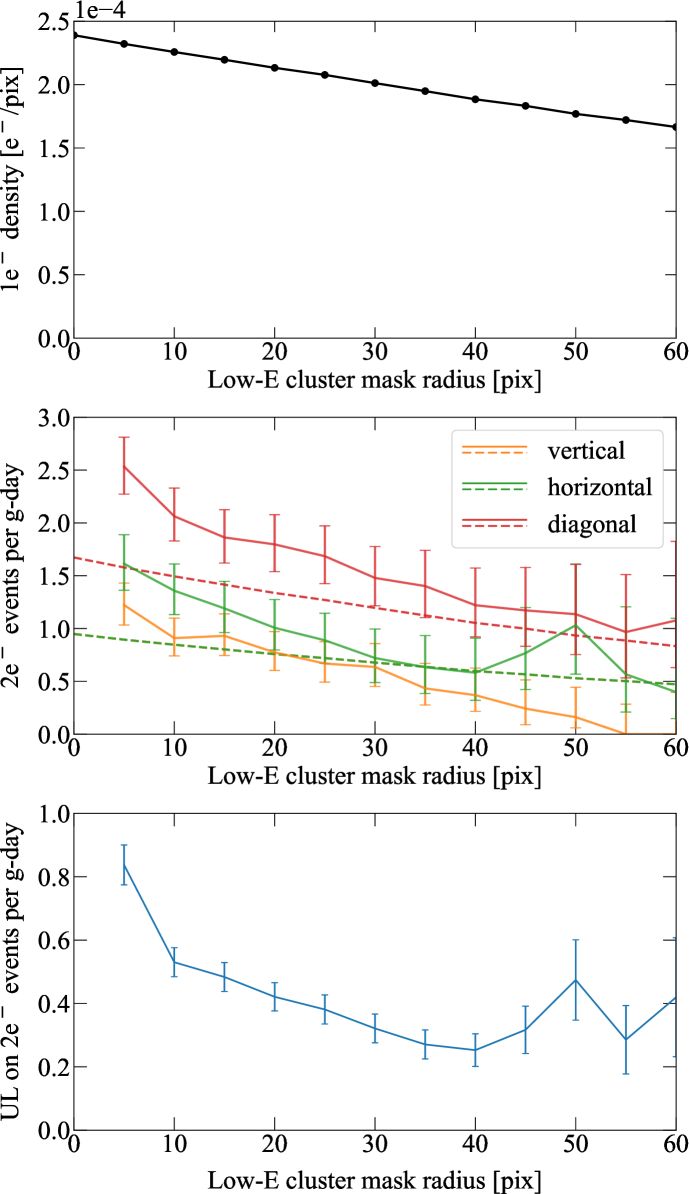
We use both data and Monte Carlo to study the effect of the low-energy cluster mask. As shown in Fig. 4, the measured densities of 1 and multi- events vary depending on the low-energy cluster mask radius . This is due to variations in the 1 density between and within quadrants, which has the following effects:
-
•
Since the 2 background from pileup is proportional to the square of the local 1 density, the true number of 2 pileup events is likely to be greater than our estimate, which conservatively assumes a uniform 1 density.
-
•
The efficiency of the low-energy cluster mask depends on the local 1 density, with regions with a higher 1 density being more heavily masked.
- •
The value of was chosen based on the commissioning data, trading off improved agreement between observed and expected 2 counts with exposure loss. The 1 density is reduced by about 20% at this point; with larger it continues to fall, approaching the value in the cleanest regions of the cleanest quadrants.
We performed several checks to ensure that the low-energy cluster mask is not introducing any biases into our analysis. We performed a Monte Carlo simulation to produce images with uniformly distributed charge, and found that applying this mask to these images does not change the measured density of 1 or multi- events. In another study, we removed the low-energy cluster mask after opening the hidden data and inspected the 3 events passing cuts. Removing the low-energy cluster mask initially resulted in more observed 3 events, but after inspecting the images and removing 3 events in regions affected by understood but inadequately masked detector backgrounds, we observe no additional 3 events beyond those reported in Table 1. We conclude that this mask does not suppress the density of DM-like events, and we expect that in future work with a larger dataset, improvements to masking due to improved understanding of backgrounds will reduce or remove the need for this mask.
IV Cut Flow
Table 2 lists the impact on exposure and event counts as successive masks are applied.
The Bad Column and Low-Energy Cluster masks account for the majority of the efficiency loss. The columns in each quadrant closest to the readout amplifier have higher 1 density due to amplifier light, and the Bad Column mask thus removes a large fraction (from 21% to 58%) of each quadrant. As discussed in Section III, the Low-Energy Cluster mask removes a fraction of each image, which depends on the local density of 1 events.
| Expo. | Events, 2 | Events, 3 | |||||
|---|---|---|---|---|---|---|---|
| Mask | [g-day] | Eff. | horz | vert | diag | 2p | 3p |
| - | 534.89 | - | 60121 | 25993 | 31572 | 10759 | 41240 |
| Noise | 436.53 | 0.817 | 9109 | 10623 | 9584 | 5636 | 9176 |
| Crosstalk | 435.68 | 0.998 | 9031 | 10226 | 9525 | 5248 | 8996 |
| Edge | 379.41 | 0.871 | 7250 | 8486 | 7314 | 4392 | 7432 |
| Bad col. | 217.88 | 0.574 | 5357 | 4008 | 5512 | 2808 | 5696 |
| Bad pix. | 217.86 | 1.000 | 5347 | 4000 | 5503 | 2804 | 5691 |
| Full-well | 213.08 | 0.978 | 981 | 435 | 759 | 181 | 511 |
| Serial reg. | 213.05 | 1.000 | 789 | 335 | 557 | 139 | 333 |
| Bleed | 208.96 | 0.982 | 740 | 275 | 446 | 136 | 312 |
| Halo | 194.43 | 0.931 | 687 | 239 | 397 | 128 | 286 |
| Low-E | 100.72 | 0.522 | 188 | 13 | 32 | 3 | 7 |
| Shape | 100.72 | 1.000 | 10 | 13 | 32 | 3 | 1 |
V Calculating Limits (Description of Likelihood Fit)
We combine the results from the various charge and shape bins into a combined-limit constraint by utilizing the maximum log-likelihood function, as described below.
Let be the number of events observed in bin , the number of events expected from a hypothesized signal, the number of events expected from unknown background, and the number of events expected from known backgrounds. For this analysis, consists of the expected background from pileup of single-electron events.
The number of expected events in a bin is , where is a weighting factor for the signal hypothesis ( corresponds to the background-only hypothesis, while is the test hypothesis). The likelihood function for each bin is the Poisson probability,
| (1) |
The combined likelihood function is the product over all bins,
| (2) |
where . To test the hypothesized value of , we define the profile likelihood ratio
| (3) |
Since we are not working with a background model, we set the (unknown) value of as a nuisance parameter and marginalize over . Here, denotes the value of that maximizes for the specified value of , while and are the values that maximize (but constraining to be non-negative, since the presence of the signal can only increase the event rate). According to [71], setting as a nuisance parameter that depends on reflects the loss of information about due to systematic uncertainties. Therefore, we define as test-statistic
| (4) |
The corresponding -value for a hypothesis is
| (5) |
where is the PDF of under the assumption of signal strength .
We compute using a toy-Monte Carlo (MC). In our particular case, the global and restricted maximums (e.g., the denominator and numerator of Eq. 3) can be computed analytically. Specifically, the global likelihood (denominator) is always maximized for , . The MC is used to generate the distribution of the test-statistic for a fixed set of parameters by Poisson-fluctuating the predicted number of events for that set of parameters. An iterative procedure is used to find the value of for which .
For solar-reflected DM, the expected number of events, , does not scale linearly with cross section, since the expected DM flux from the Sun itself depends on the cross section. For setting limits on solar-reflected DM, the likelihood function in Eq. 1 is thus modified to
| (6) |
where the expected number of solar-reflected DM events depends on the hypothesized cross section . The limit on the DM cross section is then found in a similar way to the methods described above.
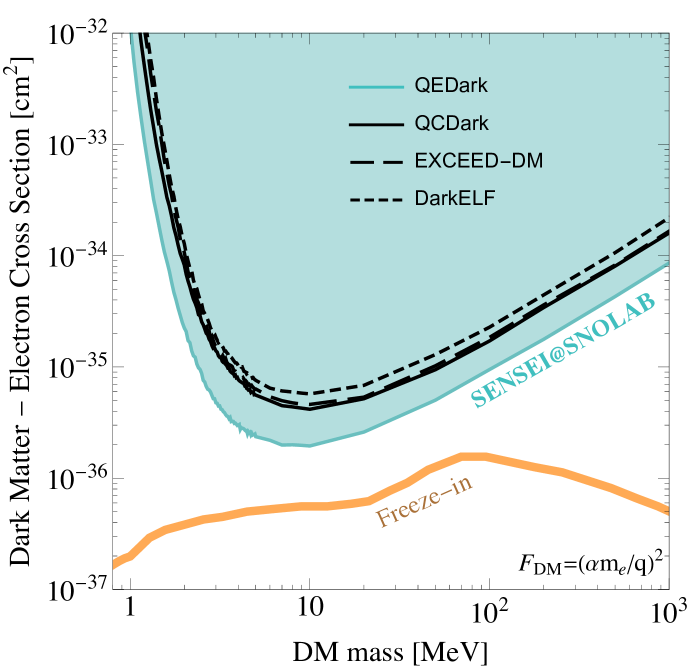
VI Comparison of Limits for Dark Matter-Electron Scattering
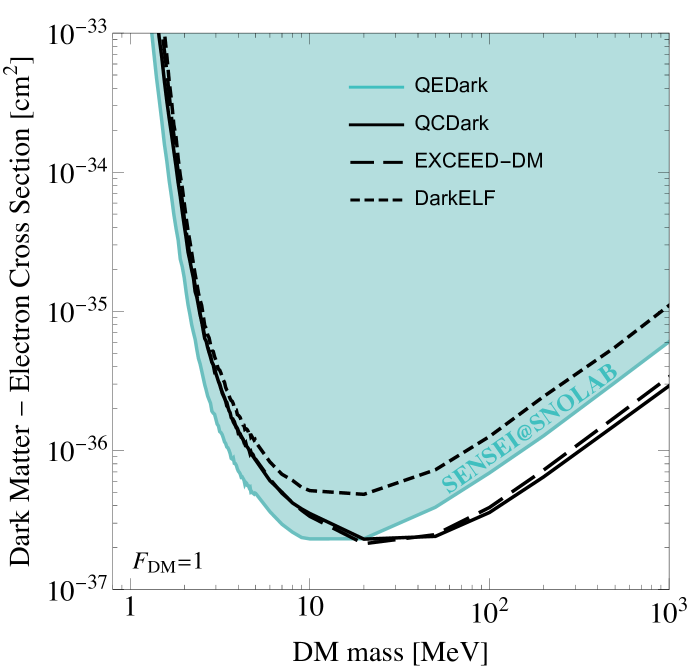
Fig. 5 shows the SENSEI at SNOLAB limits at 90% C.L. on DM-electron scattering using different calculations for the DM-electron scattering cross section. These different curves should not be taken as an uncertainty on the actual limit, seeing as the various calculations account for different effects. QEDark and DarkELF neglect all-electron effects and therefore produce rates that are lower than those calculated with QCDark and EXCEED-DM for events containing more than two electrons for a heavy mediator. Hence, the QCDark and EXCEED-DM limits are stronger for a heavy mediator at larger DM masses. The original version of QEDark also neglects screening effects, which are included in the other codes, and hence over-predicts the rates at low energies and light mediators. While limits produced using QEDark are shown in the main paper to conform with calculations from other experiments, the most accurate limits are those shown with QCDark and EXCEED-DM.

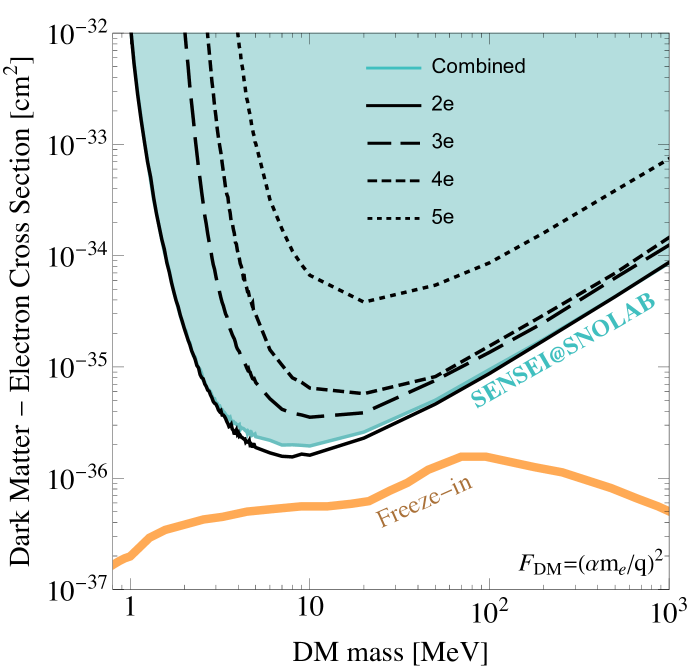
VII Comparison of Combined-Bin Limits with Individual-Bin Limits
Fig. 6 shows the SENSEI at SNOLAB limits at 90% C.L. on the DM-electron scattering cross section, , using the likelihood fit described in Section V and comparing it with the 90% C.L. limit derived from individual electron bins: 2, 3, 4, and 5. We use the original version of QEDark [46, 72] for these limits. We see that for the heavy-mediator case, the 2 bin dominates at lower DM masses, while the 4 bin dominates at higher masses. Since no events were observed in the 4 bin, the limit is statistics limited (assuming we continue to observe no events with more data). For the light-mediator case, the 2 bin dominates for all masses.
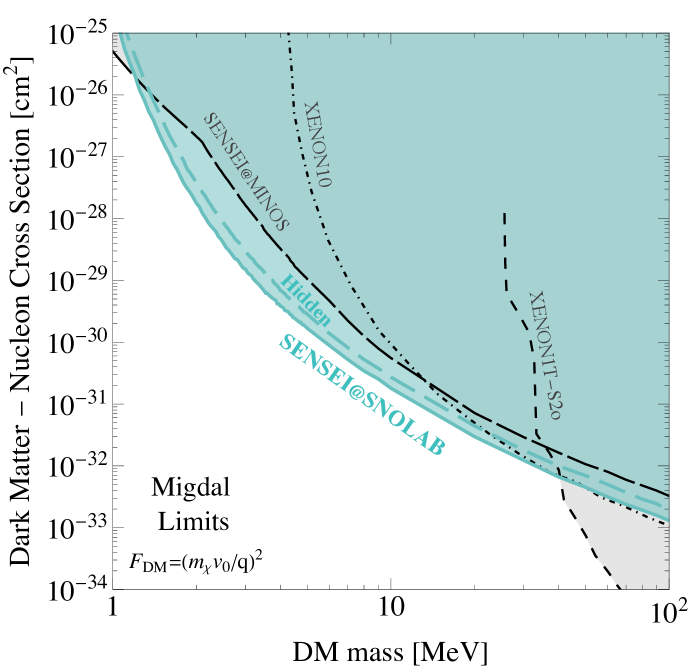
VIII Migdal Limit for Dark Matter interacting with Nuclei through a Light Mediator
Fig. 7 shows the SENSEI at SNOLAB limits at 90% C.L. on the DM-nucleon scattering cross section for a light mediator and assuming the ionization signal is created via the Migdal effect. We see that SENSEI provides the strongest bound on DM-nucleon interactions for DM masses below 40 MeV.
References
- Essig et al. [2022] R. Essig et al., in Snowmass 2021 (2022) arXiv:2203.08297 [hep-ph] .
- Battaglieri et al. [2017] M. Battaglieri et al., in U.S. Cosmic Visions: New Ideas in Dark Matter (2017) arXiv:1707.04591 [hep-ph] .
- Essig et al. [2012a] R. Essig, J. Mardon, and T. Volansky, Phys. Rev. D 85, 076007 (2012a), arXiv:1108.5383 [hep-ph] .
- Ibe et al. [2018] M. Ibe, W. Nakano, Y. Shoji, and K. Suzuki, JHEP 03, 194 (2018), arXiv:1707.07258 [hep-ph] .
- Kouvaris and Pradler [2017] C. Kouvaris and J. Pradler, Phys. Rev. Lett. 118, 031803 (2017), arXiv:1607.01789 [hep-ph] .
- Dimopoulos et al. [1986] S. Dimopoulos, G. D. Starkman, and B. W. Lynn, Physics Letters B 168, 145 (1986).
- Avignone III et al. [1987] F. T. Avignone III, R. L. Brodzinski, S. Dimopoulos, G. D. Starkman, A. K. Drukier, D. N. Spergel, G. Gelmini, and B. W. Lynn, Phys. Rev. D 35, 2752 (1987).
- An et al. [2015] H. An, M. Pospelov, J. Pradler, and A. Ritz, Phys. Lett. B 747, 331 (2015), arXiv:1412.8378 [hep-ph] .
- Bloch et al. [2017] I. M. Bloch, R. Essig, K. Tobioka, T. Volansky, and T.-T. Yu, JHEP 06, 087 (2017), arXiv:1608.02123 [hep-ph] .
- Hochberg et al. [2017] Y. Hochberg, T. Lin, and K. M. Zurek, Phys. Rev. D 95, 023013 (2017), arXiv:1608.01994 [hep-ph] .
- Tiffenberg et al. [2017] J. Tiffenberg, M. Sofo-Haro, A. Drlica-Wagner, R. Essig, Y. Guardincerri, S. Holland, T. Volansky, and T.-T. Yu (SENSEI), Phys. Rev. Lett. 119, 131802 (2017), arXiv:1706.00028 [physics.ins-det] .
- Crisler et al. [2018] M. Crisler, R. Essig, J. Estrada, G. Fernandez, J. Tiffenberg, M. Sofo haro, T. Volansky, and T.-T. Yu (SENSEI), Phys. Rev. Lett. 121, 061803 (2018), arXiv:1804.00088 [hep-ex] .
- Abramoff et al. [2019] O. Abramoff et al. (SENSEI), Phys. Rev. Lett. 122, 161801 (2019), arXiv:1901.10478 [hep-ex] .
- Barak et al. [2020] L. Barak, I. M. Bloch, M. Cababie, G. Cancelo, L. Chaplinsky, F. Chierchie, M. Crisler, A. Drlica-Wagner, R. Essig, J. Estrada, E. Etzion, G. F. Moroni, D. Gift, S. Munagavalasa, A. Orly, D. Rodrigues, A. Singal, M. S. Haro, L. Stefanazzi, J. Tiffenberg, S. Uemura, T. Volansky, and T.-T. Yu (SENSEI Collaboration), Phys. Rev. Lett. 125, 171802 (2020).
- Angle et al. [2011] J. Angle et al. (XENON10), Phys. Rev. Lett. 107, 051301 (2011), [Erratum: Phys. Rev. Lett.110,249901(2013)], arXiv:1104.3088 [astro-ph.CO] .
- Essig et al. [2012b] R. Essig, A. Manalaysay, J. Mardon, P. Sorensen, and T. Volansky, Phys. Rev. Lett. 109, 021301 (2012b), arXiv:1206.2644 [astro-ph.CO] .
- Aprile et al. [2016] E. Aprile et al. (XENON), Phys. Rev. D94, 092001 (2016), [Erratum: Phys. Rev.D95,no.5,059901(2017)], arXiv:1605.06262 [astro-ph.CO] .
- Aguilar-Arevalo et al. [2017] A. Aguilar-Arevalo et al. (DAMIC), Phys. Rev. Lett. 118, 141803 (2017), arXiv:1611.03066 [astro-ph.CO] .
- Essig et al. [2017] R. Essig, T. Volansky, and T.-T. Yu, Phys. Rev. D96, 043017 (2017), arXiv:1703.00910 [hep-ph] .
- Agnese et al. [2018] R. Agnese et al. (SuperCDMS), Phys. Rev. Lett. 121, 051301 (2018), [Erratum: Phys.Rev.Lett. 122, 069901 (2019)], arXiv:1804.10697 [hep-ex] .
- Agnes et al. [2018] P. Agnes et al. (DarkSide), Phys. Rev. Lett. 121, 111303 (2018), arXiv:1802.06998 [astro-ph.CO] .
- Blanco et al. [2020] C. Blanco, J. I. Collar, Y. Kahn, and B. Lillard, Phys. Rev. D 101, 056001 (2020), arXiv:1912.02822 [hep-ph] .
- Aprile et al. [2019a] E. Aprile et al. (XENON), Phys. Rev. Lett. 123, 251801 (2019a), arXiv:1907.11485 [hep-ex] .
- Aguilar-Arevalo et al. [2019a] A. Aguilar-Arevalo et al. (DAMIC), Phys. Rev. Lett. 123, 181802 (2019a), arXiv:1907.12628 [astro-ph.CO] .
- Essig et al. [2020] R. Essig, J. Pradler, M. Sholapurkar, and T.-T. Yu, Phys. Rev. Lett. 124, 021801 (2020), arXiv:1908.10881 [hep-ph] .
- Aprile et al. [2019b] E. Aprile et al. (XENON), Phys. Rev. Lett. 123, 241803 (2019b), arXiv:1907.12771 [hep-ex] .
- Aguilar-Arevalo et al. [2019b] A. Aguilar-Arevalo et al. (DAMIC), Phys. Rev. Lett. 123, 181802 (2019b), arXiv:1907.12628 [astro-ph.CO] .
- Amaral et al. [2020] D. W. Amaral et al. (SuperCDMS), Phys. Rev. D 102, 091101 (2020), arXiv:2005.14067 [hep-ex] .
- Arnaud et al. [2020] Q. Arnaud et al. (EDELWEISS), Phys. Rev. Lett. 125, 141301 (2020), arXiv:2003.01046 [astro-ph.GA] .
- Aprile et al. [2022] E. Aprile et al. (XENON), Phys. Rev. D 106, 022001 (2022), arXiv:2112.12116 [hep-ex] .
- Cheng et al. [2021] C. Cheng et al. (PandaX-II), Phys. Rev. Lett. 126, 211803 (2021), arXiv:2101.07479 [hep-ex] .
- Al-Bakry et al. [2022] M. Al-Bakry et al. (SuperCDMS), (2022), arXiv:2203.02594 [hep-ex] .
- Armengaud et al. [2022] E. Armengaud et al. (EDELWEISS), Phys. Rev. D 106, 062004 (2022), arXiv:2203.03993 [astro-ph.GA] .
- Arnquist et al. [2023] I. Arnquist et al. (DAMIC-M), Phys. Rev. Lett. 130, 171003 (2023), arXiv:2302.02372 [hep-ex] .
- Albakry et al. [2023] M. F. Albakry et al. (SuperCDMS), Phys. Rev. D 107, 112013 (2023), arXiv:2302.09115 [hep-ex] .
- Moroni et al. [2022] G. F. Moroni, F. Chierchie, J. Tiffenberg, A. Botti, M. Cababie, G. Cancelo, E. L. Depaoli, J. Estrada, S. E. Holland, D. Rodrigues, I. Sidelnik, M. S. Haro, L. Stefanazzi, and S. Uemura, Phys. Rev. Appl. 17, 044050 (2022).
- Botti et al. [2022] A. M. Botti, S. Uemura, G. F. Moroni, L. Barak, M. Cababie, R. Essig, E. Etzion, D. Rodrigues, N. Saffold, M. Sofo Haro, J. Tiffenberg, and T. Volansky, Phys. Rev. D 106, 072005 (2022).
- Holland et al. [2007] S. Holland, C. Bebek, P. Daniels, K. Dawson, J. Emes, D. Groom, S. Jelinksy, A. Karcher, W. Kolbe, N. Palaio, C. Tran, N. Roe, and G. Wang, in 2007 IEEE Nuclear Science Symposium Conference Record, Vol. 3 (2007) pp. 2220–2225.
- Amole et al. [2015] C. Amole, M. Ardid, D. M. Asner, D. Baxter, E. Behnke, P. Bhattacharjee, H. Borsodi, M. Bou-Cabo, S. J. Brice, D. Broemmelsiek, K. Clark, J. I. Collar, P. S. Cooper, M. Crisler, C. E. Dahl, S. Daley, M. Das, F. Debris, N. Dhungana, J. Farine, I. Felis, R. Filgas, M. Fines-Neuschild, F. Girard, G. Giroux, M. Hai, J. Hall, O. Harris, C. M. Jackson, M. Jin, C. B. Krauss, M. Lafrenière, M. Laurin, I. Lawson, I. Levine, W. H. Lippincott, E. Mann, J. P. Martin, D. Maurya, P. Mitra, R. Neilson, A. J. Noble, A. Plante, R. B. Podviianiuk, S. Priya, A. E. Robinson, M. Ruschman, O. Scallon, S. Seth, A. Sonnenschein, N. Starinski, I. Štekl, E. Vázquez-Jáuregui, J. Wells, U. Wichoski, V. Zacek, and J. Zhang (PICO Collaboration), Phys. Rev. Lett. 114, 231302 (2015).
- Cancelo et al. [2021] G. I. Cancelo et al., J. Astron. Telesc. Instrum. Syst. 7, 015001 (2021), arXiv:2004.07599 [astro-ph.IM] .
- Barak et al. [2022] L. Barak, I. M. Bloch, A. Botti, M. Cababie, G. Cancelo, L. Chaplinsky, F. Chierchie, M. Crisler, A. Drlica-Wagner, R. Essig, J. Estrada, E. Etzion, G. Fernandez Moroni, D. Gift, S. E. Holland, S. Munagavalasa, A. Orly, D. Rodrigues, A. Singal, M. S. Haro, L. Stefanazzi, J. Tiffenberg, S. Uemura, T. Volansky, and T.-T. Yu (SENSEI Collaboration), Phys. Rev. Appl. 17, 014022 (2022).
- Janesick [2001] J. R. Janesick, Scientific Charge-Coupled Devices, Vol. 83 (SPIE Press, 2001).
- Holland et al. [2003] S. Holland, D. Groom, N. Palaio, R. Stover, and M. Wei, IEEE Transactions on Electron Devices 50, 225 (2003).
- Haro et al. [2020] M. S. Haro, G. Fernandez Moroni, and J. Tiffenberg, IEEE Transactions on Electron Devices 67, 1993 (2020).
- Cababie [2023] M. Cababie, “Origin and characterization of single-electron events in skipper-ccds for light dark matter searches,” (2023), PhD dissertation, arXiv:2309.10458 [hep-ex] .
- Essig et al. [2016] R. Essig, M. Fernandez-Serra, J. Mardon, A. Soto, T. Volansky, and T.-T. Yu, JHEP 05, 046 (2016), arXiv:1509.01598 [hep-ph] .
- Chu et al. [2012] X. Chu, T. Hambye, and M. H. G. Tytgat, JCAP 1205, 034 (2012), arXiv:1112.0493 [hep-ph] .
- Dvorkin et al. [2019] C. Dvorkin, T. Lin, and K. Schutz, Phys. Rev. D99, 115009 (2019), arXiv:1902.08623 [hep-ph] .
- [49] T. Emken, R. Essig, and H. Xu, to appear .
- Agnes et al. [2023a] P. Agnes et al. (DarkSide), Phys. Rev. Lett. 130, 101002 (2023a), arXiv:2207.11968 [hep-ex] .
- Boehm and Fayet [2004] C. Boehm and P. Fayet, Nucl. Phys. B683, 219 (2004), arXiv:hep-ph/0305261 [hep-ph] .
- Lin et al. [2012] T. Lin, H.-B. Yu, and K. M. Zurek, Phys.Rev. D85, 063503 (2012), arXiv:1111.0293 [hep-ph] .
- Hochberg et al. [2014] Y. Hochberg, E. Kuflik, T. Volansky, and J. G. Wacker, Phys. Rev. Lett. 113, 171301 (2014), arXiv:1402.5143 [hep-ph] .
- Kuflik et al. [2017] E. Kuflik, M. Perelstein, N. R.-L. Lorier, and Y.-D. Tsai, JHEP 08, 078 (2017), arXiv:1706.05381 [hep-ph] .
- D’Agnolo et al. [2020] R. T. D’Agnolo, D. Pappadopulo, J. T. Ruderman, and P.-J. Wang, Phys. Rev. Lett. 124, 151801 (2020), arXiv:1906.09269 [hep-ph] .
- Berghaus et al. [2023] K. V. Berghaus, A. Esposito, R. Essig, and M. Sholapurkar, JHEP 01, 023 (2023), arXiv:2210.06490 [hep-ph] .
- Agnes et al. [2023b] P. Agnes et al. (DarkSide), Phys. Rev. Lett. 130, 101001 (2023b), arXiv:2207.11967 [hep-ex] .
- Alkhatib et al. [2021] I. Alkhatib et al. (SuperCDMS), Phys. Rev. Lett. 127, 061801 (2021), arXiv:2007.14289 [hep-ex] .
- Abdelhameed et al. [2019] A. Abdelhameed et al. (CRESST), Phys. Rev. D 100, 102002 (2019), arXiv:1904.00498 [astro-ph.CO] .
- An et al. [2013] H. An, M. Pospelov, and J. Pradler, Phys. Lett. B 725, 190 (2013), arXiv:1302.3884 [hep-ph] .
- Redondo and Raffelt [2013] J. Redondo and G. Raffelt, JCAP 08, 034 (2013), arXiv:1305.2920 [hep-ph] .
- Huang et al. [2023] D. Huang et al. (PandaX), Phys. Rev. Lett. 131, 191002 (2023), arXiv:2308.01540 [hep-ex] .
- Norcini et al. [2022] D. Norcini et al. (DAMIC-M), Phys. Rev. D 106, 092001 (2022), arXiv:2207.00809 [physics.ins-det] .
- Essig et al. [2023] R. Essig, Y. Hochberg, Y. Shoji, A. Singal, and G. Suczewski, (2023), arXiv:2310.02316 [hep-ph] .
- Aguilar-Arevalo et al. [2022] A. Aguilar-Arevalo, D. Amidei, I. Arnquist, D. Baxter, G. Cancelo, B. A. C. Vergara, A. E. Chavarria, N. Corso, E. Darragh-Ford, M. L. Di Vacri, J. C. D’Olivo, J. Estrada, F. Favela-Perez, R. Gaïor, Y. Guardincerri, T. W. Hossbach, B. Kilminster, I. Lawson, S. J. Lee, A. Letessier-Selvon, A. Matalon, P. Mitra, A. Piers, P. Privitera, K. Ramanathan, J. Da Rocha, M. Settimo, R. Smida, R. Thomas, J. Tiffenberg, D. T. Machado, M. Traina, R. Vilar, and A. L. Virto (DAMIC Collaboration), Phys. Rev. D 105, 062003 (2022).
- An et al. [2018] H. An, M. Pospelov, J. Pradler, and A. Ritz, Phys. Rev. Lett. 120, 141801 (2018), [Erratum: Phys.Rev.Lett. 121, 259903 (2018)], arXiv:1708.03642 [hep-ph] .
- Emken et al. [2018] T. Emken, C. Kouvaris, and N. G. Nielsen, Phys. Rev. D 97, 063007 (2018), arXiv:1709.06573 [hep-ph] .
- Emken [2019] T. Emken, (2019), arXiv:1906.07541 [hep-ph] .
- Emken [2022] T. Emken, Phys. Rev. D 105, 063020 (2022), arXiv:2102.12483 [hep-ph] .
- An et al. [2021] H. An, H. Nie, M. Pospelov, J. Pradler, and A. Ritz, Phys. Rev. D 104, 103026 (2021), arXiv:2108.10332 [hep-ph] .
- Cowan et al. [2011] G. Cowan, K. Cranmer, E. Gross, and O. Vitells, Eur. Phys. J. C 71, 1554 (2011), [Erratum: Eur.Phys.J.C 73, 2501 (2013)], arXiv:1007.1727 [physics.data-an] .
- [72] “QEDark,” https://github.com/tientienyu/QEdark.
- Knapen et al. [2022] S. Knapen, J. Kozaczuk, and T. Lin, Phys. Rev. D 105, 015014 (2022), arXiv:2104.12786 [hep-ph] .
- Griffin et al. [2021] S. M. Griffin, K. Inzani, T. Trickle, Z. Zhang, and K. M. Zurek, Phys. Rev. D 104, 095015 (2021), arXiv:2105.05253 [hep-ph] .
- Trickle [2023] T. Trickle, Phys. Rev. D 107, 035035 (2023), arXiv:2210.14917 [hep-ph] .
- Dreyer et al. [2023] C. E. Dreyer, R. Essig, M. Fernandez-Serra, A. Singal, and C. Zhen, (2023), arXiv:2306.14944 [hep-ph] .
- [77] “QCDark,” https://github.com/asingal14/QCDark.
- Knapen et al. [2021] S. Knapen, J. Kozaczuk, and T. Lin, Phys. Rev. Lett. 127, 081805 (2021), arXiv:2011.09496 [hep-ph] .
- Henke et al. [1993] B. Henke, E. Gullikson, and J. Davis, Atomic Data and Nuclear Data Tables 54, 181 (1993).
- EDWARDS [1985] D. F. EDWARDS, in Handbook of Optical Constants of Solids, edited by E. D. PALIK (Academic Press, Boston, 1985) pp. 547 – 569.
- Emken [2021] T. Emken, (2021), DOI:10.5281/zenodo.5957388.
- [82] R. Essig, R. Plestid, and A. Singal, to appear .
- Baxter et al. [2021] D. Baxter et al., Eur. Phys. J. C 81, 907 (2021), arXiv:2105.00599 [hep-ex] .
- Ramanathan and Kurinsky [2020] K. Ramanathan and N. Kurinsky, Physical Review D 102 (2020), 10.1103/physrevd.102.063026.
- Feldman and Cousins [1998] G. J. Feldman and R. D. Cousins, Physical Review D 57, 3873 (1998).
- Du et al. [2022] P. Du, D. Egana-Ugrinovic, R. Essig, and M. Sholapurkar, Phys. Rev. X 12, 011009 (2022).
- Du et al. [2023] P. Du, D. Egaña Ugrinovic, R. Essig, and M. Sholapurkar, (2023), arXiv:2310.03068 [hep-ph] .