JWST Reveals a Surprisingly High Fraction of Galaxies Being Spiral-like at
Abstract
Spiral arms are one of the most important features used to classify the morphology of local galaxies. The cosmic epoch when spiral arms first appeared contains essential clues to their formation mechanisms as well as the overall galaxy evolution. In this letter, we used James Webb Space Telescope (JWST) images from the Cosmic Evolution Early Release Science Survey to visually identify spiral galaxies with redshift and stellar mass . Out of 873 galaxies, 216 were found to have a spiral structure. The spiral galaxies in our sample have higher star formation rates (SFRs) and larger sizes than non-spiral galaxies. We found the observed spiral fraction decreases from 48% to 8% at . These fractions are higher than the fractions observed with the Hubble Space Telescope (HST). We even detect possible spiral-like features at redshifts . We artificially redshifted low redshift galaxies to high redshifts and re-inspected them to evaluate observational effects. By varying the input spiral fraction of the redshifted sample, we found that the input fraction of % matches the observed fraction at the best. We are able to rule out spiral fractions being % (3) for real galaxies at . This fraction is surprisingly high and implies that the formation of spiral arms, as well as disks, was earlier in the universe.
1 Introduction
Spiral structures are present in a majority of the galaxies that we see at low redshift (Sellwood & Masters, 2022) and are the hubs of star formation (e.g., Delgado-Serrano, R. et al., 2010; Elmegreen, 2011; Grosbøl & Dottori, 2012). Understanding how and when spiral galaxies first existed in the universe has been a popular topic since their first discovery. The arms of spiral galaxies can range from grand design (having well-defined arms) to multi-arms to flocculent (patchy and discontinuous arms). Different types of spiral arms are believed to have different formation histories (Elmegreen, 1990).
Grand design spirals are explained by the density wave theory (Lin & Shu, 1964). The theory states that the spiral arms are density waves that travel through the disk. These waves trigger star formation that clumps along the waves. Another theory is the formation of arms through gravitational instabilities as the result of swing amplification, which can produce grand design and flocculent galaxies (Goldreich & Lynden-Bell, 1965; Julian & Toomre, 1966). Other methods of spiral formation include tidal effects from interactions with another galaxy (Byrd & Howard, 1992) or bar instabilities (Kormendy & Norman, 1979; Dobbs et al., 2010).
It is not quite clear what impact spiral arms have an on star formation. Hart et al. (2017) found that the number of arms has little impact on the star formation rate, but Porter-Temple et al. (2022) found that galaxies with more spiral arms tend to have higher star formation rates. Although spiral galaxies are well established by , when they first appeared in the universe is still uncertain (Conselice et al., 2005; Elmegreen & Elmegreen, 2013). Studies have shown that galaxies around redshift have similar morphologies to galaxies at low redshifts and fit into the Hubble Sequence, but as redshift increases, galaxies tend to appear more irregular and clumpy (e.g., Elmegreen & Elmegreen, 2005; Elmegreen et al., 2009; Guo et al., 2012, 2015, 2018; Martin et al., 2023).
Margalef-Bentabol et al. (2022) inspected the spiral fraction at high redshifts using HST imaging and found, after taking into account redshift effects, a spiral fraction of % at . However, the reddest HST filter, F160W, is only able to probe the rest-frame visible light up to . HST does not have the spatial resolution to resolve high redshift objects and the number of disk galaxies falls rapidly up to (Margalef-Bentabol et al., 2016). Indeed, at redshifts higher than , spiral galaxies were thought to be sparse and very few have been found at with HST (e.g., Law et al., 2012).
JWST is able to provide high sensitivity and resolution in the infrared and can probe rest frame visible light up to . Already JWST has been making progress in updating our knowledge of the Hubble sequence in the early universe. Recent studies using JWST have shown that disk galaxies are prevalent up to redshifts of (Ferreira et al., 2022, 2023; Kartaltepe et al., 2023). Disk galaxies tend to have spiral arms in the Local Universe and JWST’s improved sensitivity compared to HST can possibly detect spiral structures in high redshifted disk galaxies that HST was unable to provide. A few spiral galaxies were recently found at redshifts of (Huang et al., 2023) and (Wu et al., 2023) with the Atacama Large Millimeter/submillimeter Array (ALMA) and JWST.
In this letter, we explore the spiral fraction (the ratio of the number of spiral galaxies to the total number of galaxies in a redshift bin) up to . We use JWST images to visually inspect spiral galaxies. We calculate the observed spiral fraction as well as correct for observational effects to derive an intrinsic spiral fraction. Throughout this letter we assume , , and km s-1 Mpc-1. AB magnitudes and a Chabrier initial mass function (IMF) are used throughout.
2 Data and Sample
We used the NIRCam imaging data of the Cosmic Evolution Early Release Science (CEERS) Survey (Finkelstein et al., 2023). CEERS covered 100 square arcmin. of the Extended Groth Strip (EGS) during Cycle 1. The data was taken in ten separate pointings with seven filters: F115W, F150W, F200W, F277W, F356W, F410M, and F444W. We used images from the publicly released data from all ten pointings111https://ceers.github.io. A description of the reduction and data release can be found in Bagley et al. (2023) and Finkelstein et al. (2023), respectively.
Our sample of galaxies was selected from the footprint of CEERS NIRCam pointings and have been previously analyzed in the EGS catalog (Stefanon et al., 2017) from the Cosmic Assembly Near-IR Deep Extragalactic Legacy Survey (CANDELS) (Grogin et al., 2011; Koekemoer et al., 2011). This catalog includes photometric redshifts and stellar masses calculated through multiple SED-fitting codes and templates described in Dahlen et al. (2013) and Mobasher et al. (2015), respectively. We use the median values from these calculations to construct the bounds of our sample. We excluded objects that fell between the gaps in the images and from the mosaics that overlapped, we chose the best image and discarded the rest. We then chose objects with stellar masses greater than M⊙ and fell within the redshift range . We excluded objects with a CLASS_STAR0.8 to remove likely star candidates. With these parameters, we have a sample of 873 galaxies.
3 Methods
For each galaxy, we made a 100100 pixel () cutout in its rest frame V band, which corresponds to F115W at , F150W at , F200W at , or F277W at . The cutout was displayed as an image with a logarithmic gray scale. All six co-authors of this paper visually inspected each image and voted “yes” or “no” for whether they observed spiral structure.
We utilized two methods of classifying a galaxy as spiral. First, the binary decision classifies spiral galaxies if they have been given a “yes” vote by at least three people (i.e. ). Those with less then three votes are considered non-spirals. Second, the probability decision calculates the likelihood of a galaxy being spiral by taking the ratio of the number of “yes” votes to the number of the total votes. The spiral fraction is calculated for both methods and discussed in Section 4.1.
4 Results
4.1 Observed Spiral Fraction
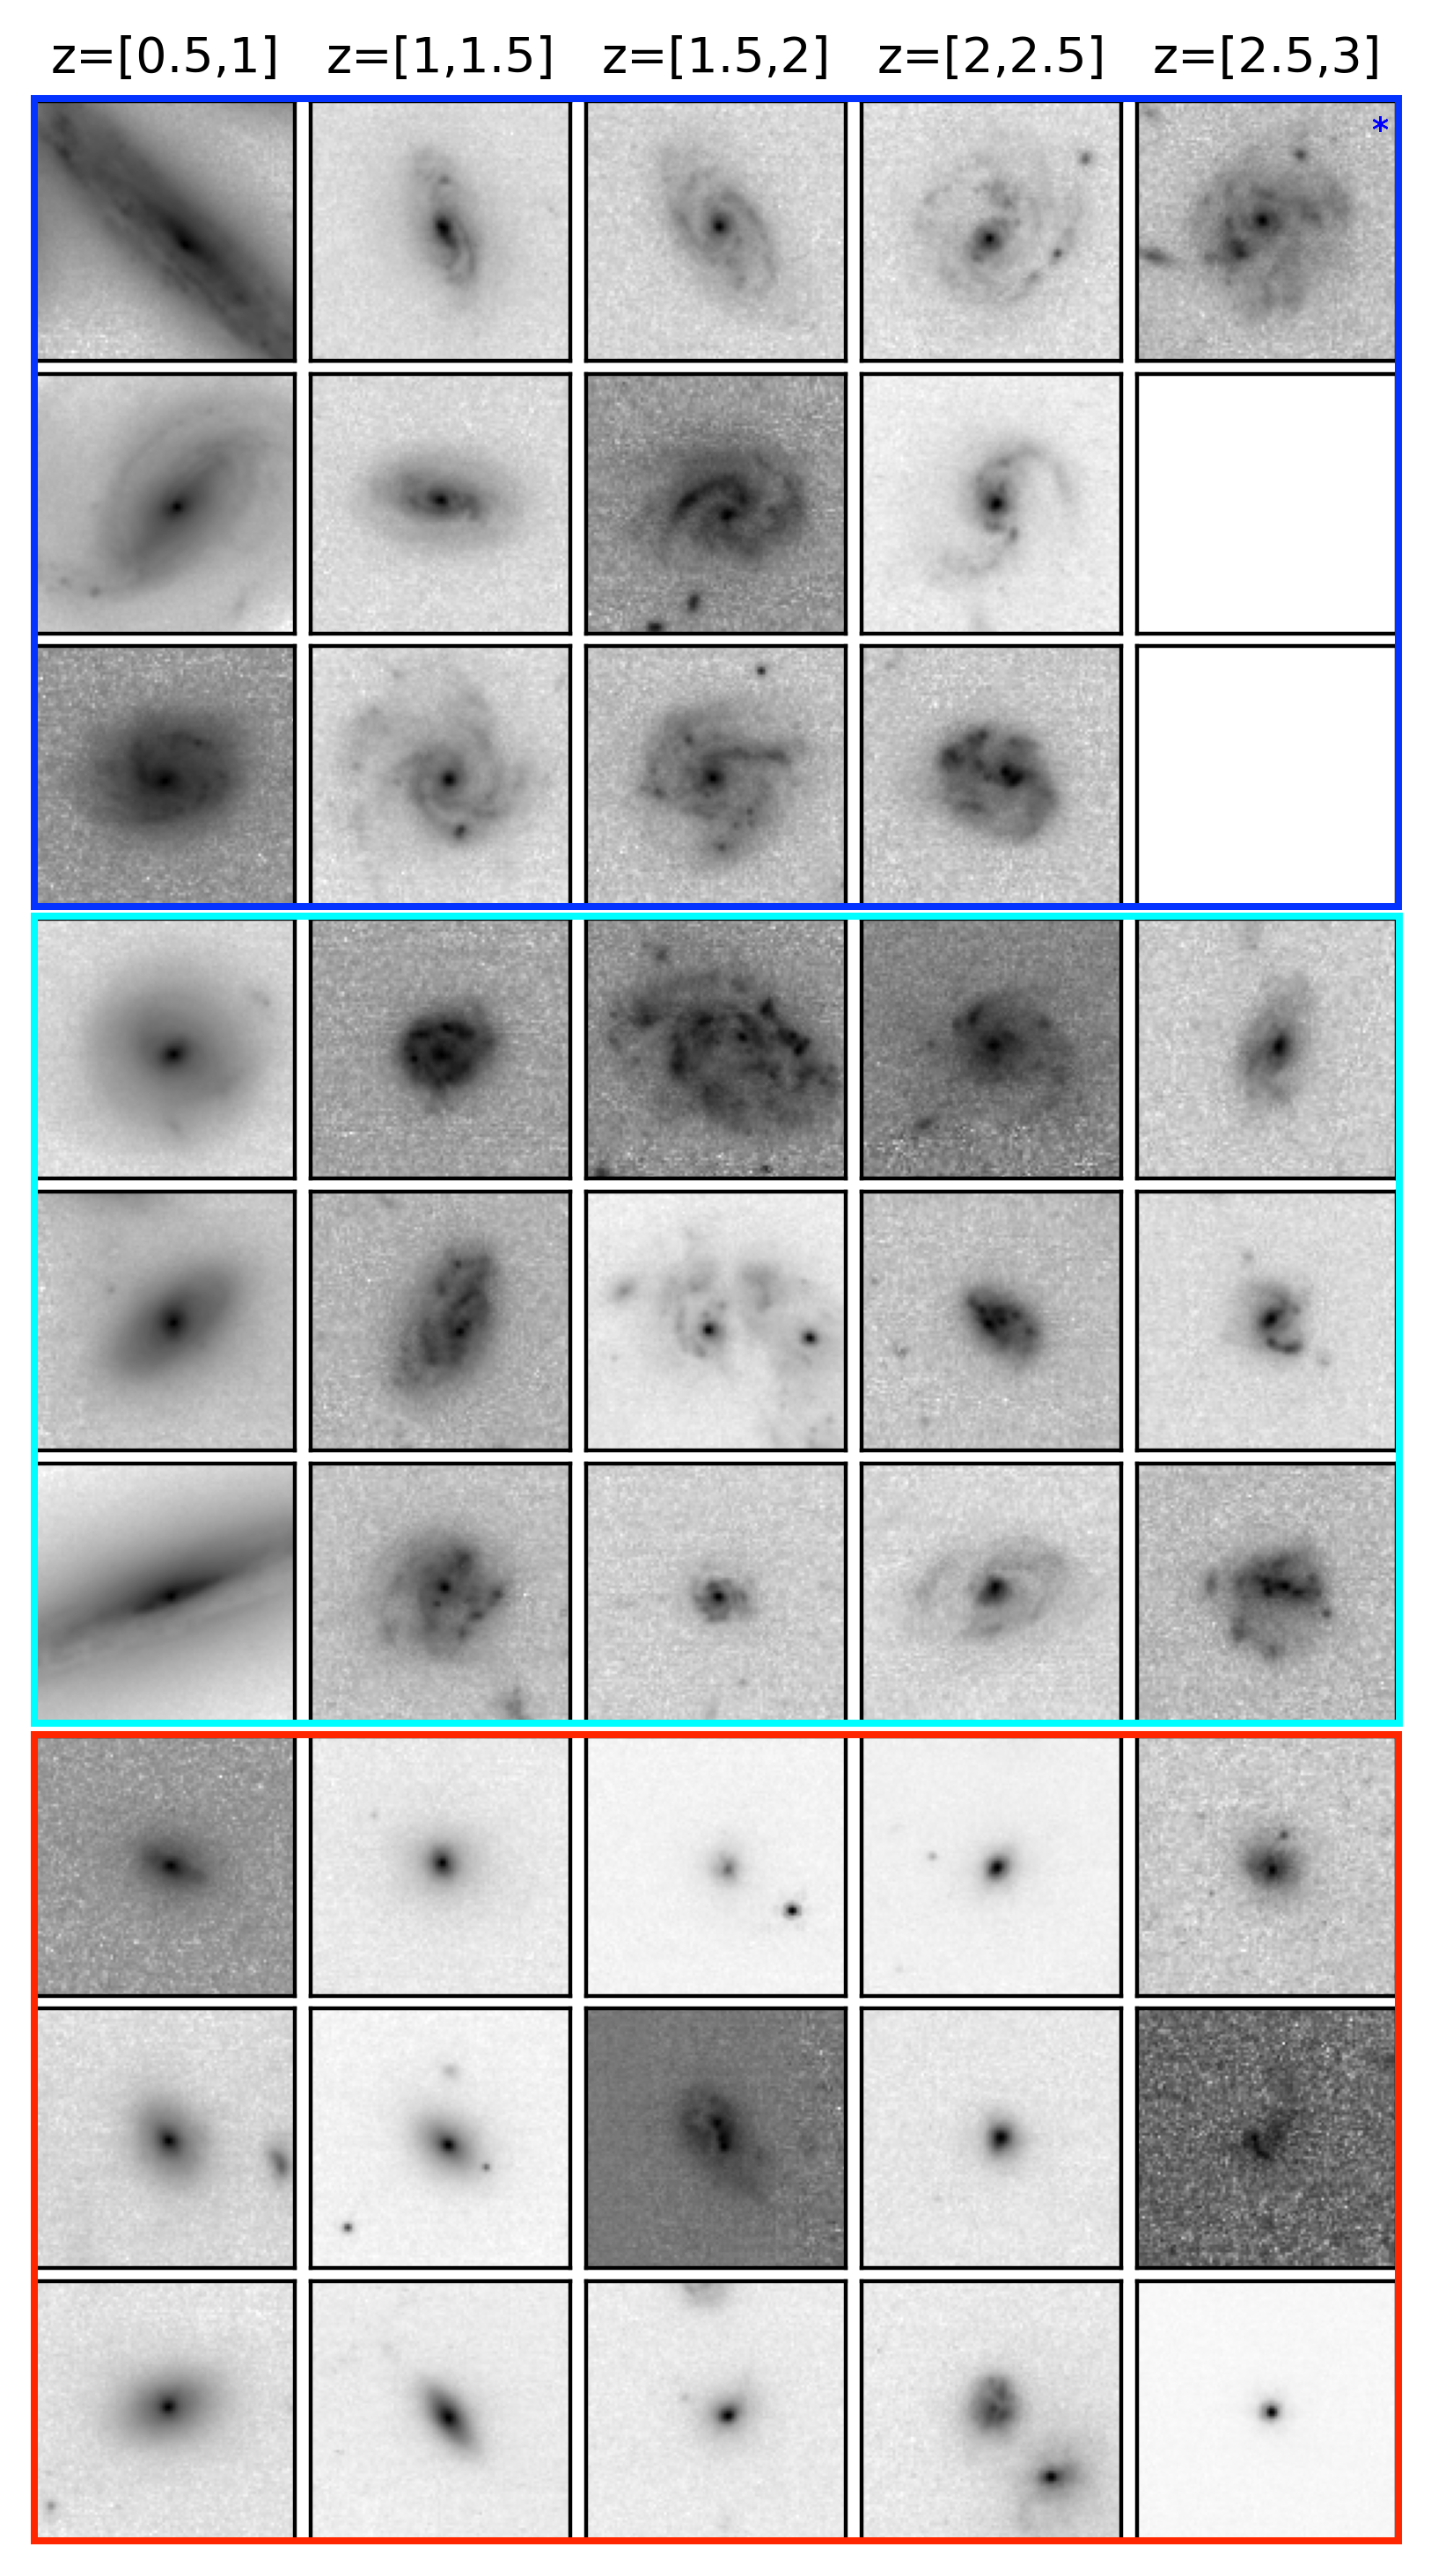
Out of the 873 galaxies in the sample, 216 were classified as spiral using the binary decision with 108 receiving a “yes” vote from all classifiers. In Figure 1, we present a sample of galaxies in our data set. The columns show increasing redshift bins, from left to right, while rows from top to bottom show the range of galaxies classified as spiral to non-spiral. As expected, spiral structure is easier to see at the lower redshift ranges and becomes less pronounced at higher redshifts.
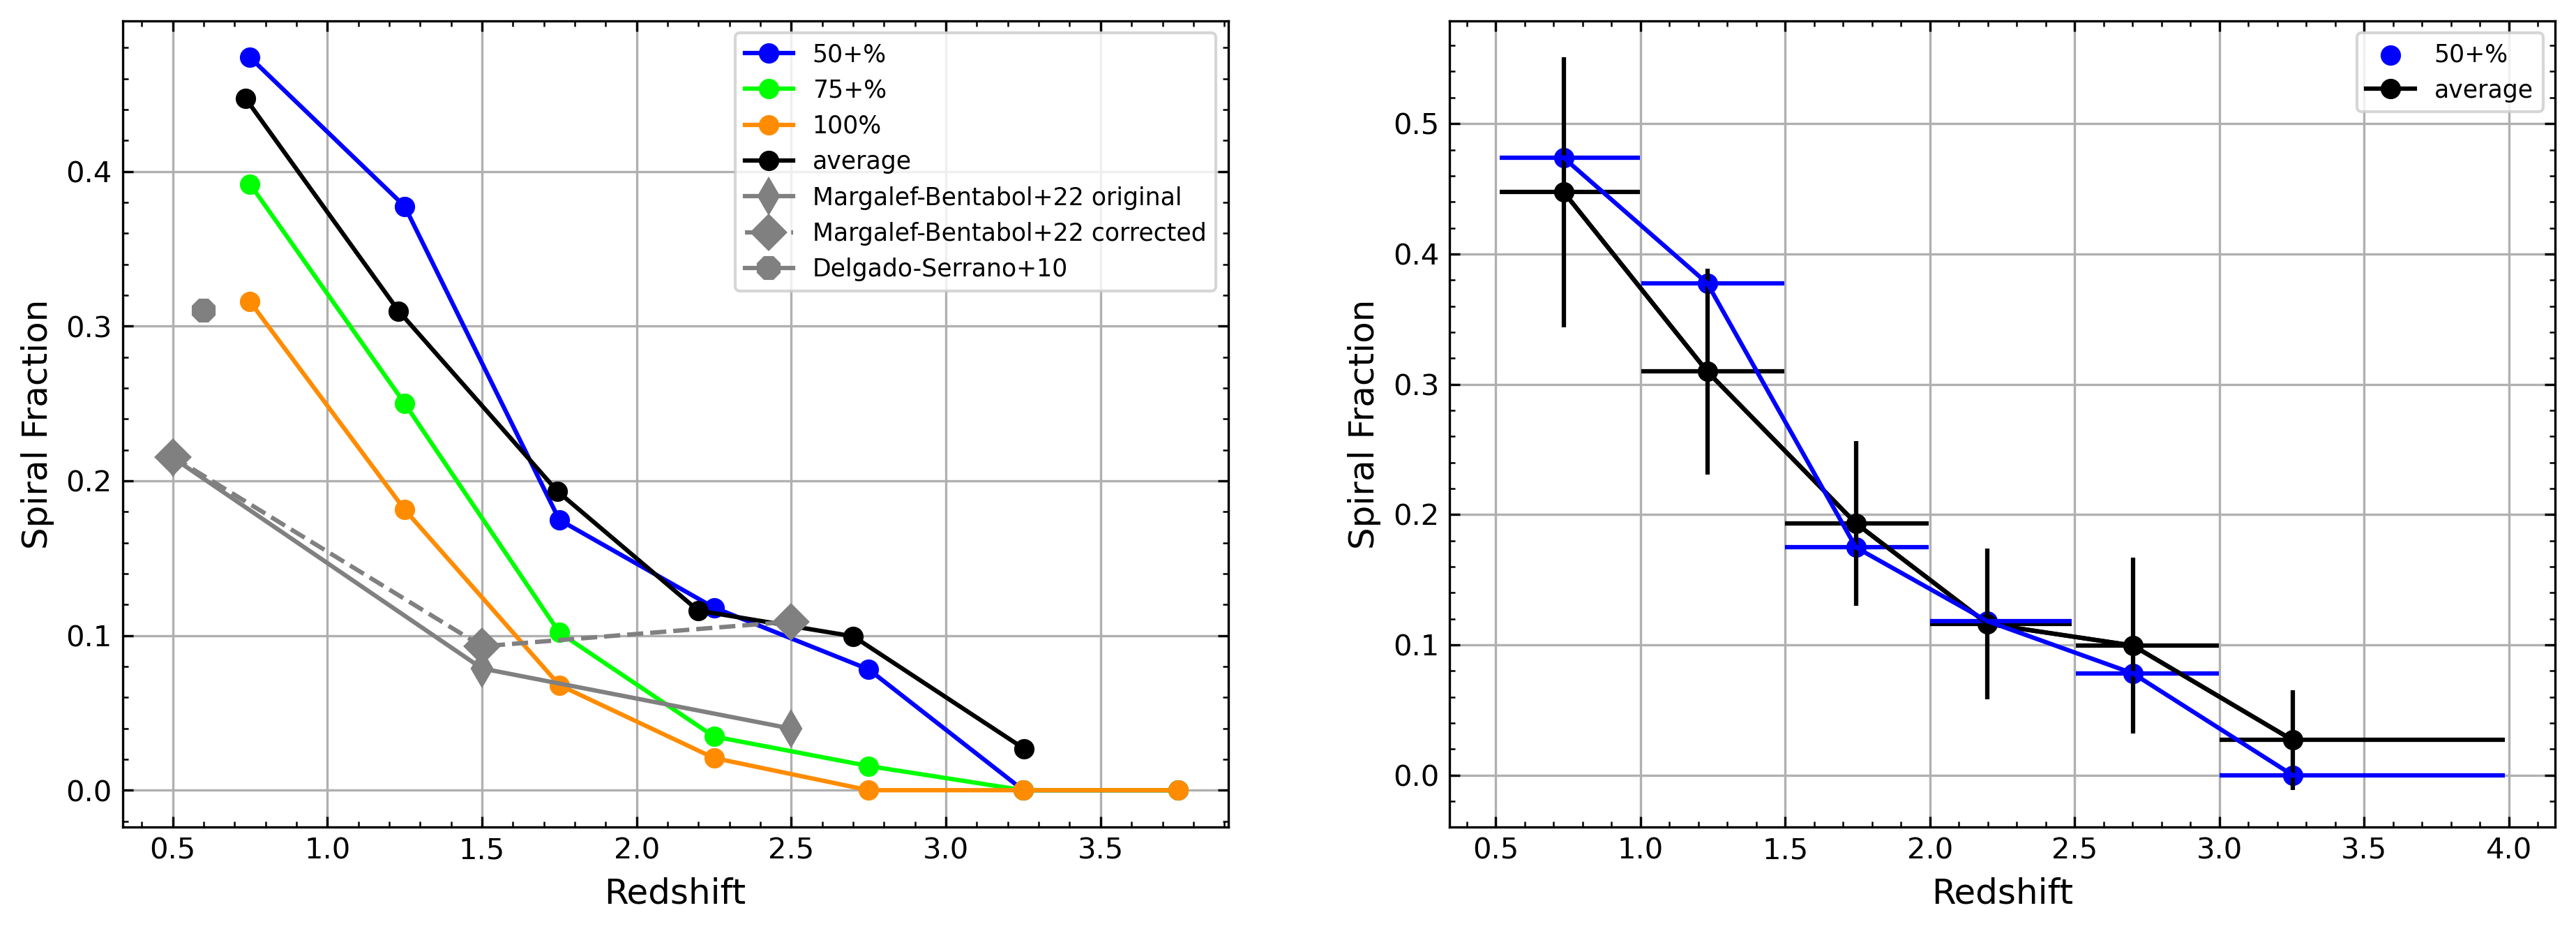
We show the evolution of the spiral fraction as a function of redshift in Figure 2. The binary spiral fraction (blue line), which calculates the fraction of spiral galaxies identified by the binary decision to the total number of galaxies per redshift bin, decreases starting from 48% at to 15% at then finally down to 0% at . We also calculate a stricter binary decision at 75% (5+ “yes” votes, lime line) and 100% (6 “yes” votes, orange line). These results show a lower spiral fraction compared to the 50% binary decision at all redshifts. The probability spiral fraction (black line), which is calculated by calculating the average spiral probability of all galaxies in each redshift bin, is 45% at and dropping to 3% at . These two decisions are consistent with each other (see right panel of Fig. 2). Later, we will choose the decision method that best illustrates our results. Overall, we observe a steep drop in the spiral fraction before .
We compare our results to Margalef-Bentabol et al. (2022). They used data from the fourth release of Galaxy Zoo which showed RGB images from HST in the COSMOS, GOODS-S, and UDS fields. Their selection criteria had classifiers per galaxy and a cutoff of % for spiral galaxies. Our spiral fraction is significantly higher, more than double their spiral+clumpy spiral fraction (thin gray diamonds), at any given redshift below . This result is not surprising given the resolution and sensitivity of HST compared with JWST. When Margalef-Bentabol et al. (2022) took into account the redshift related observational effects of their sample (large gray diamonds), their spiral fraction at is comparable to ours. However, we have not yet corrected for redshift effects.
Delgado-Serrano, R. et al. (2010) conducted a study comparing local galaxies to distant galaxies () and found that about 31% of the distant galaxies are spirals. They defined spiral galaxies by if the bulge was redder than the disk, arms were visually seen and the disk was symmetric, and the bulge-to-total ratio is smaller than 0.5. Their spiral fraction is also lower than our results from both the binary and probability decisions, implying a higher resolution from JWST.
4.2 Star Formation and Size
In Figure 3, we show the SFR and half-light radius as a function of stellar mass in each of our redshift bins. We use the values from Barro et al. (2019) for our SFRs, which were derived from UV luminosities using the relation from Kennicutt (1998) and corrected for dust using the slope of the UV continuum emission to the ratio of the UV to IR luminosities. The majority of our galaxies classified as having a spiral structure (blue circles and cyan triangles) lie above or in the star-forming region (gray line). As redshift increases, more spiral galaxies are seen above the main sequence (black line).
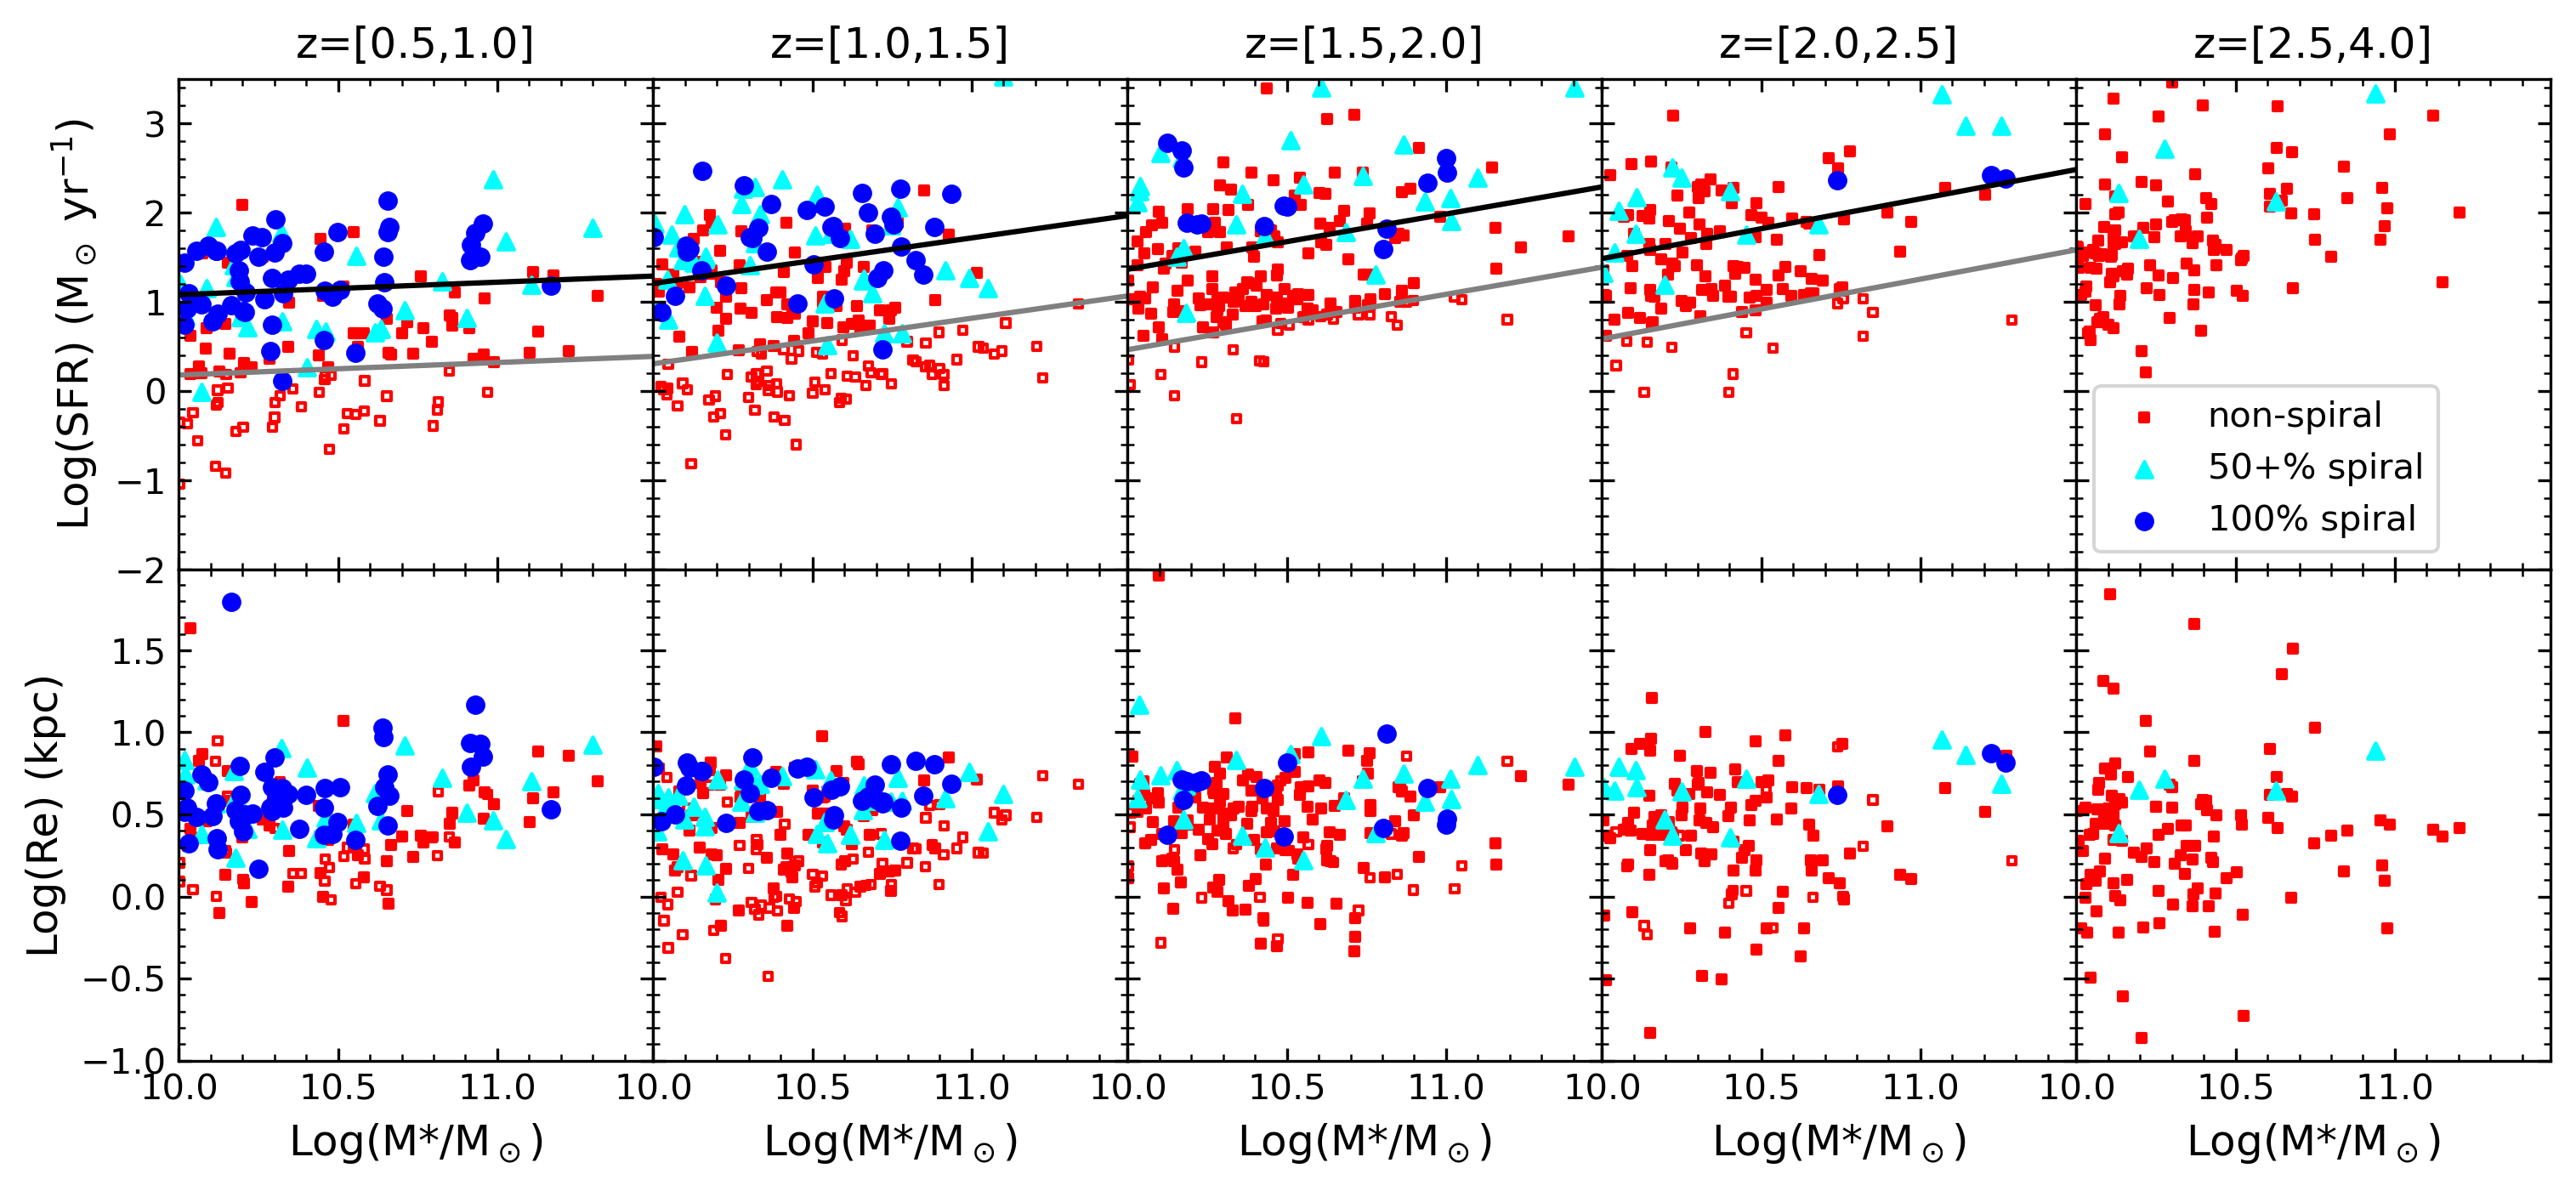
The bottom panel of Fig. 3 shows that spiral galaxies have larger sizes than non-spiral galaxies. We also found there is little change in size, for spiral galaxies, as redshift increases. The lack of changes in size may be due to redshift effects or bandpass effects since we used sizes from HST’s F160W filter (van der Wel et al., 2012).
4.3 Intrinsic Spiral Fraction
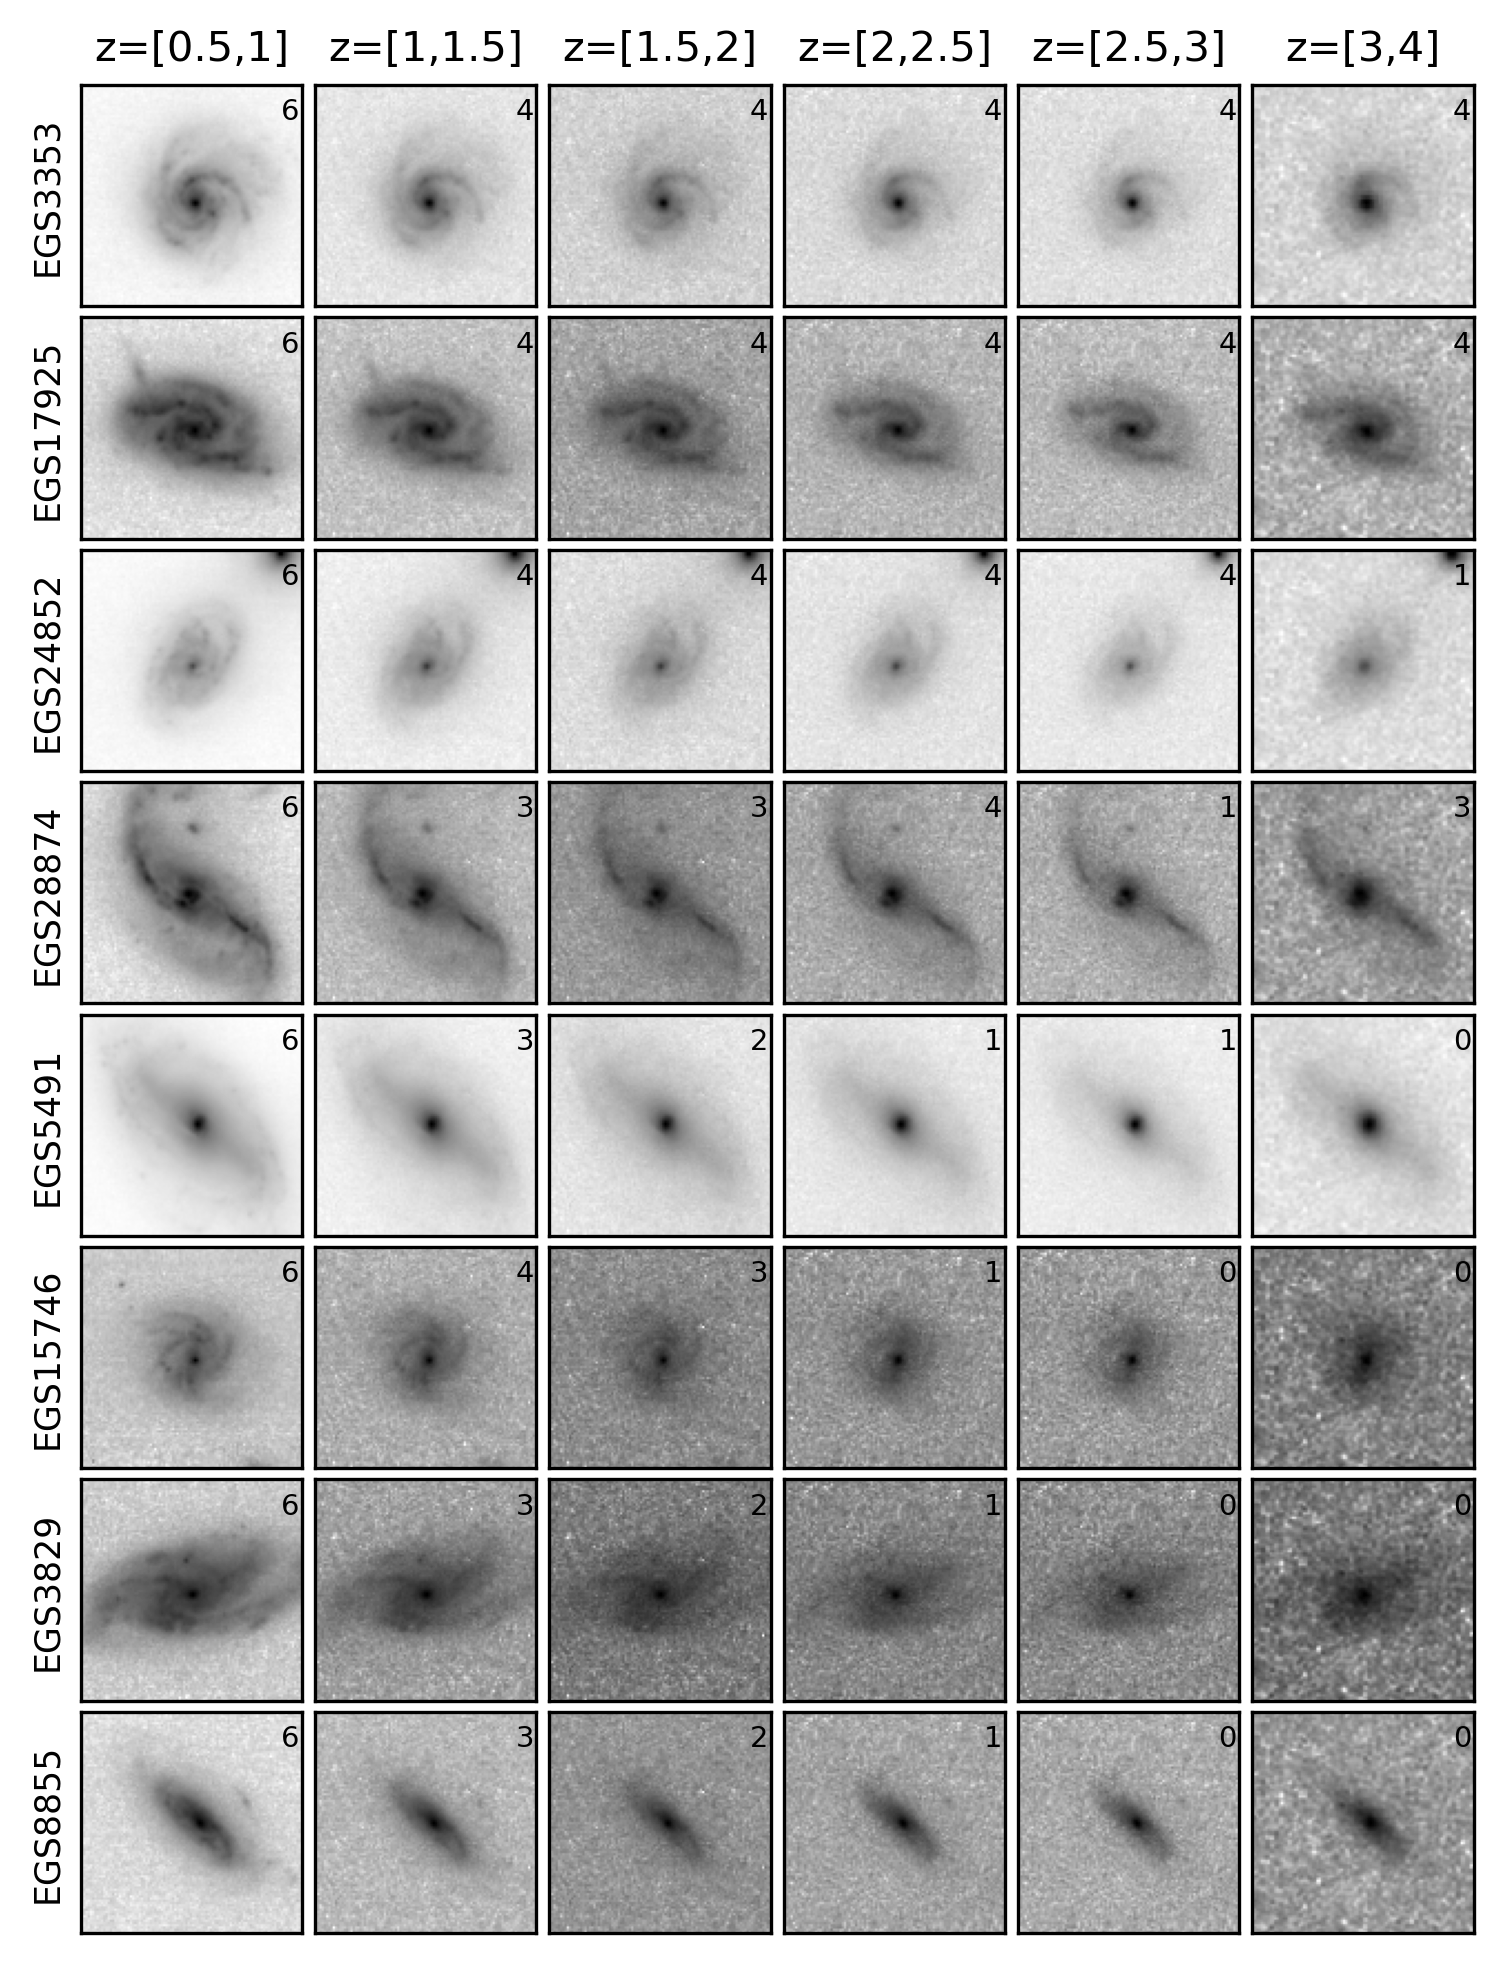
Due to the cosmological dimming and the sensitivity of CEERS observations, spiral galaxies can be hard to identify at high redshifts. This issue causes observed spiral fractions to be lower than the real fraction (see Margalef-Bentabol et al. (2022)). To correct for this issue, we selected a representative sample of galaxies between redshifts 0.5 and 0.8 to artificially shift to higher redshifts. This sample, called the unredshifted sample, contained 101 galaxies and had sizes between and . Next, we took their images in the filter corresponding to their rest frame V-band at different redshifts and scaled them down by taking the ratio of the median flux of the low redshift galaxies to the median flux of the high redshift galaxies. For example, for a galaxy at , to redshift it to , its F150W image would be scaled down by a factor of 7.8. We then found an empty region of space in each of the filters and added the scaled down images to these regions. Four co-authors visually inspected this new redshifted sample.
Figure 4 shows some example galaxies from this sample set in bins of increasing redshift. Top four rows show examples of redshifted spirals that have clear spiral features out to higher redshifts and the bottom four rows show examples of galaxies where the classifiers were unable to observe spiral features at higher redshifts.
To account for the redshift effects, instead of calculating a correction factor to scale up our observed spiral fraction, we used a more “forward modeling” method (left panel of Figure 5). We constructed a sub-sample from the unredshifted sample with various spiral fractions ranging from 100% probability (shown in red) to 20% probability (shown in pink) by removing spiral or non-spiral galaxies. We call these fractions intrinsic fractions. We then calculated the redshifted probability spiral fraction for each sub-sample. The intrinsic spiral fraction that produces a redshifted spiral fraction matching our observed spiral fraction (black circles) would be considered as the true spiral fraction in the universe at that redshift.
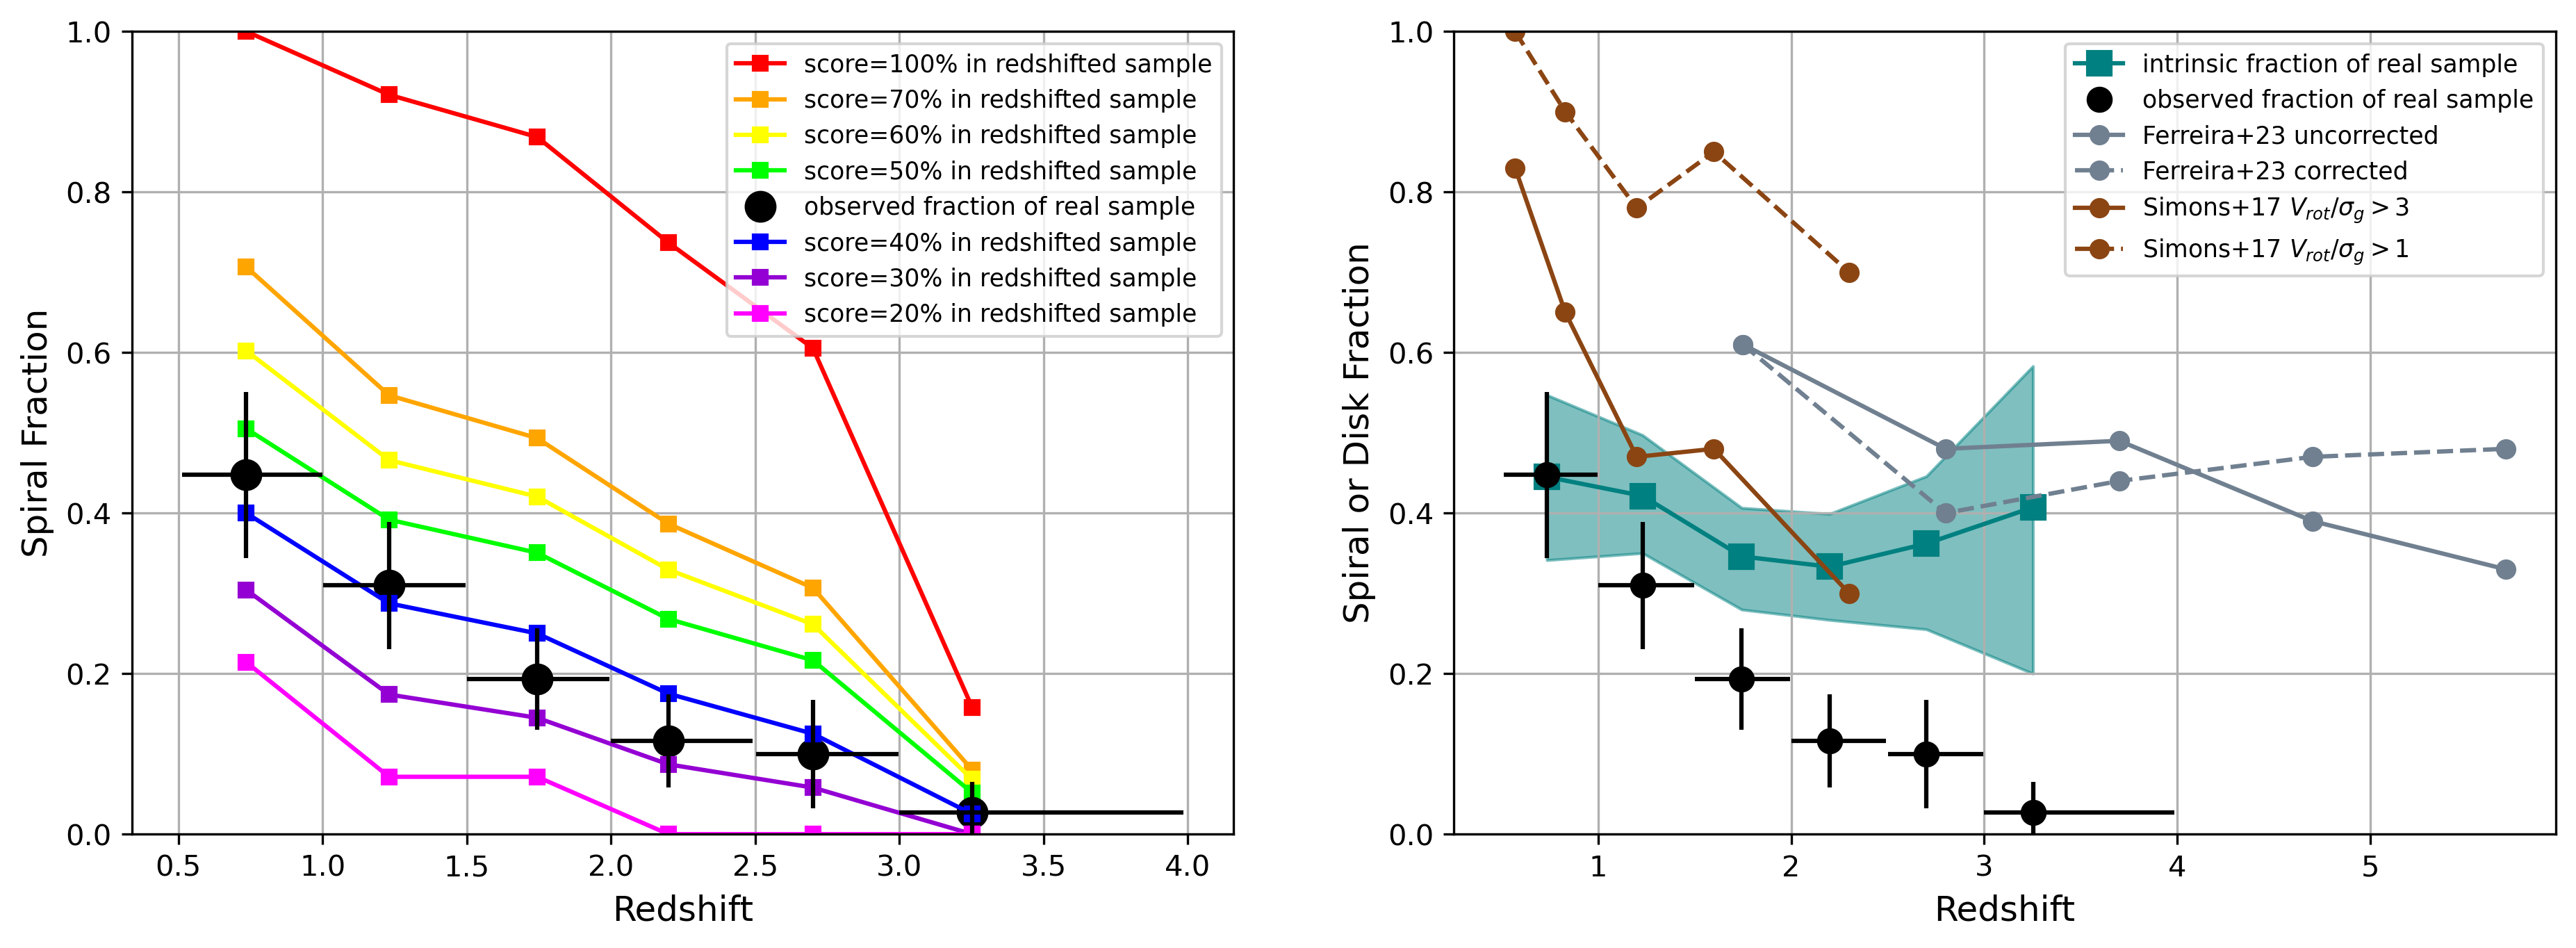
Overall, the intrinsic spiral fraction of 40% (blue line) matches our observed spiral fraction very well, implying a high spiral fraction at high redshifts. The right panel of Figure 5 shows our intrinsic fraction (teal line) of real galaxies which remains mostly flat across redshift. The teal shaded area shows the 3 standard error of the intrinsic fraction. Within 3 of the intrinsic values, the lower limit of spiral fraction is 28% at , 27% at , 26% at , and 20% at . These limits are higher than that previously reported in the literature.
5 Discussion
5.1 Spiral and Disk Formation
Our results of a high spiral fraction at (both the median and the lower limit) indicate an early disk and spiral arm formation in the universe. Recent JWST results on galaxy morphology have found that about 40-50% of galaxies at show a disk morphology (e.g., Ferreira et al., 2022, 2023; Kartaltepe et al., 2023). Some rotating cold gas disks have already been reported up to redshift by JWST and ALMA (e.g., Rizzo et al., 2020; Lelli et al., 2021; Fraternali et al., 2021). Our results, using spiral arms as an indicator of rotating stellar disk, are consistent with this scenario. In the right panel of Figure 5, we compare the disk fraction from Ferreira et al. (2023) (dashed gray line) to our spiral fraction. Both fractions broadly match at , implying that stellar disks, either identified through the overall morphology of galaxies or through the existence of spiral arms, started to dominate a large fraction of galaxies when the age of the universe is around 2 Gyrs ().
To further understand the condition of spiral formation, we also compare our spiral fraction to the fraction of settled gas disks in the right panel of Figure 5. Simons et al. (2017) reported the disk fraction of star-forming galaxies at . They identified disk galaxies as those with the gas rotation velocity-to-velocity dispersion ratio, , were greater than 3 (solid brown line) or 1 (dashed brown line). Our spiral fraction (the teal region) is lower than the fraction of galaxies with , but matches that of galaxies with remarkably well. This agreement implies that both spiral formation and disk settling occurred at the same cosmic time. Putting all above pieces together, our results support such a disk and spiral formation scenario: disk galaxies appear early in the universe () with dynamically hot gaseous disk (, e.g., Nelson et al. (2023)). These disks settled down to dynamically cold () gaseous disks around , and meanwhile dynamically cold stellar disks, indicated by the existence of spiral arms, also started to appear in a high frequency. Interestingly, our spiral fraction matches the gas kinematics measured from nebular emission around star-forming regions (e.g., Simons et al., 2017). Recent ALMA observations on the kinematics of CO and [CII] gas show a constantly high from to (e.g., Lelli et al., 2018; Rizzo et al., 2020; Lelli et al., 2021; Rizzo et al., 2021). These results indicate that spiral formation is governed by cold-warm gas, e.g., gas in both disk and in outflow traced by H or other nebular emission lines, rather than simply the cold gas reservoir traced by CO or [CII].
5.2 Possible Caveats
Our studies have a few possible caveats. First, galaxies in merger or interaction can be misclassified as spiral galaxies, and vice versa. In a late stage of merger, the long tidal tail of the system can be identified as spiral arms. This situation is more severe for galaxies at , as the merger fraction is believed to be higher then (e.g., Duncan et al., 2019). An example is the galaxy on the top right corner of Figure 1, which has both a tail (or an arm) and a disturbed disk. If these systems are indeed mergers rather than disks, they would result in an overestimate of spiral fraction at high redshifts.
To evaluate the impact of mergers, we used the formula of Wen & Zheng (2016) to estimate the fraction of galaxies with long tidal tails in mergers. According to Wen & Zheng (2016), this long tidal tail fraction among star-forming galaxies increases with redshift as to . If we extrapolate their formula to (or ), about 10.2% (or 5.8%) of our sample would be long-tailed merging galaxies. We subtracted from our observed spiral fraction in the left panel of Figure 5 (black circles and error bars) and recalculated the true spiral fraction (teal squares) in the right panel of Figure 5. After this subtraction, the true spiral fraction is almost not changed for , but drops to about 20% at . This new fraction is still high compared to the literature, validating our general results. Moreover, this simple fraction-subtraction method may underestimate the true spiral fraction, because we did not subtract the same effect from our redshifted samples (i.e., the color curves in the left panel of Figure 5). If we did so, the recovered true spiral fraction would be the same as before (i.e., 40% at ), but the uncertainty range would be much larger, because after the subtraction, most redshifted samples have a close-to-zero fraction at so that the observation is not able to distinguish curves of different intrinsic fractions effectively.
The second caveat is not considering the size evolution of galaxies in our redshifted sample in Section 4.3. In fact, we did not find significant apparent size evolution in our sample: the median apparent size is at and at . Some possible reasons of the lack of size evolution could be (1) we used observed F160W to measure size in all redshifts, which is subjected to the bandpass effect and (2) we did not separate star-forming and quiescent galaxies so that our low-redshift median size is lower than that of samples of only star-forming galaxies. If we took into account the redshift evolution, e.g., from van der Wel et al. (2014); Shibuya et al. (2015); Whitney et al. (2019), we should scale down the size of redshifted galaxies by a factor of two from to . The shrunken size would make it even harder to detect spiral arms from the redshifted samples, yielding a lower spiral fraction for them (i.e., moving down the color curves in the left panel of Figure 5). As a result, the real observation (i.e., the black circles) would match the color curves with higher intrinsic spiral fraction, implying the true spiral fraction in the real universe is even higher than what reported in the right panel of Figure 5. This result would instead strengthen our claim of a surprisingly high fraction of spiral galaxies at .
6 Conclusion
We used the JWST CEERS images to visually inspect galaxies up to . We used the binary and probability decision methods to classify spiral galaxies and then calculate the spiral fraction at different redshifts. The observed spiral fraction decreases with increasing redshift, from % at to % at . We found that the spiral galaxies in our sample have higher SFRs as well as sizes compared to non-spiral galaxies. We artificially redshifted low redshift galaxies to high redshifts to account for observational effects in order to recover the true spiral fraction at different redshifts. We found the intrinsic spiral fraction is about % across all redshifts. We were able to set lower limits on the spiral fraction at redshifts 1.75 (28%), 2.25 (27%), 2.75 (26%), and 3.25 (20%). Our results of a high spiral fraction (and its lower limit) at supports the scenario of disk galaxies forming at and settling down to dynamically cold, thin disks by .
In the future, this study can be improved by larger and deeper observations (e.g. PRIMER, COSMOS-Web) to expand our sample for further analysis on the spiral fraction at high redshifts. Moreover, comparisons with simulations can set tighter constraints on the processes that govern formation of spiral features and disk galaxies.
We would like to thank Gregory Rudnick and Haojing Yan for their valuable suggestions. This work is supported by the NASA-Missouri Space Grant Consortium No. 80NSSC20M100 and the University of Missouri Research Council Grant URC-23-036.
References
- Bagley et al. (2023) Bagley, M. B., Finkelstein, S. L., Koekemoer, A. M., et al. 2023, The Astrophysical Journal Letters, 946, L12, doi: 10.3847/2041-8213/acbb08
- Barro et al. (2019) Barro, G., Pérez-González, P. G., Cava, A., et al. 2019, The Astrophysical Journal Supplement Series, 243, 22, doi: 10.3847/1538-4365/ab23f2
- Byrd & Howard (1992) Byrd, G. G., & Howard, S. 1992, AJ, 103, 1089, doi: 10.1086/116128
- Conselice et al. (2005) Conselice, C. J., Blackburne, J. A., & Papovich, C. 2005, The Astrophysical Journal, 620, 564, doi: 10.1086/426102
- Dahlen et al. (2013) Dahlen, T., Mobasher, B., Faber, S. M., et al. 2013, ApJ, 775, 93, doi: 10.1088/0004-637X/775/2/93
- Delgado-Serrano, R. et al. (2010) Delgado-Serrano, R., Hammer, F., Yang, Y. B., et al. 2010, A&A, 509, A78, doi: 10.1051/0004-6361/200912704
- Dobbs et al. (2010) Dobbs, C. L., Theis, C., Pringle, J. E., & Bate, M. R. 2010, Monthly Notices of the Royal Astronomical Society, 403, 625, doi: 10.1111/j.1365-2966.2009.16161.x
- Duncan et al. (2019) Duncan, K., Conselice, C. J., Mundy, C., et al. 2019, ApJ, 876, 110, doi: 10.3847/1538-4357/ab148a
- Elmegreen (1990) Elmegreen, B. G. 1990, Annals of the New York Academy of Sciences, 596, 40, doi: 10.1111/j.1749-6632.1990.tb27410.x
- Elmegreen (2011) Elmegreen, B. G. 2011, in EAS Publications Series, Vol. 51, EAS Publications Series, ed. C. Charbonnel & T. Montmerle, 19–30, doi: 10.1051/eas/1151002
- Elmegreen & Elmegreen (2005) Elmegreen, B. G., & Elmegreen, D. M. 2005, The Astrophysical Journal, 627, 632, doi: 10.1086/430514
- Elmegreen & Elmegreen (2013) Elmegreen, D. M., & Elmegreen, B. G. 2013, The Astrophysical Journal, 781, 11, doi: 10.1088/0004-637X/781/1/11
- Elmegreen et al. (2009) Elmegreen, D. M., Elmegreen, B. G., Marcus, M. T., et al. 2009, ApJ, 701, 306, doi: 10.1088/0004-637X/701/1/306
- Ferreira et al. (2022) Ferreira, L., Adams, N., Conselice, C. J., et al. 2022, ApJ, 938, L2, doi: 10.3847/2041-8213/ac947c
- Ferreira et al. (2023) Ferreira, L., Conselice, C. J., Sazonova, E., et al. 2023, The Astrophysical Journal, 955, 94, doi: 10.3847/1538-4357/acec76
- Finkelstein et al. (2023) Finkelstein, S. L., Bagley, M. B., Ferguson, H. C., et al. 2023, The Astrophysical Journal Letters, 946, L13, doi: 10.3847/2041-8213/acade4
- Fraternali et al. (2021) Fraternali, F., Karim, A., Magnelli, B., et al. 2021, A&A, 647, A194, doi: 10.1051/0004-6361/202039807
- Goldreich & Lynden-Bell (1965) Goldreich, P., & Lynden-Bell, D. 1965, MNRAS, 130, 125, doi: 10.1093/mnras/130.2.125
- Grogin et al. (2011) Grogin, N. A., Kocevski, D. D., Faber, S. M., et al. 2011, ApJS, 197, 35, doi: 10.1088/0067-0049/197/2/35
- Grosbøl & Dottori (2012) Grosbøl, P., & Dottori, H. 2012, A&A, 542, A39, doi: 10.1051/0004-6361/201118099
- Guo et al. (2012) Guo, Y., Giavalisco, M., Ferguson, H. C., Cassata, P., & Koekemoer, A. M. 2012, ApJ, 757, 120, doi: 10.1088/0004-637X/757/2/120
- Guo et al. (2015) Guo, Y., Ferguson, H. C., Bell, E. F., et al. 2015, ApJ, 800, 39, doi: 10.1088/0004-637X/800/1/39
- Guo et al. (2018) Guo, Y., Rafelski, M., Bell, E. F., et al. 2018, ApJ, 853, 108, doi: 10.3847/1538-4357/aaa018
- Hart et al. (2017) Hart, R. E., Bamford, S. P., Casteels, K. R. V., et al. 2017, Monthly Notices of the Royal Astronomical Society, 468, 1850, doi: 10.1093/mnras/stx581
- Huang et al. (2023) Huang, S., Kawabe, R., Kohno, K., et al. 2023, The Astrophysical Journal Letters, 958, L26, doi: 10.3847/2041-8213/acff63
- Julian & Toomre (1966) Julian, W. H., & Toomre, A. 1966, ApJ, 146, 810, doi: 10.1086/148957
- Kartaltepe et al. (2023) Kartaltepe, J. S., Rose, C., Vanderhoof, B. N., et al. 2023, ApJ, 946, L15, doi: 10.3847/2041-8213/acad01
- Kennicutt (1998) Kennicutt, R. C. 1998, Annual Review of Astronomy and Astrophysics, 36, 189, doi: 10.1146/annurev.astro.36.1.189
- Koekemoer et al. (2011) Koekemoer, A. M., Faber, S. M., Ferguson, H. C., et al. 2011, ApJS, 197, 36, doi: 10.1088/0067-0049/197/2/36
- Kormendy & Norman (1979) Kormendy, J., & Norman, C. A. 1979, ApJ, 233, 539, doi: 10.1086/157414
- Law et al. (2012) Law, D. R., Shapley, A. E., Steidel, C. C., et al. 2012, Nature, 487, 338, doi: 10.1038/nature11256
- Lelli et al. (2018) Lelli, F., De Breuck, C., Falkendal, T., et al. 2018, MNRAS, 479, 5440, doi: 10.1093/mnras/sty1795
- Lelli et al. (2021) Lelli, F., Di Teodoro, E. M., Fraternali, F., et al. 2021, Science, 371, 713, doi: 10.1126/science.abc1893
- Lin & Shu (1964) Lin, C. C., & Shu, F. H. 1964, ApJ, 140, 646, doi: 10.1086/147955
- Margalef-Bentabol et al. (2022) Margalef-Bentabol, B., Conselice, C. J., Haeussler, B., et al. 2022, Monthly Notices of the Royal Astronomical Society, 511, 1502, doi: 10.1093/mnras/stac080
- Margalef-Bentabol et al. (2016) Margalef-Bentabol, B., Conselice, C. J., Mortlock, A., et al. 2016, MNRAS, 461, 2728, doi: 10.1093/mnras/stw1451
- Martin et al. (2023) Martin, A., Guo, Y., Wang, X., et al. 2023, ApJ, 955, 106, doi: 10.3847/1538-4357/aced3e
- Mobasher et al. (2015) Mobasher, B., Dahlen, T., Ferguson, H. C., et al. 2015, ApJ, 808, 101, doi: 10.1088/0004-637X/808/1/101
- Nelson et al. (2023) Nelson, E. J., Brammer, G., Gimenez-Arteaga, C., et al. 2023, arXiv e-prints, arXiv:2310.06887, doi: 10.48550/arXiv.2310.06887
- Porter-Temple et al. (2022) Porter-Temple, R., Holwerda, B. W., Hopkins, A. M., et al. 2022, Monthly Notices of the Royal Astronomical Society, 515, 3875, doi: 10.1093/mnras/stac1936
- Rizzo et al. (2021) Rizzo, F., Vegetti, S., Fraternali, F., Stacey, H. R., & Powell, D. 2021, MNRAS, 507, 3952, doi: 10.1093/mnras/stab2295
- Rizzo et al. (2020) Rizzo, F., Vegetti, S., Powell, D., et al. 2020, Nature, 584, 201, doi: 10.1038/s41586-020-2572-6
- Sellwood & Masters (2022) Sellwood, J., & Masters, K. L. 2022, Annual Review of Astronomy and Astrophysics, 60, 73, doi: 10.1146/annurev-astro-052920-104505
- Shibuya et al. (2015) Shibuya, T., Ouchi, M., & Harikane, Y. 2015, ApJS, 219, 15, doi: 10.1088/0067-0049/219/2/15
- Simons et al. (2017) Simons, R. C., Kassin, S. A., Weiner, B. J., et al. 2017, ApJ, 843, 46, doi: 10.3847/1538-4357/aa740c
- Stefanon et al. (2017) Stefanon, M., Yan, H., Mobasher, B., et al. 2017, The Astrophysical Journal Supplement Series, 229, 32, doi: 10.3847/1538-4365/aa66cb
- van der Wel et al. (2012) van der Wel, A., Bell, E. F., Häussler, B., et al. 2012, ApJS, 203, 24, doi: 10.1088/0067-0049/203/2/24
- van der Wel et al. (2014) van der Wel, A., Franx, M., van Dokkum, P. G., et al. 2014, ApJ, 788, 28, doi: 10.1088/0004-637X/788/1/28
- Wen & Zheng (2016) Wen, Z. Z., & Zheng, X. Z. 2016, ApJ, 832, 90, doi: 10.3847/0004-637X/832/1/90
- Whitaker et al. (2014) Whitaker, K. E., Franx, M., Leja, J., et al. 2014, ApJ, 795, 104, doi: 10.1088/0004-637X/795/2/104
- Whitney et al. (2019) Whitney, A., Conselice, C. J., Bhatawdekar, R., & Duncan, K. 2019, ApJ, 887, 113, doi: 10.3847/1538-4357/ab53d4
- Wu et al. (2023) Wu, Y., Cai, Z., Sun, F., et al. 2023, ApJ, 942, L1, doi: 10.3847/2041-8213/aca652