Searching for Intermediate Mass Black Holes in Globular Clusters Through Tidal Disruption Events
Abstract
Intermediate mass black holes (IMBHs) may be the link between stellar mass holes and the supermassive variety in the nuclei of galaxies, and globular clusters (GCs) may be one of the most promising environments for their formation. Here, we carry out a pilot study of the observability of tidal disruption events (TDEs) from IMBHs embedded in stellar cusps at the center of GCs. We model the long super-Eddington accretion phase and ensuing optical flare, and derive the disruption rate of main-sequence stars as a function of black hole mass and GC properties with the help of a 1D Fokker-Planck approach. The photospheric emission of the adiabatically expanding outflow dominates the observable radiation and peaks in the NUV/optical bands, outshining the brightness of the (old) stellar population of GCs in Virgo for a period of months to years. A search for TDE events in a sample of nearly 4,000 GCs observed at multiple epochs by the Next Generation Virgo Cluster Survey (NGVS) yields null results. Given our model predictions, this sample is too small to set stringent constraints on the present-day occupation fraction of GCs hosting IMBHs. Naturally, better simulations of the properties of the cluster central stellar distribution, TDE light curves and rates, together with larger surveys of GCs are all needed to gain deeper insights into the presence of IMBHs in GCs.
Unified Astronomy Thesaurus concepts: Intermediate-mass black holes (816); Globular star clusters (656); Accretion (14).
Submitted to AAS Journals
1 Introduction
There is currently no unambiguous confirmation for intermediate mass black holes (IMBHs) with masses (for a recent review, see Greene et al., 2020). If one were to extrapolate the known relation down to low-mass stellar systems, globular clusters (GCs) would be expected to hosts IMBHs with (Lützgendorf et al., 2013). Finding objects and characterizing their mass function in this range would provide unique insight into the nature and growth of massive black hole seeds in the early Universe and the dynamical evolution of dense stellar systems, and provide key input into event predictions for gravitational wave facilities. Thus far there is some circumstantial evidence for black holes below in galaxy nuclei (NGC 205, Nguyen et al. 2019) and in hyperluminous X-ray sources (HLX-1, Webb et al. 2012), but there are still no compelling candidates with .
Different mechanisms have been proposed for the formation of IMBHs in dense stellar clusters, from “slow” scenarios where the black hole remnant of a massive star sinks to the center of the cluster and grows over time through mergers of mass-segregated lighter black holes (Miller & Hamilton, 2002), to “fast” collisional runaway of massive stars during an early phase of cluster core collapse, the product of which may eventually lead to the formation of an IMBH (Portegies Zwart & McMillan, 2002; Giersz et al., 2015). It has been shown by Miller & Davies (2012) that all clusters above a central velocity dispersion of km s-1 will necessarily form an IMBH through some mechanism at any cosmic epoch, since above this dispersion primordial binaries cannot support the system against deep core collapse. The case is more complicated for lower-dispersion systems such as GCs, where – regardless of how IMBHs form – it may be a challenge to retain them in the face of a repeated onslaught of gravitational wave kicks from mergers with other black holes (Holley-Bockelmann et al., 2008; Fragione et al., 2018a).
To date, there are no solid detections of IMBHs in GCs. Claims of dynamical evidence for IMBHs have been made for multiple clusters, but orbital anisotropies and the presence of high concentrations of dark stellar-mass remnants could account for most or all of the alleged IMBH signatures (see Zocchi et al., 2019; Baumgardt et al., 2019; Vitral & Mamon, 2021, and references therein). IMBH detections have been reported by, e.g., Lützgendorf et al. (2013) for NGC 1904 () and NGC 6266 (), Feldmeier et al. (2013) for NGC 5286 (), Ibata et al. (2009) for NGC 6715 () and by Kamann et al. (2016) for NGC 6397 (). No radio emission consistent with an accreting IMBH has been observed in a sample of 50 Galactic GCs by Tremou et al. (2018).
To make progress, it is key to develop alternative methods for IMBH searches in dense stellar systems. Tidal disruption events (TDEs) may offer an independent, promising probe. A TDE occurs when the tidal force of the black hole exceeds the star self-gravity and rips it apart (Rees, 1988). While about half of the stellar debris is ejected at high speed, the remainder gets accreted, producing an optical/UV flare accompanied by thermal X-ray emission. One of the most compelling IMBH TDE candidates to date is 3XMM J215022.4–055108 (Lin et al., 2018), an X-ray outburst with a luminosity that peaked at erg s-1 and decayed systematically over 10 years, hosted in a star cluster of mass and plausibly powered by an IMBH of mass (Wen et al., 2021). This event suggests that an effective means of detecting IMBHs may be through a search of optical flares in a large sample of dense star clusters (e.g., Ramirez-Ruiz & Rosswog, 2009; Chen & Shen, 2018; Fragione et al., 2018b). As we shall see, this is particularly true for searches in the NUV, where a disruption event is predicted to outshine the old stellar population of the average GC for a period of months to years.
Large surveys with precise multi-wavelength photometry are becoming increasingly available for public use. As a pilot experiment, we take advantage of the Next Generation Virgo Cluster Survey (NGVS, Ferrarese et al. 2012), a comprehensive optical imaging survey of the Virgo galaxy cluster, together with its near-infrared counterpart (NGVS-IR, Muñoz et al. 2014), to set constraints on the fraction of GCs that may be harboring IMBHs. The NGVS-IR covers a total area of deg2 centered on Virgo’s core region in the bandpasses, and we capitalize on the sample of nearly 4,000 Virgo GCs provided by Peng et al. (in prep.). We use theoretical optical light curves to search for potential TDE candidates, and the estimated event rates of TDEs for a given GC population, stellar density profile, and cadence of NGVS observations, to attempt to constrain the fraction of GCs hosting IMBHs with stellar cusps at the present epoch. While there are considerable uncertainties in the modeling of TDE events around IMBHs in GCs, we hope that our pilot investigation will provide a blueprint for future searches of optical flares in dense stellar systems.
2 Light curve modeling
While the evolution of a TDE light curve has been extensively modeled in the literature (e.g., Strubbe & Quataert, 2009; Lodato & Rossi, 2011; Strubbe & Quataert, 2011; Metzger & Stone, 2016; Mockler et al., 2019; Ryu et al., 2020; Lu & Bonnerot, 2020, and references therein), the details of the evolution of the debris stream, the efficiency of the process of circularization, and the emission mechanisms responsible for the optical/UV emission in TDE flares all remain an open question (for recent reviews see Roth et al., 2020; Rossi et al., 2021). For illustrative purposes, we shall follow here the simplified analysis of Strubbe & Quataert (2009) and Lodato & Rossi (2011). A star of mass and radius on a very eccentric orbit is torn apart when its pericenter is within the black hole’s tidal sphere of radius
| (1) |
For lower main-sequence stars, masses and radii are related by (Kippenhahn & Weigert, 1990). The impact parameter of the encounter, , measures the strength of the tidal interation. Initially, approximately half of the initial stellar debris becomes bounded (Evans & Kochanek, 1989), and after a fallback time,
| (2) |
most bound material starts coming back to pericenter at the rate
| (3) |
While the early behavior of the fallback rate may be influenced by stellar properties (Lodato et al., 2009; Guillochon & Ramirez-Ruiz, 2013; Law-Smith et al., 2020), the late-time accretion rate onto the black hole from a TDE always declines as if the star is completely disrupted (Coughlin & Nixon, 2019).
For an IMBH, the mass fallback rate predicted by Equations (2) and (3) exceeds the Eddington rate
| (4) |
for a timescale of years or longer. Here, cm2 g-1 is the electron scattering opacity, and we assume accretion process at radiative efficiency. In this regime, only a fraction of the fallback material joins the newly-formed Keplerian disk and accretes onto the black hole at the rate
| (5) |
while the remaining stellar debris are launched in a radiation pressure-driven outflow during circularization. The relative importance of accretion and outflows in this phase is poorly understood (e.g., Ohsuga et al., 2005; Dotan & Shaviv, 2011; Coughlin & Begelman, 2014; Metzger & Stone, 2016; Wu et al., 2018). To bracket the uncertainties, here we shall adopt two constant values for the fraction of infalling gas that is ejected in a wind, (e.g., Strubbe & Quataert, 2009; Kitaki et al., 2021) and (e.g., Lodato & Rossi, 2011; Metzger & Stone, 2016).
The effective temperature of the accretion flow is that of a slim advective disk
| (6) |
(Strubbe & Quataert, 2009), where and is the Schwarzschild radius. The disk extends from to the circularization radius , and the monochromatic disk luminosity as a function of time is that of a multicolour blackbody,
| (7) |
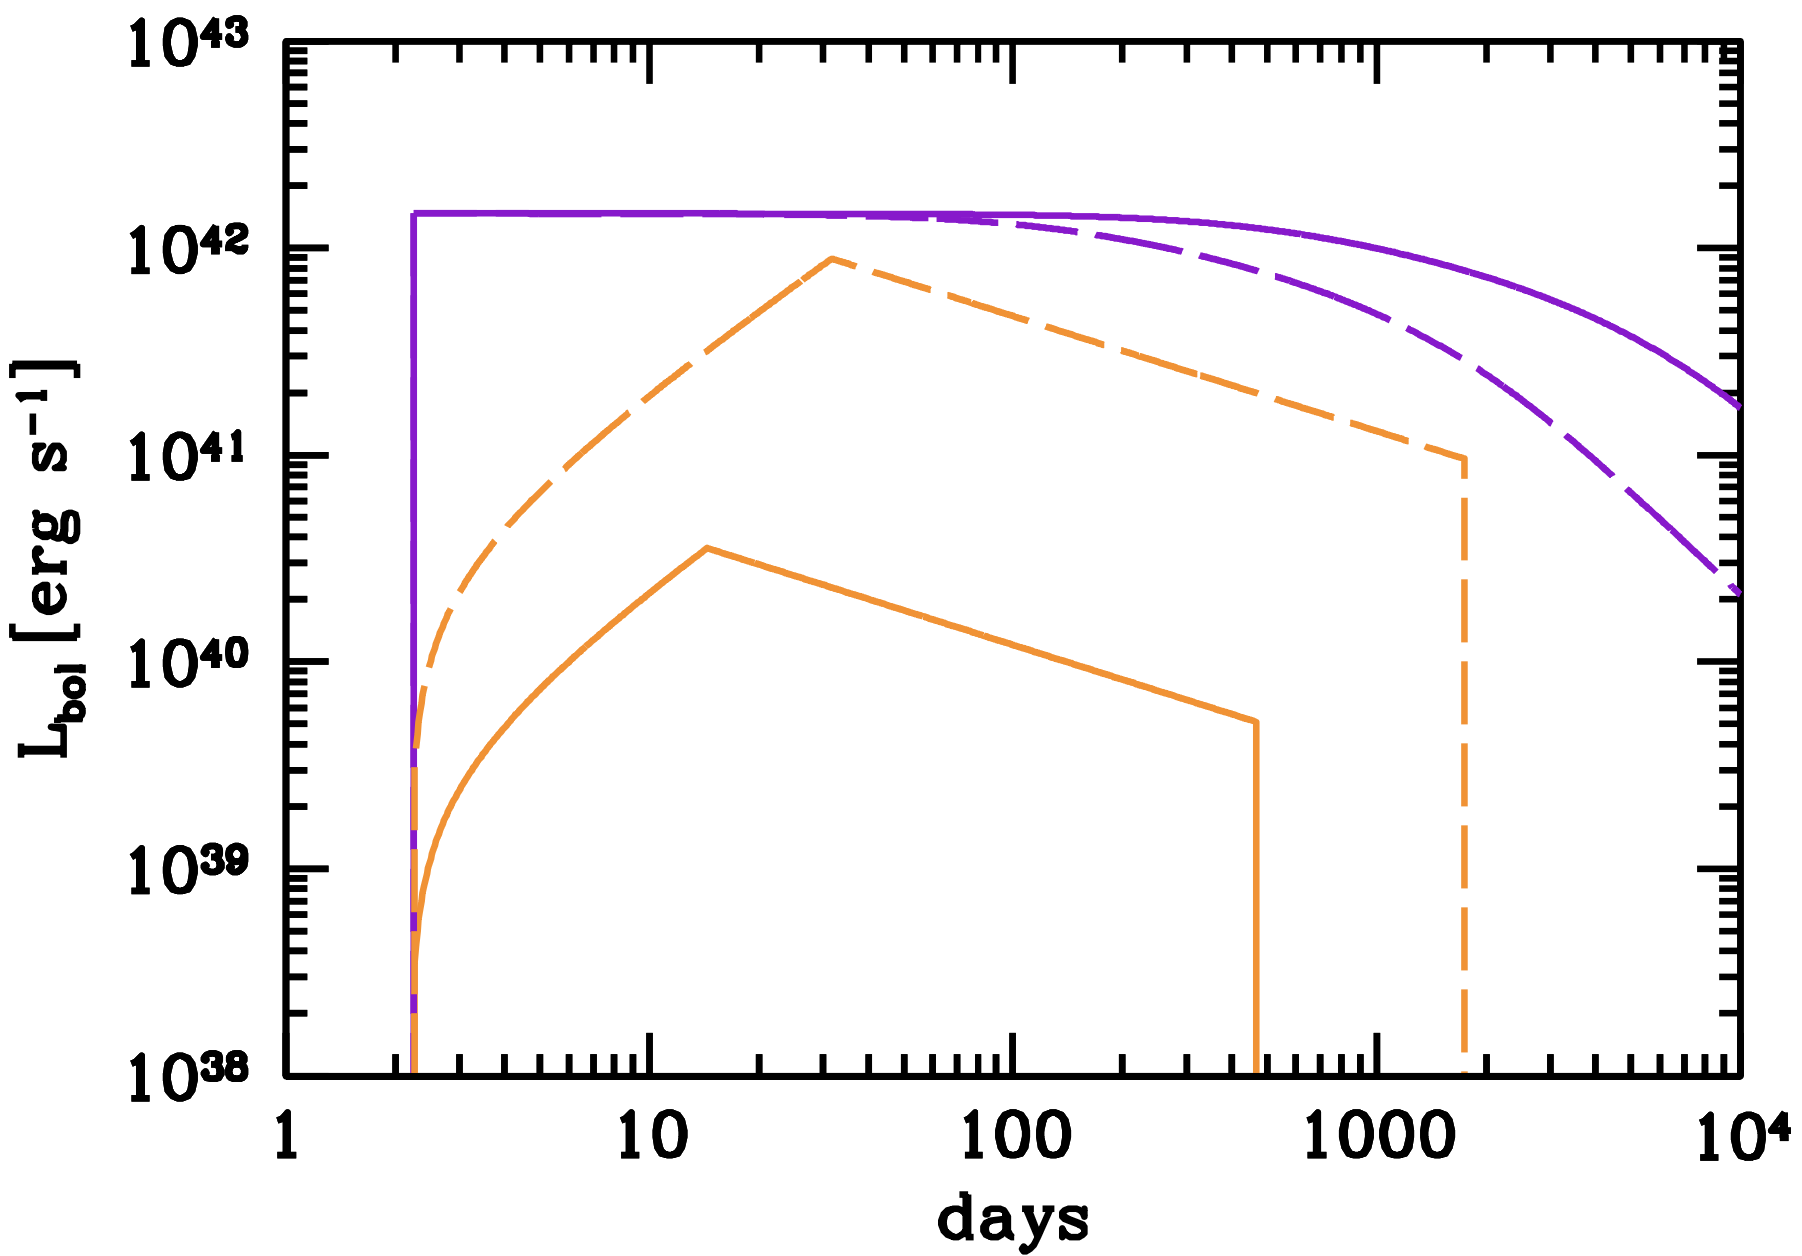
When required, our standard choice of parameters for the stellar properties is , , and . Figure 1 shows the bolometric light curve for the disk emission from the disruption of solar-type star by a 3,000 IMBH. Note how, during the super-Eddington phase, viscosity-generated heat does not have sufficient time to be radiated away, and is instead advected into the hole. The disk effective temperature remains then constant with time even as the fallback rate declines, and the radiated luminosity saturates at a few times .
A simple model for the radiation-driven wind approximates the geometry as spherical and assumes that stellar debris falls back at close to the escape velocity and shocks at , converting kinetic energy into radiation. Photons are trapped in an outflow promptly launched from the circularization radius with and terminal velocity . Our standard choice for the wind velocity parameter is . The radiation temperature at the base of the wind, , can be derived from energy conservation in the wind
| (8) |
The outer radius of the ejecta grows as , and the outflow is optically thick to electron scattering out to a photospheric radius given by . The gas density profile for follows from matter conservation, ). The temperature of the advected radiation decreases adiabatically as , and photons escape with a blackbody spectrum at the photospheric temperature of
| (9) |
where is the gas density at the base of the flow.
At the earliest times, the fallback rate can be so large and the density so high that the location of the photosphere is just inside . In this “edge-limited” phase, we set and . The specific outflow luminosity is given by
| (10) |
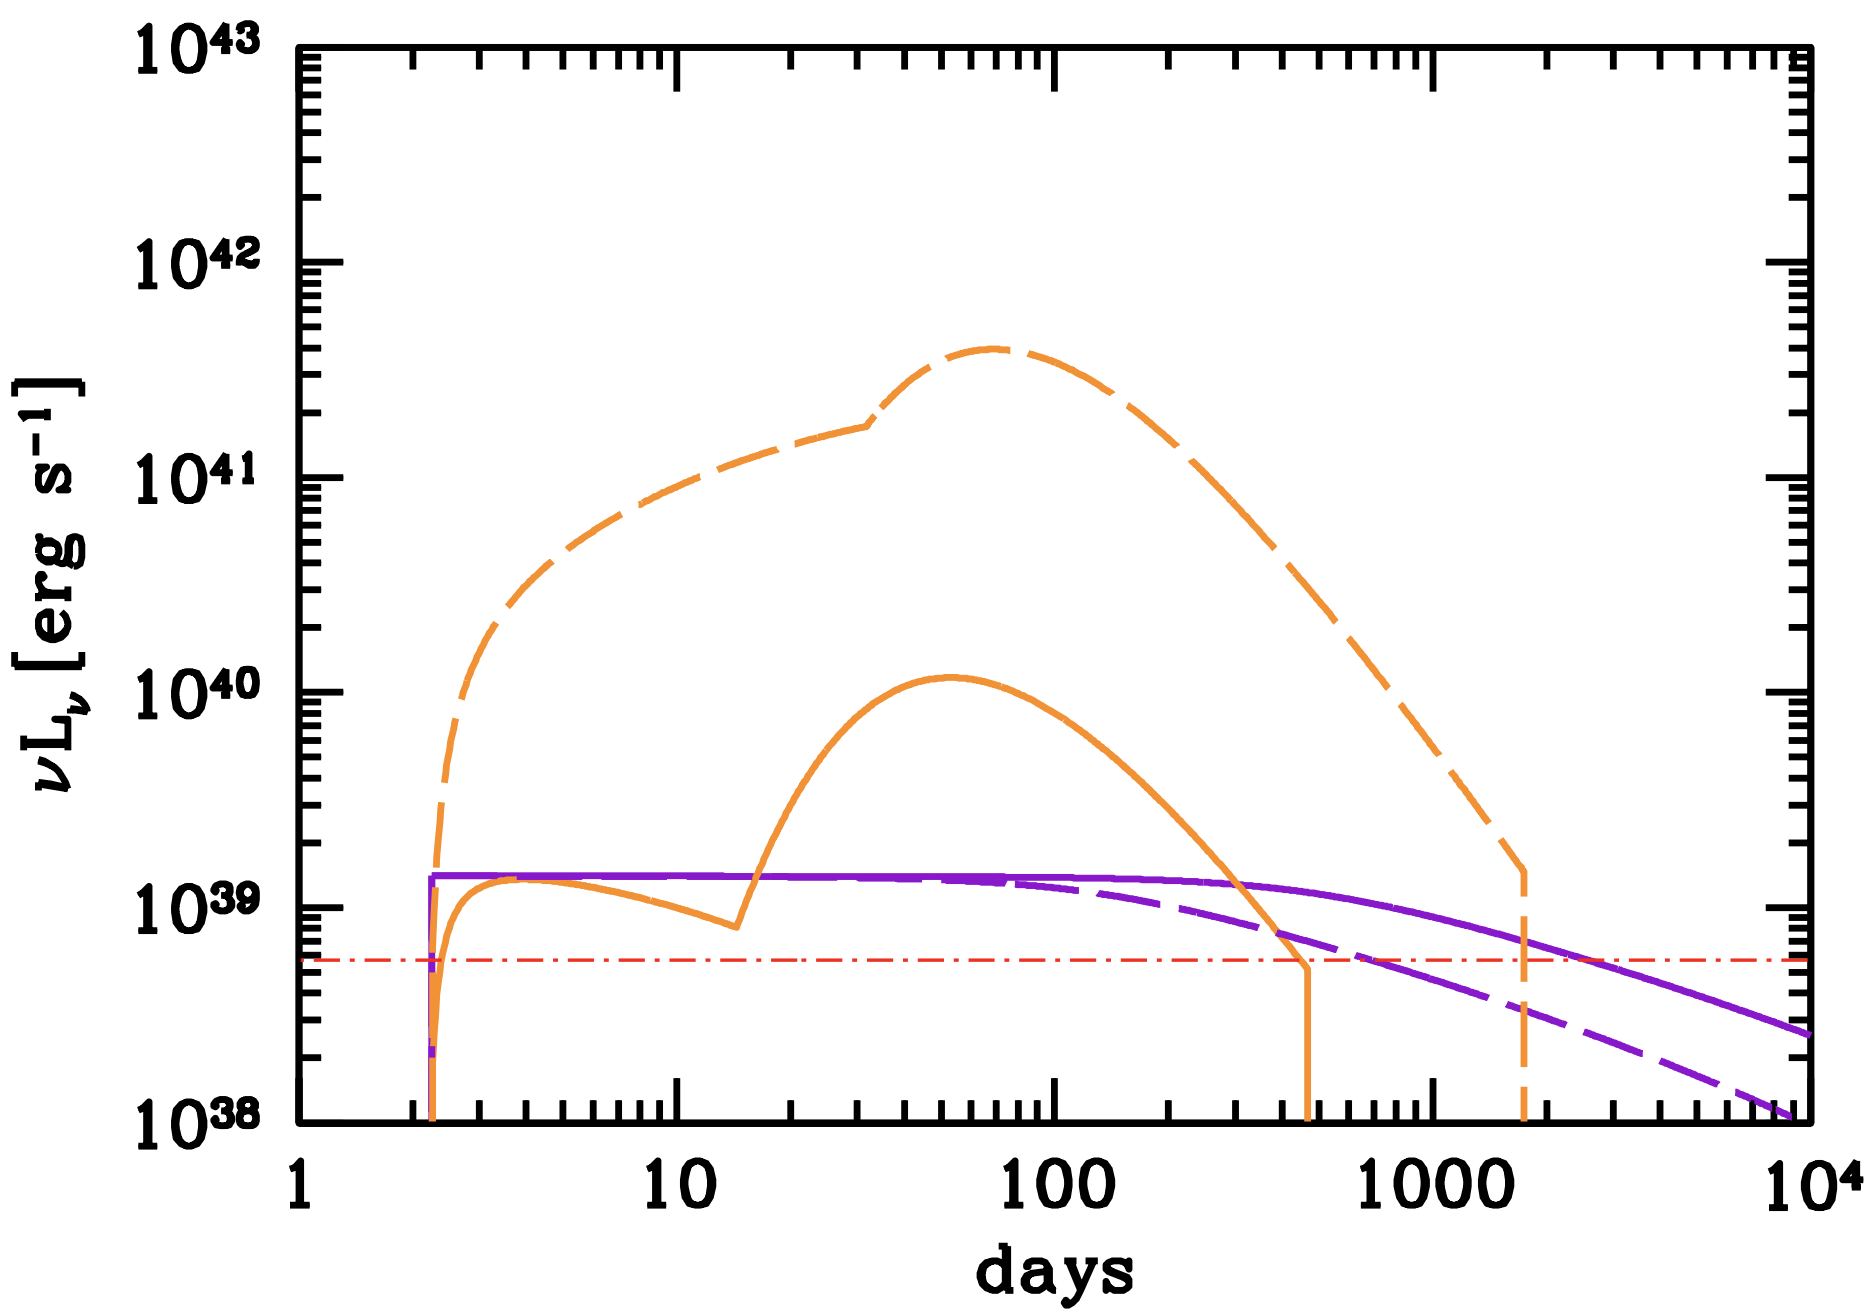
Figure 1 shows the resulting wind bolometric light curve, which rises as during the edge-limited initial phase, when the photosphere expands and decreases as . As time passes and the density of the outflow subsides, the photosphere sinks inward as , its temperature rises as , and the luminosity declines as . The total radiation luminosity of the wind is of order in the case, decreasing for lower outflow rates as during the edge-limited phase, and as afterwards (cf. Strubbe & Quataert, 2009). These relations only apply for , because otherwise the outflow is optically thin. We impose this limit by setting the wind luminosity to zero when the photosphere shrinks below . In the case the wind becomes optically thin when the fallback rate is still super-Eddington.
While the disk always dominates the total radiated power, the bulk of the disk emission occurs in the soft X-rays. The optical/NUV flash plotted in Figure 2 is instead produced by the adiabatically expanding outflow, which largely outshines the disk during the optically thick phase. For comparison, we also show in the figure the mean NUV luminosity of GCs detected in the NGVS survey, which argues for the detectability of a TDE optical transient against the brightness of a dense star cluster.
Depending on the uncertain geometry of the outflow and the viewing angle of the observer to the source, it is possible that both the accretion disk and the outflow may be visible at early times. Here, we shall neglect obscuration effects and sum up the two contributions to produce a total TDE light curve.
3 TDE Rates: Estimates
To provide estimates and trends of the number of TDE flares expected in a local GC survey like the NGVS, we present in this section a simple and intuitive configuration-space approach following Syer & Ulmer (1999). Our treatment is informed by the more rigorous numerical integration of the one-dimensional, orbit-averaged Fokker-Planck equation for the evolution of the stellar distribution function, which we perform and discuss in the next section.
Stars within a cluster of current mass are assumed to follow a Plummer density profile
| (11) |
with 1D velocity dispersion
| (12) |
Here, and are the density and velocity dispersion in the cluster core, and is the Plummer scale parameter that sets the size of the cluster core. We have fit the masses and structural parameter data of Milky Way’s GCs of Baumgardt & Hilker (2018) with the core density-cluster mass relation:
| (13) |
For a GC with mass , the expressions above yield , pc, and km s-1.
At the center of this Plummer cluster we place an IMBH with . Following mass segregation (Bahcall & Wolf, 1977), low mass main-sequence stars and their remnants relax to a Bahcall-Wolf density cusp near the black hole, with (Alexander & Hopman, 2009). We thus write the stellar density near the center of the cluster as
| (14) |
where is the radius of influence of the black hole. This is defined as the location where the interior stellar mass equals (e.g., Binney & Tremaine, 1987; Merritt, 2004; Wang & Merritt, 2004), i.e.
| (15) |
where . In our set-up, is typically a few times larger than the radius defined kinematically in terms of the intrinsic stellar velocity dispersion. For IMBHs weighing a few percent of the cluster core mass, collisional -body simulations show that the cusp extends all the way up to (Baumgardt et al., 2004). This is also confirmed in our direct numerical integration of the Fokker-Plank equation for the time-dependent stellar distribution in the vicinity of an IMBH (see next Section). The Jeans equations associate an density cusp with a velocity dispersion that near the black hole approaches (e.g., Zhao, 1996). We therefore approximate the cluster central velocity dispersion as
| (16) |
Hereafter, we shall assume a slope of for the central stellar cusp.
Stars on nearly parabolic orbits are tidally disrupted when their specific angular momentum is smaller than . The ensemble of nearly-radial orbits with forms the so-called “loss cone”, the set of velocity vectors at some distance from the black hole that lie within a cone of half-angle (Frank & Rees, 1976; Lightman & Shapiro, 1977)
| (17) |
Stars in the loss cone are disrupted at the first periapsis passage, and the continued supply of stars to the IMBH is driven by gravitational deflections that repopulate the loss cone on a timescale that is related to the two-body relaxation time
| (18) |
(Spitzer, 1987). Here, is the number density of main sequence stars and their remnants, and we take for the Coulomb logarithm. In a simplified treatment, two dynamical regimes can be defined depending on the ratio of the dynamical timescale, , to the diffusion timescale of angular momentum across the loss cone, . Close to the IMBH, orbital periods are short and stars diffusing into the loss cone are immediately disrupted. This is the empty loss-cone regime, and the rate of TDEs per star can be estimated as
| (19) |
where is the number of main-sequence stars contained within a radius (Frank & Rees, 1976; Lightman & Shapiro, 1977; Syer & Ulmer, 1999). This flux is proportional to the relaxation rate but only weakly dependent on the size of the loss cone. In the other regime, , scattering in and out of the loss cone is faster than the orbital time, and the loss cone will always be full, uniformly populated in orbital phase. The fraction of stars in the loss cone at any time is then just , and the TDE rate per star is given by (Syer & Ulmer, 1999)
| (20) |
independent of the stellar encounter timescale. After solving for the transition radius where the two per-star disruption rates in Equations (19) and (20) are equal, we write the total TDE rate of main-sequence stars as
| (21) |
In the above equations, the term represents the change in the event rate with the number of stars at fixed total stellar density , while the second moment is responsible for the decrease of the diffusion timescale as the gravitational potential becomes more “granular” and stellar-mass black holes dominate the relaxation rates (Kochanek, 2016; Bortolas, 2022). In general, to compute and one needs to adopt a present-day mass function (PDMF) with an upper truncation at to approximate the old stellar population of a GC (Magorrian & Tremaine, 1999). For simplicity, and in analogy with the time-dependent Fokker-Planck numerical approach discussed in the next section, we will assume instead an idealized, single-mass stellar system composed by stars (). Compared to a single-mass stellar population, a realistic PDMF is known to enhance TDE rates by several-fold (Stone & Metzger, 2016) even after accounting for the smaller tidal radii, , of sub-solar stars.111In our model, the empty loss-cone disruption rate can be shown to scale as up to a slowly varying logarithmic factor.
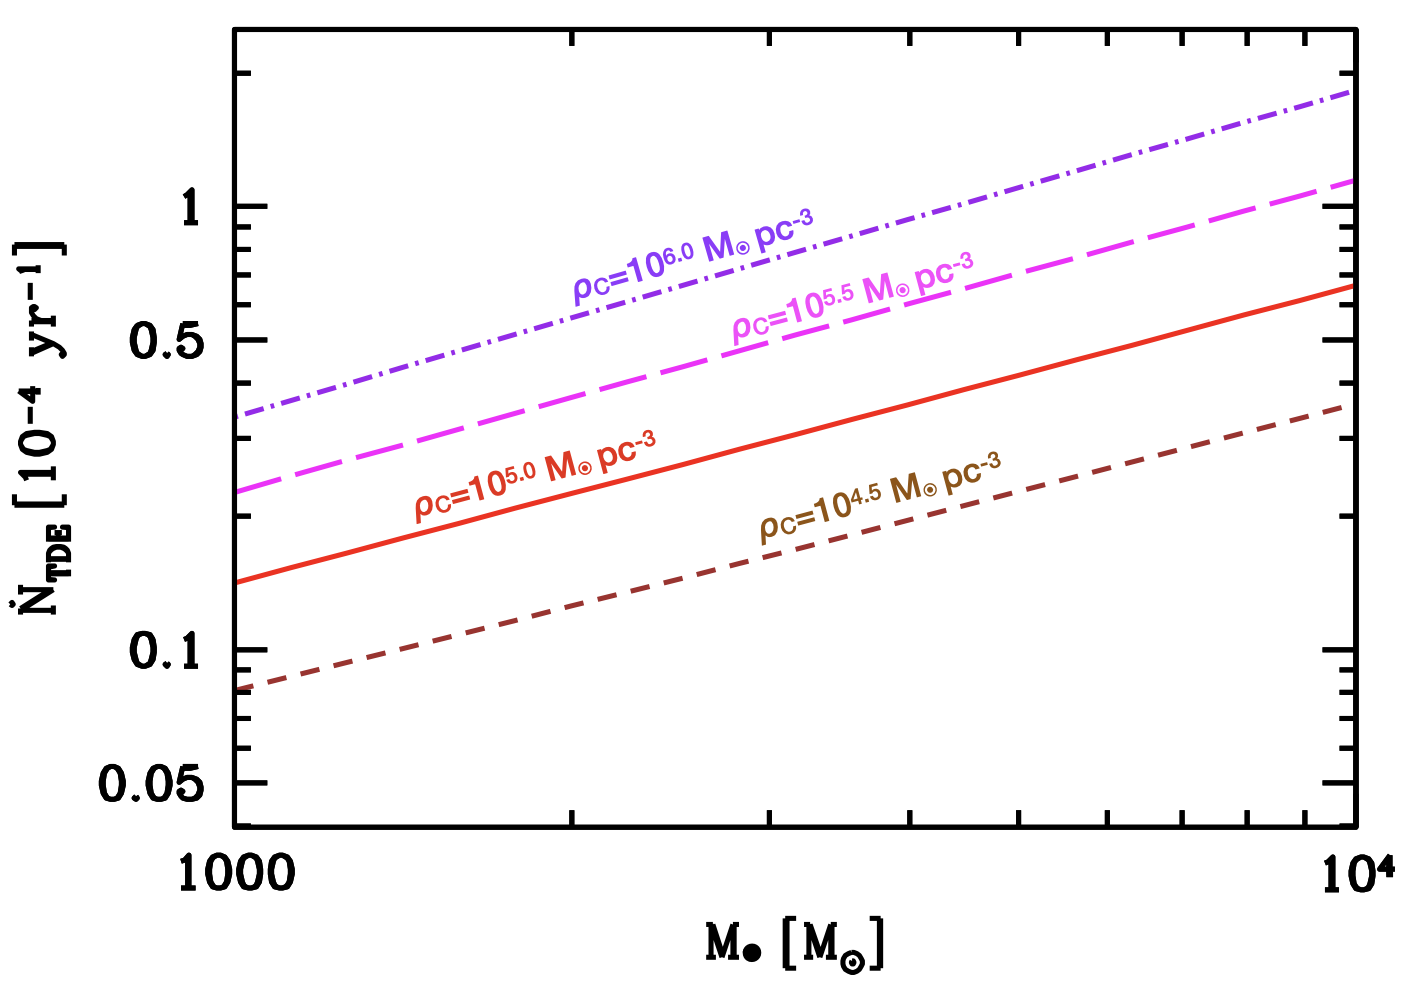
Figure 3 shows the predicted TDE rates for IMBHs in GCs with a single-mass stellar population and increasing core densities in the range pc-3. Most events are sourced at , and both the empty and full loss-cone regimes contribute an fraction of the total disruption rate. The rates of TDEs increase with black hole mass and cluster core density approximately as , and typically exceed for IMBHs harbored in dense GCs. Obviously, these high rates cannot be sustained indefinitely because of stellar depletion. In the next section we will compute TDE rates in a time-evolving stellar density profile – including depletion – using a Fokker-Plank approach.
4 TDE Rates: Fokker-Planck Integration
We have tested the simplified model of the previous section against the results of the PhaseFlow Fokker-Plank integrator of Vasiliev (2017). The publicly available PhaseFlow code solves the coupled Poisson and orbit-averaged 1D Fokker-Planck equations, evolving a spherically symmetric distribution of stars under two-body relaxation and loss-cone effects in the neighbourhood of a central black hole, the mass of which is allowed to grow with time following stellar captures (Bortolas, 2022). We explore a one-parameter family of models, varying the initial core density of the initial Plummer profile between and adjusting the total mass of the cluster according to Equation (13) (). In all configurations, a central IMBH of initial mass is embedded in a initial stellar cups that extends all the way up to the influence radius . Following each capture event, 30% of the mass of the disrupted star is accreted by the IMBH. For simplicity, we assume here an idealized, single-mass stellar system composed by stars, postponing a numerical treatment that includes a complete, time-dependent stellar mass function and the effect of mass segregation on TDE rates to future work.
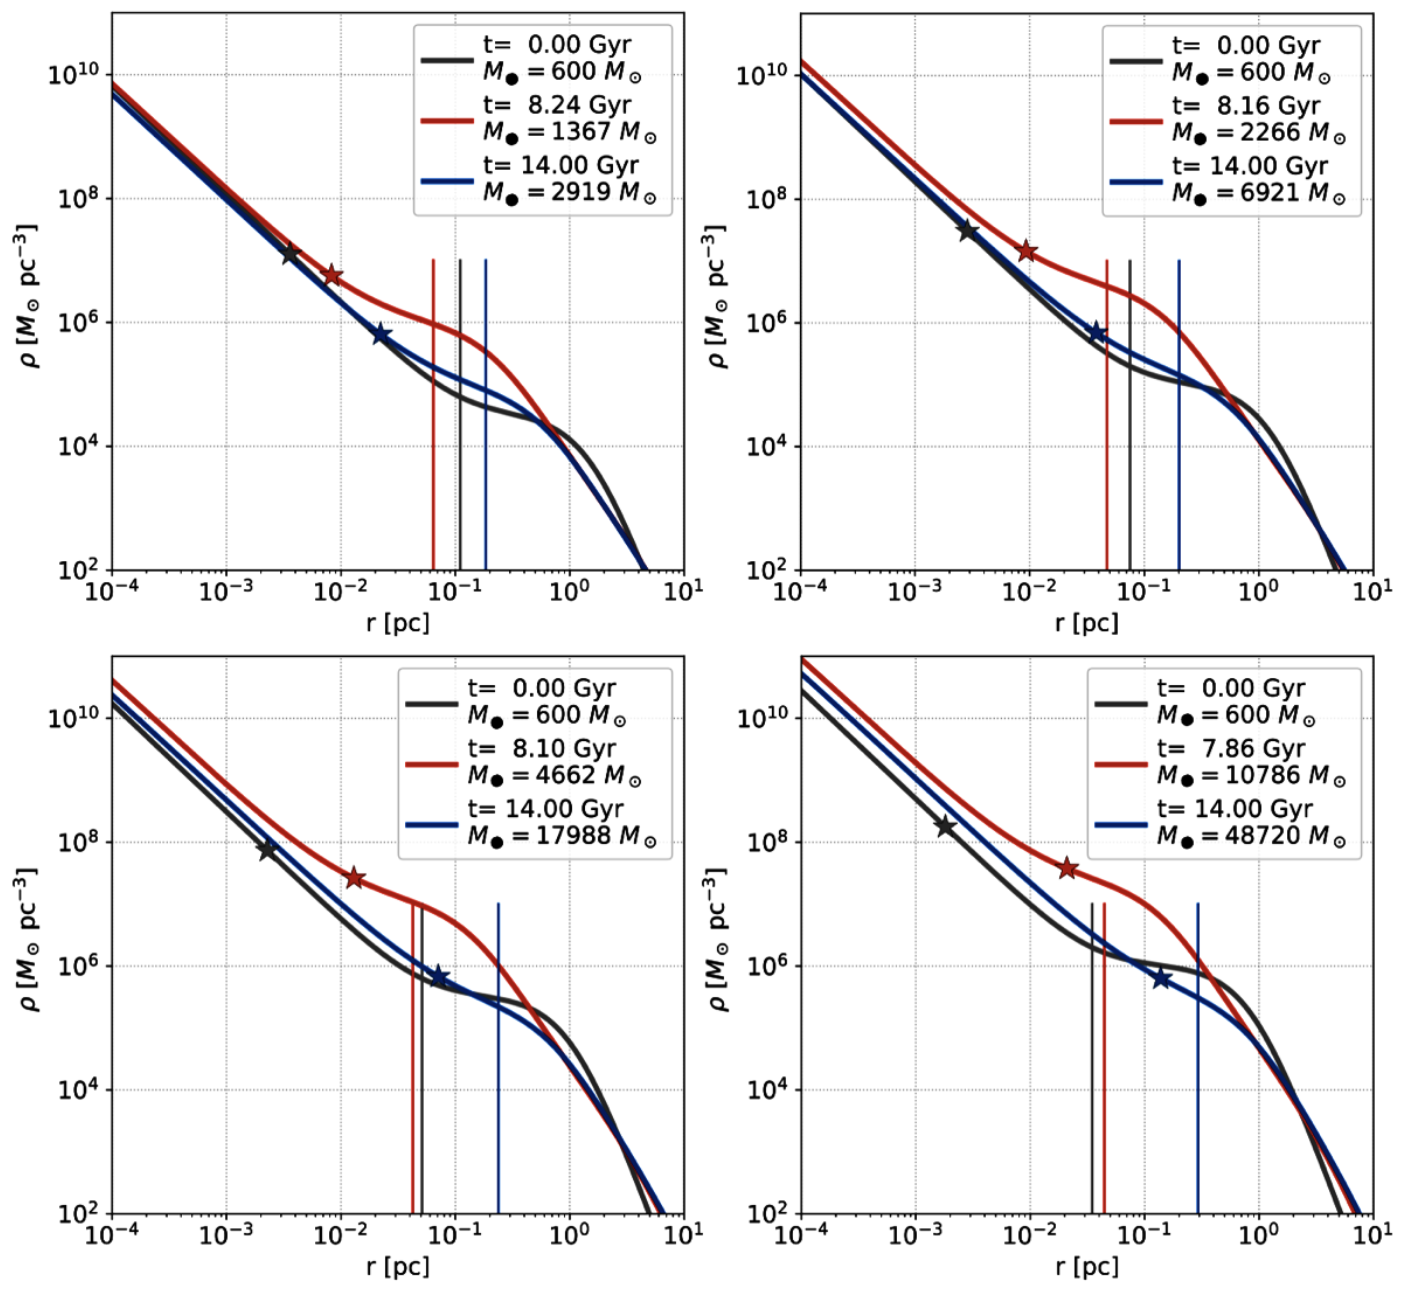
Figure 4 shows the evolving stellar density profiles of four IMBHGC systems having different initial core densities in the range pc-3 (as in Figure 3). As shown by Vasiliev (2017), the cusp is not a steady-state structure: the gray line shows the initial Plummer+Bahcall–Wolf cusp profile (), the red line corresponds to the time when the cusp amplitude attains its maximum value, and the blue line depicts the profile at the end of the integration, Gyr, when the cusp density normalization has decreased in response to the heat source at the center. In the figure, the vertical lines mark the influence radius containing a mass of stars equal to , while the starred points denote the locus where most TDEs are sourced.
The evolution of all clusters follows a similar route. At first the system expands, powered by an outward heat conductive flux driven by two-body relaxation. The density in the cusp decreases, roughly maintaining an profile inside the influence radius. The initial expansion phase lasts Gyr, which is of order the two-body relaxation timescale at the influence radius , and is followed by a phase of secular gravo-thermal contraction leading to a maximum cusp density at time Gyr; as expected, the latter timescale is of order the relaxation timescale measured in the outer regions of the cluster. IMBH-star interactions eventually generate enough heat to prevent further core collapse and cause a late re-expansion of the cluster.
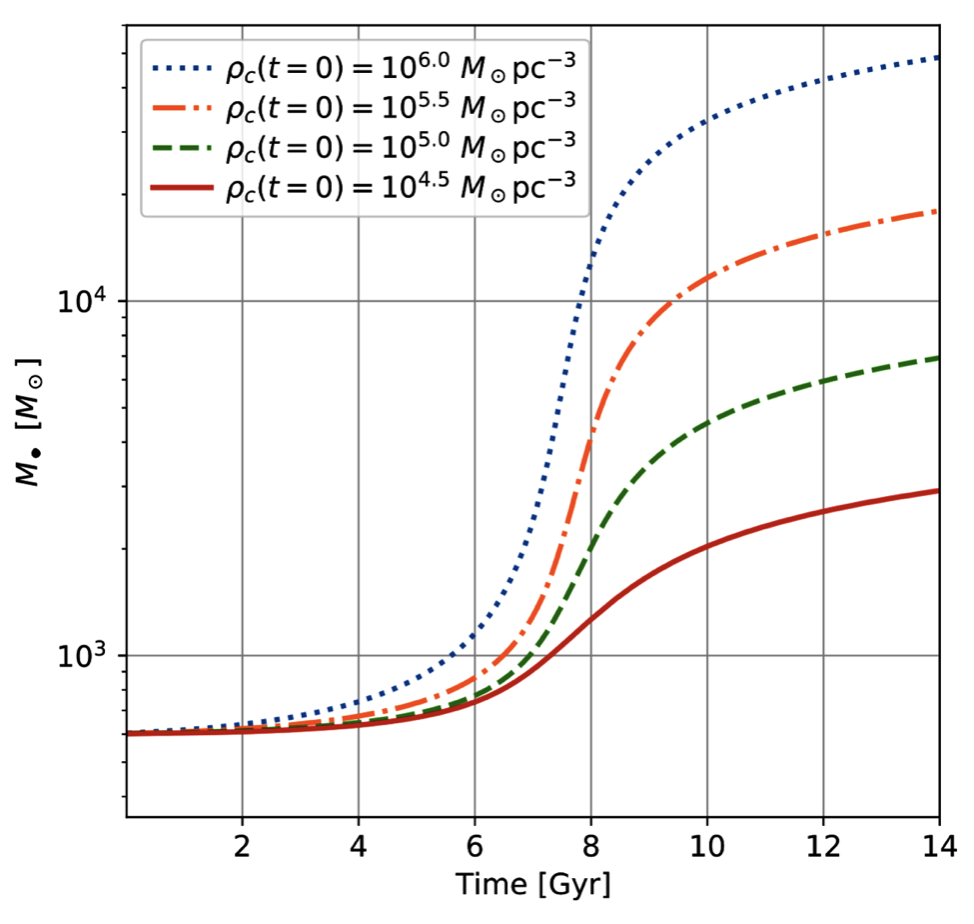
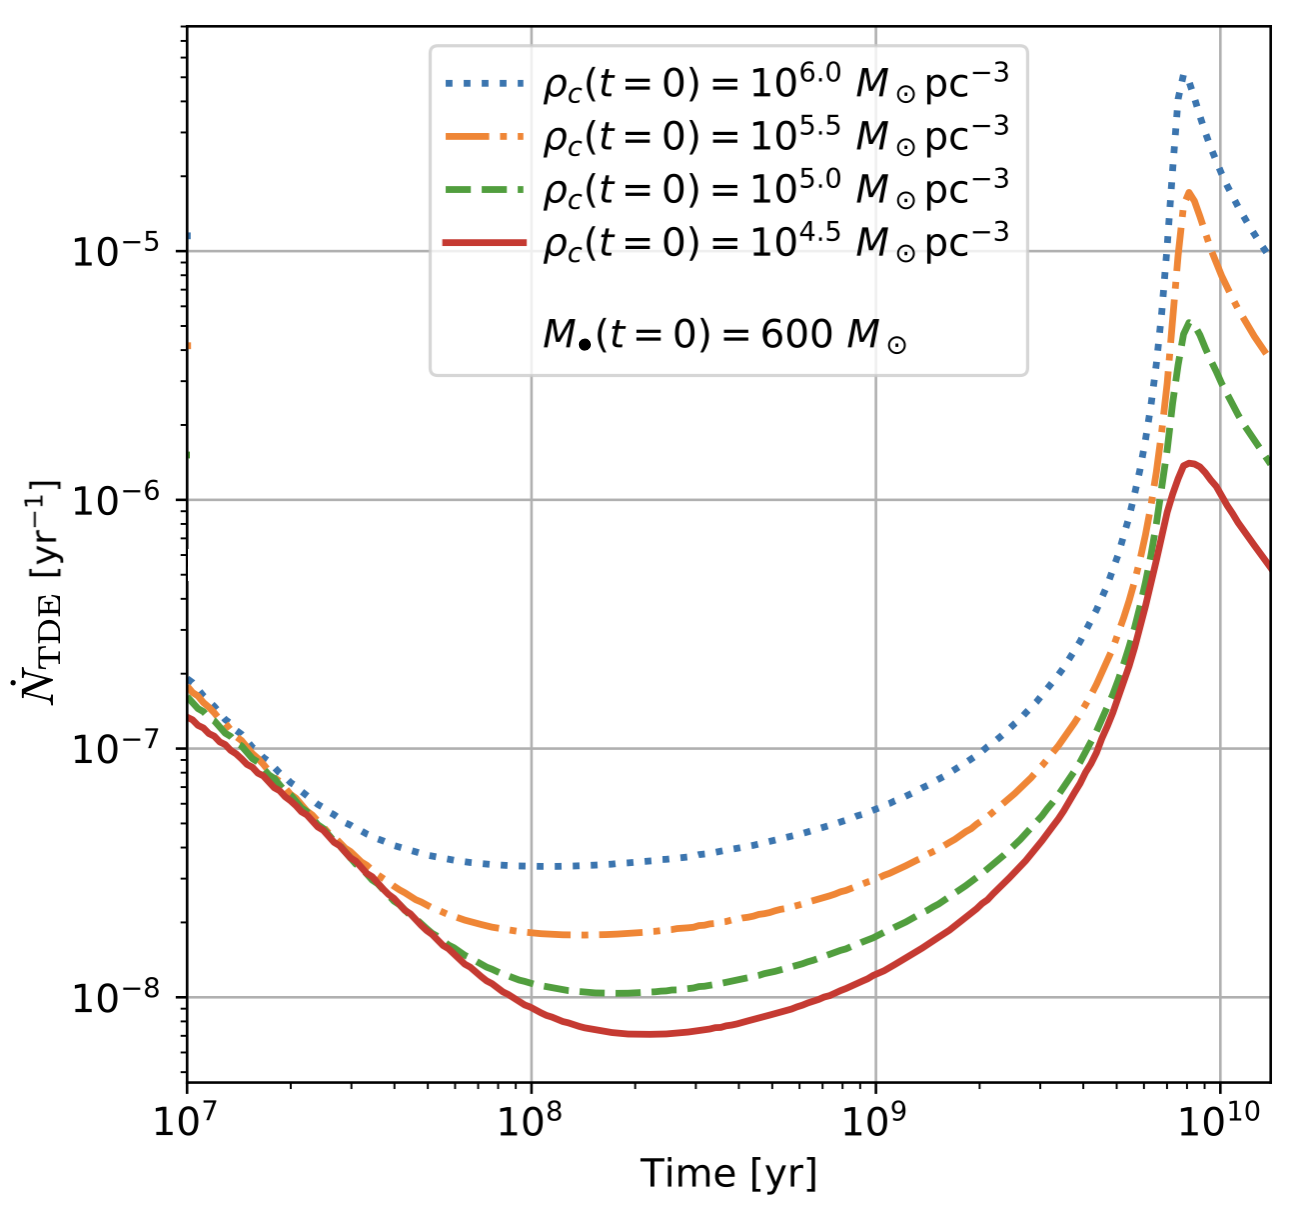
During the 14 Gyr evolution, the IMBH acquires a mass of depending on the chosen initial stellar density, with a more efficient growth in the case of denser and more massive systems (Figure 5) and a faster rise at time Gyr during the gravo-thermal cluster contraction. The three main phases of the GC density profile progression – fast expansion, contraction of the core, and slow re-expansion – are reflected in the evolution of the TDE rate (Figure 6), which is simultaneously modulated by the growth of the central black hole. Disruption rates reach a minimum after Gyr, then climb dramatically by more than 2 orders of magnitude during core contraction, peak at Gyr, and slowly decay at late times. The peak in the rates is clearly sourced by the collapse of the outer regions of the cluster delivering a substantial amount of new stars near the IMBH and promoting its growth. Peak rates are more pronounced in initially denser clusters where stellar captures lead to more massive IMBHs. The orbital radius where most disruption events originate (starred point in Figure 4) moves outward during the core expansion phases, and inward when the core contracts.
Because of the intrinsic time-dependence of the problem, a detailed comparison between our steady-state analytical estimates in Section 3 and the numerical results obtained with the PhaseFlow code is far from trivial. The Fokker-Planck integration validates qualitatively:
-
•
the assumed steady-state inner density profile, which actually evolves in amplitude in Figure 4 but approximately retains the same functional form, with little dependence on initial conditions;
-
•
the IMBH mass range used to estimate light curves and TDE rates in GCs, which is consistent with the mass accreted in Gyr by sufficiently massive black hole seeds (with seed masses above a few hundred solar masses) via stellar captures in dense stellar systems (see Figure5); and
- •
When compared with our steady-state analytical estimates for a single-mass stellar population of stars (Figure 3), the peak rates observed in the Fokker-Planck integration appear to be a few times lower than the corresponding rates of the simplified model.
In our analysis below of the NGVS GC sample, we shall adopt for simplicity the analytical rates of Figure 3, as they are expected to be intermediate between the numerical results and steady-state estimates that include a complete, evolved stellar mass function. A useful power-law fit to these TDE rates as a function of and is given by
| (22) |
with parameters , , and .222Note that such an event rate cannot be sustained indefinitely, as nearly the entire cluster would be consumed over a Hubble time. The time evolution in Figure 6 shows that high rates are only achieved at late times. Considering that most GCs are about 10 Gyr old, i.e. they are close in age to the peak of the TDE rate in the Figure, it is reasonable to use this value as a good estimate for the present-day TDE rate.
5 NGVS GC Sample
To compare our theoretical predictions with observations, we search for optical flares from TDEs in a robust sample of GCs in - and -band. These clusters are in the core of the nearby Virgo galaxy cluster within a deg2 region centered on M87. The photometric data are part of the NGVS (Ferrarese et al., 2012) and its near-infrared counterpart, NGVS-IR (Muñoz et al., 2014). GC candidates were selected using extreme deconvolution (Bovy et al., 2011) to model the distribution of foreground stars, GCs, and background galaxies in a multidimensional parameter space of color and morphology (concentration parameter), which determined the probability of a given source to be a GC (Peng et al., in prep.). Our sample of NGVS globulars consists of CFHT MegaCam time-series photometry in the bandpasses spanning 5 years with a cadence timescale ranging from hours to months and sometimes several years. The cadence was determined by the need to make large dithers for studying the low surface brightness outskirts of massive galaxies (Ferrarese et al., 2012). Most GCs have about 5–20 measurements in each of the four filters with mag photometric precision depending on the apparent magnitude of the system. After removing those with only single-epoch observations, our final NGVS sample of GCs with -band photometry includes a total of 3,849 sources.
5.1 Photometric Variability
A temporary brightening of a NGVS GC could indicate a potential TDE, a false positive due to cosmic ray hits, or other image artifacts. We have checked for large photometric variations, applying a sigma-clipping technique to find outliers in subsets of data. Four outliers at were found in the band, and image inspection showed that cosmic rays were causing the increase in brightness. Our search for detectable TDE events in the NGVS GC sample yields null results.
5.2 Mass and Luminosities
Stellar masses of NGVS GCs were computed from their AB magnitudes as
| (23) |
The constant includes the logarithm of a mass-to-light ratio in any arbitrary band-pass and the distance to the Virgo cluster [16.5 (random) (systematic) Mpc, Mei et al. 2007], and is given by
| (24) |
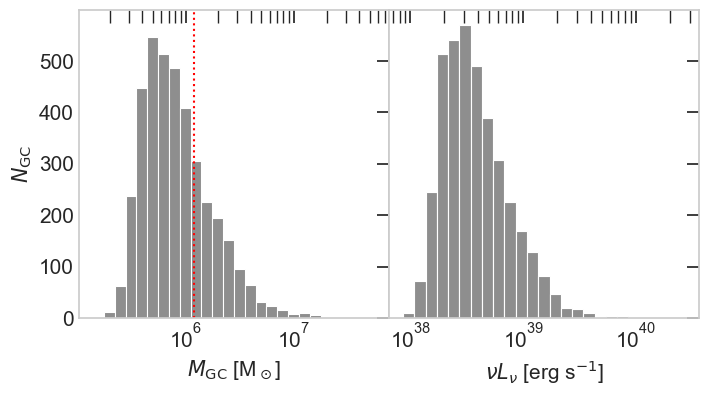
From the reported MegaCam photometry, we take the average - and -band magnitudes and compute for each GC the color . The colors are then used to obtain -band mass-to-light ratios by adopting the corresponding values predicted by the metallicity-dependent population-synthesis model PEGASE (Jordán et al., 2007). The resulting NGVS GC mass distribution is shown in Figure 7. The GC sample has mean stellar mass , and 31% of all globulars are more massive than . We used -band rather than band for mass determinations because mass-to-light ratios at redder wavelengths are less sensitive to the exact age or star formation history of a stellar population, minimizing systematic uncertainties. Figure 7 also shows the - and -band monochromatic luminosities of our GC sample. Globulars are typically fainter in , with NUV luminosities rarely exceeding erg s-1.
5.3 Detectability of TDEs in NGVS GCs
To assess quantitatively the observability of TDEs in our GC sample, and in preparation for future multi-epoch surveys of extra-galactic star clusters, we assume here that each NGVS GC hosts an IMBH of mass . The input parameters for each cluster are its stellar luminosity, the corresponding TDE rate (Eq. 22), and the theoretical light curves in the two cases, and , chosen to bracket the strength of the radiation-driven wind component. For each GC we then compute the time interval during which the TDE outshines the steady stellar GC component in the -band, as well as the total time span between the first and last epoch of cluster observation, . The number of observable TDEs in the sample is then
| (25) |
Here, the sum is over all GCs, is the occupation fraction, and the first term on the RHS corrects for the events that went off before the start of the survey but whose light-curve tail would still be visible at survey times. Note that typically , and that can be as long as 5.1 yr.
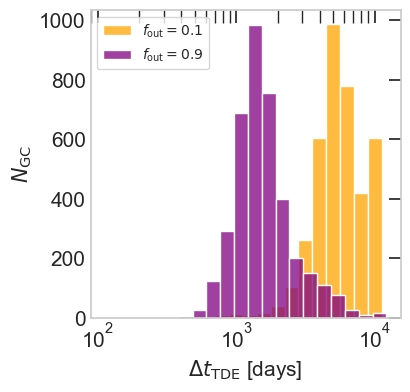
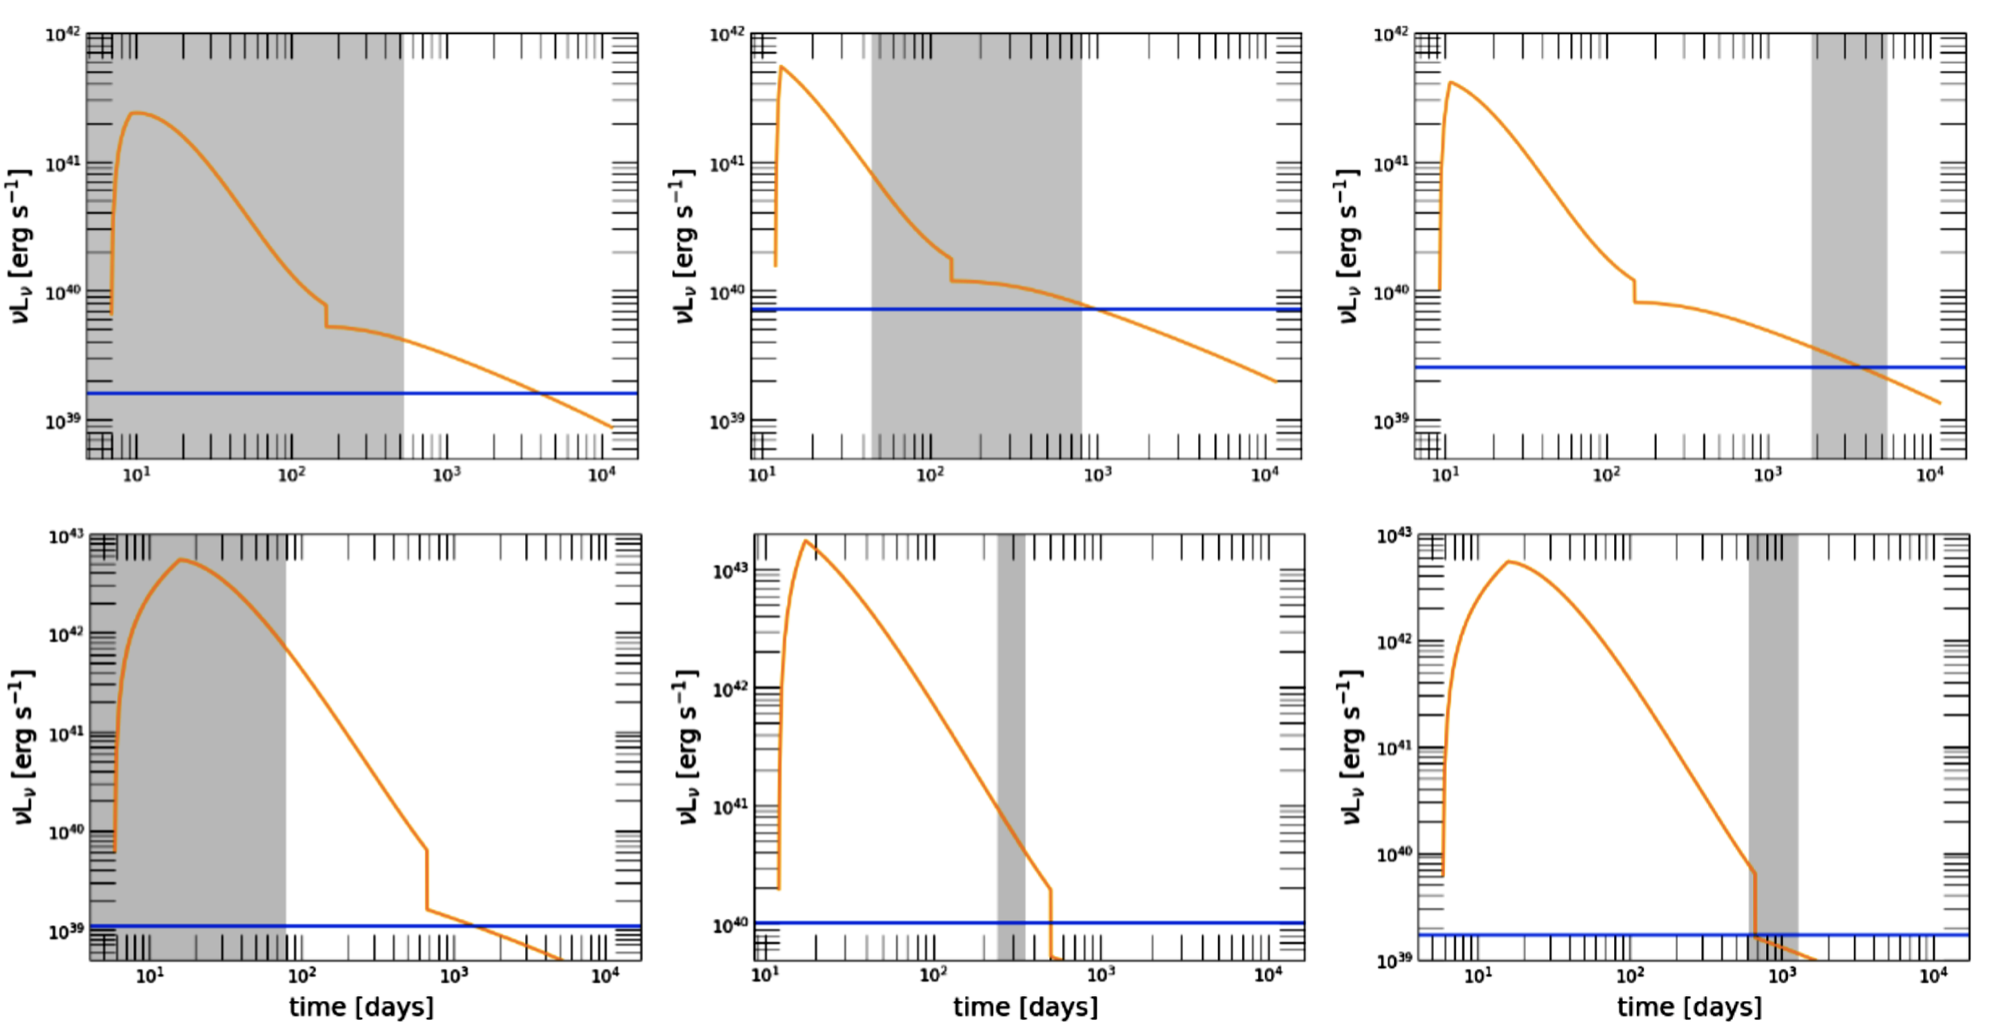
Our model predicts events for , respectively. Monte Carlo simulations of TDEs occurring randomly at the rate and observed for a timescale at the cadence of the NGVS confirm these basic estimates. Figure 8 shows the distribution of for our GC sample at varying , with the weaker windsdisk systems outshining the steady stellar component for longer timescales because of late time accretion. Figure 9 shows three examples of TDE mock detections in the Monte Carlo simulations, with the TDE light curve (the sum of the disk and wind components) compared to the steady stellar luminosity in the -band. In the figure, the total time span between the first and last epoch of cluster observation is shown as the gray region.
6 Summary and Discussion
We have conducted a pilot study to search for IMBHs in dense stellar systems, one that uses TDEs as a probe of the presence of black holes embedded in stellar cusps at the center of massive GCs. Following previous work, we have modelled the long super-Eddington accretion phase in the slim advective disk regime together with the accompanying adiabatically expanding radiation-driven outflow. The ensuing optical/UV flare easily outshines the brightness of the (old) stellar population of globulars for a period of months to years, making TDEs triggered by IMBHs in principle detectable in a large sample of GCs. The disruption rate of main-sequence stars as a function of black hole mass and GC properties was estimated with a simple model of loss-cone dynamics and the help of a numerical 1D Fokker-Planck approach.
Large surveys with precise multi-wavelength photometry are becoming increasingly available for public use. As an illustrative example, we have taken advantage of the NGVS, an optical-near IR imaging survey of the Virgo galaxy cluster, and of its robust sample of GCs observed in the - and -band. We have checked for the presence of large photometric variations in the -band induced by potential TDEs flares and found no obvious candidates. Since our model predicts as many as detectable events in the NGVS sample, the lack of recognizable candidates in the data implies that the fraction of GCs harboring IMBHs must be . This is not very constraining, as post-merger recoil kicks originated by anysotropic GW emission may make it hard for IMBHs to be retained in lower-dispersion parent clusters (e.g. Arca Sedda et al., 2023).
Naturally, better modeling of the properties of the cluster central stellar distribution and of TDE light curves and rates are all needed to gain deeper insights into the presence of IMBHs in GCs. Large samples of extra-galactic star clusters, like those that will be assembled by the Vera C. Rubin Observatory (Usher et al., 2023), should enable significant progress in the search for TDEs in dense stellar systems. While there are considerable uncertainties in the modeling of TDE events in GCs, we hope that our pilot investigation will provide a blueprint for future searches of optical flares triggered by IMBHs.
Acknowledgements
Support for this work was provided by NASA through grants 80NSSC21K027 and 80NSSC22K0814 (P.M.) and by a Eugene-Cota Robles Fellowship to V.T. E.B. acknowledges support from the European Research Council (ERC) under the European Union’s Horizon 2020 research and innovation program ERC-2018-CoG under grant agreement 818691 (B Massive), from the European Consortium for Astroparticle Theory in the form of an Exchange Travel Grant, and the European Union’s Horizon 2020 Programme under the AHEAD2020 project (grant agreement 871158). We acknowledge useful discussions on this project with Y. Feng, R. Guhathakurta, G. Lodato, and E. Rossi.
References
- Alexander & Hopman (2009) Alexander, T., & Hopman, C. 2009, ApJ, 697, 1861
- Arca Sedda et al. (2023) Arca Sedda, M., Kamlah, A. W. H., Spurzem, R., et al. 2023, MNRAS, 526, 429
- Bahcall & Wolf (1977) Bahcall, J. N., & Wolf, R. A. 1977, ApJ, 216, 883
- Baumgardt & Hilker (2018) Baumgardt, H., & Hilker, M. 2018, MNRAS, 478, 1520
- Baumgardt et al. (2004) Baumgardt, H., Makino, J., & Ebisuzaki, T. 2004, ApJ, 613, 1133
- Baumgardt et al. (2019) Baumgardt, H., He, C., Sweet, S. M., et al. 2019, MNRAS, 488, 5340
- Binney & Tremaine (1987) Binney, J., & Tremaine, S. 1987, Galactic dynamics
- Bortolas (2022) Bortolas, E. 2022, MNRAS, 511, 2885
- Bovy et al. (2011) Bovy, J., Hogg, D. W., & Roweis, S. T. 2011, Annals of Applied Statistics, 5, 1657
- Chen & Shen (2018) Chen, J.-H., & Shen, R.-F. 2018, ApJ, 867, 20
- Coughlin & Begelman (2014) Coughlin, E. R., & Begelman, M. C. 2014, ApJ, 781, 82
- Coughlin & Nixon (2019) Coughlin, E. R., & Nixon, C. J. 2019, ApJ, 883, L17
- Dotan & Shaviv (2011) Dotan, C., & Shaviv, N. J. 2011, MNRAS, 413, 1623
- Evans & Kochanek (1989) Evans, C. R., & Kochanek, C. S. 1989, ApJ, 346, L13
- Feldmeier et al. (2013) Feldmeier, A., Lützgendorf, N., Neumayer, N., et al. 2013, A&A, 554, A63
- Ferrarese et al. (2012) Ferrarese, L., Côté, P., Cuillandre, J.-C., et al. 2012, ApJS, 200, 4
- Fragione et al. (2018a) Fragione, G., Ginsburg, I., & Kocsis, B. 2018a, ApJ, 856, 92
- Fragione et al. (2018b) Fragione, G., Leigh, N. W. C., Ginsburg, I., & Kocsis, B. 2018b, ApJ, 867, 119
- Frank & Rees (1976) Frank, J., & Rees, M. J. 1976, MNRAS, 176, 633
- Giersz et al. (2015) Giersz, M., Leigh, N., Hypki, A., Lützgendorf, N., & Askar, A. 2015, MNRAS, 454, 3150
- Greene et al. (2020) Greene, J. E., Strader, J., & Ho, L. C. 2020, ARA&A, 58, 257
- Guillochon & Ramirez-Ruiz (2013) Guillochon, J., & Ramirez-Ruiz, E. 2013, ApJ, 767, 25
- Holley-Bockelmann et al. (2008) Holley-Bockelmann, K., Gültekin, K., Shoemaker, D., & Yunes, N. 2008, ApJ, 686, 829
- Ibata et al. (2009) Ibata, R., Bellazzini, M., Chapman, S. C., et al. 2009, ApJ, 699, L169
- Jordán et al. (2007) Jordán, A., McLaughlin, D. E., Côté, P., et al. 2007, ApJS, 171, 101
- Kamann et al. (2016) Kamann, S., Husser, T. O., Brinchmann, J., et al. 2016, A&A, 588, A149
- Kippenhahn & Weigert (1990) Kippenhahn, R., & Weigert, A. 1990, Stellar Structure and Evolution
- Kitaki et al. (2021) Kitaki, T., Mineshige, S., Ohsuga, K., & Kawashima, T. 2021, PASJ, 73, 450
- Kochanek (2016) Kochanek, C. S. 2016, MNRAS, 461, 371
- Law-Smith et al. (2020) Law-Smith, J. A. P., Coulter, D. A., Guillochon, J., Mockler, B., & Ramirez-Ruiz, E. 2020, ApJ, 905, 141
- Lightman & Shapiro (1977) Lightman, A. P., & Shapiro, S. L. 1977, ApJ, 211, 244
- Lin et al. (2018) Lin, D., Strader, J., Carrasco, E. R., et al. 2018, Nature Astronomy, 2, 656
- Lodato et al. (2009) Lodato, G., King, A. R., & Pringle, J. E. 2009, MNRAS, 392, 332
- Lodato & Rossi (2011) Lodato, G., & Rossi, E. M. 2011, MNRAS, 410, 359
- Lu & Bonnerot (2020) Lu, W., & Bonnerot, C. 2020, MNRAS, 492, 686
- Lützgendorf et al. (2013) Lützgendorf, N., Kissler-Patig, M., Neumayer, N., et al. 2013, A&A, 555, A26
- Magorrian & Tremaine (1999) Magorrian, J., & Tremaine, S. 1999, MNRAS, 309, 447
- Mei et al. (2007) Mei, S., Blakeslee, J. P., Cote, P., et al. 2007, The Astrophysical Journal, 655, 144
- Merritt (2004) Merritt, D. 2004, in Coevolution of Black Holes and Galaxies, ed. L. C. Ho, 263
- Metzger & Stone (2016) Metzger, B. D., & Stone, N. C. 2016, MNRAS, 461, 948
- Miller & Davies (2012) Miller, M. C., & Davies, M. B. 2012, ApJ, 755, 81
- Miller & Hamilton (2002) Miller, M. C., & Hamilton, D. P. 2002, MNRAS, 330, 232
- Mockler et al. (2019) Mockler, B., Guillochon, J., & Ramirez-Ruiz, E. 2019, ApJ, 872, 151
- Muñoz et al. (2014) Muñoz, R. P., Puzia, T. H., Lançon, A., et al. 2014, ApJS, 210, 4
- Nguyen et al. (2019) Nguyen, D. D., Seth, A. C., Neumayer, N., et al. 2019, ApJ, 872, 104
- Ohsuga et al. (2005) Ohsuga, K., Mori, M., Nakamoto, T., & Mineshige, S. 2005, ApJ, 628, 368
- Portegies Zwart & McMillan (2002) Portegies Zwart, S. F., & McMillan, S. L. W. 2002, ApJ, 576, 899
- Ramirez-Ruiz & Rosswog (2009) Ramirez-Ruiz, E., & Rosswog, S. 2009, ApJ, 697, L77
- Rees (1988) Rees, M. J. 1988, Nature, 333, 523
- Rossi et al. (2021) Rossi, E. M., Stone, N. C., Law-Smith, J. A. P., et al. 2021, Space Sci. Rev., 217, 40
- Roth et al. (2020) Roth, N., Rossi, E. M., Krolik, J., et al. 2020, Space Sci. Rev., 216, 114
- Ryu et al. (2020) Ryu, T., Krolik, J., & Piran, T. 2020, ApJ, 904, 73
- Spitzer (1987) Spitzer, L. 1987, Dynamical evolution of globular clusters
- Stone & Metzger (2016) Stone, N. C., & Metzger, B. D. 2016, MNRAS, 455, 859
- Strubbe & Quataert (2009) Strubbe, L. E., & Quataert, E. 2009, MNRAS, 400, 2070
- Strubbe & Quataert (2011) —. 2011, MNRAS, 415, 168
- Syer & Ulmer (1999) Syer, D., & Ulmer, A. 1999, MNRAS, 306, 35
- Tremou et al. (2018) Tremou, E., Strader, J., Chomiuk, L., et al. 2018, ApJ, 862, 16
- Usher et al. (2023) Usher, C., Dage, K. C., Girardi, L., et al. 2023, PASP, 135, 074201
- Vasiliev (2017) Vasiliev, E. 2017, ApJ, 848, 10
- Vitral & Mamon (2021) Vitral, E., & Mamon, G. A. 2021, A&A, 646, A63
- Wang & Merritt (2004) Wang, J., & Merritt, D. 2004, ApJ, 600, 149
- Webb et al. (2012) Webb, N., Cseh, D., Lenc, E., et al. 2012, Science, 337, 554
- Wen et al. (2021) Wen, S., Jonker, P. G., Stone, N. C., & Zabludoff, A. I. 2021, ApJ, 918, 46
- Wu et al. (2018) Wu, S., Coughlin, E. R., & Nixon, C. 2018, MNRAS, 478, 3016
- Zhao (1996) Zhao, H. 1996, MNRAS, 278, 488
- Zocchi et al. (2019) Zocchi, A., Gieles, M., & Hénault-Brunet, V. 2019, MNRAS, 482, 4713