– J-PARC HEF K1.8 BEAM LINE GROUP TECHNICAL REPORT –
Anti-deuteron beam study at J-PARC HEF K1.8 beam line
M. Ukai1,2, Y. Ishikawa2, T. Takahashi1, K. Tanida3 and T. O. Yamamoto3
1 Institute of Particle and Nuclear Studies, High Energy Accelerator Research Organization (KEK), Tsukuba, Ibaraki 305-0801, Japan
2 Department of Physics, Tohoku University, Sendai, Miyagi 980-8578, Japan
3 Advanced Science Research Center, JAEA, Tokai, Ibaraki 319-1195, Japan
(Dataed: December 19, 2023)
Abstract
We performed a beam study at the K1.8 beam line of J-PARC Hadron Experimental Facility. 1.8 GeV/ beam yield was measured to be 0.30 0.04 counts/spill for 30 GeV 70 protons/spill irradiated on a 66 mm thick of gold target with the vertical slit opening widths of 2.2 mm, 5 mm and 5 mm for intermediate focus (IFV), mass slit 1 (MS1) and 2 (MS2), respectively. Corresponding beam yield is roughly estimated to be 0.3 Mcounts/spill for the same slit condition. Then, the production ratio at extraction angle of 6 degrees is estimated to be . This is the first time measurement of the beam yield and production ratio at J-PARC. Further beam line tuning may increase the beam yield.
1 Overview
The K1.8 beam line in the J-PARC Hadron Experimental Facility (HEF) is a secondary beam line to deliver mass-separated secondary particles at maximum momentum of 2 GeV/ produced by a high-intensity proton beam from the Main Ring Synchrotron (MR). Using meson beams such as and pions, strangeness nuclear physics experiments are mainly conducted. Use of other particle beams will extend our research fields and ability of HEF. is one of the interesting beam particles. Well controlled beam is useful in particle and nuclear physics research. However, production cross section data of are insufficient to estimate beam intensity at secondary beam lines.
We performed a 1.8 GeV/ beam study in May 2021 as the first trial of the beam mode at the K1.8 beam line. It was performed during the MR beam stability check period (3 hrs) in a one-day interval of the E42 experiment running at the K1.8 beam line.
2 Experimental setup
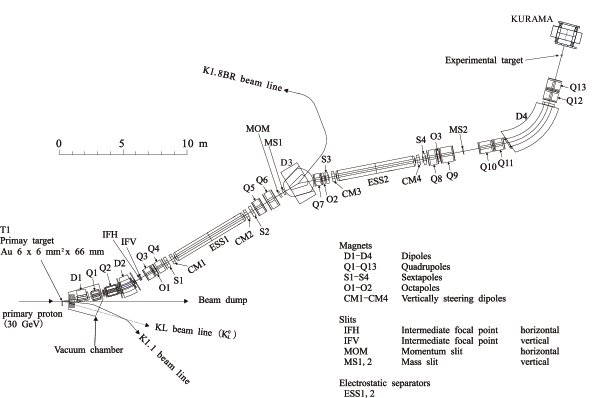
K1.8 beam line and experimental area
The K1.8 beam line is a general-purpose mass-separated beam line that can supply secondary charged hadron beams of , , and up to 2.0 GeV/ PTEPk18 . The layout of the K1.8 beam line elements is shown in Fig. 1. Secondary particles are produced at a primary target (T1) by irradiating 30 GeV protons from the MR. The current T1 target installed in 2019 is made of gold with a thickness of 66 mm, which corresponds to a 50% beam loss. In this study, the primary proton intensity on the T1 target was protons/spill. The primary proton beam conditions in the present study are summarized in Table 1. The primary proton beam profile on the T1 target is also shown in Table 2.
| Acc. run# | Proton energy | MR power | Protons/spill | Repetition | Spill length |
|---|---|---|---|---|---|
| 87 | 30 GeV | 64 kW | 70 | 5.2 s | 2.06 s |
| Mean(X) | Mean (Y) | Sigma(X) | Sigma (Y) |
|---|---|---|---|
| 0.95 mm | 0.33 mm | 2.9 mm | 1.9 mm |
| Maximum momentum | 2.0 GeV/ |
|---|---|
| Primary target (T1) | Au 66-mm thickness |
| (from 2019 fall) | |
| Extraction angle | 6 deg. |
| Momentum bite | 3% |
| Beam line length | 46 m |
Figure 1 shows the schematic view of the K1.8 beam line. Specifications of the K1.8 beam line and the T1 target are summarized in Table 3. The extraction angle of the K1.8 beam line is 6 degrees. The beam line consists of 4 sectors; extraction part from the T1 to the intermediate focus (IF) point, two stages of electrostatic mass separators (from IF to mass slit 1 (MS1) and MS1 to MS2), and momentum analyzer. At the intermediate focus point, the beam is vertically focused in order to eliminate unwanted particles such as cloud pions from decay. Each electrostatic separator (ESS) with a 6 m long and 10 cm gap is located between correction magnets (CM) which are vertical bending dipole magnets. In addition, mass slits (MS) are located downstream of CM2 and CM4. Owing to these systems, a high-purity kaon beam can be delivered to the K1.8 experimental area.
In this study, the beam momentum of 1.8 GeV/ was chosen because it is well-studied and the standard momentum at the K1.8 beam line. IFV opening width was set to 2.2 mm ( mm) to keep the same value as the E42 condition. ESS1 was set to 150 kV and ESS2 was OFF, while both ESS1 and ESS2 were operated with 250 kV in the E42 run for beam. Then, currents of CM1 and CM2 were tuned for corresponding values for and , and CM3 and CM4 were OFF. CM1 and CM2 currents were set to the same value without offset setting. Currents of K1.8 beam line magnets, except for CMs, were set to the same values as the E42 beam settings (1.8 GeV/) optimized to the ESS1/ESS2 = 250 kV operation.
| K1.8D1 current | momentum | beam polarity | ESS1 | ESS2 | KURAMA |
|---|---|---|---|---|---|
| A | 1.8 GeV/ | negative | 150 kV | OFF | OFF |
K1.8 detectors
Figure 2 shows the schematic view of the K1.8 experimental area. Beam particles were identified by threshold-type aerogel Cherenkov counter (BAC) in the on-line trigger and Time-of-Flight counters (BH1, BH2 and TOF) in the off-line analysis. BH2 is the time-zero counter for all detectors. Specifications of these counters are summrized in Table 5. Path lengths between BH1-BH2 (BTOF) and BH2-TOF (STOF) are 10.2 m and 4.1 m, respectively. BFT (plastic scintillation fiber tracker) and BC3, 4 (drift chamber) were also used to check the beam momentum and profile.
| Detector | Effective area | Segmentation | Path length |
| W H T [mm3] | from BH2 [m] | ||
| BH1 | 11 | 10.2 (BTOF length) | |
| BAC | 1 | ||
| BH2 | 8 | – | |
| TOF | 24 | 4.1(STOF length) |
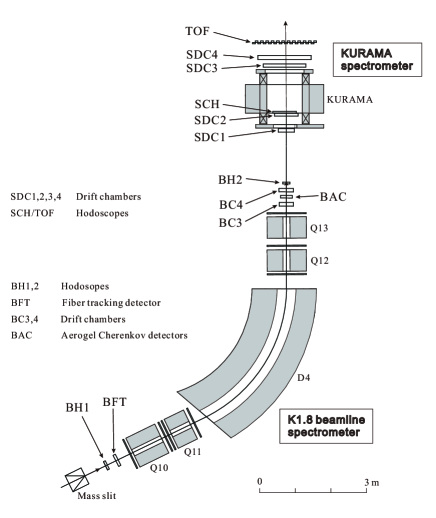
Table 6 shows the velocities, relative energy deposit and corresponding BTOF/STOF timing of each beam particle for measured average momentum of 1.82 GeV/ with K1.8D1 = 721 A setting. The relative energy deposit () values are calculated by the Bethe-Bloch equation normalized to that of the . timing is calibrated to be 0 ns in the BTOF/STOF histograms. Then, time differences from (Tdiff) are also shown. In addition, time differences caused by the measured momentum dispersion of % are also shown.
| mass | BTOF | (5%) | Tdiff | STOF | Tdiff | |||
|---|---|---|---|---|---|---|---|---|
| [GeV/] | [a.u.] | [ns] | [ns] | [ns] | [ns] | [ns] | ||
| 0.1396 | 0.9971 | 1 | 34.124 | – | 13.716 | – | ||
| 0.4937 | 0.9651 | 0.93 | 35.253 | 1.230 | 14.170 | 0.454 | ||
| 0.9383 | 0.8888 | 1.01 | 38.279 | 4.156 | 15.387 | 1.670 | ||
| 1.8757 | 0.6964 | 1.49 | 48.858 | 14.735 | 19.639 | 5.923 |
Run summary
In the present study, data for three CM current conditions corresponding to , and beam settings were acquired. and beam data were taken for time calibration of BTOF and STOF distributions. Table 7 shows the run summary. Slit conditions in the beam run (RUN#5388) and beam run (RUN#5390) were the same except for MS1, 2. IFH, MS1 and MS2 widths of beam run (RUN#5392) were 30 mm, 0.5 mm and 0.45 mm, respectively. IFV condition was the same.
| RUN # | Run setting | CM1, 2 | MS1, 2 | Trigger | Prescale | DAQ eff. | Spill |
|---|---|---|---|---|---|---|---|
| 5388 | beam | 332 A | 2.5 mm | BH2 | 1/2 | 98% | 326 |
| 5390 | beam | 259 A | 0.7 mm | BH2 | 81 | ||
| 5392 | beam | 227 A | BH2 | 79 |
3 Anti-deuteron beam study
Since CM current value is basically proportional to of beam particles, 332 A was set for CM1 and CM2 as the beam setting estimated from 259 A which was the optimized value for the beam setting as described in Sec. 4. Though the best CM currents may be slightly off from the estimated one using , CM1, 2 currents were not scanned but fixed due to the limit of the study time. In addition, from the previous K1.8 beam line study, the offset value of CM current was known to be non-zero to maximize the beam yield but was omitted here. The offset value of CM current is described in Appendix B. Slits, ESSs and CMs conditions for this study are summarized in Table 8.
| IFV | IFH | MOM | MS1/MS2 | ESS1 | ESS2 | CM1/CM2 | CM3/CM4 |
| mm | mm | mm | mm | kV | kV | A | A |
| 120 | 180 | 2.5/2.5 | 150 | 0 | 332 | 0 |
BH2 trigger data were acquired for 30 min (326 spills). BH2 rate was 4.2 kcounts/spill. To keep DAQ efficiency at 100%, 1/2 prescale was applied to the trigger. Counting rates of each counter are summarized in Table 9.
| BH1 | BH2 | BAC | TOF | BH2 |
| 607k | 367k | 443k | 511k | 4.2k |
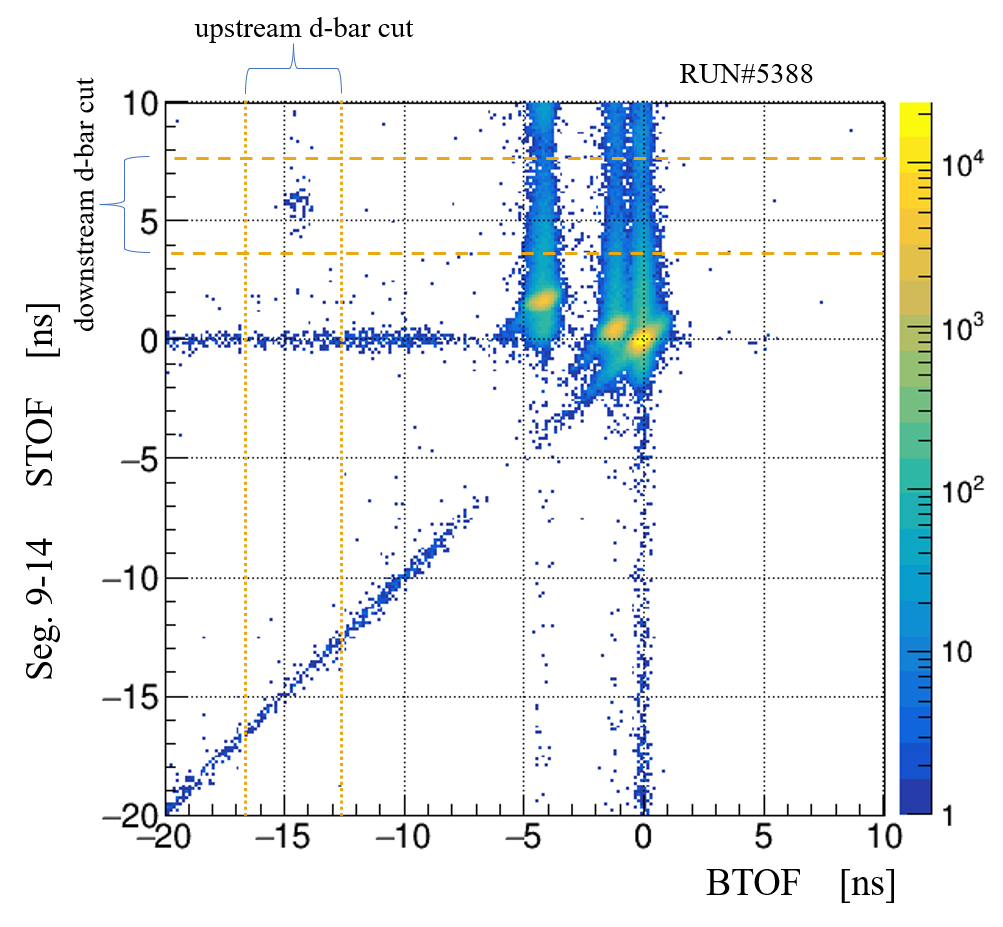
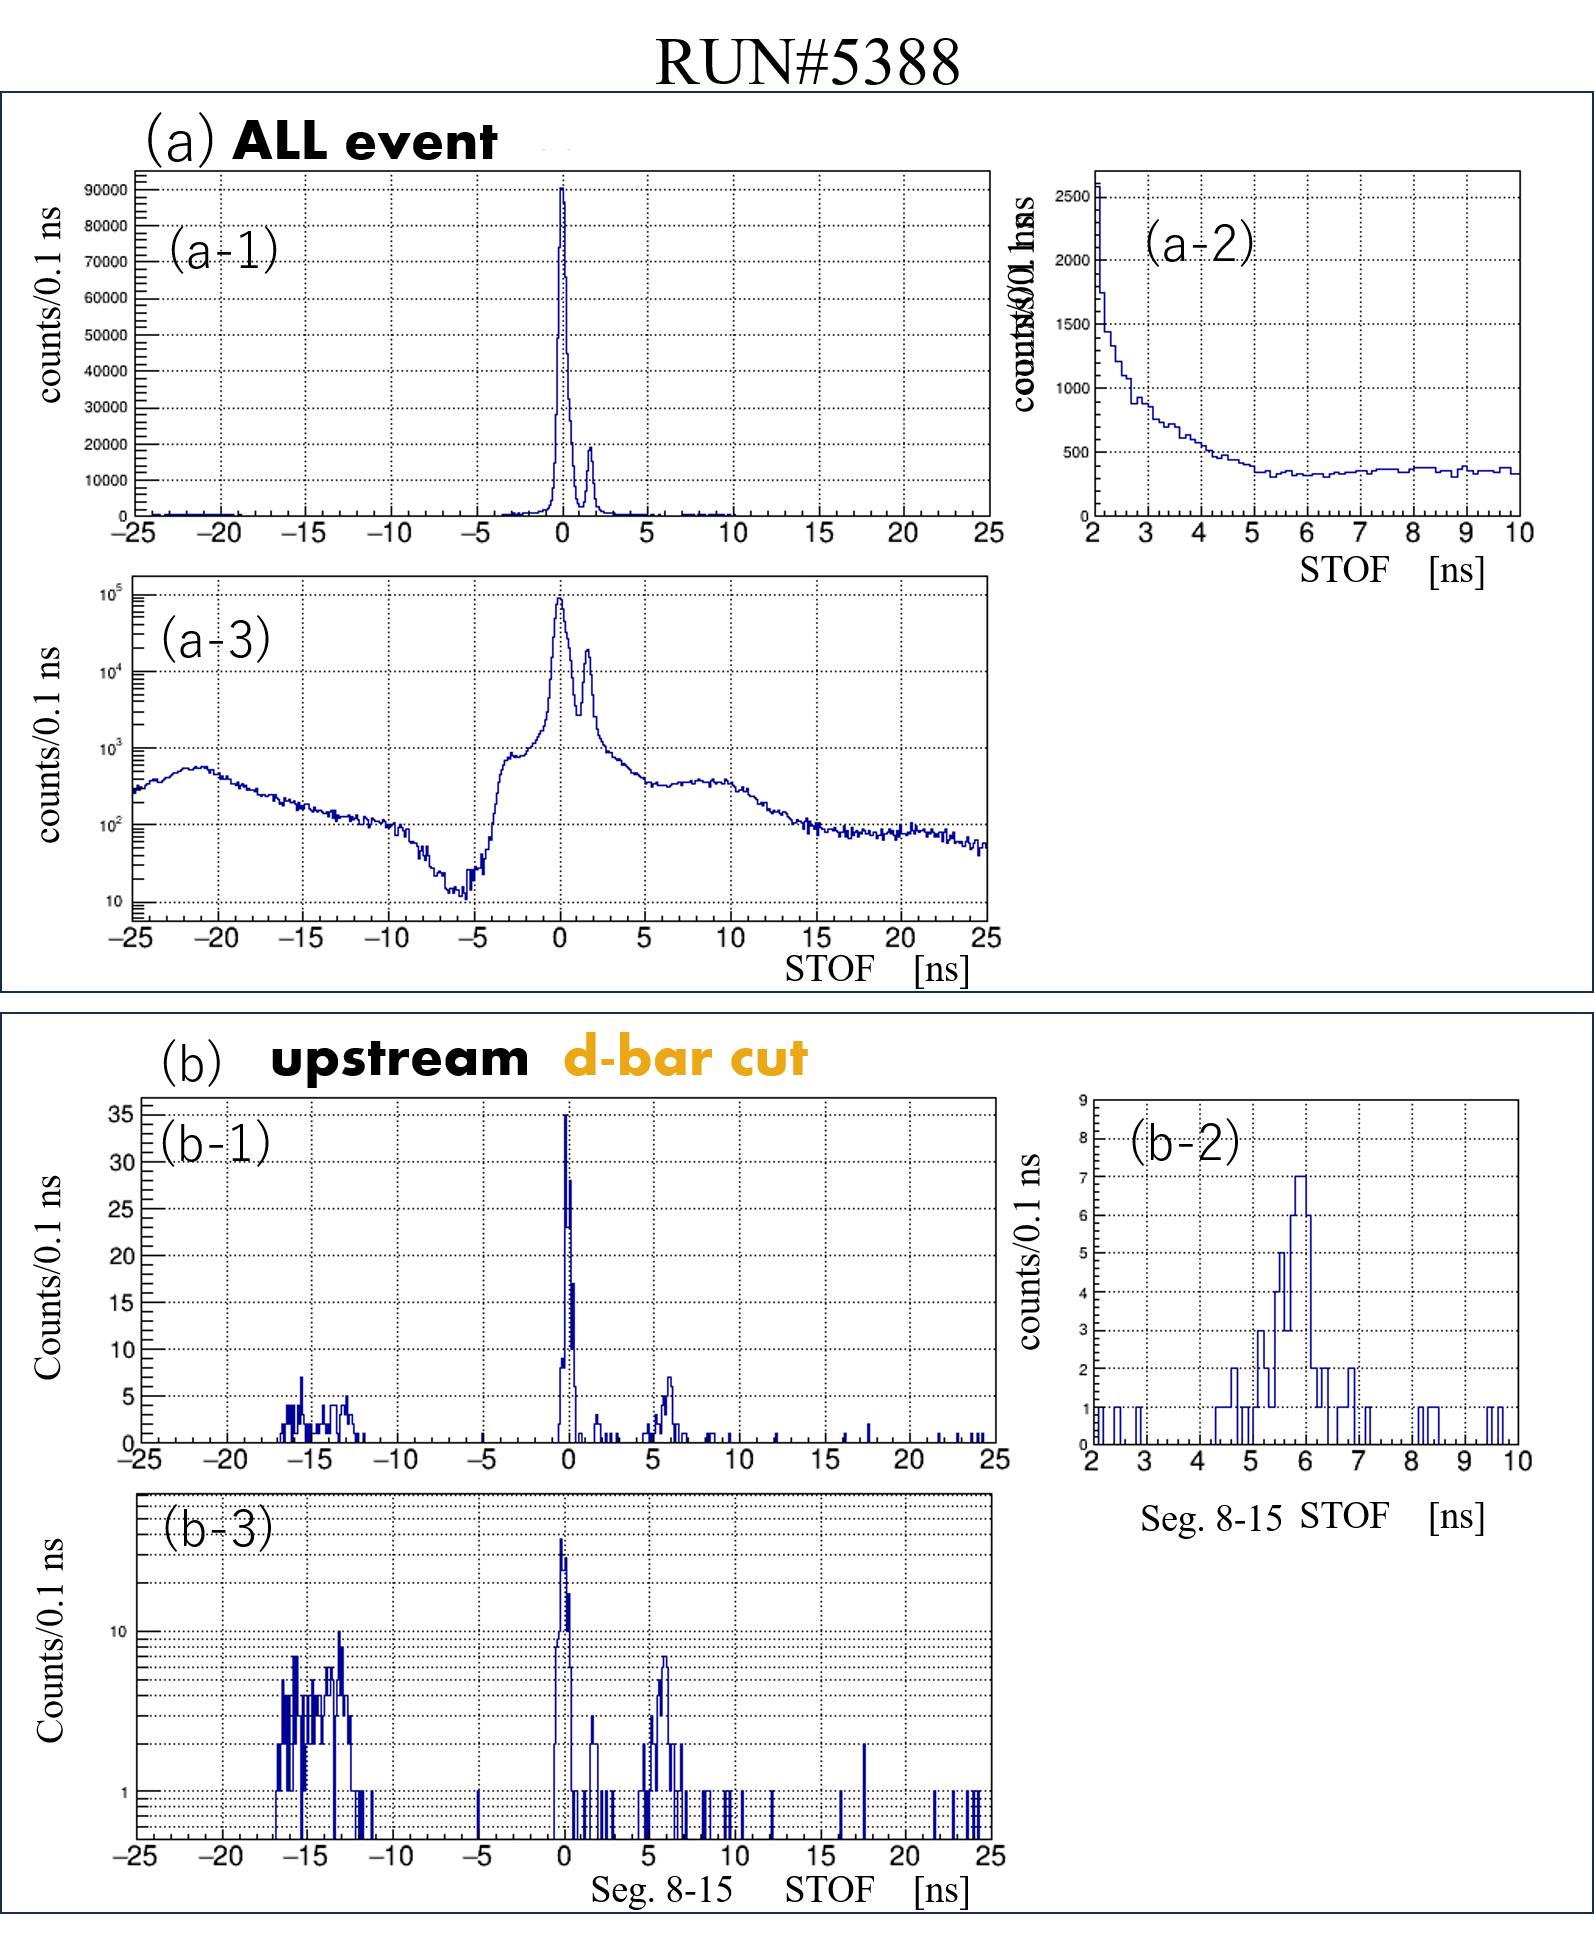
Due to the large accidental background, no clear peak around the timing was observed in both BTOF and STOF time distribution for the BH2 trigger data. Then, timing cuts were applied as follows,
-
•
Upstream cut: < BTOF < ns & number of BH1 cluster = 1,
-
•
Downstream cut: 3.9 < STOF < 7.9 ns & TOF hit segment 8–15.
The time gate of 2 ns was determined from the peak widths of 0.2 ns() for BTOF and STOF and measured momentum distribution ( %) as shown in Table 6.
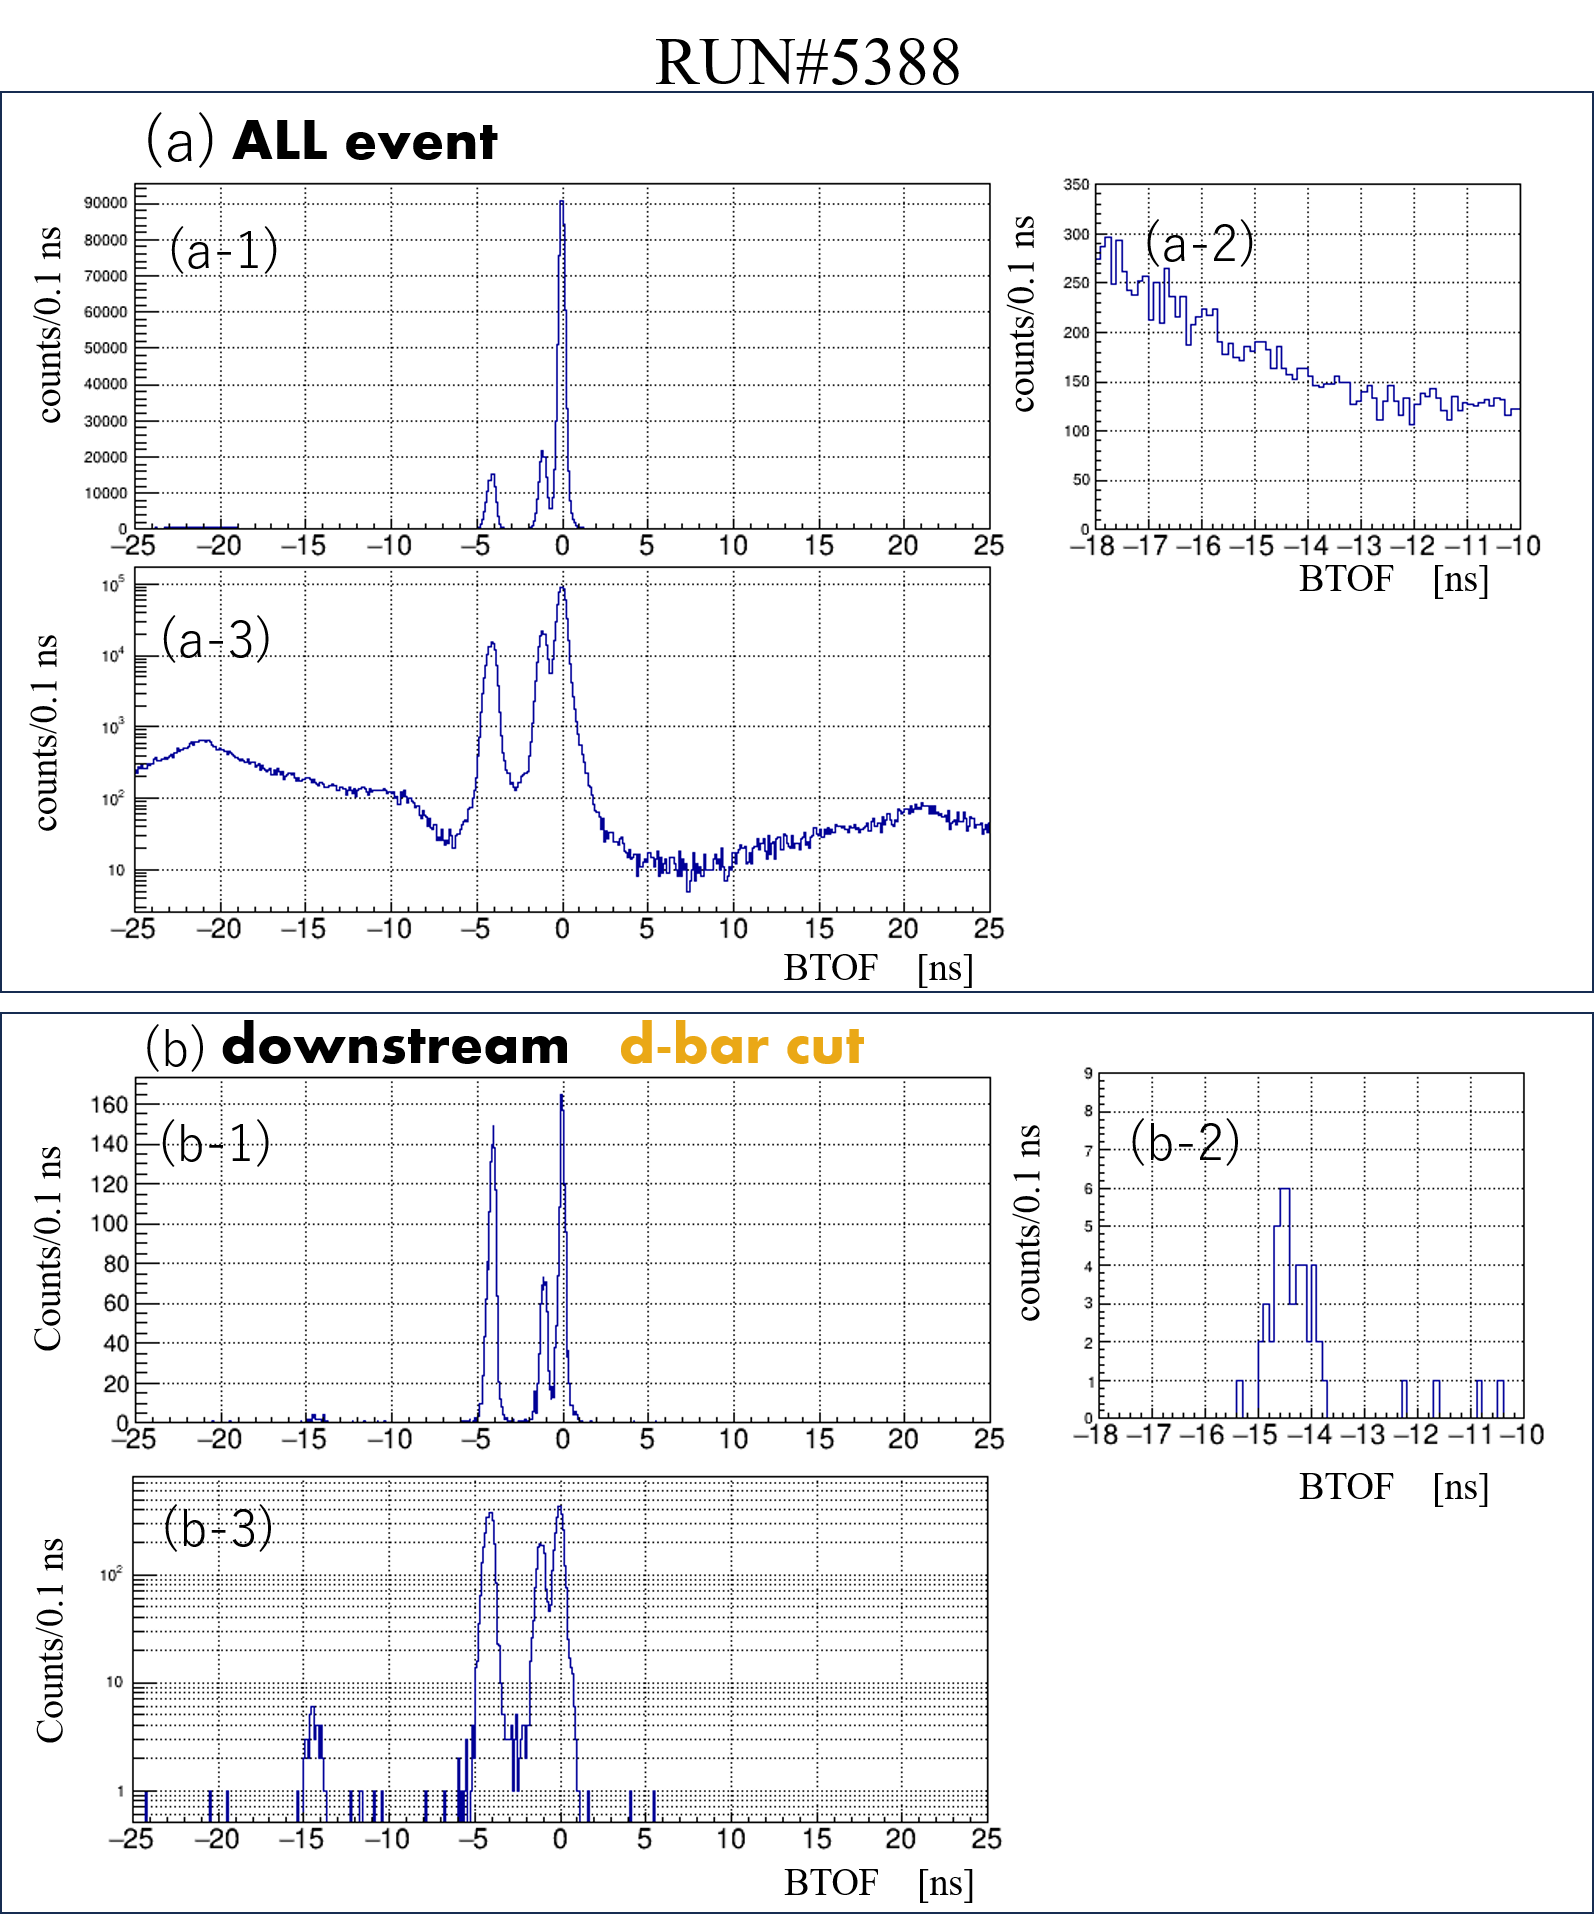
Figure 3 show the correlation between BTOF and STOF. Timing gates for the upstream cut (dotted lines) and downstream cut (dashed lines) are also shown. Figure 4 shows the BTOF distribution for all events in (a) , and those with downstream cut in (b). In Fig. 4(b), in the case of the coincidental hits of staggered segments, only one of the pairs is included in the histogram. As shown in Fig. 4(b), a peak structure at the timing was found with 45 counts. In addition, Fig. 5 shows the STOF distribution for all event in (a), and for events with upstream cut and TOF segment to be 8 – 15 in (b). In Fig. 5(b), coincidental hits of staggered TOF segments are included both of the pair hits. For both Figs. 4 and 5 , (a-2) and (b-2) are enlarged histogram around the timing and (a-3) and (b-3) are log scale of (a-1) and (b-1), respectively. In Fig. 5(b), structure around 15 ns in the STOF distribution corresponds to events of accidental beam enhanced by the BTOF cut of – ns.
Taking into account the trigger prescale factor (0.5), DAQ efficiency (0.98) and BH1 multiplicity cut efficiency (0.93), the beam yield for 361 spills was obtained to be 99 15 counts using the result of Fig. 4(d). Then, the beam yield at the K1.8 beam line is obtained to be 0.30 0.04 counts/spill for the primary beam of 30 GeV protons/spill irradiated on the 66-mm thick Au target. Since the beam line magnets were not well tuned for this ESS condition as described in Appendix B, a higher beam yield is expected with further study.
Figures 7 and 7 show the momentum distributions and hit pattern of TOF counter for (a) beam and (b) beam timing events taken from RUN#5388 and RUN#5390, respectively.
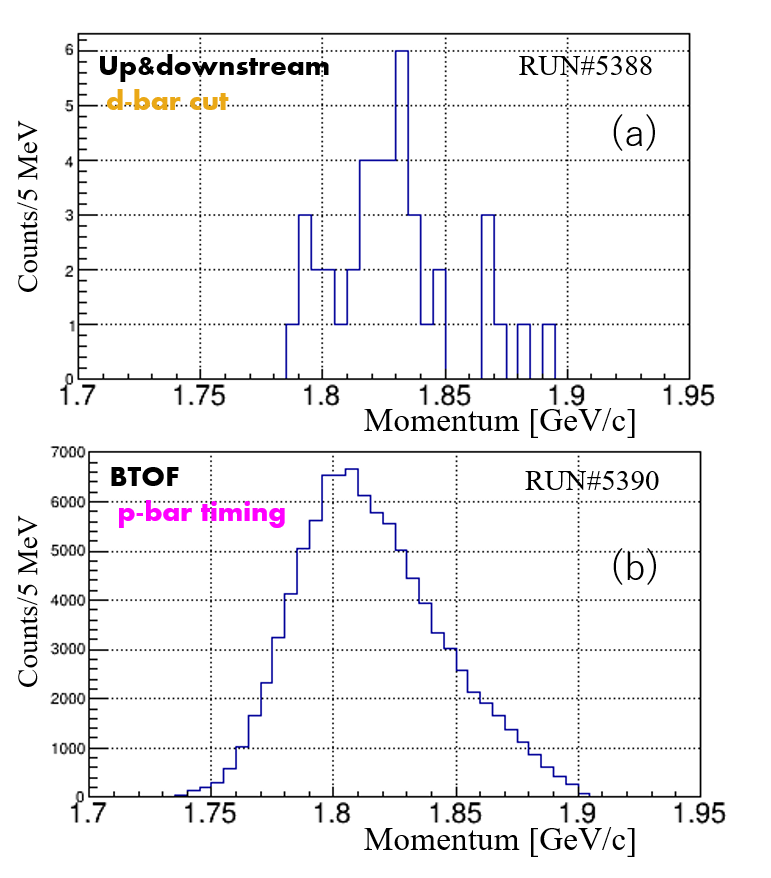
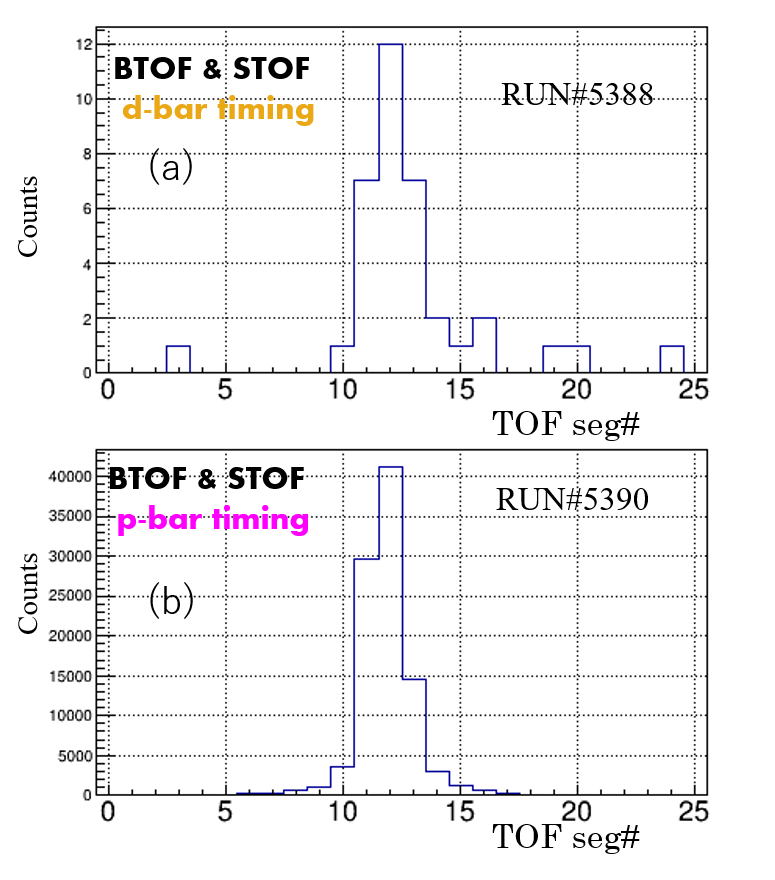
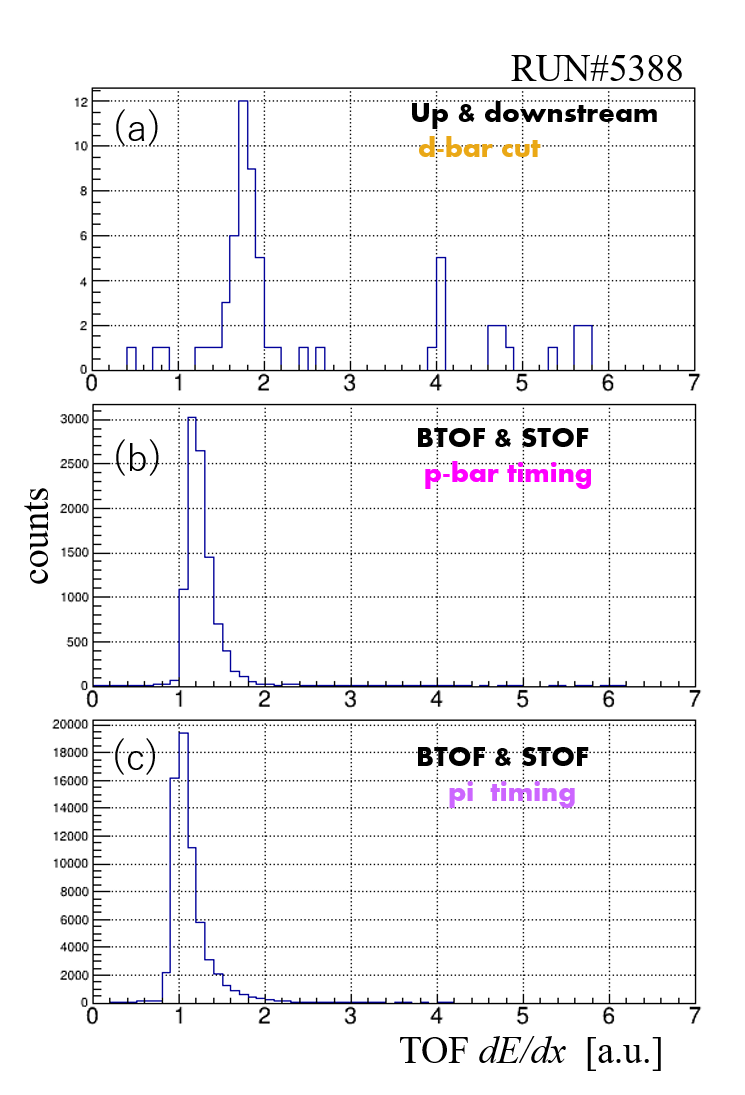
Figure 8 shows the relative energy deposit () spectra of TOF counter (segment # 8 – 15) for (a) , (b) and (c) timing events selected using BTOF and STOF information. In these spectra, the peak for beam (RUN# 5392) is calibrated to be 1. Fit results of these peak positions are 1.8 0.2, 1.2 0.1 and 1.0 0.1, respectively. The measured ratio between (a) and (b) of 1.5 confirms that the observed events are identified as particles.
4 Anti-proton beam study and expected yield
Prior to the beam data acquisition, beam tuning was performed with narrow slit conditions to optimize the CM current for beam using the visual scaler. After the beam data was acquired, the CM current settings were return to the beam setting, then its data were acquired. Slits, ESS and CM conditions are summarized in Table 10.
| IFV | IFH | MOM | MS1/MS2 | ESS1 | ESS2 | CM1/CM2 | CM3/CM4 |
| mm | mm | mm | mm | kV | kV | A | A |
| 120 | 180 | 0.7/0.7 | 150 | 0 | 259 | 0 |
To optimize beam line parameters for the beam setting, CM1 and CM2 currents were scanned to maximize the scaler counts of BH2 as beam yield. Then, the maximum beam yield was obtained with CM1, 2 = 259 A. After the beam tuning, MS1, 2 and CM1, 2 current settings were changed to beam mode, and after that, MS1, 2 and CM1, 2 setting were returned to beam setting to take the BH2 trigger data as the beam setting. The counting rates of counters for RUN#5390 are summarized in Table 11. From the BTOF distribution, 95% of BH2 triggers were found to be beam. Then, the beam yield for MS1, 2 = 0.7 mm was estimated to be 95 kcounts/spill. beam yield ratio between MS1, 2 = 2.5 mm and MS1, 2 = mm is roughly estimated to be 2.6 3.0 as described in Appendix A. The beam yield for MS1, 2 = 2.5 mm was roughly estimated to be 0.3 Mcounts/spill.
| BH1 | BH2 | BAC | TOF | BH2 |
| 796k | 377k | 377k | 564k | 100k |
5 Anti-deuteron/anti-proton production ratio
The beam yield was obtained to be 0.30 0.04 counts/spill as described in Sec. 3. Corresponding beam yield was roughly estimated to be 0.3 Mcounts/spill. Then, the / production ratio for 30 GeV proton irradiated on an Au target at 6 degree extraction angle was obtained to be the order of .
6 Prospect of anti-deuteron beam yield
In this study, the beam yield was estimated to be 0.3 Mcounts/spill for ESS1 = 150 kV and ESS2 = OFF with MS1, 2 = 2.5 mm. However, assuming the / ratio to be 0.7 1 as described in Appendix B, beam yield is expected to be 0.7 1 Mcounts/spill for ESS1, 2 = 250 kV with MS1, 2 = 2.5 mm. This is because that the beam line magnet parameters were not optimum for the present study but for ESS1, 2 = 250 kV with non-zero CM offset condition. Then, the beam yield is expected to also increase by 2.3 3.3 times. In addition, the IFV width of 2.2 mm was narrower than the primary proton beam profile at the T1 target of 1.9 mm (). If the vertical profile on the IF point is 1.9 mm(), only 43% of the beam can pass through the IFV width of 2.2 mm. Then, the yield is expected to increase by 2 times for wider IFV width. However, such wide IFV width causes a huge background. To get more beam intensity with lower background contamination, detailed beam line tuning is necessary. In addition, to estimate a realistic gain factor of beam yield, the beam line simulation using such as TURTLE code should be performed.
7 Summary
We performed the beam study at the K1.8 beam line. As the result, 1.8 GeV/ beam yield was measured to be 0.30 0.04 counts/spill for 30 GeV 70 protons/spill irradiated on a 66 mm thick Au target at the the extraction angle of 6 degrees. In this study, the vertical slit (IFV, MS1 and MS2) opening widths were set to 2.2 mm, 5 mm and 5 mm, respectively. Corresponding beam yield is roughly estimated to be 0.3 Mcounts/spill for the same slit condition. Then, the / production ratio at 6 degrees is estimated to be . This is the first time we have measured the beam yield and / production ratio at J-PARC. Further beam line tuning may increase the beam yield.
Appendix A Beam yield vs MS 1, 2 opening width
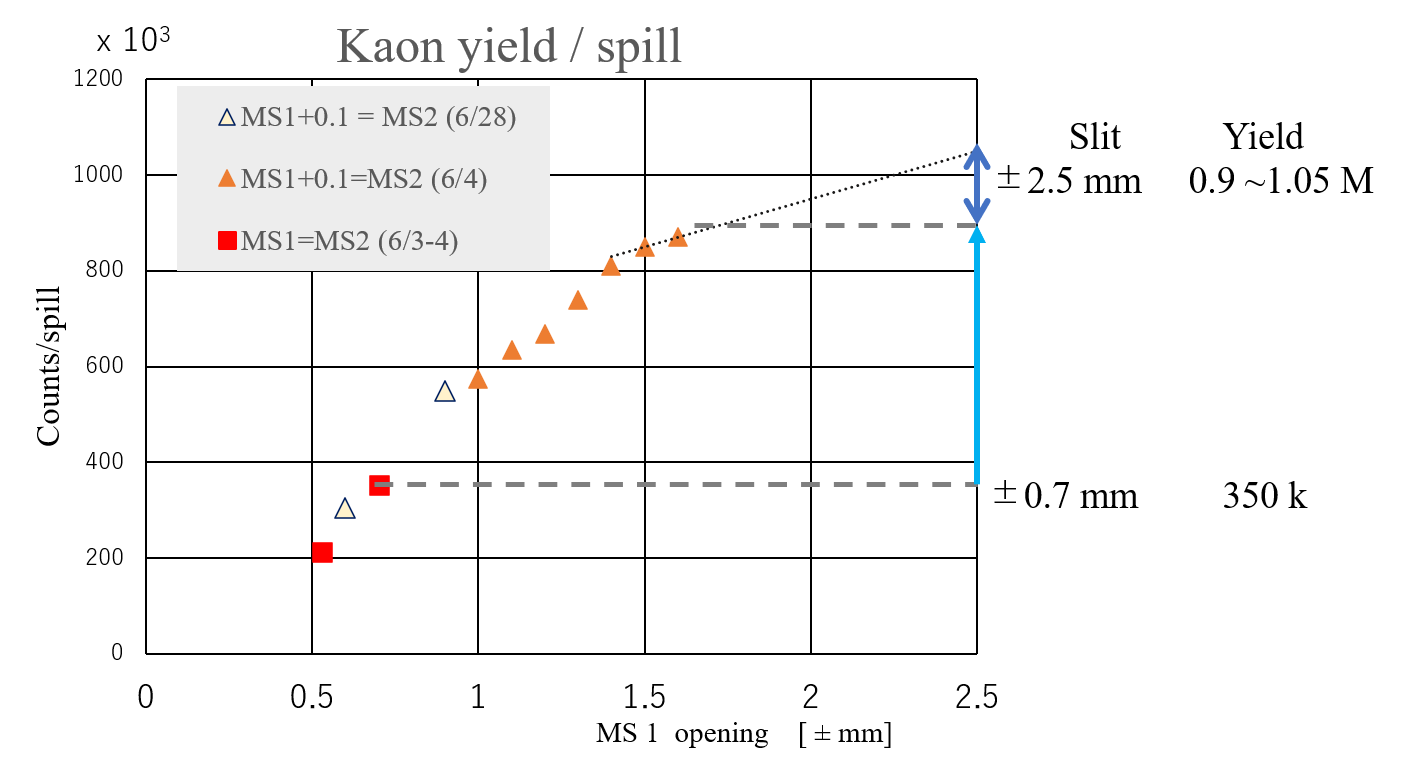
Mass slit width dependence of 1.8 GeV/ beam yield was measured for the E42 physics run in the same MR cycle with the same MR power (70 protons/spill). The results are summarized in Fig. 9. The Slit, ESS and CM conditions are summrized in Table 12. Since beam line magnet conditions were well tuned for physic data taking of the E42 experiment, the result shows the best values of beam yield.
As shown in Fig. 9, the beam yield seems to be saturating at MS1 width of 1.5 mm for IFV width of 2.2 mm. By assuming linear extrapolation from MS1 = 1.5mm and 1.6 mm yield, 1.05 Mcounts/spill for MS1 = 2.5 mm was obtained at the maximum. Then, the yield is estimated to be 0.9 1.05 Mcounts/spill for MS1, 2 = 2.5 mm. The beam yield ratio between MS1, 2 = 2.5 mm and 0.7 mm is 2.6 3.0. Therefore, the beam yield for MS1, 2 = 2.5 mm is estimated to be 0.3 Mcounts/spill from measured yield of 95 kcounts/spill for MS1, 2 = 0.7 mm in RUN#5390.
| IFV | IFH | MOM | MS1/MS2 | ESS1 | ESS2 | CM1/CM2 | CM3/CM4 |
| mm | mm | mm | mm | kV | kV | A | A |
| 120 | 180 | –/– | 250 | 250 | 402/380 | 421/349 |
Appendix B Estimation of optimized beam yield from / ratio
A systematic study of beam and beam tuning was performed after the T1 target exchange period in 2019 as summarized in Table 13. Firstly, center values of CM1, 2 or CM3, 4 currents were scanned for (A and B). After that, the offset values of CM1, 2 and CM3, 4 currents were scanned (C). (e.g. The offset value is 10 A for CM1, 2 of 435 A/415 A in (C) compared to the center value of 425 A in (B).) Then, the gain of the beam yield with CM offset was found to be 1.2 (B C). The beam yield was obtained to be 170k for MS1, 2 = 0.5 mm as shown in E. Even we did not take a directly comparable data for and beams with the same slit condition and CM offset at that time, the beam yield can be estimated to be 162k (A 1.2) which is comparable with the beam yield of 170k (E). In addition, a beam yield comparison was made with the same slit condition in 2015 as shown in Table 14. Then, the and beam yields were measured to be 75k and 62k, respectively. From these results, we concluded that the / beam ratio is roughly 1.
On the other hand, using the Sangford-Wang parameterization SW with kinematical reflection factor, the / yield ratio is estimated to be 0.7 which is in agreement with our conclusion based on measurements.
Since the beam yield for MS2 = 0.7 mm was measured to be 350 kcounts/spill as shown in Fig. 9 for well tuned condition, the beam yield is also expected to be 245 350 kcounts/spill with the same condition using the ratio of .
| MS1 | MS2 | CM1/CM2 | CM3/CM4 | |||
|---|---|---|---|---|---|---|
| mm | mm | A | A | counts/spill | counts/spill | |
| A | 425 | 415 | 135k | |||
| B | 425 | 415 | 264k | |||
| C | 435/415 | 444/384 | 318k | |||
| D | 435/415 | 444/384 | (162 k) | |||
| E | 400/380 | 415/351 | 170k |
| MS1 | MS2 | CM1/CM2 | CM3/CM4 | |||
|---|---|---|---|---|---|---|
| mm | mm | A | A | counts/spill | counts/spill | |
| 439 | 414 | 75k | ||||
| 405 | 380 | 62k |
References
- (1) K. Agari, et al., Progress of Theoretical and Experimental Physics, Volume 2012, Issue 1, 2012, 02B009.
- (2) M. Saito et al., Phys. Rev.Accel. Beams 25, 063001, 2022. 2021/6/3–4.
-
(3)
A. Yamamoto KEK Report 81-13,
https://lib-extopc.kek.jp/preprints/PDF/1981/8124/8124013.pdf.