Hunting for Hydrated Minerals on Trans-Neptunian Objects
Abstract
We present new optical reflectance spectra of three potentially silicate-rich trans-Neptunian objects (TNOs). These spectra were obtained with the aim of confirming past hints and detections of m absorption features associated with the presence of iron-bearing phyllosilicates. Our new spectrum of 120216 (2004 EW95) presents clearly detected absorption features that are similar in shape to hydrated mineral absorption bands present in the spectra of aqueously altered outer main belt asteroids. Four new reflectance spectra of 208996 (2003 AZ84) obtained at separate epochs all appear featureless, but they vary significantly in spectral gradient (between m and m) on a timescale consistent with this object’s nominal rotational period. We report the first four optical reflectance spectra of 90568 (2004 GV9), finding them all to be featureless but consistent with colors previously reported for this object. We speculate that impacts are the only mechanism capable of delivering, excavating, or forming hydrated minerals at the surfaces of TNOs in detectable concentrations; as a result, any deposits of hydrated minerals on TNOs are predicted to be localized and associated with impact sites. Globally altered TNOs (as observationally suggested for 2004 EW95) plausibly formed more easily at smaller heliocentric distances (au) before being transplanted into the current trans-Neptunian population.
1 Introduction
Aqueous alteration is a process in which chemical alteration of anhydrous silicates is facilitated by liquid water molecules adsorbed to their surfaces and interfacial layers. These reactions produce hydrated minerals, which may include phyllosilicates, oxides, sulfides, and carbonates (Suttle et al., 2021, and references therein). Because aqueous alteration requires liquid water, there is a lower limit on the temperatures at which it occurs. So-called low-temperature aqueous alteration occurs at temperatures above the freezing point of water ice (K), and is considered most relevant for the production of hydrated minerals observed both in primitive meteorites and on carbonaceous main belt asteroids (e.g., Wilson et al., 2015). Hydrocryogenic alteration may occur in cases where thin interfacial layers of water remain unfrozen at the surfaces of silicates in ice-dust mixtures at K, and is potentially relevant to the production of hydrated minerals in comets (e.g., Reitmeijer & MacKinnon, 1987). In cases where water forms a eutectic mixture with other volatiles like ammonia (NH3) and methanol (CH3OH), it may also potentially remain fluid down to K (e.g., Kargel, 1992; McKinnon et al., 2008). A detection of hydrated minerals on the surface of a minor planet is an extremely useful marker, indicating that at least some of its constituent silicates have been heated to temperatures at which aqueous alteration can happen. Such detections may assist constraint of not only the formation, thermal evolution, and dynamical evolution of individual minor planets but also that of the solar system more broadly (e.g., Rivkin et al., 2015; Wilson et al., 2015; Suttle et al., 2021).
Unambiguous detection of hydrated minerals on the surfaces of main-belt asteroids and in aqueously altered meteorites is achieved through detection of a strong and distinctive m absorption band in their reflectance spectra that is attributed to the fundamental stretch mode of structural hydroxyl (OH; e.g., Lebofsky, 1980; Jones et al., 1990; Vilas, 1994; Clark et al., 2005; Howell et al., 2011; Takir & Emery, 2012; Rivkin et al., 2015, 2022). Absorption bands at 1.95, 2.95, and m may be attributed to bound water within hydrated minerals, but these are not always easily distinguished from overlapping water ice absorption bands (e.g., Clark et al., 2005).
At near-ultraviolet (NUV) and optical wavelengths aqueously altered objects may show a variety of spectral behaviors. The most common of these are weak absorption features centered near m, and an absorption edge at m that results from the presence of multiple overlapping absorption bands centered at UV wavelengths. Features in both of these locations may be attributed to Fe2+Fe3+ intervalence charge transfer (IVCT) transitions in oxidized iron present in phyllosilicates (e.g., Vilas & Gaffey, 1989; Vilas, 1994; Cloutis et al., 2011; Fraeman et al., 2014; Fornasier et al., 2014; Rivkin et al., 2015). Ferric aqueous alteration features in the m region are observed with a variety of shapes, central wavelengths, and substructures generally falling in the range m, their precise configuration depending on the specific mineralogy of the surface. Bands centered at m are typically attributed to serpentine group phyllosilicates, and those centered at m are attributed to saponite group phyllosilicates (Cloutis et al., 2011). Less frequently, ferric alteration bands have also been observed at slightly longer and shorter wavelengths, notably near m and m (e.g. Vilas et al., 1994). Importantly, however, we note that the mineralogy of the materials absorbing in the m region is not always straightforwardly deciphered by studying the varied and often complex forms of their absorption bands (e.g., Vilas & Gaffey, 1989; Cloutis et al., 2011).
Most asteroid reflectance spectra with m features also have a m band, but around half of those with the m band lack absorptions near m (Howell et al., 2011). This means that observation of a m hydrated mineral feature is a good indication of the presence of hydrated minerals on the surface of a minor planet, but its absence does not necessarily indicate the opposite (Rivkin et al., 2015).
The presence of aqueously altered silicates in interplanetary dust particles and the dust of some comets (e.g., Lisse et al., 2006; Keller & Flynn, 2022) supports predictions that they may also be present on the surfaces of trans-Neptunian objects (TNOs; e.g., Fraser & Brown, 2012). They should not necessarily be expected to be detectable in our remotely sensed reflectance spectra, however, especially at optical and near-infrared (NIR) wavelengths. This is because refractory organic residues are also likely to be present on the surfaces of TNOs and are predicted to govern their diverse optical-NIR colors (e.g., Cruikshank et al., 1998, 2005; Barucci et al., 2006; Brunetto et al., 2006; Fraser & Brown, 2012; Dalle Ore et al., 2013, 2015; Merlin et al., 2017; Wong & Brown, 2017; Grundy et al., 2020; Fernández-Valenzuela et al., 2021). Carbonaceous materials are known to mask the weak absorption bands of phyllosilicates, even when they are added to mixtures of silicates and ices in tiny concentrations (e.g., Cloutis et al., 2011; Poch et al., 2016; Hendrix & Vilas, 2019). Nevertheless, a handful of TNOs and centaurs have been reported to present absorption bands in their reflectance spectra that are associated with hydrated minerals (Lazzarin et al., 2003; de Bergh et al., 2004; Fornasier et al., 2004, 2009; Alvarez-Candal et al., 2008; Guilbert et al., 2009b; Seccull et al., 2018). Observations of hydrated mineral bands in the reflectance spectrum of a TNO therefore suggest that it has an unusually high abundance of surface hydrated minerals relative to its abundance of refractory organics.
With this in mind, this work is not concerned directly with the question of whether hydrated minerals are present on the surfaces of TNOs (in many cases the answer appears likely to be yes; Clark et al., 2005; Keller & Flynn, 2022). Rather, when interpreting TNO reflectance spectra it may be more constructive to ask why and how some TNOs become observably aqueously altered, why others do not, and whether the distinction between these two groups reveals anything about their respective pathways of formation and thermal evolution. Reliable and repeatable detection of aqueously altered TNOs through photometric observation and spectroscopic followup is a crucial first step toward untangling these questions, and our efforts to achieve this are the primary subject of this work. In Section 2 we describe the methods we use to identify aqueously altered TNOs for followup spectroscopy. Section 3 presents the observation and reduction of new reflectance spectra of three TNOs that are predicted to be aqueously altered. Section 4 presents our analysis of these spectra. Finally, in Section 5 we discuss our findings and make predictions about how aqueously altered material may become detectable on the surfaces of TNOs.
2 Target Selection
Our target TNOs were selected because they met three of four criteria, the first being mandatory:
-
1.
Membership of the less red TNO color class (; Marsset et al., 2019). TNOs with redder surfaces may be more likely to have their surface silicates masked, potentially due to a higher abundance of refractory organics (e.g., Poch et al., 2016). Curvature in the spectra of these ultrared hydrocarbons may also be difficult to distinguish from curvature caused by weak bands near m (e.g., Roush & Dalton, 2004).
-
2.
Reported infrared photometric colors (at m) that suggest a silicate-rich composition (Fernández-Valenzuela et al., 2021).
-
3.
Previously reported observations of a m absorption band in their reflectance spectra (e.g., Fornasier et al., 2009).
- 4.
Based on these criteria, we chose to observe 90568 (2004 GV9), 120216 (2004 EW95), and 208996 (2003 AZ84).
3 Observations & Data Reduction
Each of our targets was observed in longslit spectroscopy mode at Gemini Observatory with, depending on its declination, either the northern or southern Gemini Multi-Object Spectrograph (GMOS; Hook et al., 2004; Gimeno et al., 2016). Alongside each TNO, and under identical observing conditions, we observed the spectrum of at least one solar twin selected from published catalogs (Porto de Mello et al., 2014; Ramírez et al., 2014). These calibrator star spectra were used to negate the solar signature in our TNO spectra and derive their reflectance spectra. A log of our observations, their geometry, and the instrument configurations used to obtain the data are presented in Appendix B. The spectra of all our targets and calibrator stars were observed under photometric conditions (CC50 as defined by Gemini Observatory); as a result, we expect that the shapes and gradients of our reflectance spectra are accurate.
For all our observations we used a repeating four point dither pattern (0″, +16″, +8″, -8″) along the slit to enable construction of fringe frames and aid mitigation of bad pixels during stacking. During the acquisition of each target, the slit was aligned to the average parallactic angle calculated to occur during the associated sequence of spectroscopic integrations. We used the standard GMOS Hamamatsu CCD detectors and binned our spectra (spatial spectral) on the detector before reading out the central spectrum region of interest in the standard slow read, low gain, 12 amplifier mode. Once at the start of each spectroscopic sequence targeting a TNO, and once again after each cycle of four dithers, a pair of spectroscopic lamp flats were observed. Five bias frames were obtained for each TNO observation during the standard sequence of morning calibrations. A single arc frame was also collected by observing a CuAr calibration lamp during daytime calibrations following each observation of 2003 AZ84 and 2004 GV9. As a precaution against the effects of instrument flexure, the arc lamp frame used to calibrate the spectrum of 2004 EW95 was obtained while on sky, in the middle of the science sequence. The effects of flexure on the wavelength calibration of GMOS spectra observed in the red optical region are minimal, however, and we did not notice any adverse effects in our data caused by use of arc frames obtained during daytime.
On 2022 January 8, an uncontrolled warmup of GMOS-S effectively disabled amplifier 5 of the GMOS-S detector for science purposes.111https://www.gemini.edu/news/instrument-announcements/gmos-s-ccd2-issues Attempts to adapt our observing strategy for our initial observation of 2004 GV9 were unfortunately unsuccessful and caused the center of that spectrum to fall on the area of the detector read out by the damaged amplifier. As a result, data in the range m were unrecoverable; there is now a gap at these wavelengths in our reflectance spectra of 2004 GV9 obtained at the first epoch on 2022 March 7.
Initial data reduction steps for all our data, including bias subtraction, flat-field correction, wavelength calibration, and 2D spectrum rectification, were performed with Gemini IRAF (Tody, 1986, 1993; Green, 2012). The solar calibrator star spectra were calibrated with the same biases, flats, and arcs as were used to calibrate their associated TNO spectra. Astroscrappy, a Python implementation of LACosmic (van Dokkum, 2001; McCully et al., 2018), was then used to remove cosmic rays from the 2D spectra. For each 2D frame observed at a given spatial dither point, we subtracted a fringe frame created by median combining the frames at all other dither points. This aimed to correct minor fringing artifacts and any scattered light present in the background of the spectra not already flattened during flat-fielding.
Sky subtraction and spectrum extraction were then performed with our Modular Optimized Tracer and Extractor of Spectra (MOTES; T. Seccull & D. A. Kiersz 2024, in preparation). This software builds on the methods described by Seccull et al. (2018) used for localization and extraction of faint point-source spectra in that it employs a version of optimal extraction (Horne, 1986). MOTES returns both an optimally extracted spectrum and an aperture extracted spectrum for each 2D spectrum provided to it; a brief overview of the operation of MOTES is provided in Appendix C. Because of the large gap in our first-epoch spectra of 2004 GV9, we split each one in half to sky subtract and extract each good section separately.
As any flux calibration of our data would be canceled out during division by the solar calibrator spectra, and since the responses of the GMOS spectrographs are stable at least over the time span required to complete one of our observations (hr), we elected not to perform a flux calibration on our extracted spectra. We did, however, apply a consistent relative extinction correction to each 1D spectrum (including both TNOs and calibrators) with , where is the uncorrected spectrum, is the corrected one, is the median airmass during the integration of the spectrum, and is the optical extinction curve stored in Gemini IRAF after it has been interpolated to the resolution of the data (see Stone & Baldwin, 1983; Baldwin & Stone, 1984, and the Gemini Observatory website222https://www.gemini.edu/observing/telescopes-and-sites/sites).
Following extinction correction, all extinction-corrected 1D spectra for each TNO and calibrator star from each observation were median stacked. The TNO spectra were then divided by the spectra of one of their associated solar calibrator stars to produce reflectance spectra of the TNOs. These reflectance spectra were then binned using the bootstrapping method described by Seccull et al. (2019) to boost their signal-to-noise ratio (S/N). For 2004 GV9, 2004 EW95, and 2003 AZ84 we used binning factors (i.e., numbers of points per bin) of 12, 30, and 66, respectively. We note, however, that higher binning factors were used in cases where our data had poor quality. Our third 2003 AZ84 reflectance spectrum has a binning factor of 94, because although this sequence of spectroscopic observations (observed 2022 Jan 23) was obtained with all required calibrations, it was only partially completed. Our first epoch reflectance spectra for 2004 GV9 have a binning factor of 60. Our method of selecting binning factors is detailed in Appendix D.
The lower wavelength limit of our 2004 EW95 reflectance spectrum is defined by the cutoff of the OG515 order blocking filter. The other two spectra had both their shortest and longest wavelength extremities removed. The efficiencies of both the R150 and R400 gratings drop rapidly at m333http://www.gemini.edu/instrumentation/gmos/components along with delivered S/N. In all cases we cut out data at m owing to the presence of large residuals caused by incomplete cancellation of sky emission lines and telluric absorption lines. The spectra of 2004 GV9 and 2003 AZ84 also suffered second-order contamination at m.
4 Results & Analysis
We present our new reflectance spectra of 2004 GV9 and 2004 EW95 in Figures 1 and 2, respectively. Figure 3 presents the spectrum of 2004 EW95 reported by Seccull et al. (2018) in the context of colors reported for the same object by Fraser et al. (2015) and the model of the shape of the spectrum reported by Seccull (2020). Figure 4 presents our new reflectance spectra of 2003 AZ84. If readily available, we compare published reflectance spectra of our targets to our own. We also compare our data to coarse reflectance spectra of our targets derived from published single-epoch colors observed both from the ground in the filters (Fornasier et al., 2004; Rabinowitz et al., 2008; Santos-Sanz et al., 2009; Perna et al., 2010, 2013; Tegler et al., 2016) and with Wide Field Camera 3 on the Hubble Space Telescope (HST) in the F606W, F775W, F814W, and F098M filters (Fraser et al., 2015). Both and HST colors were converted to reflectance with methods described by Hainaut & Delsanti (2002), solar colors reported by Ramírez et al. (2012), and HST solar colors provided privately by the authors of Fraser et al. (2015).
For purposes of comparison to literature values, and to quantify any detectable color variability, we measured the gradient of each of our new reflectance spectra (; see Table 1). For 2004 EW95 and 2003 AZ84 we measured the gradient across the full available wavelength range. This was not possible for the first-epoch reflectance spectra of 2004 GV9 on account of the gap in their wavelength coverage, so we measured the gradients of all our 2004 GV9 spectra in two sections. The first section covered the maximum available reliable spectroscopic data in the range m; m in the first-epoch spectra and m in spectra from epochs 2, 3, and 4. The second section covered the maximum available reliable spectroscopic data in the range m; m in the first-epoch spectra and m in spectra from epochs 2, 3, and 4. The dividing line was set at m as the spectra of 2004 GV9 appear consistent across observing epochs at m, but have slightly more varied gradients at m (see section 4.1). Our method of measuring spectral gradients is described in the Appendix E. We now describe our findings for each of our targets.
| Target/Calibrator (Epoch) | Range (m)a | ||
| 2004 EW95/HD 124523 | 3.6 | 0.1 | 0.54-0.91 |
| 2003 AZ84/HD 54351 (1) | 3.7 | 0.9 | 0.58-0.92 |
| 2003 AZ84/HD 78534 (1) | 3.5 | 0.8 | 0.58-0.92 |
| 2003 AZ84/HD 54351 (2) | 9.1 | 1.7 | 0.58-0.92 |
| 2003 AZ84/HD 78534 (2) | 8.6 | 1.7 | 0.58-0.92 |
| 2003 AZ84/HD 54351 (3) | 3.8 | 1.4 | 0.58-0.92 |
| 2003 AZ84/HD 78534 (3) | 3.0 | 1.2 | 0.58-0.92 |
| 2003 AZ84/HD 54351 (4) | 8.4 | 1.1 | 0.58-0.92 |
| 2003 AZ84/HD 78534 (4) | 7.9 | 0.8 | 0.58-0.92 |
| 2004 GV9/HD 124523 (1) | 20.0 | 1.3 | 0.56-0.66 |
| 2004 GV9/HD 157750 (1) | 21.0 | 1.2 | 0.56-0.66 |
| 2004 GV9/HD 124523 (2) | 19.6 | 0.4 | 0.50-0.65 |
| 2004 GV9/HD 124523 (3) | 19.6 | 1.8 | 0.50-0.65 |
| 2004 GV9/HD 124523 (4) | 20.2 | 0.4 | 0.50-0.65 |
| 2004 GV9/HD 124523 (1) | 10.3 | 3.1 | 0.79-0.90 |
| 2004 GV9/HD 157750 (1) | 10.6 | 3.1 | 0.79-0.90 |
| 2004 GV9/HD 124523 (2) | 10.1 | 0.2 | 0.65-0.90 |
| 2004 GV9/HD 124523 (3) | 12.6 | 0.4 | 0.65-0.90 |
| 2004 GV9/HD 124523 (4) | 11.4 | 0.4 | 0.65-0.90 |
Note. This table shows the spectral gradients () and associated uncertainties measured from our spectra across various wavelength intervals.
a The rightmost column notes the wavelength interval over which each measurement was made; all values are measured relative to the reflectance at the center of this range.
4.1 90568 (2004 GV9)
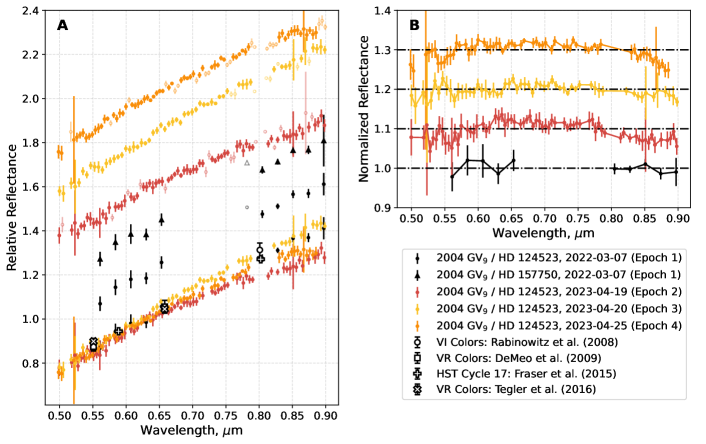
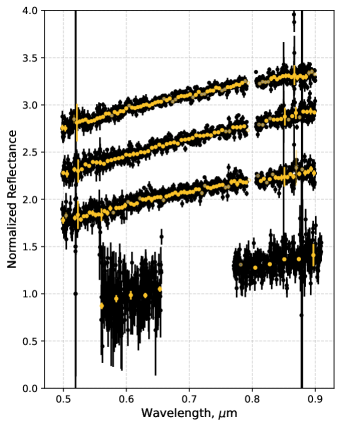
2004 GV9 is a moderately large hot classical TNO (see Appendix B) that is predicted to have a silicate-rich composition by Fernández-Valenzuela et al. (2021). Its reflectance spectrum is flat and featureless at m, indicating an absence of detectable surface ices (Guilbert et al., 2009a; Brown et al., 2012). We could not find a full set of single-epoch colors in the literature for 2004 GV9, but , , and F606W-F814W colors are available (Rabinowitz et al., 2008; DeMeo et al., 2009; Fraser et al., 2015; Tegler et al., 2016). In combination these colors suggest that the reflectance spectrum of 2004 GV9 is linear and featureless at m and does not significantly vary (see Figure 1). When, however, we applied the photometric test for a m band described in Appendix A to the combined colors of 2004 GV9 compiled by Peixinho et al. (2015) from Rabinowitz et al. (2008) and Tegler et al. (2016), we found that they are compatible with the presence of a hydrated mineral absorption band.
To our knowledge, our reflectance spectra of 2004 GV9 are the first to be reported covering optical wavelengths (see Figure 1). They are all featureless, lacking anything but red continuum near m, and appear consistent with coarse reflectance data derived from photometric colors previously reported for 2004 GV9 (Fig. 1; Rabinowitz et al., 2008; DeMeo et al., 2009; Fraser et al., 2015; Tegler et al., 2016). The gradients of all the spectra at m remain consistently at values of m across all four observing epochs (see Table 1). Variation of the spectral continuum appears to increase at m.
Mapping our spectroscopic sampling of the surface to the rotational phase of 2004 GV9 presents a conundrum. The best sampled light curve published so far for 2004 GV9 was reported by Dotto et al. (2008) alongside an estimated rotational period of hrs. Comparison of this period to our observing log suggests that we observed 2004 GV9 at roughly the same rotational phase during epochs 2, 3, and 4. In this context the subtle variation of the spectral gradient observed at m seems puzzling. Our consistent methods of observation allow us to rule them out as potential causes of the color variation. Visual inspection of through-slit acquisition frames for both 2004 GV9 and HD 124523 shows them to be well centered at each epoch. Likewise, the slit position angle was correctly aligned to the parallactic angle for all observations; this and the low airmass at which all these observations were performed should minimize wavelength-dependent slit losses due to atmospheric differential refraction (Filippenko, 1982). Reduction of the spectra observed at all epochs was done consistently, and sky emission at m appears to have been subtracted equally well from the spectra at each epoch. The redness of 2004 GV9 does not correlate with either the airmass at which it was observed or the airmass difference between 2004 GV9 and HD 124523 at each epoch. Nor does redness appear to correlate with the delivered image quality (IQ). Low level variations in atmospheric transmission may occur on timescales of minutes at m due to variations in the strength of telluric water absorption bands (see Smette et al., 2015) caused by changes to the precipitable water vapor (PWV) present in Earth’s atmosphere along an observer’s line of sight. Although variation in PWV could be a convenient explanation for the observed variation in the spectrum of 2004 GV9, it is not monitored by Gemini South, precluding checks for causal links between PWV and the redness of 2004 GV9 at m.
While we cannot rule out atmospheric conditions as a cause of the variation in our spectra, we equally cannot yet completely rule out the possibility that the color variation is intrinsic to the surface of 2004 GV9, and that the uncertainty of the rotational period reported by Dotto et al. (2008) is underestimated. A discrepancy exists between the light curves published for 2004 GV9 by Dotto et al. (2008) and Sheppard (2007). Dotto et al. (2008) report a light curve amplitude of mag for 2004 GV9. Sheppard (2007) reports a more sparsely sampled light curve of equal photometric quality covering a much longer total observational baseline, and concludes that there is no evidence of a short-term lightcurve for 2004 GV9 with amplitude greater than 0.1 mag. These light curves were observed only two years apart, representing a maximum possible change in viewing aspect along the rotational axis of ; the projection of 2004 GV9 should not have meaningfully changed between these two observational epochs. Even though the light curve sampling of Sheppard (2007) is sparser than that of Dotto et al. (2008), the data have sufficient spacing and S/N to have been able to detect variations in brightness with the period and strength of those reported by Dotto et al. (2008). Based on the discrepancy between these two light curves it remains difficult to conclusively rule out the possibility that the uncertainty of the rotational period reported by Dotto et al. (2008) is underestimated. As a result, it remains possible that we may have observed 2004 GV9 at multiple rotational phases. In any case, our understanding of both the reflectance spectrum and lightcurve of 2004 GV9 could clearly benefit from additional observational monitoring.
We take the null detection of any m hydrated mineral features as a demonstration that photometric tests for such bands must be performed on color data observed at a single epoch to minimize the influence of rotational color variation on their results. Testing of averaged color data for hydrated mineral bands is not recommended.
4.2 120216 (2004 EW95)
2004 EW95 is a relatively small 3:2 resonant TNO (see Appendix B) that occupies a high inclination orbit undergoing high amplitude Lidov-Kozai oscillations (Lykawka & Mukai, 2007). It is predicted to be a silicate-rich object based on its infrared colors (Fernández-Valenzuela et al., 2021). The reflectance spectrum of 2004 EW95 drops precipitously from m toward NUV wavelengths, and it is also reported to have a m hydrated mineral band (Seccull et al., 2018). The colors of 2004 EW95 reported by Fraser et al. (2015) imply the potential presence of a hydrated mineral band when tested as described in Appendix A. Both the NUV reflectance drop and the m band are consistent with those observed in the spectra of aqueously altered main-belt carbonaceous asteroids (Fornasier et al., 2014) and may be attributed to IVCT transition absorptions occuring in iron-bearing phyllosilicates (e.g., Vilas et al., 1994; Rivkin et al., 2015). In combination, the dynamical properties of 2004 EW95 and its apparent compositional similarity to outer main belt asteroids have led to the prediction that it formed near to Jupiter and Saturn (Seccull et al., 2018) before being scattered into the outer Solar System as those planets grew and migrated (e.g., Walsh et al., 2012; Raymond & Izidoro, 2017; Morbidelli & Nesvorný, 2020). Lawler & Gladman (2013) showed that highly inclined, mean-motion resonant, Kozai resonant orbits, like that occupied by 2004 EW95, are indeed more efficiently populated through resonance capture of scattering objects (e.g., Levison et al., 2008) than they are through a mechanism like resonance sweeping (e.g., Hahn & Malhotra, 2005).
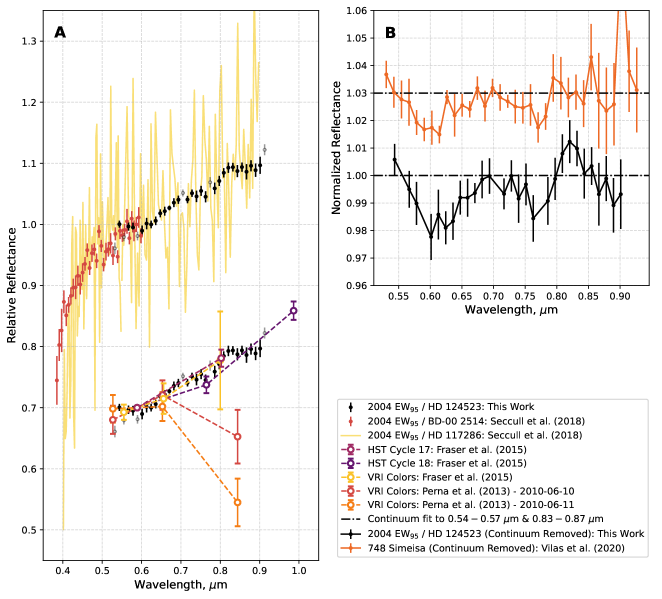
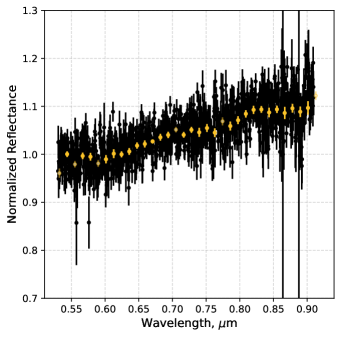
Our new reflectance spectrum of 2004 EW95 (2004 EW95/HD 124523) is presented in Figure 2. The gradient of the spectrum measured across its full wavelength coverage (m; see Table 1) is consistent with those reported previously at similar wavelengths (Peixinho et al., 2015; Seccull et al., 2018). Removal of a linear continuum fitted at m and m reveals the presence of two weak absorption features that together are consistent in shape with those reported in the reflectance spectra of aqueously altered outer main-belt asteroids; for comparison, in Figure 2 we plot the continuum-removed spectrum of 2004 EW95 against that of an aqueously altered Hilda asteroid, 748 Simeisa (Vilas & Gaffey, 1989; Vilas et al., 2020). For the stronger of the two bands, centered near m, we measure an average depth of in the range m relative to the fitted continuum. The location of this band suggests the presence of iron-bearing saponite group phyllosilicates, which typically have band centers in the range m (e.g., Cloutis et al., 2011). If this attribution is correct, the sudden flattening of the 2004 EW95 spectrum at m may potentially be the edge of a broad saponite absorption band centered in the m region (see Cloutis et al., 2011). Without coverage of this region, however, we cannot rule out the possibility that our spectrum at m is instead just continuum. The weaker band centered near m is only tenuously detected and does not lend itself well to interpretation. Its center is just redward of the m range where serpentine group phyllosilicate absorption bands are found (Cloutis et al., 2011). The presence of a similar weak feature in the spectrum of 748 Simeisa (Figure 2; Vilas & Gaffey, 1989) indicates that it could be real, but without a firmer detection we choose not to overinterpret the data. Higher quality reflectance spectra, especially covering m, would aid future efforts to confirm the presence of aqueously altered material on 2004 EW95 and interpret its mineralogy (e.g., Cloutis et al., 2011; Rivkin et al., 2015).
Rivkin et al. (2022) predict that if 2004 EW95 is aqueously altered it should have a “sharp type” spectral shape at m, defined by the presence of a m OH band. This prediction is plausible, but it is worth noting that the presumed dynamical history and long term thermal evolution of 2004 EW95 are not comparable to those of sharp type objects observed in the outer main asteroid belt. Any bound water and/or water ice present on the surface of 2004 EW95 may act to broaden any potential m absorption band in its reflectance spectrum, as observed for Phoebe (Saturn IX; Clark et al., 2005; Fraser & Brown, 2018).
Comparison of our spectrum to coarse reflectance spectra derived from published colors of 2004 EW95 reveals that some sets of single-epoch colors match the spectrum very well, while others do not (Figure 2). The HST Cycle 17 colors reported by Fraser et al. (2015) are in excellent agreement with our spectrum and, while their uncertainties are large, the colors from the same work also appear to be a good match. Within their uncertainties both epochs of colors reported by Perna et al. (2013) agree with the spectrum too, but the equivalent colors are wildly different (see Figure 2). Because these colors disagree so strongly with all the other datasets, we consider them less reliable. The Fraser et al. (2015) HST Cycle 18 colors more closely resemble the curvature observed in the X-Shooter spectrum of 2004 EW95 reported by Seccull et al. (2018) than the bands observed in our new GMOS spectrum.
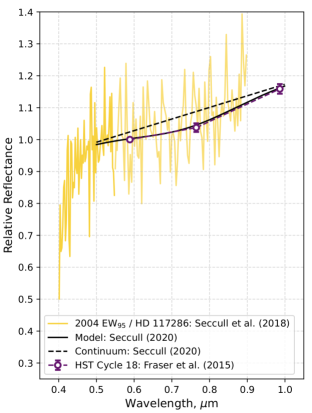
To estimate the depth, width, central wavelength, and detection significance of their reported absorption band, Seccull et al. (2018) fitted a Gaussian model to their low S/N spectrum. An updated version of this model was created later (see Chapter 6 of Seccull, 2020, where fitting methodology and parameter covariances are presented). We have plotted the newer Gaussian model (, m, m) over the spectrum from Seccull et al. (2018) in Figure 3. While both the spectrum and the model have previously been reported, the excellent match between the model and the HST Cycle 18 photometry from Fraser et al. (2015) has not. There is apparently consistency between the 2004 EW95/HD 117286 reflectance spectrum and the HST Cycle 18 photometry; the same can be said for our new 2004 EW95/HD 124523 reflectance spectrum and both the photometry and HST Cycle 17 photometry reported by Fraser et al. (2015, see also Figure 2). The repeated observation of these two slightly different spectral shapes suggests either that there may be subtle variegation of the surface properties of 2004 EW95 or that the various data reduction procedures used for each dataset may produce subtly inconsistent results. In either case, if the spectrum-color pairings that we have identified are real, the spectral variation they collectively represent appears to be small. Fraser et al. (2015) reported no statistically significant spectral variation for 2004 EW95 within the precision allowed by their collated photometric data. Unfortunately, the X-Shooter spectrum of 2004 EW95 is too noisy to lend itself to a robust statistical comparison to our new GMOS spectrum.
We note that to date all spectroscopic and photometric datasets capable of revealing signs of hydrated minerals on 2004 EW95 do appear to suggest their presence. Assuming that observations of 2004 EW95 have followed a stochastic sampling of rotational phase, which is more likely than repeat observations of a single phase, consistently observed signatures associated with hydrated minerals could indicate that 2004 EW95 may be aqueously altered across much of its surface. Confirming this will, however, require a consistent, high S/N, and rotationally resolved spectroscopic survey of 2004 EW95.
4.3 208996 (2003 AZ84)
2003 AZ84 is a large 3:2 resonant TNO (see Appendix B). Clear detections of surface water ice have been reported for this object based on the presence of characteristic absorption bands in its reflectance spectrum at and m (Barkume et al., 2008; Guilbert et al., 2009a; Barucci et al., 2011). It is predicted to be silicate-rich based on its infrared colors at m (Fernández-Valenzuela et al., 2021), and sporadic observations of absorption bands at m have been attributed to hydrated minerals (Fornasier et al., 2004, 2009; Alvarez-Candal et al., 2008). The colors of 2003 AZ84 reported by Peixinho et al. (2015) do appear consistent with the potential presence of a hydrated mineral band when the photometric test from the Appendix A is applied to them. Application of the test to the single-epoch colors of 2003 AZ84 (Fornasier et al., 2004; Santos-Sanz et al., 2009; Perna et al., 2010) combined to make the average colors reported by Peixinho et al. (2015) suggest instead that a hydrated mineral band is not present in its reflectance spectrum (see Appendix A).
The reportedly sporadic appearances of a m hydrated mineral band in the spectrum of 2003 AZ84 have led to predictions that its surface is variegated and that its spectrum is rotationally variable as a result. To maximize our odds of observing localized deposits of hydrated minerals, we chose to observe 2003 AZ84 multiple times over the course of the 2021B semester. We did not set a specific cadence for our visits, however, and instead chose to let observations be performed as time and observing conditions allowed within the Gemini North observing queue.
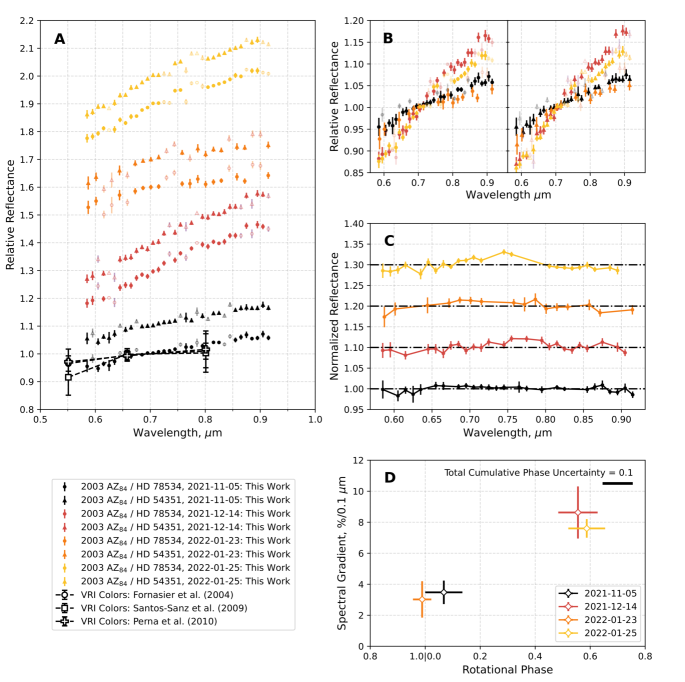
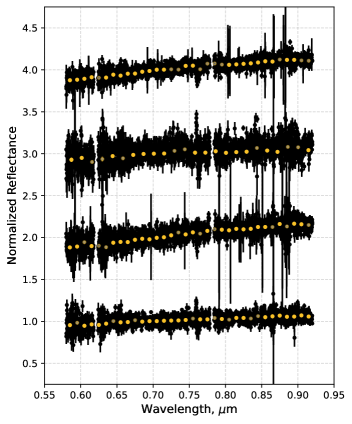
All four of our new reflectance spectra are presented in Figure 4 and the gradients we have measured from them are presented in Table 1. At all epochs the spectrum of 2003 AZ84 was linear and showed no evidence of any absorption bands. While we can rule out the presence of detectable hydrated minerals on the surface of 2003 AZ84 at the rotational phases where we observed it, we cannot rule out the possibility that localized deposits may have been previously observed at phases we did not cover (Fornasier et al., 2009). Panel D in Figure 4 shows the rotational phase coverage of our observations assuming a nominal rotational period of hr (Thirouin et al., 2010). The 0.04 hr rotational period uncertainty translates to a phasing uncertainty of 0.006 per rotation. Our observations targeting 2003 AZ84 never took more than one hour to complete, so the maximum phasing uncertainty of each individual observing epoch is very small, at . By summing the phasing uncertainty in quadrature over the 287.7 rotations completed by 2003 AZ84 between the start of our first observing epoch and the end of our last, we estimate that the total cumulative phase uncertainty across all four epochs is (see Figure 4).
Although no absorption bands were detected in the optical reflectance spectrum of 2003 AZ84, we observed significant rotational variation in its gradient. At phases separated by half a rotation, the spectral gradient of 2003 AZ84 was observed to vary by a factor , between m and m (see Figure 4 and Table 1). Published spectra and colors favor the lower of these values (e.g., Fornasier et al., 2004, 2009; Alvarez-Candal et al., 2008; Santos-Sanz et al., 2009; Perna et al., 2010). As continuum gradient in a spectrum can be sensitive to multiple confounding factors at the observation and data reduction stages, we performed multiple checks and tests to assess the veracity of the redder gradient measurement (details in Appendix F); ultimately, low level variations in the gradient could be induced by adjusting some data reduction parameters, but none could reproduce a variation of the magnitude that we observe. Our observing strategy was sufficiently consistent between epochs that variations in the spectral gradient are unlikely to stem from it. It seems, therefore, that the color variation is real and intrinsic to the surface of 2003 AZ84. There are multiple factors to support this claim. The gradient consistently correlates with rotational phase over multiple observing epochs, and the two phase/color groups are separated in phase by 0.4-0.5 rotations, which is much larger than the total cumulative phase uncertainty of our combined observations. That we measure gradients consistent with previous reports at some epochs demonstrates that the variable color is unlikely to be caused by a measurement error.
Variation of the spectrum of 2003 AZ84 is well documented, from variable strength of the 1.5 and m water ice bands and variable appearance of the m crystalline water ice band (Merlin et al., 2010b; Barucci et al., 2011), to sporadic appearances of a m hydrated mineral band (Fornasier et al., 2009). Additionally, Guilbert et al. (2009a) and Barucci et al. (2011) both observed a potential feature at m in their spectra of 2003 AZ84 that is clearly absent in the spectrum reported by Barkume et al. (2008). Guilbert et al. (2009a) tentatively suggested that, if real, the m band may be associated with methanol ice on the surface of 2003 AZ84, while Barucci et al. (2011) flatly attribute it to noise in the data. Our observation of the variable optical color of 2003 AZ84 is therefore not necessarily unexpected, but it does raise questions about why it has appeared now. Most published colors and spectra reported for 2003 AZ84 were observed at least 14 years ago, and there is a high likelihood that our line of sight is misaligned with its equatorial plane (Dias-Oliveira et al., 2017). The simplest explanation for the onset of color variation may therefore be that our viewing aspect of 2003 AZ84 has changed enough that previously unobservable regions of its surface have now come into view.444The true anomaly of 2003 AZ84 has changed by since 2008.
Alone, our disk-integrated optical reflectance spectra of 2003 AZ84 offer little direct information about the size, origin, or nature of the reddened part of its surface, but we can engage in some cautious speculation. The strength of water ice absorption bands in the spectrum of 2003 AZ84 is known to vary (Merlin et al., 2010b; Barucci et al., 2011). The color variation we see might be driven by variation in the abundance and/or grain size of water ice across the surface of 2003 AZ84. Areas of the surface with shorter optical path lengths through surface water ice may have reflectance properties dominated instead by optically red refractory opaques (see also Sultana et al., 2023). The spectra of these areas may present both weaker water ice absorption bands and redder optical continuum colors than those observed for icier regions.
Reddened surfaces on TNOs may instead be attributed to the presence of refractory organics, but the localized presence of these on the surface of 2003 AZ84 is difficult to explain given the apparent absence of volatile ice absorption bands in its reflectance spectrum. An impact of a red TNO with the surface of 2003 AZ84 could potentially result in the localized deposition of red material, but it is not possible to determine whether this hypothesis is realistic until the size of the reddened region is constrained through higher resolution rotational monitoring of the surface color. A better constraint of the orientation of the rotational pole of 2003 AZ84 would also be helpful in this effort (e.g., Dias-Oliveira et al., 2017). Cryovolcanic delivery of internally produced red refractory organics to the surface is a different mechanism observed to have potentially caused localized surface reddening on the surface of Pluto (e.g., Shock, 1993; Kebukawa et al., 2017; Cruikshank et al., 2019, 2021; Singer et al., 2022). Whether a similar mechanism could have caused localized reddening on 2003 AZ84, a TNO with a diameter one-third that of Pluto, remains to be seen, given that the interior of 2003 AZ84 likely experienced much less internal heating than larger cryovolcanically active TNOs (see Malamud & Prialnik, 2015).
5 Discussion & Conclusions
We have observed the optical reflectance spectra of three TNOs with the aim of detecting absorption features near m associated with the presence of hydrated surface minerals. We obtained a clear detection of such features in the reflectance spectrum of 2004 EW95, which supports previous reports that this object exhibits spectral behavior associated with the presence of aqueous alteration products (Seccull et al., 2018). Repeated and mostly consistent detections of these signatures suggest that the majority of the surface of 2004 EW95 may be aqueously altered. By contrast, no absorption bands of any kind were observed in any of our four reflectance spectra of 2003 AZ84. We cannot, however, rule out the possibility that previously reported detections of a m band (Fornasier et al., 2004, 2009; Alvarez-Candal et al., 2008) could have been substantiated by observations performed at rotational phases that we missed. 2003 AZ84 is well known to be spectrally variable (e.g., Fornasier et al., 2009; Merlin et al., 2010b), and for the first time we report the observation of significant rotational variation of its optical color. Because variegation of the surface of 2003 AZ84 is likely, we predict that, if present, any detectable hydrated minerals are likely to be concentrated in localized deposits. Four new optical reflectance spectra of 2004 GV9 reveal no sign of hydrated minerals on its surface. The reflectance properties of 2004 GV9 appear to be very consistent at m, but show subtle variation at longer wavelengths.
5.1 Aqueous Alteration in the Primordial Trans-Neptunian Disk
For reasons discussed in Section 1, the detection of hydrated mineral absorption bands in the remotely sensed reflectance spectrum of a TNO is somewhat surprising; nevertheless, multiple such cases are reported in the literature (Lazzarin et al., 2003; de Bergh et al., 2004; Fornasier et al., 2004, 2009; Alvarez-Candal et al., 2008; Guilbert et al., 2009b; Seccull et al., 2018). By considering heating mechanisms with the potential to drive aqueous alteration in TNOs, we aim to put such detections in the context of predicted pathways for TNO thermal evolution (see also de Bergh et al., 2004).
Insolation, electrical induction, collisions, and radioactive decay of short-lived radionuclides are all mechanisms with the potential to heat the surface of a minor planet, but even in combination it is challenging for them to deliver enough heat to raise the surface temperatures of TNOs into the range required for aqueous alteration of silicates (K; see Section 1).
5.1.1 Insolation
The weak insolation experienced by TNOs has likely never been able to raise their peak surface temperatures enough to enable aqueous alteration (e.g., Choi et al., 2002). Even a low albedo TNO (; e.g., Lacerda et al., 2014) orbiting the Sun at the inner boundary of the primordial trans-Neptunian disk ( au; Morbidelli et al., 2007) would never achieve a subsolar surface temperature much above 100 K (see also Guilbert-Lepoutre, 2011).
5.1.2 Electrical Induction Heating
Electrical induction heating is resistive heating of electrically conductive material within a minor planet caused by currents potentially induced by its motion through the strong magnetic field and solar wind of the Sun during its T Tauri phase (e.g., Sonett et al., 1970; Wilson et al., 2015). It is possible that this mechanism may have heated some asteroids in the inner solar system in a narrow range of circumstances, but its efficiency is expected to be negligible for TNOs owing to their large heliocentric distances (Menzel & Roberge, 2013).
5.1.3 Radiogenic Heating
Radiogenic heating caused by the decay of short-lived radionuclides, especially 26Al (half-life Myr; Castillo-Rogez et al., 2009) and 60Fe (half-life Myr; Wallner et al., 2015), is routinely considered to have been a primary driver of metamorphic processes within TNOs as they formed (McKinnon et al., 2008; Coradini et al., 2008; Guilbert-Lepoutre et al., 2020, and references therein). The ability of internal radiogenic heating to facilitate the aqueous alteration of silicates on the surfaces of TNOs was likely negligible, however. The extent of radiogenic heating within a forming minor planet is inversely proportional to both its ice/silicate abundance ratio and its porosity (e.g., Guilbert-Lepoutre et al., 2011). Being ice-rich and porous (e.g, Barucci et al., 2011; Brown et al., 2012; Noll et al., 2020), TNOs probably formed with less radionuclide-bearing silicate material compared to asteroids of a similar size. More critical, however, is the timing and rate of formation of TNOs. To experience significant radiogenic heating, a TNO must form early enough relative to the half-lives of short-lived radionuclides to accrete enough of them before they decay (typically within 2 Myr following the formation of calcium-aluminum-rich inclusions; Merk & Prialnik, 2003, 2006; Guilbert-Lepoutre et al., 2011). To continue raising its internal temperature, a TNO must also grow rapidly and shrink its surface/volume ratio enough that the rate of radiative heat loss at its surface is lower than the rate of radiogenic heat production (e.g., McKinnon et al., 2008). Thermal models of TNOs undergoing simultaneous accretion, insolation, and radiogenic heating demonstrate that, if a TNO forms rapidly enough, its interior can be raised to temperatures required for aqueous alteration to begin; they also show, however, that the silicates at the surfaces of all TNOs would have remained cold and unaltered to depths km (e.g., De Sanctis et al., 2001; Choi et al., 2002; McKinnon, 2002; Merk & Prialnik, 2003, 2006; Guilbert-Lepoutre et al., 2011; Malamud & Prialnik, 2015). Additional consideration of other internal exothermic processes, such as water ice crystallization and the serpentinization process itself, which might have initiated once prerequisite temperatures were reached, appear not to change this outcome (e.g., Guilbert-Lepoutre et al., 2011; Malamud & Prialnik, 2015).
5.1.4 Cryovolcanism
Eutectic cryolavas partly comprised of liquid water have the potential to form both inside and at the surfaces of TNOs, where they may aqueously alter silicates that they contact (e.g., Kargel, 1992). Any hydrated minerals formed, however, would probably be neither soluble nor buoyant in the cryolava (Kargel, 1992; McKinnon et al., 2008). As a result, cryovolcanic delivery of hydrated minerals from the interior to the surface is unlikely. Aqueously altered silicates formed at the surface in this way are also likely to be overlaid by the cryovolcanic flows that created them, to depths that are optically thick. This supposition is nominally supported by observations of cryovolcanic features on Pluto performed by New Horizons, which did not reveal the presence of any associated surface hydrated minerals (Cruikshank et al., 2019, 2021; Singer et al., 2022). We note, however, that the ability of New Horizons to detect any hydrated minerals on Pluto was limited by both the low optical spectal resolution and lack of wavelength coverage redward of m offered by its Ralph imager and imaging spectrometer (Reuter et al., 2008). Given the aforementioned issues related to the buoyancy and solubility of hydrated minerals in cryolava, the existence of detectable cryovolcanically formed or deposited hydrated minerals on the surface of Pluto seems unlikely. It has yet to be formally ruled out, however.
5.1.5 Collisions
Collisions may drive the appearance of surface hydrated minerals on TNOs in multiple ways. First, cratering experiments show that impacts are likely to cause localized melting of surface water ice on TNOs if they have sufficiently high energy (Leinhardt et al., 2008). Such melts may facilitate aqueous alteration of silicates at the impact site but, like cryolava, may also obscure any hydrated minerals they create. Second, collisions also have the potential to excavate hydrated minerals buried in the subsurface of a TNO. Finally, if they have any, impactors could deliver their internal hydrated minerals to the surfaces of objects that they collide with.
Based on the above considerations, it seems plausible that many TNOs may have hydrated minerals in their interiors. If they formed in the inner trans-Neptunian disk, their shorter formation timescales could have facilitated accretion of greater quantities of actively decaying radionuclides capable of driving aqueous alteration of silicates through interior radiogenic heating. We ultimately predict, however, that unless they formed in the inner solar system, the primary mechanisms by which TNOs gain hydrated minerals at their surfaces are delivery, excavation, or formation by impacts.
Observations of the surface of Charon hint at a plausible link between impacts and the distribution of aqueous alteration products on TNOs. The disk-integrated NIR reflectance spectrum of Charon is dominated by the presence of characteristic m and m water ice absorption bands (Buie & Grundy, 2000; Brown & Calvin, 2000; Dumas et al., 2001; Cook et al., 2007; Merlin et al., 2010a; Holler et al., 2017), but accurate modeling of the continuum requires the addition of a dark material that absorbs at m and reflects neutrally at m. Buie & Grundy (2000) reported that multiple OH-bearing materials, including phyllosilicates, could provide a reasonable, if imperfect, correction to their models of Charon’s spectrum. Spatially resolved compositional mapping performed by New Horizons during its flyby of the Pluto system revealed that the dark absorber is present across much of Charon’s surface, but its abundance appears correlated with underlying geological features, including some of Charon’s impact craters (Protopapa et al., 2021). The uneven distribution of the dark absorber across Charon led Protopapa et al. (2021) to predict that it was most plausibly delivered to Charon by impactors. If hydrated minerals are indeed a component of this dark material, this prediction aligns well with our own regarding the delivery of aqueously altered material to the surfaces of TNOs.
5.2 Synthesis
Most TNOs currently accessible to spectroscopic observation are large enough that they were likely still undergoing late stage formation at a time well beyond the half-lives of 26Al and 60Fe (e.g., Kenyon & Bromley, 2012; Davidsson et al., 2016). With small unaltered objects likely being more abundant in the disk, especially at larger heliocentric distances, accretion of hydrated minerals onto the surfaces of large TNOs would have been the exception, rather than the rule. For those forming more rapidly in the inner trans-Neptunian disk, however, accretion of aqueously altered material into their surface layers may have been more frequent. As a result, such objects may have gained localized deposits of hydrated minerals on their surfaces. Spectroscopic observations of these objects performed at random viewing aspects and rotational phases could potentially exhibit variation of the kind we observe in the reflectance spectrum of 2003 AZ84 (Fornasier et al., 2009). Of course, if the m bands reported in the spectrum 2003 AZ84 are produced by hydrated minerals, we should expect their appearance to coincide with that of the m OH band.
The creation of a globally hydrated TNO (possibly such as 2004 EW95) is very challenging given the above considerations. Such an object would have to form rapidly in the inner part of the trans-Neptunian disk such that its interior, and those of the objects around it, would become aqueously altered. It would then have to experience evenly distributed impacts across its surface to gain surface hydrated minerals, while also avoiding collisions with unaltered objects that may partially blanket it with unaltered material or cause sufficient mixing of surface material that hydrated minerals become undetectable. The surface of such a TNO would also somehow have to become relatively depleted of refractory carbonaceous material that may otherwise obscure hydrated minerals. The relative consistency of the reflectance spectrum of 2004 EW95 appears to suggest that its surface has not been significantly evolved by collisions; in contrast, Saturn’s moon Phoebe has been heavily evolved by collisions and shows relatively strong spectral variation across its surface (e.g., Buratti et al., 2002; Clark et al., 2005; Vilas et al., 2006; Fraser & Brown, 2018).
A globally aqueously altered TNO could plausibly form as a chunk of the aqueously altered interior of a large disrupted parent body, but the efficiency of collisional disruption of TNOs is extremely low, especially for the large objects currently accessible to spectroscopic observation (e.g., Abedin et al., 2022). For example, the likelihood that a km diameter 3:2 resonant TNO like 2004 EW95 is the product of collisional disruption is (Abedin et al., 2022).
We therefore agree with the previous interpretation of Seccull et al. (2018); based on both its spectral similarity to carbonaceous asteroids and its particular dynamical properties (see Section 4.2), 2004 EW95 appears to be an object that formed alongside the aqueously altered outer main-belt asteroids before being scattered to its present orbit as a result of the migrations of the giant planets. Initial publications based on TNO reflectance spectra observed by JWST program 2418 at m report that a m absorption band attributable to CO2 ice appears in the spectra of many TNOs (e.g., Brown & Fraser, 2023). CO2 ice is thermodynamically stable beyond Neptune’s present orbit; at closer proximity to the Sun its volatility increases, and sublimation becomes efficient at au (e.g., Yamamoto, 1985; Sekanina, 1992; Wong & Brown, 2016; Meech, 2017). It therefore seems reasonable to predict that if 2004 EW95 did indeed form at heliocentric distances below au, its surface should be depleted of CO2 ice and the m CO2 absorption band should be absent from its reflectance spectrum. We also predict that any TNO bearing detectable hydrated minerals across its entire surface plausibly shares a similar origin to 2004 EW95, and could be an important tracer of the solar system’s dynamical evolution.
Appendix A Searching for Candidate Aqueously Altered TNOs with Colors
Many TNOs have reported photometric colors, especially in the Johnson-Cousins filters, which cover the region where m hydrated mineral features are found (e.g., Hainaut et al., 2012; Peixinho et al., 2015). The depths and breadths typical of these absorption bands (, m; e.g., Fornasier et al., 2014) makes them very difficult to detect with colors, however. The broad and overlapping bandpasses of these filters wash out any subtle changes in the curvature of the spectrum.
To identify potentially aqueously altered TNOs in the Peixinho et al. (2015) color catalog, we followed the example of Vilas et al. (2006) in using the inversed formulae of Howell (1995) to convert colors to colors from the Eight Color Asteroid Survey (Zellner et al., 1985). We then used the test described by Vilas (1994) to test for the potential presence of a m hydrated mineral band. To summarize, the color conversion formulae are
| (A1) |
| (A2) |
where the conversion factors in the removal of the solar spectral signature (Vilas et al., 2006). The resulting colors are then converted to reflectance, . If
| (A3) |
then the colors of the minor planet suggest the presence of a m absorption band in its reflectance spectrum (Vilas, 1994).
We find that this color test performs well in hinting at the presence of a m band in the spectra of TNOs, provided that the colors used are reliable. Our application of the test to averaged TNO colors yielded mixed results. Averaged colors are combined from observations taken at various, and typically random, rotational phases; this means that the number of TNOs that test positive for a m band in a catalog of averaged colors should be expected to be a lower limit. For a given object, we ultimately recommend performing this test for each of its reported sets of single-epoch colors in order to determine whether the result of the test is reproducible. In Table 2 we present the results of each test performed for each of the objects presented in this paper.
| Target | Y | N |
|---|---|---|
| 90568 (2004 GV9) | (1), | |
| 120216 (2004 EW95) | (2), | (3), and |
| 208996 (2003 AZ84) | (1), | (4), ; (5), ; (6), |
Note. This table shows whether previously published sets of colors predict the presence of a m band in the spectra of the three TNOs presented in this work. Values presented here are the result of the left-hand side of equation A3; objects with values test positive for the potential presence of a concavity in their reflectance spectrum centered near m. Numbers in the Yes (Y) and No (N) columns correspond to the following references and are presented alongside their associated values for the left-hand side of formula A3: (1) Peixinho et al. (2015); (2) Fraser et al. (2015); (3) Perna et al. (2013); (4) Fornasier et al. (2004); (5) Santos-Sanz et al. (2009); (6) Perna et al. (2010).
A.1 90568 (2004 GV9)
The average colors of 2004 GV9 published by Peixinho et al. (2015) are combined from various sources, none of which observed a full set of colors within a single epoch (Rabinowitz et al., 2008; Tegler et al., 2016). This means that it is not possible to determine whether the positive result of the test is due to the presence of a m feature or rotational variation of the spectral gradient of 2004 GV9. Although our positive test result (Table 2) was uncertain, we decided to go ahead with observing 2004 GV9 because its optical reflectance spectrum had never been published, and because Fernández-Valenzuela et al. (2021) predict it to be silicate-rich.
A.2 120216 (2004 EW95)
We initially tested the averaged colors of 2004 EW95 published by Fraser et al. (2015), and they test positive for a potential absorption near m. The colors are a combination of those published by Perna et al. (2013), and those measured from previously unpublished photometry. Closer inspection of the colors later revealed an error in the average, however, caused by a minor mistake where the colors from Perna et al. (2013) were taken as colors. As discussed in Section 4.2 the colors from Perna et al. (2013) are very inconsistent with all the other colors and spectra reported for 2004 EW95, making it difficult to trust them. When tested, the colors derived by Fraser et al. (2015) from the unpublished photometry of Perna et al. (2013) test positive, and, although uncertain, they match to our spectrum very well. We therefore consider and to be the most reliable colors for 2004 EW95.
A.3 208996 (2003 AZ84)
The average colors of 2003 AZ84 published by Peixinho et al. (2015) test positive for the presence of absorption near m, but comparison of the individual colors combined to make the average reveals a puzzling inconsistency. The average and colors are combined from multiple sources (Fornasier et al., 2004; Santos-Sanz et al., 2009; Perna et al., 2010), all of which report that the color of 2003 AZ84 is both similar to its color and slightly redder than the solar ( Ramírez et al., 2012); the color published by Rabinowitz et al. (2008) is also consistent with being approximately solar. It is not clear, then, how the average became noticably redder than all of these. We find that all sets of single-epoch colors of 2003 AZ84 from Fornasier et al. (2004), Santos-Sanz et al. (2009), and Perna et al. (2010) test negative for the presence of absorption features at m.
Appendix B Supplementary Data
Tables 3-5 present, in order, the log, geometry, and instrument configurations for our observations. Table 6 presents supplementary physical and dynamical information about our TNO targets.
| Target | UT Observation Date Time | Texp (s) | Nexp | Airmass | IQ (″) |
| HD 124523 | 2021-03-13 06:52:16–06:55:56 | 3.0 | 4 | 1.035-1.036 | 0.58-0.69 |
| 120216 (2004 EW95) | 2021-03-13 07:08:24–09:02:04 | 720.0 | 8 | 1.006-1.068 | 0.65-0.79 |
| HD 54351 | 2021-11-05 13:38:02–13:40:53 | 3.0 | 4 | 1.027-1.028 | 0.79-0.89 |
| 208996 (2003 AZ84), Epoch 1 | 2021-11-05 13:54:56–14:49:43 | 360.0 | 8 | 1.069-1.183 | 0.88-1.19 |
| HD 78534 | 2021-11-05 15:03:18–15:06:09 | 3.0 | 4 | 1.084-1.087 | 0.81-1.10 |
| HD 54351 | 2021-12-14 12:20:25–12:23:25 | 5.0 | 4 | 1.007-1.008 | 0.89-1.01 |
| 208996 (2003 AZ84), Epoch 2 | 2021-12-14 12:40:55–13:38:56 | 360.0 | 8 | 1.028-1.042 | 0.92-1.27 |
| HD 78534 | 2021-12-14 13:59:15–14:02:14 | 5.0 | 4 | 1.013-1.013 | 0.94-1.10 |
| HD 54351 | 2022-01-23 07:19:35–07:22:37 | 5.0 | 4 | 1.141-1.146 | 0.83-0.92 |
| 208996 (2003 AZ84), Epoch 3 | 2022-01-23 07:36:52–08:03:56 | 360.0 | 4 | 1.317-1.463 | 0.98-1.67 |
| HD 78534 | 2022-01-23 08:17:25–08:20:27 | 5.0 | 4 | 1.403-1.414 | 1.27-1.55 |
| HD 54351 | 2022-01-25 10:23:53–10:26:56 | 5.0 | 4 | 1.049-1.051 | 0.96-1.02 |
| 208996 (2003 AZ84), Epoch 4 | 2022-01-25 10:40:44–11:35:01 | 360.0 | 8 | 1.026-1.061 | 0.85-1.07 |
| HD 78534 | 2022-01-25 11:44:27–11:47:33 | 5.0 | 4 | 1.022-1.023 | 0.91-1.03 |
| HD 124523 | 2022-03-07 07:33:54–07:35:38 | 5.0 | 4 | 1.028-1.029 | 1.07-1.61 |
| 90568 (2004 GV9), Epoch 1 | 2022-03-07 08:09:16–08:23:23 | 60.0 | 8 | 1.021-1.033 | 1.14-1.37 |
| HD 157750 | 2023-03-07 08:32:59–08:34:29 | 2.0 | 4 | 1.194-1.198 | 0.95-1.34 |
| HD 124523 | 2023-04-19 08:10:21–08:11:49 | 5.0 | 4 | 1.260-1.262 | 1.08-1.11 |
| 90568 (2004 GV9), Epoch 2 | 2023-04-19 08:25:53–08:48:47 | 135.0 | 8 | 1.117-1.173 | 0.92-1.05 |
| HD 124523 | 2023-04-20 07:39:08–07:40:37 | 5.0 | 4 | 1.187-1.191 | 0.85-0.90 |
| 90568 (2004 GV9), Epoch 3 | 2023-04-20 07:56:57–08:19:52 | 135.0 | 8 | 1.072-1.114 | 0.87-0.95 |
| HD 124523 | 2023-04-25 04:42:54–04:45:25 | 5.0 | 4 | 1.019-1.025 | 0.64-0.75 |
| 90568 (2004 GV9), Epoch 4 | 2023-04-25 04:55:55–05:19:13 | 135.0 | 8 | 1.019-1.039 | 0.71-0.94 |
Note. For each target we present the UT observation date and time, the integration time per exposure (Texp), the number of exposures (Nexp), and the airmass at which they were observed. The range of estimated IQ values presented for each target is the range of FWHMs measured from Moffat profiles (Moffat, 1969) fitted to the set of spatial profiles produced by median collapsing each of a target’s reduced 2D spectroscopic exposures along the dispersion axis.
| Target | R.A. (hr) Decl. (deg) | rH (au) | (au) | (deg) | mV (mag) |
|---|---|---|---|---|---|
| 120216 (2004 EW95) | 15 23 45.58 -34 58 08.4 | 27.045 | 26.624 | 1.93 | |
| 208996 (2003 AZ84) Epoch 1 | 08 33 46.21 +07 05 59.6 | 44.135 | 44.054 | 1.29 | |
| 208996 (2003 AZ84) Epoch 2 | 08 32 39.68 +06 59 36.4 | 44.123 | 43.450 | 0.95 | |
| 208996 (2003 AZ84) Epoch 3 | 08 29 53.03 +07 04 22.8 | 44.110 | 43.148 | 0.28 | |
| 208996 (2003 AZ84) Epoch 4 | 08 29 42.92 +07 04 55.0 | 44.109 | 43.145 | 0.26 | |
| 90568 (2004 GV9) Epoch 1 | 15 27 28.76 -25 28 36.5 | 39.762 | 39.404 | 1.34 | |
| 90568 (2004 GV9) Epoch 2 | 15 31 45.32 -25 11 09.3 | 39.824 | 38.939 | 0.70 | |
| 90568 (2004 GV9) Epoch 3 | 15 31 40.71 -25 10 52.8 | 39.824 | 38.931 | 0.68 | |
| 90568 (2004 GV9) Epoch 4 | 15 31 17.31 -25 09 27.1 | 39.825 | 38.897 | 0.57 |
Note. For the median time of each TNO observation, we present the target’s coordinates, heliocentric distance (), geocentric distance (), phase angle (), and estimated apparent V-band magnitude (). is calculated with , where values were taken directly from the TNOs are Cool public database (Mommert et al., 2012; Vilenius et al., 2012). values for 2003 AZ84 and 2004 GV9 were taken directly from Rabinowitz et al. (2008). was estimated for 2004 EW95 by averaging values published by Rabinowitz et al. (2007) for TNOs with .
| Target | Instrument Program | Grating Filter | (m) | Slit Width (″) | |
|---|---|---|---|---|---|
| 120216 (2004 EW95) | GMOS-S GS-2021A-DD-101 | R150 OG515 | 0.70 | 1.0 | |
| 208996 (2003 AZ84) | GMOS-N GN-2021B-Q-313 | R400 GG455 | 0.70 | 2.0 | |
| 90568 (2004 GV9) | GMOS-S GS-2022A-Q-313 | R150 GG455 | 0.56 | 1.0 | |
| 90568 (2004 GV9) | GMOS-S GS-2023A-FT-105 | R150 GG455 | 1.00 | 1.0 |
Note. We present the instrument configuration used to observe each TNO, including the instrument name and Gemini program number, the combination of grating and order blocking filter, the central wavelength setting for the grating (), the width of the slit used, and the approximate native resolving power of the spectrograph for each configuration at the blaze wavelength of the grating (m for R150; m for R400).
| Target | (mag) | km | Source | (au) | (au) | (au) | e | i (deg) | |
|---|---|---|---|---|---|---|---|---|---|
| 90568 (2004 GV9) | (1) | 38.74 | 44.82 | 41.78 | 0.0728 | 22.02 | |||
| 120216 (2004 EW95) | (2) | 26.97 | 51.56 | 39.27 | 0.3131 | 29.33 | |||
| 208996 (2003 AZ84) | (2) | 32.32 | 46.40 | 39.36 | 0.1788 | 13.56 |
Note. Here we present selected physical and orbital parameters for each of our targets, including absolute -band magnitude (), diameter (), -band geometric albedo , orbital perihelion distance (), orbital aphelion distance (), orbital semimajor axis (), orbital eccentricity (), and orbital inclination (). Sizes, albedos, and absolute magnitudes are referenced from (1) Vilenius et al. (2012) and (2) Mommert et al. (2012). Orbital parameters are taken from the Small-Body Database maintained by the Jet Propulsion Laboratory Solar System Dynamics group.
Appendix C Spectrum extraction with MOTES
MOTES is our Modular Optimized Tracer and Extractor of Spectra (T. Seccull & D.A. Kiersz 2024, in preparation). Like Seccull et al. (2018), MOTES fits 1D Moffat profiles (Moffat, 1969) to the average spatial point-spread function (PSF) of each 2D spectrum within multiple adjacent dispersion bins along its wavelength axis to track its wavelength-dependent center position, FWHM, and overall PSF shape. The first iteration of this process is used to locate the background regions that can be used for sky subtraction. For the TNOs we defined the background to be anywhere outside of boundaries set at along the spatial axis from the center of the spectrum’s spatial profile. The spatial profiles of the much brighter calibrator star spectra had better defined wings, so we often had to adjust the sky boundaries and set them at greater distances from the spatial profile center. The pixels in the sky regions were used to estimate and subtract the contribution of the background. In all cases the sky subtraction was performed for each wavelength element in turn, after the background pixels had been sigma-clipped at to remove any remaining residual bad pixels or cosmic rays. The background in each 2D spectrum of 2003 AZ84 and 2004 EW95 was modeled and subtracted with a linear fit to improve subtraction of prominent sky emission lines at longer wavelengths and, in some cases, subtraction of faint diffuse background sources that drifted into the slit during our observations of each TNO. A simple median sky subtraction was sufficient for all observations of 2004 GV9 and our solar calibrator stars.
After sky subtraction we localized the spectrum a second time for extraction. The boundaries of the extraction aperture were set at from the spatial profile center for all targets and calibrators. For each dispersion element in turn, the local spatial profile was estimated by taking the nearest average Moffat profile and the estimated local profile center (both determined during localization) and aligning the former with the latter. This recentered Moffat profile was truncated by setting its values to zero for regions outside the extraction aperture and was then normalized by dividing it by its sum. An optimal extraction (similar to that described by Horne, 1986) was then performed with this normalized spatial profile.
Appendix D Notes on Spectrum Binning
As discussed in Section 3, the bootstrapping method reported by Seccull et al. (2019) was used to bin our reflectance spectra. Here we elaborate on the selection process for the binning factor of each spectrum. For a given spectrum, we selected an appropriate binning factor through a process of iterative trial-and-error testing of different binning factors and comparative visual inspection of the binned spectrum, the unbinned 2D spectroscopic frames mapping the location of sky emission lines, and published maps of optical-NIR telluric absorption bands (Smette et al., 2015).
As different binning factors are tested, the influence of residual sky emission lines, telluric absorption bands, and other instrumental effects are carefully identified and tracked. Suspected features of the spectrum, and absorption bands in particular, are also checked for consistent behavior (overall shape and location) at different binning factors to determine whether they are real (i.e., appearing consistently) or spurious. Through this method we aim to simultaneously achieve multiple things:
-
1.
Boost the S/N of the reflectance spectrum and clarify its intrinsic features. A related aim is the minimization of noisy residual structures in the data that are not intrinsic to the spectrum of the target (e.g., residual cosmic rays and sky emission lines).
-
2.
Preserve the real shape of the spectrum. Binning a spectrum may smear out weak features to the point that they become hidden; equally, some binning factors may amplify noisy residuals and produce features in the binned spectrum that do not really exist.
-
3.
Minimize loss of spectral resolution.
-
4.
Maintain consistent spectral resolution between different spectra of a given target.
Simultaneously meeting all these criteria for all spectra is often impossible, so we always give priority to aims one and two. In some cases, it therefore becomes necessary to use a large binning factor to beat down noisy residuals in a spectrum and adequately reveal its intrinsic shape. Fortunately, most solid state absorption bands expected to be present in the reflectance spectra of minor planets are very broad and can still be identified following a significant reduction in spectral resolution. In cases where satisfactory negation of residual features is impossible, we resort to flagging the data points they affect in the spectrum as bad.
Appendix E Spectral Gradient Measurement
Our method of spectral gradient measurement is based on that described by Seccull et al. (2019). For a binned reflectance spectrum, the set of values comprising each of its bins was bootstrapped 1000 times allowing for repeats and rebinned to produce 1000 resampled reflectance spectra with identical binning factor to the original. A linear regression was performed for each resampled spectrum over the required wavelength interval to measure the distribution of their spectral gradients. The final gradient measurement, , was defined as the mean of this distribution, and the standard error of the mean, (given by , where ), was taken as its uncertainty.
We estimate the final uncertainty of our gradient measurements to be the quadratic sum
| (E1) |
where is the standard error of our measurement of , is the gradient measured for the optimally extracted spectrum, is the gradient measured for the aperture extracted spectrum, is the median airmass of the TNO observation, and is the median airmass of the calibrator star observation. Marsset et al. (2020) showed that a spectral gradient uncertainty of m is imparted to asteroid reflectance spectra per 0.1 unit airmass difference between the asteroid and its calibrator star when they are observed. We also account for this uncertainty, but conservatively set the value from Marsset et al. (2020) to m and divide it by 10 to convert it to our gradient units (m). Because our gradient uncertainty is m per 0.1 unit airmass, we can substitute the airmass difference between TNO and calibrator star directly into equation E1 in place of the gradient uncertainty derived from the airmass.
Appendix F Checking the Color Variation of 2003 AZ84
To test the veracity of our detection of variation in the color of 2003 AZ84, we performed a number of checks and tests regarding our observation and data reduction procedures. Possible causes of slit losses at the time of observation were considered. We confirmed that the slit was correctly aligned to the average parallactic angle and used Gacq (the Gemini Observatory acquisition tool) to check how well all our targets were centered within the slit. Gacq showed that the targets were well centered, never being more than 2 pixels from the slit center (2 pixels is 0.8% of the 2″ slit width). The calibrator stars were both solar twins (Porto de Mello et al., 2014; Ramírez et al., 2014), and are not expected to be significantly spectrally variable; even if they do vary, a synchronization of their variation, both with each other and with the rotation period of 2003 AZ84, seems vanishingly unlikely. We varied the width of the extraction aperture when reducing our spectra and compared spectra extracted using both optimal extraction and aperture extraction. We found that an increase to the contribution of pixels further from the center of the spectrum’s spatial profile, either by widening the extraction aperture or by removing the weightings imposed by optimal extraction (i.e., by just doing a simple aperture extraction), resulted in a modest reduction in the gradient of the final spectrum. This means that, at all epochs, using optimal extraction and a smaller aperture would limit the effects of imperfectly subtracted sky on the shape of the final spectrum. In all cases, however, changing the extraction parameters never changed the gradients of any of the spectra to the extent of the variation we observe in the data from epoch to epoch. Differences in the gradients measured for spectra extracted with different methods have been factored into the uncertainties of each of our gradient measurements. All flat-field frames were also checked and found to be consistent across all epochs to . As a result, we confirmed that the apparent color variation of 2003 AZ84 is real.
References
- Abedin et al. (2022) Abedin, A. Y., Kavelaars, J. J., Petit, J.-M., et al. 2022, AJ, 164, 261, doi: 10.3847/1538-3881/ac9cdb
- Alvarez-Candal et al. (2008) Alvarez-Candal, A., Fornasier, S., Barucci, M. A., de Bergh, C., & Merlin, F. 2008, Astronomy & Astrophysics, 487, 741, doi: 10.1051/0004-6361:200809705
- Astropy Collaboration et al. (2013) Astropy Collaboration, Robitaille, T. P., Tollerud, E. J., et al. 2013, A&A, 558, A33, doi: 10.1051/0004-6361/201322068
- Baldwin & Stone (1984) Baldwin, J. A., & Stone, R. P. S. 1984, MNRAS, 206, 241, doi: 10.1093/mnras/206.2.241
- Barkume et al. (2008) Barkume, K. M., Brown, M. E., & Schaller, E. L. 2008, The Astronomical Journal, 135, 55, doi: 10.1088/0004-6256/135/1/55
- Barucci et al. (2011) Barucci, M. A., Alvarez-Candal, A., Merlin, F., et al. 2011, Icarus, 214, 297, doi: 10.1016/j.icarus.2011.04.019
- Barucci et al. (2006) Barucci, M. A., Merlin, F., Dotto, E., Doressoundiram, A., & de Bergh, C. 2006, Astronomy & Astrophysics, 455, 725, doi: 10.1051/0004-6361:20064951
- Brown & Calvin (2000) Brown, M. E., & Calvin, W. M. 2000, Science, 287, 107, doi: 10.1126/science.287.5450.107
- Brown & Fraser (2023) Brown, M. E., & Fraser, W. C. 2023, \psj, 4, 130, doi: 10.3847/PSJ/ace2ba
- Brown et al. (2012) Brown, M. E., Schaller, E. L., & Fraser, W. C. 2012, The Astronomical Journal, 143, 146, doi: 10.1088/0004-6256/143/6/146
- Brunetto et al. (2006) Brunetto, R., Barucci, M. A., Dotto, E., & Strazzulla, G. 2006, The Astrophysical Journal, 644, 646, doi: 10.1086/503359
- Buie & Grundy (2000) Buie, M. W., & Grundy, W. M. 2000, Icarus, 148, 324, doi: 10.1006/icar.2000.6509
- Buratti et al. (2002) Buratti, B. J., Hicks, M. D., Tryka, K. A., Sittig, M. S., & Newburn, R. L. 2002, Icarus, 155, 375, doi: 10.1006/icar.2001.6730
- Castillo-Rogez et al. (2009) Castillo-Rogez, J., Johnson, T. V., Lee, M. H., et al. 2009, Icarus, 204, 658, doi: 10.1016/j.icarus.2009.07.025
- Choi et al. (2002) Choi, Y.-J., Cohen, M., Merk, R., & Prialnik, D. 2002, Icarus, 160, 300, doi: 10.1006/icar.2002.6976
- Clark et al. (2005) Clark, R. N., Brown, R. H., Jaumann, R., et al. 2005, Nature, 435, 66, doi: 10.1038/nature03558
- Cloutis et al. (2011) Cloutis, E. A., Hiroi, T., Gaffey, M. J., Alexander, C. M. O. ., & Mann, P. 2011, Icarus, 212, 180, doi: 10.1016/j.icarus.2010.12.009
- Cook et al. (2007) Cook, J. C., Desch, S. J., Roush, T. L., Trujillo, C. A., & Geballe, T. R. 2007, The Astrophysical Journal, 663, 1406, doi: 10.1086/518222
- Coradini et al. (2008) Coradini, A., Capria, M. T., de Sanctis, M. C., & McKinnon, W. B. 2008, The Structure of Kuiper Belt Bodies: Link with Comets, ed. M. A. Barucci, H. Boehnhardt, D. P. Cruikshank, A. Morbidelli, & R. Dotson (Tucson, AZ: Arizona Univ. Press), 243–256
- Cruikshank et al. (2005) Cruikshank, D. P., Imanaka, H., & Dalle Ore, C. M. 2005, Advances in Space Research, 36, 178, doi: 10.1016/j.asr.2005.07.026
- Cruikshank et al. (1998) Cruikshank, D. P., Roush, T. L., Bartholomew, M. J., et al. 1998, Icarus, 135, 389, doi: 10.1006/icar.1998.5997
- Cruikshank et al. (2019) Cruikshank, D. P., Umurhan, O. M., Beyer, R. A., et al. 2019, Icarus, 330, 155, doi: 10.1016/j.icarus.2019.04.023
- Cruikshank et al. (2021) Cruikshank, D. P., Dalle Ore, C. M., Scipioni, F., et al. 2021, Icarus, 356, 113786, doi: 10.1016/j.icarus.2020.113786
- Dalle Ore et al. (2013) Dalle Ore, C. M., Dalle Ore, L. V., Roush, T. L., et al. 2013, Icarus, 222, 307, doi: 10.1016/j.icarus.2012.11.015
- Dalle Ore et al. (2015) Dalle Ore, C. M., Barucci, M. A., Emery, J. P., et al. 2015, Icarus, 252, 311, doi: 10.1016/j.icarus.2015.01.014
- Davidsson et al. (2016) Davidsson, B. J. R., Sierks, H., Güttler, C., et al. 2016, A&A, 592, A63, doi: 10.1051/0004-6361/201526968
- de Bergh et al. (2004) de Bergh, C., Boehnhardt, H., Barucci, M. A., et al. 2004, Astronomy & Astrophysics, 416, 791, doi: 10.1051/0004-6361:20031727
- De Sanctis et al. (2001) De Sanctis, M. C., Capria, M. T., & Coradini, A. 2001, AJ, 121, 2792, doi: 10.1086/320385
- DeMeo et al. (2009) DeMeo, F. E., Fornasier, S., Barucci, M. A., et al. 2009, A&A, 493, 283, doi: 10.1051/0004-6361:200810561
- Dias-Oliveira et al. (2017) Dias-Oliveira, A., Sicardy, B., Ortiz, J. L., et al. 2017, AJ, 154, 22, doi: 10.3847/1538-3881/aa74e910.48550/arXiv.1705.10895
- Dotto et al. (2008) Dotto, E., Perna, D., Barucci, M. A., et al. 2008, A&A, 490, 829, doi: 10.1051/0004-6361:200809615
- Dumas et al. (2001) Dumas, C., Terrile, R. J., Brown, R. H., Schneider, G., & Smith, B. A. 2001, AJ, 121, 1163, doi: 10.1086/318747
- Fernández-Valenzuela et al. (2021) Fernández-Valenzuela, E., Pinilla-Alonso, N., Stansberry, J., et al. 2021, \psj, 2, 10, doi: 10.3847/PSJ/abc34e
- Filippenko (1982) Filippenko, A. V. 1982, Publications of the Astronomical Society of the Pacific, 94, 715, doi: 10.1086/131052
- Fornasier et al. (2014) Fornasier, S., Lantz, C., Barucci, M. A., & Lazzarin, M. 2014, Icarus, 233, 163, doi: 10.1016/j.icarus.2014.01.040
- Fornasier et al. (2004) Fornasier, S., Doressoundiram, A., Tozzi, G. P., et al. 2004, Astronomy & Astrophysics, 421, 353, doi: 10.1051/0004-6361:20041221
- Fornasier et al. (2009) Fornasier, S., Barucci, M. A., de Bergh, C., et al. 2009, Astronomy & Astrophysics, 508, 457, doi: 10.1051/0004-6361/200912582
- Fraeman et al. (2014) Fraeman, A. A., Murchie, S. L., Arvidson, R. E., et al. 2014, Icarus, 229, 196, doi: 10.1016/j.icarus.2013.11.021
- Fraser & Brown (2012) Fraser, W. C., & Brown, M. E. 2012, The Astrophysical Journal, 749, 33, doi: 10.1088/0004-637X/749/1/33
- Fraser & Brown (2018) —. 2018, AJ, 156, 23, doi: 10.3847/1538-3881/aac213
- Fraser et al. (2015) Fraser, W. C., Brown, M. E., & Glass, F. 2015, The Astrophysical Journal, 804, 31, doi: 10.1088/0004-637X/804/1/31
- Gimeno et al. (2016) Gimeno, G., Roth, K., Chiboucas, K., et al. 2016, in Society of Photo-Optical Instrumentation Engineers (SPIE) Conference Series, Vol. 9908, Ground-based and Airborne Instrumentation for Astronomy VI, ed. C. J. Evans, L. Simard, & H. Takami, 99082S, doi: 10.1117/12.2233883
- Green (2012) Green, W. 2012, Society for Astronomical Sciences Annual Symposium, 31, 159
- Grundy et al. (2020) Grundy, W. M., Bird, M. K., Britt, D. T., et al. 2020, Science, 367, aay3705, doi: 10.1126/science.aay3705
- Guilbert et al. (2009a) Guilbert, A., Alvarez-Candal, A., Merlin, F., et al. 2009a, Icarus, 201, 272, doi: 10.1016/j.icarus.2008.12.023
- Guilbert et al. (2009b) Guilbert, A., Barucci, M. A., Brunetto, R., et al. 2009b, A&A, 501, 777, doi: 10.1051/0004-6361/200911660
- Guilbert-Lepoutre (2011) Guilbert-Lepoutre, A. 2011, AJ, 141, 103, doi: 10.1088/0004-6256/141/3/103
- Guilbert-Lepoutre et al. (2011) Guilbert-Lepoutre, A., Lasue, J., Federico, C., et al. 2011, A&A, 529, A71, doi: 10.1051/0004-6361/201014194
- Guilbert-Lepoutre et al. (2020) Guilbert-Lepoutre, A., Prialnik, D., & Métayer, R. 2020, in The Trans-Neptunian Solar System, ed. D. Prialnik, M. A. Barucci, & L. Young, 183–201, doi: 10.1016/B978-0-12-816490-7.00008-4
- Hahn & Malhotra (2005) Hahn, J. M., & Malhotra, R. 2005, The Astronomical Journal, 130, 2392, doi: 10.1086/452638
- Hainaut et al. (2012) Hainaut, O. R., Boehnhardt, H., & Protopapa, S. 2012, A&A, 546, A115, doi: 10.1051/0004-6361/201219566
- Hainaut & Delsanti (2002) Hainaut, O. R., & Delsanti, A. C. 2002, Astronomy & Astrophysics, 389, 641, doi: 10.1051/0004-6361:20020431
- Harris et al. (2020) Harris, C. R., Millman, K. J., van der Walt, S. J., et al. 2020, Nature, 585, 357, doi: 10.1038/s41586-020-2649-2
- Hendrix & Vilas (2019) Hendrix, A. R., & Vilas, F. 2019, Geophys. Res. Lett., 46, 14,307, doi: 10.1029/2019GL085883
- Holler et al. (2017) Holler, B. J., Young, L. A., Buie, M. W., et al. 2017, Icarus, 284, 394, doi: 10.1016/j.icarus.2016.12.003
- Hook et al. (2004) Hook, I. M., Jørgensen, I., Allington-Smith, J. R., et al. 2004, PASP, 116, 425, doi: 10.1086/383624
- Horne (1986) Horne, K. 1986, Publications of the Astronomical Society of the Pacific, 98, 609, doi: 10.1086/131801
- Howell (1995) Howell, E. S. 1995, PhD thesis, Tucson, AZ: University of Arizona
- Howell et al. (2011) Howell, E. S., Rivkin, A. S., Vilas, F., et al. 2011, in EPSC-DPS Joint Meeting 2011, Vol. 2011, 637
- Hunter (2007) Hunter, J. D. 2007, Computing in Science Engineering, 9, 90
- Jones et al. (1990) Jones, T. D., Lebofsky, L. A., Lewis, J. S., & Marley, M. S. 1990, Icarus, 88, 172, doi: 10.1016/0019-1035(90)90184-B
- Kargel (1992) Kargel, J. S. 1992, Icarus, 100, 556, doi: 10.1016/0019-1035(92)90118-Q
- Kebukawa et al. (2017) Kebukawa, Y., Chan, Q. H. S., Tachibana, S., Kobayashi, K., & Zolensky, M. E. 2017, Science Advances, 3, e1602093, doi: 10.1126/sciadv.1602093
- Keller & Flynn (2022) Keller, L. P., & Flynn, G. J. 2022, Nature Astronomy, 6, 731, doi: 10.1038/s41550-022-01647-6
- Kenyon & Bromley (2012) Kenyon, S. J., & Bromley, B. C. 2012, AJ, 143, 63, doi: 10.1088/0004-6256/143/3/63
- Lacerda et al. (2014) Lacerda, P., Fornasier, S., Lellouch, E., et al. 2014, The Astrophysical Journal, 793, L2, doi: 10.1088/2041-8205/793/1/L2
- Lawler & Gladman (2013) Lawler, S. M., & Gladman, B. 2013, The Astronomical Journal, 146, 6, doi: 10.1088/0004-6256/146/1/6
- Lazzarin et al. (2003) Lazzarin, M., Barucci, M. A., Boehnhardt, H., et al. 2003, The Astronomical Journal, 125, 1554, doi: 10.1086/367771
- Lebofsky (1980) Lebofsky, L. A. 1980, AJ, 85, 573, doi: 10.1086/112714
- Leinhardt et al. (2008) Leinhardt, Z. M., Stewart, S. T., & Schultz, P. H. 2008, Physical Effects of Collisions in the Kuiper Belt, ed. M. A. Barucci, H. Boehnhardt, D. P. Cruikshank, A. Morbidelli, & R. Dotson (Tucson, AZ: Arizona Univ. Press), 195–211
- Levison et al. (2008) Levison, H. F., Morbidelli, A., Van Laerhoven, C., Gomes, R., & Tsiganis, K. 2008, Icarus, 196, 258, doi: 10.1016/j.icarus.2007.11.035
- Lisse et al. (2006) Lisse, C. M., VanCleve, J., Adams, A. C., et al. 2006, Science, 313, 635, doi: 10.1126/science.1124694
- Lykawka & Mukai (2007) Lykawka, P. S., & Mukai, T. 2007, Icarus, 189, 213, doi: 10.1016/j.icarus.2007.01.001
- Malamud & Prialnik (2015) Malamud, U., & Prialnik, D. 2015, Icarus, 246, 21, doi: 10.1016/j.icarus.2014.02.027
- Marsset et al. (2019) Marsset, M., Fraser, W. C., Pike, R. E., et al. 2019, The Astronomical Journal, 157, 94, doi: 10.3847/1538-3881/aaf72e
- Marsset et al. (2020) Marsset, M., DeMeo, F. E., Binzel, R. P., et al. 2020, ApJS, 247, 73, doi: 10.3847/1538-4365/ab7b5f
- McCully et al. (2018) McCully, C., Crawford, S., Kovacs, G., et al. 2018, Astropy/Astroscrappy: V1.0.5 Zenodo Release, v1.0.5, Zenodo, Zenodo, doi: 10.5281/zenodo.1482019
- McKinnon (2002) McKinnon, W. B. 2002, in ESA Special Publication, Vol. 500, Asteroids, Comets, and Meteors: ACM 2002, ed. B. Warmbein, 29–38
- McKinnon et al. (2008) McKinnon, W. B., Prialnik, D., Stern, S. A., & Coradini, A. 2008, Structure and Evolution of Kuiper Belt Objects and Dwarf Planets, ed. M. A. Barucci, H. Boehnhardt, D. P. Cruikshank, A. Morbidelli, & R. Dotson (Tucson, AZ: Arizona Univ. Press), 213–241
- Meech (2017) Meech, K. J. 2017, Philosophical Transactions of the Royal Society of London Series A, 375, 20160247, doi: 10.1098/rsta.2016.0247
- Menzel & Roberge (2013) Menzel, R. L., & Roberge, W. G. 2013, ApJ, 776, 89, doi: 10.1088/0004-637X/776/2/89
- Merk & Prialnik (2003) Merk, R., & Prialnik, D. 2003, Earth Moon and Planets, 92, 359, doi: 10.1023/B:MOON.0000031952.89891.a4
- Merk & Prialnik (2006) —. 2006, Icarus, 183, 283, doi: 10.1016/j.icarus.2006.02.011
- Merlin et al. (2010a) Merlin, F., Barucci, M. A., de Bergh, C., et al. 2010a, Icarus, 210, 930, doi: 10.1016/j.icarus.2010.07.028
- Merlin et al. (2010b) —. 2010b, Icarus, 208, 945, doi: 10.1016/j.icarus.2010.03.014
- Merlin et al. (2017) Merlin, F., Hromakina, T., Perna, D., Hong, M. J., & Alvarez-Candal, A. 2017, Astronomy & Astrophysics, 604, A86, doi: 10.1051/0004-6361/201730933
- Moffat (1969) Moffat, A. F. J. 1969, Astronomy & Astrophysics, 3, 455
- Mommert et al. (2012) Mommert, M., Harris, A. W., Kiss, C., et al. 2012, Astronomy & Astrophysics, 541, A93, doi: 10.1051/0004-6361/201118562
- Morbidelli & Nesvorný (2020) Morbidelli, A., & Nesvorný, D. 2020, Kuiper belt: formation and evolution, ed. D. Prialnik, M. A. Barucci, & L. Young, 25–59, doi: 10.1016/B978-0-12-816490-7.00002-3
- Morbidelli et al. (2007) Morbidelli, A., Tsiganis, K., Crida, A., Levison, H. F., & Gomes, R. 2007, AJ, 134, 1790, doi: 10.1086/521705
- Noll et al. (2020) Noll, K., Grundy, W. M., Nesvorný, D., & Thirouin, A. 2020, Trans-Neptunian binaries (2018), ed. D. Prialnik, M. A. Barucci, & L. Young, 201–224, doi: 10.1016/B978-0-12-816490-7.00009-6
- Peixinho et al. (2015) Peixinho, N., Delsanti, A., & Doressoundiram, A. 2015, Astronomy & Astrophysics, 577, A35, doi: 10.1051/0004-6361/201425436
- Perna et al. (2013) Perna, D., Dotto, E., Barucci, M. A., et al. 2013, A&A, 554, A49, doi: 10.1051/0004-6361/201219859
- Perna et al. (2010) Perna, D., Barucci, M. A., Fornasier, S., et al. 2010, Astronomy & Astrophysics, 510, A53, doi: 10.1051/0004-6361/200913654
- Poch et al. (2016) Poch, O., Pommerol, A., Jost, B., et al. 2016, Icarus, 267, 154, doi: 10.1016/j.icarus.2015.12.017
- Porto de Mello et al. (2014) Porto de Mello, G. F., da Silva, R., da Silva, L., & de Nader, R. V. 2014, A&A, 563, A52, doi: 10.1051/0004-6361/201322277
- Protopapa et al. (2021) Protopapa, S., Cook, J. C., Grundy, W. M., et al. 2021, in The Pluto System After New Horizons, ed. S. A. Stern, J. M. Moore, W. M. Grundy, L. A. Young, & R. P. Binzel, 433–456, doi: 10.2458/azu_uapress_9780816540945-ch019
- Rabinowitz et al. (2008) Rabinowitz, D. L., Schaefer, B. E., Schaefer, M., & Tourtellotte, S. W. 2008, AJ, 136, 1502, doi: 10.1088/0004-6256/136/4/1502
- Rabinowitz et al. (2007) Rabinowitz, D. L., Schaefer, B. E., & Tourtellotte, S. W. 2007, The Astronomical Journal, 133, 26, doi: 10.1086/508931
- Ramírez et al. (2012) Ramírez, I., Michel, R., Sefako, R., et al. 2012, The Astrophysical Journal, 752, 5, doi: 10.1088/0004-637X/752/1/5
- Ramírez et al. (2014) Ramírez, I., Meléndez, J., Bean, J., et al. 2014, A&A, 572, A48, doi: 10.1051/0004-6361/201424244
- Raymond & Izidoro (2017) Raymond, S. N., & Izidoro, A. 2017, Icarus, 297, 134, doi: 10.1016/j.icarus.2017.06.030
- Reitmeijer & MacKinnon (1987) Reitmeijer, F. J. M., & MacKinnon, I. D. R. 1987, in ESA Special Publication, Vol. 278, Diversity and Similarity of Comets, ed. E. J. Rolfe, B. Battrick, M. Ackerman, M. Scherer, & R. Reinhard (Brussels: European Space Agency)
- Reuter et al. (2008) Reuter, D. C., Stern, S. A., Scherrer, J., et al. 2008, Space Science Reviews, 140, 129, doi: 10.1007/s11214-008-9375-7
- Rivkin et al. (2015) Rivkin, A. S., Campins, H., Emery, J. P., et al. 2015, Astronomical Observations of Volatiles on Asteroids, ed. P. Michel, F. E. DeMeo, & W. F. Bottke (Tucson, AZ: Arizona Univ. Press), 65–87, doi: 10.2458/azu_uapress_9780816532131-ch004
- Rivkin et al. (2022) Rivkin, A. S., Emery, J. P., Howell, E. S., et al. 2022, \psj, 3, 153, doi: 10.3847/PSJ/ac721710.48550/arXiv.2205.09166
- Roush & Dalton (2004) Roush, T. L., & Dalton, J. B. 2004, Icarus, 168, 158, doi: 10.1016/j.icarus.2003.11.001
- Santos-Sanz et al. (2009) Santos-Sanz, P., Ortiz, J. L., Barrera, L., & Boehnhardt, H. 2009, Astronomy & Astrophysics, 494, 693, doi: 10.1051/0004-6361:20078301
- Seccull (2020) Seccull, T. 2020, PhD thesis, (Belfast: Queen’s University Belfast). https://pure.qub.ac.uk/en/studentTheses/revealing-refractory-materials-on-trans-neptunian-objects-and-cen
- Seccull et al. (2018) Seccull, T., Fraser, W. C., Puzia, T. H., Brown, M. E., & Schönebeck, F. 2018, The Astrophysical Journal, 855, L26, doi: 10.3847/2041-8213/aab3dc
- Seccull et al. (2019) Seccull, T., Fraser, W. C., Puzia, T. H., Fitzsimmons, A., & Cupani, G. 2019, AJ, 157, 88, doi: 10.3847/1538-3881/aafbe4
- Sekanina (1992) Sekanina, Z. 1992, in Asteroids, Comets, Meteors 1991, ed. A. W. Harris & E. Bowell, 545
- Sheppard (2007) Sheppard, S. S. 2007, AJ, 134, 787, doi: 10.1086/519072
- Shock (1993) Shock, E. L. 1993, Geochim. Cosmochim. Acta, 57, 3341, doi: 10.1016/0016-7037(93)90542-5
- Singer et al. (2022) Singer, K. N., White, O. L., Schmitt, B., et al. 2022, Nature Communications, 13, 1542, doi: 10.1038/s41467-022-29056-3
- Smette et al. (2015) Smette, A., Sana, H., Noll, S., et al. 2015, Astronomy & Astrophysics, 576, A77, doi: 10.1051/0004-6361/201423932
- Sonett et al. (1970) Sonett, C. P., Colburn, D. S., Schwartz, K., & Keil, K. 1970, Ap&SS, 7, 446, doi: 10.1007/BF00653283
- Stone & Baldwin (1983) Stone, R. P. S., & Baldwin, J. A. 1983, MNRAS, 204, 347, doi: 10.1093/mnras/204.2.347
- Sultana et al. (2023) Sultana, R., Poch, O., Beck, P., et al. 2023, Icarus, 395, 115492, doi: 10.1016/j.icarus.2023.115492
- Suttle et al. (2021) Suttle, M. D., King, A. J., Schofield, P. F., Bates, H., & Russell, S. S. 2021, Geochim. Cosmochim. Acta, 299, 219, doi: 10.1016/j.gca.2021.01.014
- Takir & Emery (2012) Takir, D., & Emery, J. P. 2012, Icarus, 219, 641, doi: 10.1016/j.icarus.2012.02.022
- Tegler et al. (2016) Tegler, S. C., Romanishin, W., & Consolmagno, G. J. 2016, The Astronomical Journal, 152, 210, doi: 10.3847/0004-6256/152/6/210
- Thirouin et al. (2010) Thirouin, A., Ortiz, J. L., Duffard, R., et al. 2010, A&A, 522, A93, doi: 10.1051/0004-6361/200912340
- Tody (1986) Tody, D. 1986, in Society of Photo-Optical Instrumentation Engineers (SPIE) Conference Series, Vol. 627, Instrumentation in astronomy VI, ed. D. L. Crawford, 733, doi: 10.1117/12.968154
- Tody (1993) Tody, D. 1993, in Astronomical Society of the Pacific Conference Series, Vol. 52, Astronomical Data Analysis Software and Systems II, ed. R. J. Hanisch, R. J. V. Brissenden, & J. Barnes, 173
- van Dokkum (2001) van Dokkum, P. G. 2001, PASP, 113, 1420, doi: 10.1086/323894
- Vilas (1994) Vilas, F. 1994, Icarus, 111, 456, doi: 10.1006/icar.1994.1156
- Vilas & Gaffey (1989) Vilas, F., & Gaffey, M. J. 1989, Science, 246, 790, doi: 10.1126/science.246.4931.790
- Vilas et al. (1994) Vilas, F., Jarvis, K. S., & Gaffey, M. J. 1994, Icarus, 109, 274, doi: 10.1006/icar.1994.1093
- Vilas et al. (2006) Vilas, F., Lederer, S. M., Gill, S. L., Jarvis, K. S., & Thomas-Osip, J. E. 2006, Icarus, 180, 453, doi: 10.1016/j.icarus.2005.10.004
- Vilas et al. (2020) Vilas, F., Smith, B. A., McFadden, L. A., et al. 2020, Vilas Asteroid Spectra, v1.0, NASA Planetary Data System 4 Small Bodies Node, doi: 10.26033/btr8-vt33
- Vilenius et al. (2012) Vilenius, E., Kiss, C., Mommert, M., et al. 2012, Astronomy & Astrophysics, 541, A94, doi: 10.1051/0004-6361/201118743
- Virtanen et al. (2020) Virtanen, P., Gommers, R., Oliphant, T. E., et al. 2020, Nature Methods, 17, 261, doi: https://doi.org/10.1038/s41592-019-0686-2
- Wallner et al. (2015) Wallner, A., Bichler, M., Buczak, K., et al. 2015, Phys. Rev. Lett., 114, 041101, doi: 10.1103/PhysRevLett.114.041101
- Walsh et al. (2012) Walsh, K. J., Morbidelli, A., Raymond, S. N., O’Brien, D. P., & Mandell, A. M. 2012, Meteoritics and Planetary Science, 47, 1941, doi: 10.1111/j.1945-5100.2012.01418.x
- Wilson et al. (2015) Wilson, L., Bland, P. A., Buczkowski, D., Keil, K., & Krot, A. N. 2015, in Asteroids IV, 553–572, doi: 10.2458/azu_uapress_9780816532131-ch029
- Wong & Brown (2016) Wong, I., & Brown, M. E. 2016, The Astronomical Journal, 152, 90, doi: 10.3847/0004-6256/152/4/90
- Wong & Brown (2017) —. 2017, The Astronomical Journal, 153, 145, doi: 10.3847/1538-3881/aa60c3
- Yamamoto (1985) Yamamoto, T. 1985, A&A, 142, 31
- Zellner et al. (1985) Zellner, B., Tholen, D. J., & Tedesco, E. F. 1985, Icarus, 61, 355, doi: 10.1016/0019-1035(85)90133-2