Enabling agency: trade-offs between regional and integrated energy systems design flexibility
Abstract
Europe as a whole as well as individual countries have many distinct pathways to net carbon neutrality by 2050. We use novel near-optimal modelling techniques to illuminate trade-offs and interactions between national and continental energy transitions under uncertainty. Our results reveal extensive and robust flexibility at a regional level in renewable and hydrogen investments as well as in hydrogen and electricity exports. However, Europe’s energy interconnections lead to significant cross-border effects of national energy strategies. Wind and hydrogen investments can easily be shifted geographically within Europe, and Northern Europe’s capacity as energy exporter or importer can shape and be shaped by the remaining system. Solar in Southern Europe and Germany comes out as an enabler, and can unlock design flexibility for the rest of the system. Quantifying these regional trade-offs in energy system planning is crucial in order to facilitate meaningful policy discussion and enable a fair energy transition.
Introduction
The European energy system is gearing up for a massive transformation towards net carbon neutrality which will deeply change the production and flow of energy both at the domestic and international level. Having enshrined greenhouse gas neutrality by 2050 in the European Climate Law [1], the EU plans to achieve the transition through a mix of the European Green Deal [12] and national policy. Modelling studies have shown that there is flexibility in regional and national investment choices; however this then impacts the options for the rest of Europe [2, 36, 41, 32]. The regional dynamics of decision making are thus identified as important for policy planning [20, 10, 39].
Energy system optimisation models play an important role in investigating how to best reach European and national climate targets. Most such models, however, optimise total system cost alone, thus inaccurately assuming a common goal across the included countries [3]. While the spatial diversity of potential carbon-neutral system designs has been explored [23, 34, 32, 36], systematic studies delineating the design spaces of individual regions embedded in a larger system are missing. Given the immense challenge of decarbonising the European energy system by 2050, it is crucial to understand the interactions of continental and national investment strategies including imports, exports and mutual design flexibility — this prevents the design of systems that are operationally inadequate, overdimensioned and/or socially unjust.
To address this research gap, we use near-optimal methods with a sector-coupled energy system optimisation model to conduct a rigorous study of the effects of national policy on the future European energy system and vice versa. Using a diverse set of scenarios to ensure robustness to uncertainty, we obtain results for 7 key focus regions embedded in the European energy system. This enables a comparison of regional design flexibility, export potentials and minimum investment levels subject to various system-wide policy decisions.
Large varieties of system designs can be described by the near-optimal space of an energy system model [8, 26, 33, 16]. The near-optimal space consists of feasible model solutions that are marginally more expensive than the cost optimum. Studying such solutions is important for policy advice since societal or geopolitical considerations often take precedence over total system costs [29, 24, 22]. Recent advances involve systematically mapping out representations of near-optimal spaces [16, 33], facilitating better searches for robust or otherwise desirable solutions. Common among these geometric approaches is that they work with reduced near-optimal spaces, mapped down to a small number of dimensions, for instance total investment by technologies [26, 27].
Our innovation is to map out the near-optimal space in a set of dimensions representing investment in key technologies both inside and outside a given region. We concentrate on solar, onshore wind, offshore wind and hydrogen infrastructure, resulting in a total of 8 dimensions. Approximations of the resulting joint near-optimal design spaces [16] are then computed for each of the 7 focus regions separately. Furthermore, we ensure robustness of the results by intersecting near-optimal spaces [16] arising from scenarios combining different technology costs, land use restrictions and weather years. Our results primarily build upon the geometry of these intersections. The intersection technique has previously only been applied to weather years; our approach involving a variety of scenarios provides a novel blueprint for future studies of robust system design.
We find a strikingly large degree of design flexibility — on the continental, but even more so on the regional level. Investment in certain technologies and regions affects system design flexibility much more than others, with for example solar power in Germany being a system-wide enabler. Wind and hydrogen investment, meanwhile, can be geographically shifted relatively freely, revealing opportunities for individual regions to become renewable energy exporters or hydrogen powerhouses. This significantly expands the results pertaining to overall design flexibility within the renewable electricity sector in Europe found in previous studies [16, 27, 34], precisely mapping the considerable trade-offs between solar, onshore wind and offshore wind at a regional resolution.
Ample opportunities for regional energy supply and exports
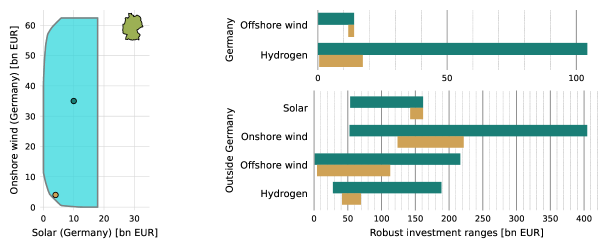
On the system-wide continental level and especially on the regional level, there is significant flexibility in investment in all explored technologies (solar, on- and offshore wind, hydrogen). Even taking into account uncertainties in costs, weather years and land use restrictions, we find a large space of robust solutions, i.e. designs that are feasible under all scenarios (Methods). Moreover, the connection to European energy markets provides individual regions significantly more planning flexibility (relatively speaking) than we see for the overall system. Allowing a small cost increase beyond the cost-minimal design (here, 5%) gives room for preferences and investment robustness that do not exist in the cost optimum.
We see that any robust European system design needs at least around 60 bn EUR investment in onshore wind and solar power each, amounting to 500 GW and 1250 GW of installed onshore wind and solar capacity, versus 188 GW [44] and 209 GW [25] in EU-27 in 2022, respectively. Remaining investment can be distributed in many different ways (Figure 1 (a)–(c)). Overall optimal system costs in our different focus models and scenarios (before near-optimal studies) have a range of – bn EUR (not including existing transmission, nuclear and hydropower infrastructure; Methods). Optimal distributions of investments beyond solar, wind and hydrogen are given in Supplemental Figure S1. All costs are annualised with a 7% discount rate and given in 2023 EUR.
We model for net zero \chCO2 emissions and limit \chCO2 sequestration to 200 Mt/a (following [28]) — this slashes natural gas use to 7% of 2021 levels [14, 9] and renders fossil oil obsolete in the model (Supplemental Information). Still, Europe overall can fully supply all energy demand from the residential, services, transportation and industry sectors using only local renewable generation, existing nuclear power and marginal use of abated natural gas.
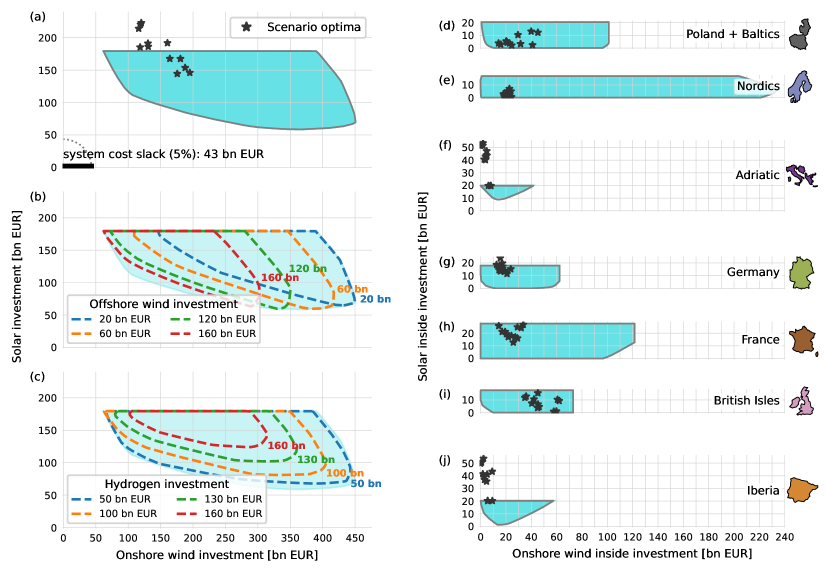
At a regional level, we observe significantly greater design flexibility (Figure 1 (d)–(j)). In most focus regions, we can entirely eliminate onshore wind or solar (Table 1). A number of regions need a certain minimum investment in wind power of any kind, but the balance between onshore and offshore wind can be adjusted relatively freely. Limited regional divestment is also possible, though for the purposes of this study we enforce a net self-sufficiency level of 75% for every country in the model (Methods). This self-sufficiency requirement does not drastically increase total system cost (Supplemental Figure S2).
![[Uncaptioned image]](/html/2312.11264/assets/x2.png)
Although hydrogen infrastructure (Methods) is crucial for decarbonisation and needs investment within Europe of at least 34 bn EUR in all robust designs, any individual region can forego hydrogen infrastructure entirely. On the other hand, we find that every studied region can become a hydrogen powerhouse, accumulating tens of billions of hydrogen infrastructure investment and reducing (but not eliminating) the need for hydrogen infrastructure in the rest of the system. Across robust system designs, we find total annual green hydrogen production in the range of about 2800–3900 TWh.
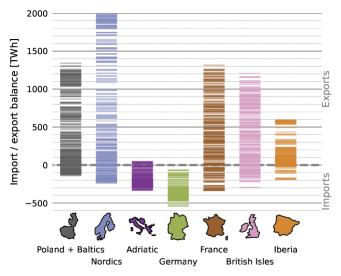
In a similar fashion, some regions may choose to export energy in significant quantities even as all other countries cover three quarters of their demand locally (Figure 2) — this depends on renewable energy availability. A striking example is provided by the Nordics, which have a vast potential for wind power exports based on annualised investment of over 230 bn EUR (1800 GW of onshore wind compared to currently installed 30 GW). In contrast, Germany with its high energy demand remains an energy net importer in any robust design, being limited by conservative assumptions on land area available for utility-scale solar PV. Note that some of the upper ranges of the exports in Figure 2 may require subsidies using up the slack level of about 45 bn EUR.
Some technologies and combinations are locally indispensable
There are some exceptions to the wide-ranging regional flexibility, due to the requirement to produce 75% of country-level energy demand locally. Solar energy in Southern Europe and wind power particularly in the British Isles and Germany are found to be indispensable (Table 1). The Nordics or France on the other hand, with significant capacities of existing hydropower and/or nuclear power, can meet 75% of their domestic demand with fewer additional renewables, and without any single essential technology.
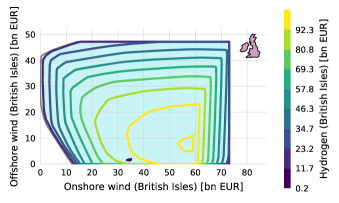
As a specific example, Figure 3 shows ranges of robust local investments in wind power in the British Isles. We see that neither offshore wind nor onshore power are strictly speaking necessary; either can be replaced by the other in sufficient volume. Low investment in hydrogen infrastructure allows vast ranges of investments in the different wind technologies (also depending on solar investments, not shown). A strong commitment to hydrogen in the UK, however, relies on higher investment in wind power (especially onshore) and reduces the design space. This shows that the UK could host a large hydrogen industry, but only in the presence of abundant renewable energy and relying on energy exports. Overall, robust designs need at least 20 bn EUR of annualised renewable investment in the UK and Ireland, and at least 12.3 bn EUR in wind power — a tripling of today’s capacity [44] (Table 1).
Regional policies can have an oversized effect on the rest of the European energy system
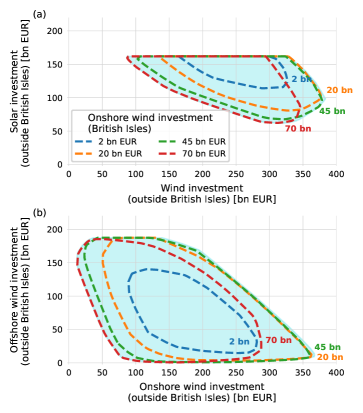
We observe cases where local investment decisions have large effects on the robust design space of the rest of the European system. On one hand, lack of beneficial investments in one region can lead to an inefficient overall system design, restricting the design space. On the other hand, high regional investment can out-compete similar investments elsewhere. A good example is provided by the interplay between onshore wind in the British Isles and renewable investment on continental Europe (Figure 4).
Policy decisions in some regions impact the rest of Europe not only in terms of competition; they also significantly restrict or enable design flexibility in the rest of the continent. Geometrically, we see that choices well within the robust design space leave the system more design flexibility [16] and do not force the system into narrowly bounded decisions. For example, Figure 5 shows how a boundary choice of minimal renewable generation in Germany leaves little room to manoeuvre among remaining robust solutions, whereas allocating an additional 35 bn EUR (4% of total system costs) to wind and solar in Germany frees up wide ranges of robust investment choices in the rest of Europe — despite the decrease of capital available to the rest of the system. The strengthened investment in renewables in a central region such as Germany affords so much robustness that it allows much greater diversity of options elsewhere.
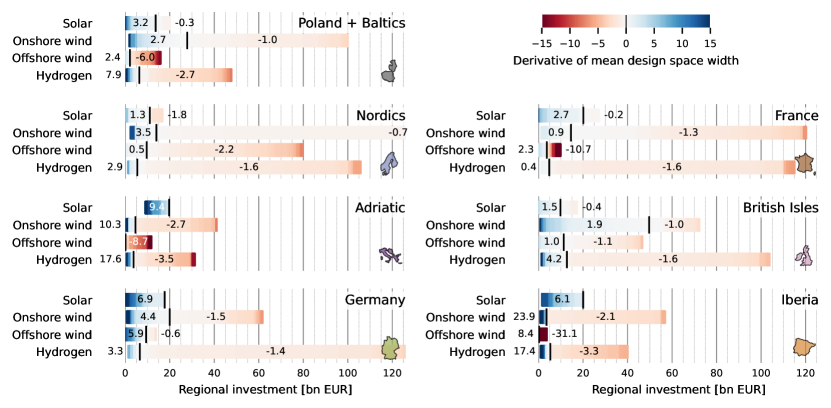
Exemplified by renewable investment in Germany, we quantify how some regional technology investments influence the flexibility of the remaining system more than others using the mean width of the European robust design space under various regional investment decisions. Changes in mean width indicate how much the design flexibility for the (remaining) European system grows or shrinks depending on a regional investment level. This way we can single out technologies in regions which influence the rest of Europe in a disproportionate manner — Figure 6 shows a quantification of these sensitivities in terms of the derivative of mean width. Generally we observe high sensitivity to solar investment in a number of regions where solar power plays a large role (the Iberian peninsula, the Adriatic region as well as Germany), indicated by a high positive derivative all the way up to investment levels of around 20 bn EUR, as opposed to low or negative impact beyond 10 bn EUR for northern regions. This shows that a consistent commitment to solar throughout southern Europe and Germany is needed in most robust system designs. The relative importance of solar investment is in large part due to the fact that all our robust system designs include a land use limitation for utility solar at 1% of available area (having to be feasible in all scenarios despite some scenarios allowing 3% in this study). This limitation does not leave much room for compensating lacking solar investment elsewhere (with most regions typically already close to the 1% limit) and thus raises the relative value of additional (regional) investment in solar PV.
Generally speaking, European energy policy is less sensitive to onshore wind investment in any particular region of interest, with only Germany and the British Isles presenting moderate impact. This lower sensitivity indicates that onshore wind investment is more easily shifted geographically and other regions can compensate higher or lower investment. Although spatially flexible, wind power in Europe is a key system component with 165 bn EUR minimum investment (at least 58 bn EUR for onshore wind) for any robust design.
European policy sets the limits for regional energy design space
Conversely, regional investment decisions are sometimes also strongly impacted by policies in the rest of Europe. This in itself is not surprising, as today’s transmission interconnection levels are already high (here we restrict transmission expansion to 25% on top of current levels, even if more could be cost-efficient [4, 37]) and additional energy transportation is enabled in the model through hydrogen and gas pipelines. We generally see two distinct effects: strong European investment limits most individual regions’ potential for becoming major energy exporters, whereas weak European investment can force some regions to compensate.
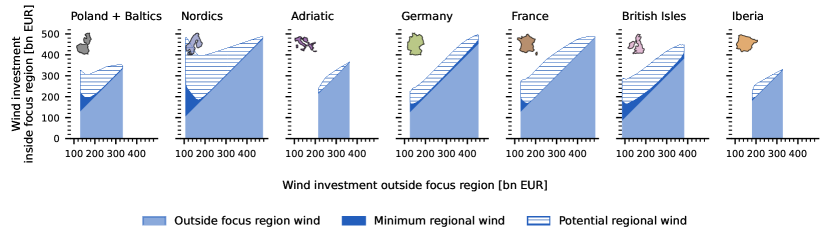
Figure 7 illustrates both effects. The massive potential for wind power development in both Poland and the Baltics as well as in the Nordics decreases steadily with rising wind investment in the rest of Europe. At the same time, each of these two regions is individually forced to compensate strongly if the respective rest of the system falters in wind power. This dynamic results from low domestic demand but plentiful wind resources making large-scale wind development generally export-dependent and thus sensitive to outside developments. The British Isles and especially Germany, however, have significant need for wind investment almost regardless of the wind development elsewhere; this is likely due to strong domestic energy demand. These regions stand apart as requiring the highest minimum investment in wind power across any robust system design (Table 1). The British Isles also have the potential to export wind power and this exposes local wind investment to some competition, but their investment is never completely out-competed by continental wind investment — possibly due to its high wind capacity factors and peripheral location.
Discussion & Conclusions
We demonstrate that within an integrated European energy system, single countries or regions have large flexibility in designing their contribution to joint decarbonisation policies. Trade-offs and broad ranges of options have been previously shown for the European electricity sector[27, 34], and play out even stronger for individual regions. Although certain minimal investments in specific renewable generation are required, we show that most single technologies can be substituted.
However, the design space of individual regions does not exist in a vacuum but is strongly coupled with the surrounding system. We consistently see that transmission expansion is cost-efficient and the coupling between regions is only expected to deepen due to benefits of increased transmission capacities [37, 4, 18, 42] as well as a hydrogen pipeline network [28]. The interaction between national and continental policies means that both sides can increase or decrease the extent of the design space of the other, respectively. For instance, higher investment in solar in Southern Europe and Germany expands the design flexibility of the rest of Europe. A strong commitment to wind power in Poland and the Baltic countries shrinks the ranges of possible wind investment elsewhere and generates import dependencies for the rest of the system. In general, investment in wind power and hydrogen infrastructure can be shifted geographically rather freely, but solar power less so.
Conversely, we show the extent to which energy policy in individual countries and regions, while flexible, is affected by the direction of the rest of the system. Any of the studied regions can be energy net importers (or exporters, except for Germany), but not all at the same time. Northern Europe has significant potential for wind-based exports, but this potential can be rendered largely unprofitable if the renewable investment is strong in the rest of Europe. The EU as well as individual countries have come forward with hydrogen strategies in recent years [11, 38, 5, 30], and our results show the need for a minimum annualised investment of 34 bn EUR in the European hydrogen sector by 2050; however, where these investments occur is very flexible. All in all, neither individual countries nor the EU can plan the transition to net-zero emissions without taking the tapestry of energy strategies across the European continent into account.
We find a vast space of robust designs achieving net-zero emissions as well as a high degree of energy self-sufficiency even under multiple challenging weather years, pessimistic technology cost assumptions and strict land use restrictions. While we attempt to strike a conservative balance in this study, the extent of this space does depend on the set of scenarios under which each design must be feasible. We choose scenarios reflecting a mix of meteorological, technological and societal uncertainty, but this set of scenarios is more of a starting point than a canonical selection. Weather years have already been identified as having a major impact on the energy system design space [16], and the present study reveals land use restrictions for utility solar power as another critical factor. Including scenarios with allowances of both 1% and 3% of available land, we see that this socio-political limitation cuts down the space of robust system designs in a drastic way. The impact of emissions targets, strengthened interconnections and demand response on the extent of design flexibility, to name a few, are not yet explored.
Although beyond the scope of this article, it is conceivable that early adopters [43] of key renewable technologies may benefit insofar as they can shape the design space and set the agenda of the rest of Europe and force later investments to be of a more reactive nature. Here, multi-horizon modelling and a study taking several regions into account simultaneously could be of great value to policymakers. Furthermore, computational limitations restrict us to mapping out the design space in only 8 key variables at a time. Finding ways to take more variables (regions, technologies) into account could prove fruitful.
The vast planning flexibility we demonstrate underlines the agency of single regions and countries in shaping energy policy: if onshore wind is socially unacceptable, for example, many regions can substitute it with other technologies. On a continent with different transition speeds [24] and levels of ambition [40], almost all countries have the possibility to benefit from building up new industries through electricity or hydrogen exports. However, certain trade-offs between regions are unavoidable and must be considered in light of social and political priorities that are difficult to quantify. To overcome opposition to climate mitigation and strengthen a fair energy transition, accounting for diverging interests in a panoply of pathways is possible and necessary.
Methods
Modelling framework
For this study, we use the open-source energy system model PyPSA-Eur-Sec 0.6.0 [4] (since merged into PyPSA-Eur) which represents the European energy system including the power, heating, industry, transport and agricultural sectors. It includes a detailed representation of the existing electricity transmission and gas networks, as well as generation sites and spatially resolved demand of different sectors. With the aim of a 100% emission reduction in the European power, heating, transportation and industrial sectors, the model finds investment and operational decisions for generation, transmission and storage in order to minimise total annualised system costs and meet projected 2050 energy demand.
Estimates of fixed and operational costs for 2050 are taken from https://github.com/PyPSA/technology-data, a repository collecting cost data and learning curves from various sources. All capital costs are annualised with a discount rate of 7%; this discount rate is chosen because it is the default in PyPSA-Eur, hence making the results more directly comparable across studies. While costs in the above repository are given in 2015 EUR, we have converted all cost data to 2023 EUR for the purposes of this study, using inflation data for the Euro area up to October 2023 [13], amounting to a 24.5% increase compared to technology-data.
The model is run with a partial greenfield approach, where existing transmission and gas networks (2019) as well as nuclear (except for Germany), biomass, and hydropower generation (2022) are included at today’s capacities. The above infrastructure was included because of its relatively long lifetime (including potential lifetime extensions), making existing capacities likely to approximately persist until 2050. The gas and transmission networks may additionally be reinforced beyond today’s capacities in the model; for transmission this is limited to 125% of current levels. Nuclear, biomass and hydropower generation, on the other hand, are entirely fixed (i.e. not subject to optimisation) and are not included in total system costs.
The main technologies whose expansion is optimised from scratch include solar, onshore wind and offshore wind generation, gas turbines, combined heat and power plants with and without CCS, boilers, battery-, hydrogen and heat storage, various power to X and other energy conversion technologies (electrolysis, steam methane reformation, methanation of hydrogen, ammonia and methonol production from hydrogen, synthetic fuel generation, biogas), direct air capture and carbon sequestration. The model includes all major potential components of a European energy system anno 2050, including the electricity, heating, transportation and industry sectors. See the accompanying code and data as well as PyPSA-Eur documentation and a recent study on the potential of a European hydrogen network [28] for more details.
We choose a spatial resolution of 60 nodes for 33 European countries, however, the exact allocation of nodes varies between the differently focused models (see below). In order to reduce the computational burden further, we use a non-uniform time step aggregation [35, 21] with 1500 time segments (which has shown to be more accurate than a comparable 6-hourly time resolution).
For all countries represented, we impose a 75% net self-sufficiency constraint for annual energy demand. It prevents the unnecessary exploration of technically robust system designs where individual regions are heavily dependent on imports — we consider such designs unlikely to be realised. At the same time, it can be seen as a measure to strengthen energy security and a more equal burden between different European countries in the joint decarbonisation efforts. The implementation of such a self-sufficiency constraint is a novelty in the context of sector-coupled energy system models for Europe; previously this was merely implemented for the electricity-only version of the model (PyPSA-Eur). The constraint is implemented bounding the ratio between total yearly local energy production and total yearly energy imports.
Regional studies
Our results are based on studying the joint space of robust system designs of the European energy system, reduced to total investment in four key technologies both inside and outside 7 selected focus regions. For the approximations of these 7 robust design spaces, we use the same model of the European energy system, except that we distribute the spatial nodes of the model differently in order to allocate more spatial resolution to each respective focus region. Moreover, we also allocate slightly more nodes to countries neighbouring each focus region. Our focus regions are
-
•
Poland and Baltics (EE, LT, LV, PL) with 20+25+15 nodes,
-
•
Nordics (DK, FI, NO, SE) with 20+25+15 nodes,
-
•
Adriatic (AL, BA, GR, HR, IT, MT) with 30+20+10 nodes,
-
•
Germany (DE) with 20+25+15 nodes,
-
•
France (FR) with 20+25+15 nodes,
-
•
British Isles (IE, UK) with 15+25+20 nodes,
-
•
Iberia (ES, PT) with 20+15+25 nodes,
with the corresponding number of nodes inside the region, for neighbouring countries and for remaining countries (further removed than distance 1), respectively. The increased spatial resolution inside the focus region allows us to capture renewable potential and effects like transmission bottlenecks in better detail. See Supplemental Figure S6 for a visual representation of the networks.
Scenario selection
For each focus region, we consider different scenarios across input uncertainties that we deem particularly impactful on energy modelling results. For each of these scenarios (and for each focus region), we approximate the corresponding near-optimal feasible space using the methods introduced by Grochowicz et al. [16]. For each focus region, then, we consider as robust design space the intersection of the near-optimal spaces arising from the scenarios under consideration (see below).
The factors we vary across scenarios and which we consider most impactful to modelling results include weather years [45, 16], cost assumptions[27], and land use[31] availability. Following Grochowicz et al. [16], we select three weather years that are considered difficult (1985, 1987, 2010) and thus are particularly restrictive (and also significantly more expensive than other weather years). We define three cost scenarios, one “baseline” scenario with standard cost assumptions, and two scenarios with higher capital expenditure costs for solar PV (39% more expensive) and wind power (24% more expensive) respectively; these ranges are taken from cost projections by the Danish Energy Agency [7]. Lastly, we restrict the available land area for utility solar PV in comparison to the standard assumptions in PyPSA-Eur-Sec to one third (from 3% to 1% of available land area after excluding unsuitable areas [19]). The restricted land availability scenario inhibits expansion of solar PV significantly: for instance, Germany’s installation potential is capped at approximately 440 GW while the German government is targeting installed capacities of 400 GW until 2040 [15]. All in all, this gives us scenarios, as we pair the three different weather years with the three cost scenarios and the restriction on land use for utility solar ().
Design spaces
The design space for each of the above scenarios and focus regions, consists of feasible, alternative solutions to a cost-optimal solution which can be preferable over the cost optimum for other reasons. Energy system optimisation models are usually formulated mathematically as linear programs of the form in which case the design space, more formally -near-optimal feasible space [8, 26, 16], is defined as where is the optimal objective (minimum cost) of the original linear program.
For the purposes of this study, we use a cost slack of . However, for each focus region we compute a uniform cost bound for all scenarios based on the optimum system cost for the most expensive scenario (roughly following [16]). More precisely, let be a region and a set of scenarios, such that we get a linear program with objective for each . Then we define the near -near-optimal space for scenario as
Defining near-optimal spaces for a set of scenarios as above allows for more direct comparisons, since all spaces are defined with respect to same absolute bound on total system costs.
In models of similar size to PyPSA-Eur-Sec (with significantly greater than ), the design spaces which can be analysed effectively are projections onto a few key dimensions from the high-dimensional space . This is because an accurate approximation of such a design space is computationally demanding (one vertex is obtained through one optimisation of the linear program) in high dimensions [33, 16]. Following previously introduced notation [16], we consider the reduced, low-dimensional design space ; related to the full-dimensional space by a linear map . In our case, we map down to key dimensions: the total investments inside and outside the focus region in utility solar, onshore wind, offshore wind, and hydrogen infrastructure. Hydrogen infrastructure investments consist of investment in electrolysis, fuel cells, pipelines (both new and retrofitted from existing gas pipelines), synthetic methane and fuel production from hydrogen (methanation, Fischer-Tropsch process respectively) and steam methane reforming plants (with or without carbon capture) as well as hydrogen storage.
An accurate approximation of the design space geometry can inform policymakers about trade-offs between regional and continental investment, alternative technologies, and how much flexibility can be gained through the introduction of a cost slack of . For a more detailed description of the approximation methodology and validation see [16]; in this case, we conduct 450 optimisations for a satisfying approximation of each design space. See Supplemental Figures S7–S8 for a visualisation of the individual near-optimal spaces as well as their intersection for one of the focus regions.
Robust solutions and design flexibility
To find solutions that are feasible (and near-optimal) notwithstanding the uncertainties encoded in our selection of scenarios, we look for investment decisions that lie in the feasible design space for each scenario. We formally define the space of robust solutions (or energy system design) as points in that lay within the intersection of the reduced design spaces for every scenario under consideration:
We refer to [16] for an extensive overview of the intersections of near-optimal feasible spaces with all due details.
By considering the geometry of the space of robust solutions (as in Figures 1, 3 and 4, for example), we are able to study trade-offs between investments in different technologies both inside a given focus region and in the rest of Europe. One should keep in mind that the formulation in terms of near-optimality adds a slack of 5% on top of the optimal total system costs which corresponds to an additional investment of around 45 bn EUR (depending on the focus region) which can be allocated in different ways in order to enlarge the alternative robust options. Note that monetary investments are robust across scenarios, however they might translate to different capacities in the scenarios with higher costs for solar PV or wind power.
To compute export potential, shown in Figure 2, we need a representative sample of full system designs (including operations) laying inside for each region . This is because the geometric shape of , which we compute as an intersection of near-optimal spaces, only contains information about total investment in solar, onshore wind, offshore wind and hydrogen (inside and outside ), but no total export figures. Thus, for each , we sample 300 points in , and run model optimisations where total solar, onshore wind, offshore wind and hydrogen investment are fixed to the coordinates of the 300 points. We can then calculate total imports / exports for each model and region; the results are shown in Figure 2. The 300 points are sampled randomly on the boundary of , except the first 24 which consist of those points which min- and maximise each individual of the 8 key dimensions (16 total) and those that min- and maximise the system-wide solar, onshore wind, offshore wind and hydrogen dimensions (8 total).
For Figure 6, we use mean width as a simple metric for measuring the size of a design space, and thus as a quantification of design flexibility. The notion of mean width we use for the purposes of Figure 6 is the mean of the widths of the space in the 4 outside investment dimensions. In other words, for a given inside investment level (say, a 10 bn EUR investment in onshore wind in the Nordics), we compute outside design flexibility as the mean of the differences between maximum and minimum outside investment in solar, onshore wind, offshore wind and hydrogen.
By varying technology investment levels inside a focus region we capture the increasing or decreasing mean width of the projection onto European investments outside the focus region. These increases and decreases of flexibility are shown as derivatives in Figure 6.
Code and data availability
The code to reproduce the results of the present study, as well as links to the data used, are available at https://github.com/koen-vg/enabling-agency/tree/v0. All code is open source (licensed under GPL v3.0 and MIT), and all data used are open (various licenses).
Acknowledgements
A.G., F.E.B. and M.Z. acknowledge funding by UiO:Energy and Environment (SPATUS).
The results contain modified Copernicus Climate Change Service information 2020. Neither the European Commission nor ECMWF is responsible for any use that may be made of the Copernicus information or data it contains.
Declaration of interests
The authors declare no competing interests.
References
- [1] Regulation (EU) 2021/1119 of the European Parliament and of the Council of 30 June 2021 establishing the framework for achieving climate neutrality and amending Regulations (EC) No 401/2009 and (EU) 2018/1999 (‘European Climate Law’), June 2021. URL: http://data.europa.eu/eli/reg/2021/1119/oj/eng.
- [2] Carl-Philipp Anke, Hannes Hobbie, Steffi Schreiber, and Dominik Möst. Coal phase-outs and carbon prices: Interactions between EU emission trading and national carbon mitigation policies. Energy Policy, 144:111647, September 2020. doi:10.1016/j.enpol.2020.111647.
- [3] Nico Bauer, Christoph Bertram, Anselm Schultes, David Klein, Gunnar Luderer, Elmar Kriegler, Alexander Popp, and Ottmar Edenhofer. Quantification of an efficiency–sovereignty trade-off in climate policy. Nature, 588(7837):261–266, December 2020. doi:10.1038/s41586-020-2982-5.
- [4] T. Brown, D. Schlachtberger, A. Kies, S. Schramm, and M. Greiner. Synergies of sector coupling and transmission reinforcement in a cost-optimised, highly renewable European energy system. Energy, 160:720–739, October 2018. doi:10.1016/j.energy.2018.06.222.
- [5] Bundesministerium für Wirtschaft und Klimaschutz. Fortschreibung der Nationalen Wasserstoffstrategie. Technical report, German Government, Berlin, 2023. URL: https://www.bmwk.de/Redaktion/DE/Wasserstoff/Downloads/Fortschreibung.pdf?__blob=publicationFile&v=4.
- [6] Copernicus Climate Change Service (C3S). ERA5 hourly data on single levels from 1940 to present, 2023. doi:10.24381/cds.adbb2d47.
- [7] Danish Energy Agency. Technology Data for Generation of Electricity and District Heating, 2016.
- [8] Joseph F. DeCarolis. Using modeling to generate alternatives (MGA) to expand our thinking on energy futures. Energy Economics, 33(2):145–152, March 2011. doi:10.1016/j.eneco.2010.05.002.
- [9] Department for Energy Security & Net Zero (UK). Natural gas supply and consumption, 2023. URL: https://assets.publishing.service.gov.uk/media/65130c71b23dad000de706d5/ET_4.1_SEP_23.xlsx.
- [10] Goran Durakovic, Pedro Crespo del Granado, and Asgeir Tomasgard. Powering Europe with North Sea offshore wind: The impact of hydrogen investments on grid infrastructure and power prices. Energy, 263:125654, January 2023. doi:10.1016/j.energy.2022.125654.
- [11] European Commission. Communication from the Commission to the European Parliament, the Council, the European Economic and Social Committee and the Committee of the Regions: A hydrogen strategy for a climate-neutral Europe. Communication COM/2020/301, European Commission, 2020. URL: https://eur-lex.europa.eu/legal-content/EN/TXT/?uri=CELEX:52020DC0301.
- [12] European Commission, Secretariat-General. Communication from the Commission to the European Parliament, the European Council, the Council, the European Economic and Social Committee and the Committee of the Regions: The European Green Deal. Communication COM/2019/640, European Commission, 2019. URL: https://eur-lex.europa.eu/legal-content/EN/TXT/?qid=1576150542719&uri=COM%3A2019%3A640%3AFIN.
- [13] Eurostat. Harmonised Indices of Consumer Prices (HICP) - all items, 2023. URL: https://ec.europa.eu/eurostat/databrowser/view/teicp000/default/table?lang=en.
- [14] Eurostat. Supply, transformation and consumption of gas, 2023. URL: https://ec.europa.eu/eurostat/databrowser/view/nrg_cb_gas/default/table?lang=en.
- [15] German Bundestag. Gesetz zu Sofortmaßnahmen für einen beschleunigten Ausbau der erneuerbaren Energien und weiteren Maßnahmen im Stromsektor, 2022. URL: https://dejure.org/BGBl/2022/BGBl._I_S._1237.
- [16] Aleksander Grochowicz, Koen van Greevenbroek, Fred Espen Benth, and Marianne Zeyringer. Intersecting near-optimal spaces: European power systems with more resilience to weather variability. Energy Economics, 118:106496, January 2023. doi:10.1016/j.eneco.2022.106496.
- [17] Hans Hersbach, Bill Bell, Paul Berrisford, Gionata Biavati, Andás Horányi, Joaquín Muñoz Sabater, Julien Nicolas, Carole Peubey, Raluca Radu, Iryna Rozum, Dinand Schepers, Adrian Simmons, Cornel Soci, Dick Dee, and Jean-Noël Thépaut. ERA5 hourly data on single levels from 1940 to present, 2018. doi:10.24381/cds.adbb2d47.
- [18] Jonas Hörsch and Tom Brown. The role of spatial scale in joint optimisations of generation and transmission for European highly renewable scenarios. In 2017 14th International Conference on the European Energy Market (EEM), pages 1–7, Dresden, Germany, June 2017. IEEE. doi:10.1109/EEM.2017.7982024.
- [19] Jonas Hörsch, Fabian Hofmann, David Schlachtberger, and Tom Brown. PyPSA-Eur: An open optimisation model of the European transmission system. Energy Strategy Reviews, 22:207–215, November 2018. doi:10.1016/j.esr.2018.08.012.
- [20] Mario Kendziorski, Leonard Göke, Christian von Hirschhausen, Claudia Kemfert, and Elmar Zozmann. Centralized and decentral approaches to succeed the 100% energiewende in Germany in the European context – A model-based analysis of generation, network, and storage investments. Energy Policy, 167:113039, August 2022. doi:10.1016/j.enpol.2022.113039.
- [21] Leander Kotzur, Peter Markewitz, Martin Robinius, and Detlef Stolten. Impact of different time series aggregation methods on optimal energy system design. Renewable Energy, 117:474–487, March 2018. doi:10.1016/j.renene.2017.10.017.
- [22] Michael Lau, Wilson Ricks, Neha Patankar, and Jesse D. Jenkins. Europe’s way out: Tools to rapidly eliminate imports of Russian natural gas. Joule, 6(10):2219–2224, October 2022. doi:10.1016/j.joule.2022.09.003.
- [23] Francesco Lombardi, Bryn Pickering, Emanuela Colombo, and Stefan Pfenninger. Policy Decision Support for Renewables Deployment through Spatially Explicit Practically Optimal Alternatives. Joule, 4(10):2185–2207, October 2020. doi:10.1016/j.joule.2020.08.002.
- [24] María de la Esperanza Mata Pérez, Daniel Scholten, and Karen Smith Stegen. The multi-speed energy transition in Europe: Opportunities and challenges for EU energy security. Energy Strategy Reviews, 26:100415, November 2019. doi:10.1016/j.esr.2019.100415.
- [25] Michael Schmela. European Market Outlook for Solar Power 2022-2026. Technical report, SolarPower Europe, 2022. URL: https://www.solarpowereurope.org/press-releases/new-report-reveals-eu-solar-power-soars-by-almost-50-in-2022.
- [26] Fabian Neumann and Tom Brown. The near-optimal feasible space of a renewable power system model. Electric Power Systems Research, 190:106690, January 2021. doi:10.1016/j.epsr.2020.106690.
- [27] Fabian Neumann and Tom Brown. Broad Ranges of Investment Configurations for Renewable Power Systems, Robust to Cost Uncertainty and Near-Optimality. iScience, 26(5):106702, April 2023. doi:10.1016/j.isci.2023.106702.
- [28] Fabian Neumann, Elisabeth Zeyen, Marta Victoria, and Tom Brown. The potential role of a hydrogen network in Europe. Joule, 7(8):1793–1817, August 2023. doi:10.1016/j.joule.2023.06.016.
- [29] Francesco Nicoli, David van der Duin, and Brian Burgoon. Which Energy Security Union? An experiment on public preferences for energy union alternatives in 5 western European countries. Energy Policy, 183:113734, December 2023. doi:10.1016/j.enpol.2023.113734.
- [30] Olje- og energidepartementet og Klima- og miljødepartementet. Regjeringens hydrogenstrategi - på vei mot lavutslippssamfunnet. Technical Report Y-0127 B, Norwegian Government, 2020.
- [31] Neha Patankar, Xiili Sarkela-Basset, Greg Schivley, Emily Leslie, and Jesse Jenkins. Land use trade-offs in decarbonization of electricity generation in the American West. Energy and Climate Change, 4:100107, December 2023. doi:10.1016/j.egycc.2023.100107.
- [32] Tim T. Pedersen, Mikael Skou Andersen, Marta Victoria, and Gorm B. Andresen. Using Modeling All Alternatives to explore 55% decarbonization scenarios of the European electricity sector. iScience, 26(5):106677, May 2023. doi:10.1016/j.isci.2023.106677.
- [33] Tim T. Pedersen, Marta Victoria, Morten G. Rasmussen, and Gorm B. Andresen. Modeling all alternative solutions for highly renewable energy systems. Energy, 234:121294, November 2021. doi:10.1016/j.energy.2021.121294.
- [34] Bryn Pickering, Francesco Lombardi, and Stefan Pfenninger. Diversity of options to eliminate fossil fuels and reach carbon neutrality across the entire European energy system. Joule, 6(6):1253–1276, June 2022. doi:10.1016/j.joule.2022.05.009.
- [35] Salvador Pineda and Juan M. Morales. Chronological Time-Period Clustering for Optimal Capacity Expansion Planning With Storage. IEEE Transactions on Power Systems, 33(6):7162–7170, November 2018. doi:10.1109/TPWRS.2018.2842093.
- [36] Jan-Philipp Sasse and Evelina Trutnevyte. Cost-effective options and regional interdependencies of reaching a low-carbon European electricity system in 2035. Energy, 282:128774, November 2023. doi:10.1016/j.energy.2023.128774.
- [37] David P. Schlachtberger, Tom Brown, Stefan Schramm, and Martin Greiner. The benefits of cooperation in a highly renewable European electricity network. Energy, 134:469–481, September 2017. doi:10.1016/j.energy.2017.06.004.
- [38] Secretary of State for Business, Energy & Industrial Strategy. UK Hydrogen Strategy. Technical report, UK Government, 2021.
- [39] Claudia Strambo, Måns Nilsson, and André Månsson. Coherent or inconsistent? Assessing energy security and climate policy interaction within the European Union. Energy Research & Social Science, 8:1–12, July 2015. doi:10.1016/j.erss.2015.04.004.
- [40] Andrea Tosatto, Xavier Martínez Beseler, Jacob Østergaard, Pierre Pinson, and Spyros Chatzivasileiadis. North Sea Energy Islands: Impact on national markets and grids. Energy Policy, 167:112907, August 2022. doi:10.1016/j.enpol.2022.112907.
- [41] Tim Tröndle, Johan Lilliestam, Stefano Marelli, and Stefan Pfenninger. Trade-Offs between Geographic Scale, Cost, and Infrastructure Requirements for Fully Renewable Electricity in Europe. Joule, 4(9):1929–1948, September 2020. doi:10.1016/j.joule.2020.07.018.
- [42] Tim Tröndle, Johan Lilliestam, Stefano Marelli, and Stefan Pfenninger. Trade-Offs between Geographic Scale, Cost, and Infrastructure Requirements for Fully Renewable Electricity in Europe. Joule, 4(9):1929–1948, September 2020. doi:10.1016/j.joule.2020.07.018.
- [43] Marta Victoria, Kun Zhu, Tom Brown, Gorm B. Andresen, and Martin Greiner. Early decarbonisation of the European energy system pays off. Nature Communications, 11(1):6223, December 2020. doi:10.1038/s41467-020-20015-4.
- [44] WindEurope. Wind Energy in Europe: 2022 Statistics and the outlook for 2023-2027, February 2023. URL: https://windeurope.org/intelligence-platform/product/wind-energy-in-europe-2022-statistics-and-the-outlook-for-2023-2027/.
- [45] Marianne Zeyringer, James Price, Birgit Fais, Pei-Hao Li, and Ed Sharp. Designing low-carbon power systems for Great Britain in 2050 that are robust to the spatiotemporal and inter-annual variability of weather. Nature Energy, 3(5):395–403, May 2018. doi:10.1038/s41560-018-0128-x.