Mechanism of stochastic resonance in viscoelastic channel flow
Abstract
Our experiment discloses mechanism of occurrence of stochastic resonance (SR) discovered in viscoelastic channel flow above non-modal elastic instability onset, , and characterized at various channel locations, , where is its height. Thus, is the control parameter besides Weissenberg number, . We find that SR appearance depends on at fixed , and it vanishes close to inlet, where streamwise velocity fluctuations, , are large and steeply reduce to smaller value persisting till outlet. At larger and smaller , flat spanwise velocity, , power spectrum, , is noticed at . Then interaction of chaotic with noisy power spectra and elastic waves causes SR, whereas chaotic prevents it. Similar mechanism is suggested for autonomous dynamical model, where chaotic power spectrum and limit cycle interacting with external noise generate SR. Further, SR frequency, , and elastic wave frequency, , show the same scaling with , indicating their close relation, though is shifted down 4-5 times relatively to .
Recently, we disclosed the route from laminar to sustained chaotic flow in inertia-less viscoelastic channel flow externally perturbed by finite-amplitude white noise [1]. In the limited range above the onset of supercritical, non-normal-mode elastic instability, , in a lower subrange of a transition flow regime, the laminar flow becomes chaotic only in the streamwise direction, , while in the spanwise direction, , the flow continues to exhibit flat white noise spectrum of the spanwise velocity, , and very low intensity peaks of elastic waves. Moreover, in the lower subrange, the time series of the streamwise velocity, , shows nearly periodic spikes on the top of the chaotic flow. These spikes are characterized by a narrow, low frequency, high energy peak on the top of the chaotic streamwise velocity power spectrum, . Here, is the main control parameter in inertia-less viscoelastic fluid flows that denotes the ratio of elastic stress to relaxation dissipation of elastic stress, where is the average flow velocity defined by fluid discharge rate (see the Supplemental Material [2] and also references [3, 4] therein), is the characteristic vessel size, and is the longest polymer relaxation time. For inertia-less, viscoelastic channel flow above , Reynolds number and , where and are the solution density and dynamic viscosity, respectively.
As discussed in Ref. [1], the almost periodic sharp spikes resemble stochastic resonance (SR), observed typically as the response of a bistable system to a periodic external force in the presence of noise [5]. However, as shown in chaotic nonlinear dynamical systems, SR may be generated via interaction of chaotic attractor with external white noise in the presence of a limit cycle, at fixed values of the controlled parameter [6, 7, 8]. Thus, SR, the periodic spikes, are predicted to appear in autonomous, nonlinear dynamical model as the result of solely internal dynamics, namely the interaction of chaotic attractor and a limit cycle of coherent motion with external white noise perturbations. For the best of our knowledge, such SR has been never observed experimentally (see for example [5]).
Recently we reported in Ref. [1] the discovery of such type of SR in polymer solution of inertia-less, straight channel flow. Indeed, in the lower subrange at of the transition flow regime, interaction of the one-dimensional (1D) chaotic attractor of with the 1D white noise power spectrum, , displaying also transverse, streamwise propagating elastic waves, results in the periodic spikes associated with SR. Further on, in the upper subrange at of the transition regime, SR disappears, and we observe the two-dimensional (2D) chaotic attractor of both and and elastic waves of up to two orders higher intensity [1]. Thus, the mechanism of a stochastic path from laminar to persistent chaotic flow is based on the low frequency and high energy SR discovered in the lower subrange above .
Thus, as mentioned above, in the lower subrange, remains flat that characterizes white noise. On the top of , broad and noisy peaks of low intensity elastic waves, , are also observed. Since is much lower than the SR peaks, , in , the takes over the role of elastic waves to drive the viscoelastic channel flow to the sustained chaotic flow that emerges in the upper subrange of the transition regime. Firstly, in the lower subrange, SR strongly modifies the Gaussian probability density function (PDF) of the normalized streamwise velocity fluctuations, , where , is the mean streamwise velocity averaged over narrow spanwise extent around the channel central line, and is the root mean square of velocity fluctuations. Further on, by pumping energy extracted from the main flow into random streaks and wall-normal vorticity fluctuations, SR initiates and amplifies them. On the other hand, in the upper subrange of the transition regime, becomes chaotic, and now presence of both and breaks the mechanism of SR generation. Moreover, high-energy elastic waves are now able to amplify the wall-normal vorticity fluctuations and to self-organize streaks into cycle synchronized at the elastic wave frequency, [9]. Therefore, SR is the key factor of the stochastic pathway to the sustained chaotic flow at the early stage of the flat, white noise just above . However, this finding is based only on the study of viscoelastic channel flow at the fixed spatial position, [1].
Here, we present experimental results obtained in the same inertia-less viscoelastic channel flow and with the same approach as in Ref. [1], where SR is discovered and characterized in the lower subrange of the transition regime, but at the multiple spatial locations along the channel length, where plays a role of the second controlled parameter besides .
The main goal of the experiment is to find out either the upper bound of the lower subrange for remains constant along the channel or depends on . If such a dependence exists, we are going to establish a role of the second control parameter, , to define the range of SR existence along the channel at given value of .
We conducted the experiment in a long channel of dimensions 500 (, : streamwise) 0.5 (, : wall-normal) 3.5 (, : spanwise) mm3 (see Fig.S1 in [2]), the same as used in Ref. [1]. The channel has two sources to initiate finite-size perturbations, namely a non-smoothed inlet and two holes of 0.5 mm diameter in the top plate close to the inlet and outlet, used for pressure measurements. A dilute aqueous solution of 64% sucrose concentration and 80 ppm of high molecular weight polyacrylamide (PAAm) is the same as used in Ref. [1]. The longest polymer relaxation time () is 13 s. The average velocity , used in both and , is obtained via the flow discharge rate, , as . In SM Methods, we present the details of the experimental setup, preparation and characterization of polymer solution, and Particle Image Velocimetry (PIV) technique to measure 2D velocity field in horizontal plane.
A possible reason for the dependence of the upper bound of the lower subrange on , where SR is detected, is the fact that and the normalized elastic wave energy, , where is the root mean square fluctuations, decrease with at all in the transition regime. This decline has been first observed in a channel with six small holes in a top plate, shown in Fig. 6 of Ref. [10], and for the current channel in Fig. S2 in [2]. Firstly, since both and persist up to the channel outlet, the non-normal elastic instability, caused by continuous perturbations at the inlet, is absolute (or global), as first pointed out in Ref. [10]. It means that a convective (or local) instability is absent, contrary to Newtonian open flows, where first convective instability followed by absolute one are explained theoretically Refs. [11, 12, 13] and observed experimentally, e.g. in Refs. [14, 15, 16, 17, 18]. Moreover, in a contrast to Newtonian open flows, the viscoelastic flow properties depend on above the absolute elastic instability onset, , (see Figs. S2(a)(b) in [2]). Furthermore, the dependence on is the same for the lower and upper subranges (see Figs. S2(a) in [2]), whereas for , the dependence differs in both subranges (see Fig. S2(b) in [2]). In addition, both and exhibit two distinct dependencies on in the same way. For in both subranges, close to the inlet a steep decline due to external perturbations from about down to at and a gentle decrease further away in intrinsic elastic instability region are observed. Whereas, for , transition locations from steep to gentle slope takes place for the lower subrange at and for the upper subrange at , and as the result, the decline steepness for differs for the lower and upper subranges (see Fig. S2 in [2]). As already suggested in Ref. [10], these discrepancies between the properties of Newtonian and viscoelastic open flows are caused by the different nature of the nonlinear terms: Only one advection term in velocity field in the former versus three nonlinear terms, including advection one, in the elastic stress field in the latter.
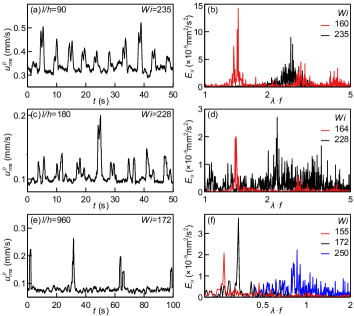
In Fig. 1 on the left column, we present three plots of temporal evolution of , the partially averaged over consecutive 1s (100 samples) streamwise velocity fluctuations, at three positions, : (a) 90 at ; (c) 180 at ; (e) 960 at . On the right column, one finds power spectra, , in lin-log presentation at the corresponding and various values in the lower subrange of the transition regime: (b) 90 at ; (d) 180 at (f) 960 at . In Fig. 1(a),(c),(e), the temporal evolution discloses almost periodic spikes of the partially smoothed data, whose in Fig. 1(b),(d),(f) reveal sharp, high energy peaks associated with SR.
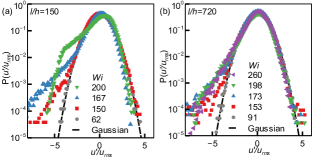
In Fig. 2, we show PDFs of at and several values in the lower subrange of the transition regime. As in Ref.[1], strong deviations from Gaussian PDF appear for negative values of for all values in the lower subrange. Remarkably, further downstream, deviations of the left tail from the Gaussian PDF become closer to exponential than another shifted Gaussian PDF, as observed at in Fig. 2 in Ref. [1]. The characterization of the deviation of PDF shape from Gaussian is quantified by its third and fourth moments, called skewness, , and flatness, , respectively, presented in Fig. 4(c) as function of values in the lower subrange in a wide range of . At , sufficiently far away from the inlet, both and exhibit a non-monotonic dependence on with a smoothed maximum at the middle of the lower subrange, therewith the absolute values of and decrease with increasing . Meanwhile, at , abruptly grows above and then drops significantly toward .
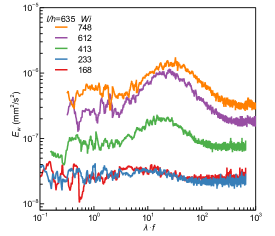
As discussed in the introduction and also presented in Ref. [1], SR is observed only in the lower subrange at , where remaining flat spectrum that denotes white noise versus in log-log coordinates exhibits a weak growth with . According to the suggested explanation of the SR existence, based on the internal dynamics of the autonomous, nonlinear dynamical model [6, 7, 8], the interaction of chaotic attractor with external white noise in the presence of limit cycle is the necessary condition for the SR appearance. To verify the dependence of on at multiple positions, , and various in the lower subrange of the transition regime are presented in log-log coordinates for and in Fig. 3 and additionally for and various values in Fig. S3 [2]. The results, presented in Fig. 3 and Fig. S3(c),(d),(e) [2] at from 90 up to 840, confirm the observation reported in Ref. [1] that SR is observed only for chaotic interacting with flat, white noise power spectrum incorporating elastic waves. However, close to the inlet at , remarkably disclose chaotic spectra for all values in the whole transition regime in Fig. S3(a) [2], whereas at , is close to flat only at in Fig. S3(b) [2]. Thus, the SR exists only in the lower subrange, where the flat, low intensity presents, as shown by the phase diagram in and coordinates (Fig. S4 [2]), the key finding first reported at in Ref. [1]. Moreover, remains flat and grows up to , close to the resolution limit.
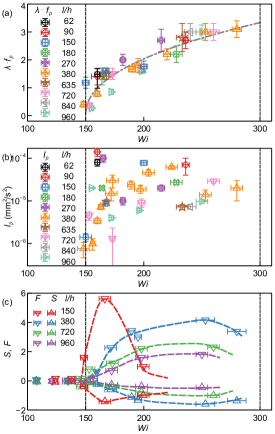
Furthermore, the SR energy peak, , and normalized SR frequency, , observed exclusively in the lower subrange of the transition regime at various values and ten locations, 62, 90, 150, 180, 270, 380, 635, 720, 840, 960, are shown in Fig. 4(a),(b) and also provided in Table S1 [2]. The SR normalized frequency, , grows with at all locations, and the fit of all data reveals scaling relation with , about the same as found at in Ref. [1]. The exhibits non-monotonic behavior with for all values that decreases towards , close to the upper bound of the lower subrange.
Further on, we are going to compare and with and , presented in Fig. S5(a)(b) [2] as functions of at eleven locations 22, 62, 90, 150, 180, 270, 380, 635, 720, 840, 960 in both subranges of the transition flow regime. In the lower subrange, remains flat, as discussed above, and slowly increases up to the upper bound at , marked by red dotted line for all positions, and displays two orders lower energy than (compare Fig. 4 and Fig. S5(b) [2]). Only for and , values are found above the upper bound at and , respectively, and persist to be larger than those at the rest locations, though they vary with about the same rate, as at other values. In Fig. S5(a) [2], we display the growth of with at all positions along the channel, though at , remains lower than the rest in both subranges. The power-law fit of the data solely in the lower subrange gives with (Fig. S5(a) [2]) that is close to the exponent obtained for . In the upper subrange, becomes chaotic with the power-law decay at high frequencies (see Fig. 3 and Fig. S3(a),(b),(c)[2]), and SR disappears. The latter is accompanied by a steep growth of , which reaches or even exceeds the values, displayed in the lower subrange.
Summarizing, we observe a strong dependence of the upper bound of the lower subrange of the SR appearance as a function of close to the inlet, where is up to 4 times larger at for and 235, and at for about twice larger than far away from the inlet. Such large at these values of causes chaotic and much larger values even for slightly larger . For such reasons, both the SR and lower subrange are absent at , and for the upper bound is located up to , lower than , the upper bound for larger values. It means that the existence range of SR depends on value, which determines whether is flat, noting white noise spectrum, or chaotic, when the mechanism of SR excitation is ceased to be effective. To verify the connection between the elastic waves and SR, we found that the exponents and in the scaling relations of and on at all have close values and , respectively, inside the error bars that evidences their direct relation. However, the range of is significantly shifted down for four-five times compared to the existence range of (Fig. 4(a) versus Fig. S5(a) [2]), that is contrary to the dynamical model with shifted up relatively to , and its value is determined by the noise strength [6, 8].
To conclude, SR peaks appear exclusively in the lower subrange of the transition flow regime just above . The first key factor of SR existence is the presence of flat , noting white noise spectra. If becomes chaotic, SR ceases to exist, since the mechanism of SR generation stops to be effective. The next crucial observation is uncovering the same scaling dependence of both frequencies, and , on that indicates their direct relation, where elastic waves is the second key factor for the mechanism SR generation to be active. Therewith, is shifted down 4-5 times relatively to . Thus the two key findings are the critical ingredients for comparison with the autonomous nonlinear dynamical model, where chaotic attractor interacts with external noise in the presence of limit cycle (oscillations) revealing SR. Of course, our experimental observations are obtained in much more complicated system than dynamical one. In the lower subrange above , SR takes a role of elastic waves, whose energy peak is by more than two orders lower than . Thus, SR initiates appearance of random streaks and wall-normal vortex fluctuations by transfer energy from the main flow to velocity fluctuations. When becomes chaotic at some value, also grows significantly to take over the role of the driving factor for development self-organized streaks cycles synchronized by elastic wave frequency, , and to amplify wall-normal vortex fluctuations via the mechanism described and verified by us earlier [9].
We thank Guy Han and Rostyslav Baron for their help with the experimental setup. This work was partially supported by the Israel Science Foundation (ISF, grant #784/19).
References
- Li and Steinberg [2023a] Y. Li and V. Steinberg, Stochastic resonance as a mechanism of non-modal elastic instability in channel flow, PNAS submission (2023a).
- [2] See Supplemental Material [url] for Methods details and supplymentary figures and table, which includes Refs. [3,4].
- Liu et al. [2009] Y. Liu, Y. Jun, and V. Steinberg, Concentration dependence of the longest relaxation times of dilute and semi-dilute polymer solutions, J. Rheol. 53, 1069 (2009).
- Liberzon et al. [2020] A. Liberzon, T. Käufer, A. Bauer, P. Vennemann, and E. Zimmer, Openpiv/openpiv-python: Openpiv-python v0.23.3., 10.5281/zenodo.4320056 (2020).
- Gammaitoni et al. [1998] L. Gammaitoni, P. Hänggi, P. Jung, and F. Marchesoni, Stochastic resonance, Rev. Mod. Phys. 70, 223 (1998).
- Hu et al. [1993] G. Hu, T. Ditzinger, C. Z. Ning, and H. H., Stochastic resonance without external periodic force, Phys. Rev. Lett. 71, 807 (1993).
- Anishchenko et al. [1993] V. S. Anishchenko, A. B. Neiman, and M. A. Safanova, Stochastic resonance in chaotic systems, J. Stat. Phys. 70, 183 (1993).
- Ditzinger et al. [1994] T. Ditzinger, C. Z. Ning, and G. Hu, Resonance-like responses of autonomous nonlinear systems to white noise, Phys. Rev. E 50, 3508 (1994).
- Li and Steinberg [2023b] Y. Li and V. Steinberg, Mechanism of vorticity amplification by elastic waves in a viscoelastic channel flow, Proc. Nat. Acad. Sci. U. S. A. 120, e2305595120 (2023b).
- Li and Steinberg [2023c] Y. Li and V. Steinberg, Universal properties of non-hermitian viscoelastic channel flows, Sci. Rep. 13, 1064 (2023c).
- Barkley [2016] D. Barkley, Theoretical perspective on the route to turbulence in a pipe, J. Fluid Mech. 803, P1 (2016).
- Huerre and Monkevitz [1990] P. Huerre and P. A. Monkevitz, Local and global instabilities in spatially developing flows, Annu. Rev. Fluid Mech. 22, 473 (1990).
- Chomaz [2005] J.-M. Chomaz, Instabilities in spatially developing flows: Non-normality and nonlinearity, Annu. Rev. Fluid Mech. 37, 357 (2005).
- Tsameret and Steinberg [1991a] A. Tsameret and V. Steinberg, Convective vs. absolute instability in couettetaylor flow with an axial flow, Euro. Phys. Lett. 14, 331 (1991a).
- Tsameret and Steinberg [1991b] A. Tsameret and V. Steinberg, Noise-modulated propagating pattern in a convectively unstable system, Phys. Rev. Lett. 67, 3392 (1991b).
- Babcock et al. [1991] K. Babcock, G. Ahlers, and D. Cannell, Noise-sustained structure in taylor-couette flow with throuh flow, Phys. Rev. Lett. 67, 3388 (1991).
- Babcock et al. [1992] K. Babcock, D. Cannell, and G. Ahlers, Stability and noise in taylor-couette flow with through-flow, Physica D 61, 40 (1992).
- Tsameret and Steinberg [1994] A. Tsameret and V. Steinberg, Absolute and convective instabilities and noise sustained structures in couette-taylor system with an axial flow, Phys. Rev. E 49, 1291 (1994).