Transverse momentum fluctuation in ultra-central Pb+Pb collision at the LHC
Abstract
The ATLAS collaboration has recently observed that the variance of the transverse momentum per particle (), when measured as a function of the collision multiplicity () in Pb+Pb collisions, decreases by a factor for the largest values of , corresponding to ultra-central collisions. We show that this phenomenon is naturally explained by invoking impact parameter () fluctuations, which contribute to the variance, and gradually disappear in ultra-central collisions. It implies that and are strongly correlated at fixed , which is explained by the local thermalization of the QGP medium.
1 Introduction
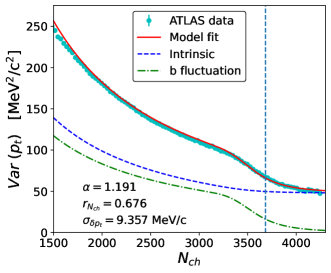
The left panel of Fig. 1 displays the variance of transverse momentum per particle () as a function of the collision multiplicity in Pb+Pb collisions at the LHC ATLAS:2022dov . (It is the dynamical contribution to the variance, after subtracting the trivial statistical fluctuation from the finite multiplicity.) It decreases over a narrow range of multiplicity around . This phenomenon is not explained by models such as HIJING, which predicts a smooth dependence of the variance for all ranges of Bhatta:2021qfk . We show that it is naturally explained if the medium produced during the collison thermalizes.
2 Hydro vs HIJING results
The impact parameter of the collision, , is not measured, and varies event by event. Fluctuations observed in a sample of collisions event originate from fluctuations of , and from fluctuations at fixed . In order to understand their respective roles, we run simulations of Pb+Pb collisions at 5.02 TeV at fixed , more specifically at .
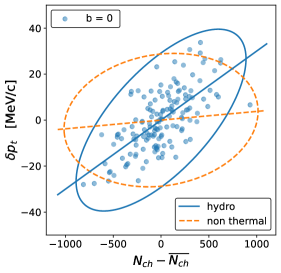
First, we simulate 150 events using relativistic viscous hydrodynamics Bozek:2021mov and compute and in each event. Fig. 1 displays the distribution of the two quantities from hydrodynamic simulation where thermalization of the QGP is assumed. It is clearly visible that both and have significant fluctuation. As the impact parameter is fixed, the origin of these fluctuations is purely quantum, due to genuine intrinsic fluctuation at the initial state of the collision.
Most importantly, there is a strong positive correlation between and , whose physical origin is clear: Larger means larger density , as the collision volume, which is mostly defined by the impact parameter of the collision, is fixed. A larger density results in a larger initial temperature if the system thermalizes. This in turn implies a higher energy per particle in the final state, and eventually a larger transverse momentum per particle , generating the positive correlation between and .
Second, we run simulations using the HIJING model Gyulassy:1994ew , which considers the collision as a superposition of independent nucleon-nucleon collision, and in which the particles have no interaction between each other after production. The striking difference in comparison to the hydro results is that the correlation between and is smaller by a factor 10. In HIJING, a larger density does not imply a significant increase of , which can be ascribed to the lack of thermalization.
3 Model fit
We model fluctuations of by assuming that the joint probability distribution of and at fixed is a two-dimensional correlated Gaussian Samanta:2023amp , denoted by . It is characterized by five parameters: mean and variance of and , denoted by , , Var(), Var() and the Pearson correlation coefficient between and , which we expect to be positive in hydrodynamics, as shown in Fig. 1 (right).
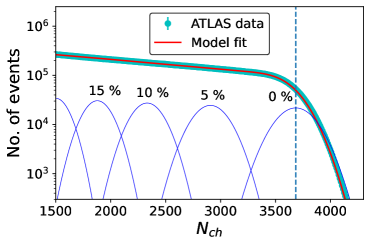
The mean and variance of are obtained by fitting the measured distribution of as a superposition of Gaussians, along the lines of Ref. Das:2017ned . The average value of at is the knee of the distribution, which is reconstructed precisely. Note that the fall of the variance in Fig. 1 precisely occurs around the knee.
The mean transverse momentum is essentially independent of for 30 % most central collisions ALICE:2018hza . We subtract this constant and only study the distribution of the distribution of = . We assume that the variance Var() varies with the mean according to a power law, Var() = , where and are constants Samanta:2023amp . For simplicity, we assume the correlation to be independent of .
The variance of at fixed is then evaluated in the following way. We first obtain the distribution of at fixed and using . It is again a Gaussian distribution, therefore, it is fully characterized by its mean and variance, which we denote by and . Both are functions of and . The crucial point is that the mean is proportional to the multiplicity fluctuation . It is proportional to the Pearson correlation coefficient between and (straight blue line in Fig. 1 right).
The last step is to average over . For this, one needs the probability distribution of at fixed , which is obtained using Bayes’ theorem along the lines of Ref. Das:2017ned . A simple calculation then shows that
| (1) | ||||
where angular brackets denote the average over for fixed . Two terms contribute to the variance: The first term originates from fluctuations of the impact parameter at fixed , and the second term is the true intrinsic (quantum) fluctuation, which is not the by-product of fluctuation.
The expression in Eq. (1) is finally fitted to ATLAS data using the three parameters : , and . Fig. 1 displays the model fit to the data (red lines) and the two separate contributions to Var(). Our model precisely explains the steep decrease of the variance around the knee. Below the knee, both contributions have comparable magnitudes, but above the knee, the first term, due to impact parameter fluctuations, gradually disappears, causing the steep fall in the variance data. This occurs because the effect of fluctuation becomes negligible in ultra-central region due to the strict lower limit of (), where the distribution of becomes a truncated Gaussian Das:2017ned ; Samanta:2023kfk .
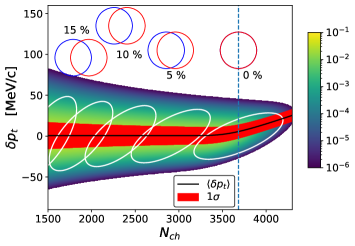
Fig. 2 displays the two-dimensional distribution of and returned by our fit. The white curves represent 99% confidence ellipses at fixed impact parameters and they are tilted with respect to the horizontal axis as in the hydrodynamic calculation in Fig. 1. The tilts denote the positive correlation between and , characterized by . From this plot, it can be seen that the width of distribution is partly because several ellipses contribute at a given (first term in Eq. 1) and the other part comes from the vertical width of a single ellipse (second term in Eq. 1). As a corollary, we also predict a slight increase of the mean transverse momentum with , denoted by the black line in Fig. 2.
4 Physical significance and thermodynamic interpretation
Our results imply that there is a strong correlation between and at fixed impact parameter, which is quantified by the Pearson correlation coefficient . As explained in Sec. 2, such a correlation is naturally present in a hydrodynamic description. Hence, the recent ATLAS data further support the common hypothesis that local thermalization is achieved in Pb+Pb collisions. It is the first such evidence which does not involve anisotropic flow.
Additionally, our analysis and methodology pave the way to separate the classical (geometrical) and quantum (intrinsic) fluctuation. Moreover, the slight increase of mean transverse momentum with multiplicity could be used to extract the speed of sound in QGP medium Gardim:2019brr , which has recently been measured by the CMS collaboration with great precision CMS-PAS-HIN-23-003 .
Acknowledgments
R. S. is supported by the Polish National Science Center under grant NAWA PRELUDIUM BIS: PPN/STA/2021/1/00040/U/00001 and PRELUDIUM BIS: 2019/35/O/ST2/00357. S.B and J.J are supported by DOE DE-SC0024602. M. L. thanks the São Paulo Research Foundation (FAPESP) for support under grants 2021/08465-9, 2018/24720-6, and 2017/05685-2, as well as the support of the Brazilian National Council for Scientific and Technological Development (CNPq).
References
- (1) G. Aad et al. (ATLAS), Phys. Rev. C 107, 054910 (2023), 2205.00039
- (2) S. Bhatta, C. Zhang, J. Jia, Phys. Rev. C 105, 024904 (2022), 2112.03397
- (3) P. Bozek, R. Samanta, Phys. Rev. C 105, 034904 (2022), 2109.07781
- (4) M. Gyulassy, X.N. Wang, Comput. Phys. Commun. 83, 307 (1994), nucl-th/9502021
- (5) R. Samanta, S. Bhatta, J. Jia, M. Luzum, J.Y. Ollitrault (2023), 2303.15323
- (6) S.J. Das, G. Giacalone, P.A. Monard, J.Y. Ollitrault, Phys. Rev. C 97, 014905 (2018), 1708.00081
- (7) S. Acharya et al. (ALICE), Phys. Lett. B 788, 166 (2019), 1805.04399
- (8) R. Samanta, J.a.P. Picchetti, M. Luzum, J.Y. Ollitrault, Phys. Rev. C 108, 024908 (2023), 2306.09294
- (9) F.G. Gardim, G. Giacalone, J.Y. Ollitrault, Phys. Lett. B 809, 135749 (2020), 1909.11609
- (10) Tech. rep., CMS preliminary, presented in Quark Matter (2023), https://cds.cern.ch/record/2870141