Capturing Dynamics in Online Public Discourse: A Case Study of Universal Basic Income Discussions on Reddit
Abstract
Societal change is often driven by shifts in public opinion. As citizens evolve in their norms, beliefs, and values, public policies change too. While traditional opinion polling and surveys can outline the broad strokes of whether public opinion on a particular topic is changing, they usually cannot capture the full multi-dimensional richness and diversity of opinion present in a large heterogeneous population. However, an increasing fraction of public discourse about public policy issues is now occurring on online platforms, which presents an opportunity to measure public opinion change at a qualitatively different scale of resolution and context.
In this paper, we present a conceptual model of observed opinion change on online platforms and apply it to study public discourse on Universal Basic Income (UBI) on Reddit throughout its history. UBI is a periodic, no-strings-attached cash payment given to every citizen of a population. We study UBI as it is a clearly-defined policy proposal that has recently experienced a surge of interest through trends like automation and events like the COVID-19 pandemic. We find that overall stance towards UBI on Reddit significantly declined until mid-2019, when this historical trend suddenly reversed and Reddit became substantially more supportive. Using our model, we find the most significant drivers of this overall stance change were shifts within different user cohorts, within communities that represented similar affluence levels, and within communities that represented similar partisan leanings. Our method identifies nuanced social drivers of opinion change in the large-scale public discourse that now regularly occurs online, and could be applied to a broad set of other important issues and policies.
1 Introduction
Societal change is often driven by shifts in public opinion. As people change their minds over time, and as generations change over, attitudes about social norms, justice, and fairness adapt. Public policies are updated to reflect these views, and society evolves. While traditional opinion polling and surveys can outline the broad strokes of whether public opinion on a particular topic is changing, they usually cannot capture the full multi-faceted richness and diversity of opinion present in a large heterogeneous population.
However, the digital era has ushered in a significant shift in how public discourse is conducted. With the advent of online platforms, a substantial portion of societal conversation, especially regarding public policy issues, has migrated to the digital realm. This transition presents a unique opportunity to observe and measure changes in public opinion with a level of detail and context that was previously unattainable.
Overall trends in public opinion can be driven by qualitatively different mechanisms, with important ramifications depending on which is responsible. For instance, there could be a change in what is being discussed (behavioural drift), who is discussing the subject (population drift), and where the discussion in taking place (system drift). Quantifying the mechanisms of macro-level opinion change is important because two contrasting explanations for the same effect might merit very different conclusions. For instance, consider a political issue that is typically supported by the left. Stance shift towards the negative on this issue could be driven by an influx of discussion in right-wing communities or a stance change within left-wing communities. While the high-level finding might be the same—stances on a political issue become more negative over time—the implications are quite different. The first explanation would highlight that public opinion did not really change between different partisan groups, while the second would highlight intrinsic shift in public opinion within a partisan group. Understanding the drivers of linguistic change is critical in ensuring that we are drawing the correct conclusions from our observations.
Previous studies have mostly looked at behavioural Park et al. (2020), population Diaz et al. (2016), and system drifts Horta Ribeiro et al. (2023) in isolation. Comparisons between these different measures and methodologies, however, can offer a more nuanced understanding of macro-shifts.
In this paper, we first present a theoretical model for how macro-level discourse properties can change, which allows us to quantify the impact of various mechanisms of interest. Next, we empirically showcase the insights we can get by applying this model on Reddit comments. We focus on an important property of discourse, stance, and a real world policy, and measure what drives changes in stance. As our public policy of interest, we elect to study Universal Basic Income (UBI)—an unconditional, periodic cash payment provided to every citizen—because it is a clearly-defined policy proposal that is becoming more relevant in mainstream political discourse through trends like automation and events like the COVID-19 pandemic. Then, we adopt a novel embedding-based approach of representing communities on Reddit to rigorously explore a few possible mechanisms that drive macro-shifts in sentiment. The topic-level analysis measures whether stance shifted due to a salience-shift in terms of what UBI sub-issues people care about, or a stance-shift within specific subtopics. The user-level analysis whether stance shifted due to a salience-shift in terms of who discussed UBI, or a stance-shift within specific user cohorts. The community-level analysis measures whether stance shifted due to a distribution-shift in the communities that discussed UBI (ex. left vs right-wing communities) or a stance-shift within certain communities. In particular, our key research questions are listed below:
-
RQ1
How did stance surrounding UBI change between 2014-2022?
-
RQ2
Was evolution in stance driven by a distribution shift in which subtopics are salient, or a shift in stances towards individual subtopics?
-
RQ3
Was evolution in stance driven by a distribution shift in the user cohorts that discussed UBI, or a shift in stances within different user cohorts?
-
RQ4
Was evolution in stance driven by a distribution shift in the communities that discussed UBI, or a shift in stances within different communities?
We find stances on UBI change within different topics of discussion, users cohorts, and different communities of discussion. In each of these cases, the stance shifts are more important than the proportions of different topics, cohorts, and communities that make-up the discussion. Although intrinsic stance shifts are the most important, proportions for the partisan dimension and proportions across user cohorts still play a statistically significant role in determining overall stance of UBI discussions over time. Finally, we find that the best explanation for overall stance change is cohort stance change over time.
2 Related Work
Our work draws on existing research studying linguistic properties over time. Computational techniques have enabled the creation of tools like a hedonometer to track Twitter’s daily happiness Dodds et al. (2011). In works related to political issues, researchers have found that political speeches on immigration have become more positive but increasingly polarized along partisan lines Card et al. (2022). Furthermore, observing changes in moral language in tweets on same-sex marriage can predict the success of public policy proposals Zhang and Counts (2015).
Previous literature has also explored potential drifts in big data sources. Behavioural drift in topics of discussion has been explored in various domains, from academic conferences Hall et al. (2008) to human rights issues Park et al. (2020). Population drift has been explored within the context of political polarization Waller and Anderson (2021) and US elections Diaz et al. (2016). System drift caused by community banning and deplatforming have caused behavioural shifts such as migration to other platforms Horta Ribeiro et al. (2023) and spillover into different communities Russo et al. (2023), the latter causing increased antisocial behaviour.
UBI is becoming increasingly prominent through trends such as increasing automation and events like the COVID-19 pandemic. Administrative simplicity Nettle et al. (2021), financial anxiety Delsen and Schilpzand (2019), and women’s labour Robeyns (2001) are themes that are discussed with UBI. Today, the policy is favoured by younger Gilberstadt (2021), left-wing Vlandas (2019), and less affluent Gilberstadt (2021) people.
In this paper, we illustrate how modern methods let us reconcile the content, population, and behavioural drifts in one methodology to explore public opinion changes surrounding an important policy issue.
3 Theoretical Model
We are interested in the temporal evolution of opinion changes on a platform. To formalize this, we consider a social media platform with a set of posts , and a target construct , (usually measured through a proxy, ). Each post has a corresponding metadata tuple that indicate the linguistic property, topic of discussion, metadata about the author, and the community in which the comment occurred, respectively. Note that each can be a vector including a series of subfactors.
A common approach for estimating the change in a property is by taking the mean of the ’s for a given month. This approach typically makes one implicit assumption that the remained static across the users quarter-to-quarter. In other words, the property change was driven by a shift in user beliefs, not a shift in composition of who is on the platform or where the discourse occurs. However, we argue that this is seldom the case. Just like in Anscombe’s quartet where four widely ranging distributions can lead to the same summary statistics, here three widely different mechanisms can be driving the same stance change. In turn, comparing ’s in two different time periods, may in fact be comparing them across two very different platforms.
We theorize three ways opinions on online platforms can change.
-
1.
Content drift. Each post on a platform is defined by its content. A macro-shift in stance can be explained either by changes in distribution for the topics of discussion, and/or a shift in the stances on the individual topics.
-
2.
Generational drift. The work of Waller and Anderson Waller and Anderson (2021) found that polarization on Reddit was not a result of polarization of individual users, but instead a product of fringe new cohort of radical users. Since users are often anonymous on these platforms, we distinguish user features by their cohort.
-
3.
Behavioral drift. Context forms both online and offline discussion. How users speak in one group may differ widely from another group. Overtly this can be the result of community banning or inception. More subtle shifts can take place with specific issues being politicized across one side.
3.1 Counterfactual Modelling
To measure the impact of the three meta-factors (described above) on driving changes in opinion, we design a simple counterfactual modeling setup. The setup relies on the interplay of proportion and stance.
Let , , and denote all the possible values that , , and can take on, respectively, across the entire platform . Let denote a subset of the metadata. Let be the proportion of comments in a specific quarter that include the meta-factors in and be the average stance for that group in quarter . The total stance on the platform for a given time is equal to
We then denote as the average proportion for comments with conditions in over all time, and similarly define . For any set , we can consider four different counterfactual scenarios. First, we may be interested the effect of both the proportion and the stance on . Second, we may be interested in the effect of only the proportion on . Third, we may be interested in the effect of only the stance on . Fourth, we may be interested in keeping both the proportion and the stance fixed across time, to control for the effect of the elements in on . Let be sets where each element in the set is a subset of . represents the metadata for which we are interested in both the proportion and the stance, represents the metadata for which we are interested in only the proportion, represents the metadata for which we are interested in only the stance, and represents the metadata for which we are interested in neither the proportion nor the stance. Note that , which represents the entire social media platform .
Now we consider the counterfactual world as
As an example, suppose we are interested in the how well the proportion of topics of discussion can predict the stance of the platform for a given time. In this setting, we have , and .
4 Empirical Setup
4.1 Data
Our dataset consists of all Reddit comments up to June 2022 containing the phrase “basic income” (case-insensitive) or “UBI” (case-sensitive). The first phrase is used in existing literature Gielens et al. (2022), and the second phrase is added due to its observed frequency of use. More permissive approaches for dataset creation (e.g., snowball sampling) led to greatly reduced precision; see A.3 for details.
The initial dataset (1,387,217 comments) was filtered down to 1,225,877 comments across 9,827 unique subreddits and 340,379 unique authors (filtering strategy described in the A.3). To validate the quality of our dataset, we selected a random sample of 500 comments and found that 1% of comments were unrelated to UBI. Since the number of UBI comments in a subreddit follows a long-tailed distribution, we also tried a stratified sampling approach to validate our dataset. We divided the subreddits into 10 groups by first ordering them by their number of UBI comments, and then taking the subreddits from the 0-10th percentile, 10-20th percentile, and so forth. Then, we randomly sampled 50 comments from each group; we found that 6% of comments were unrelated to UBI.
4.2 Methods
Motivated by the theoretical considerations in Section 3, we design three methods to augment the set of comments with further context on what is being discussed (content analysis), who is discussing it (user analysis), and where the discussions are taking place (community analysis).
4.2.1 Content Analysis
Stance Detection. We labelled each comment in our dataset with the commenter’s attitude towards UBI (supportive, neutral or against). Labelling was done through a two-step process. First, we prompted GPT-4 to label a comment with the commenter’s attitude towards UBI. The prompting strategy is described further in A.4. After labelling 10,000 comments in this way, we trained a smaller-scale RoBERTa-large model on these labels.
To assess the accuracy of the two steps, one of the co-authors manually labelled a random sample of 100 comments with their stance. Twenty of these labels were then further validated by two other co-authors. We discarded 5 comments that were not about UBI. Comparing the GPT-4 labels with the manual labels, we get an accuracy of 0.768 and a macro-F1 of 0.766. Comparing the model labels with the manual labels, we get an accuracy of 0.611 and a macro-F1 of 0.594. Note that for some comments, more than one stance was reasonable (usually supportive / neutral, or neutral / against) (see A.4 for an example for when this was the case).
Topic Creation. We first apply latent Dirichlet allocation (LDA) topic modelling Blei et al. (2003) to our dataset to computationally extract themes of discussion. The details of how we preprocessed the data and ran LDA are described in A.5. Using the topic model with 19 topics, we name each of the topics by examining the top 10 words and top 10 comments. We manually validate comments in these topics to ensure that the topics are coherent. We decide to discard 4 noisy topics, leaving us with a total of 15 (see Table 3).
Topic Extraction. Although LDA is a useful method to gain a rough picture of all the topics in a dataset, its bag-of-words nature risks losing the semantic relationships between the individual words in a comment. To account for this, we again use a two-step method to train an encoder-only classifier. First, we designed a prompting strategy for gpt-3.5-turbo to extract potentially multi-label topics from a comment. The prompt consisted of five choices: the four most probable topics determined by LDA, and “None of the above.”, and is closely described in A.5. After labelling 10,000 comments in this way, we finetuned a e5-base model Wang et al. (2022) on these labels.
To assess the accuracy of the two steps, one of the co-authors manually labelled a random sample of 100 comments with the LDA topics they pertain to. We labelled a comment with “None of the above” if the comment did not pertain to any subtopic or was not about UBI. Twenty of these labels were then further validated by one other co-author. Comparing the gpt-3.5-turbo labels with the manual labels, we get a macro-F1 of 0.412 and a micro-F1 of 0.455. Comparing the model labels with the manual labels, we get a macro-F1 of 0.398 and a micro-F1 of 0.450.
4.2.2 User Analysis
We classify all Reddit users by the year that they made their first comment on the platform and call each grouping of users a “cohort”. We then study how new cohorts of users affect overall stance on the platform through the framework described in Section 3 by first keeping the stances of each cohort constant across time, and then keeping the proportions of each cohort constant across time.
4.2.3 Community Analysis
To gain a behavioral understanding of where the UBI discourse on Reddit occurs, we use community embeddings, an established technique to study online social media through a behavioral lens Waller and Anderson (2019).
The embeddings permit simple vector algebra to create meaningful semantic dimensions like partisan-leaning, age, sociality, and affluence Waller and Anderson (2021). We project the Reddit communities onto the four social dimensions to get social-context for each of the communities.
We then categorize each community into five bins along each social dimension. For example, for the partisan dimension, we order all Reddit communities in the embeddings by their partisan score, then assign each community a partisan percentile score (0% means that the community is the most left-wing community; 100% means that the community is the most right-wing community. We then divide the communities into five equally-sized bins, defining left-wing, center-left, center, center-right, and right-wing communities as communities with percentile score from 0-20%, 20-40%, 40-60%, 60-80%, and 80-100%, respectively.
5 Results
In this section we present a macro- and micro- analysis of how stance changed surrounding UBI on Reddit, alongside what were the mechanisms driving that observed shift in stance.
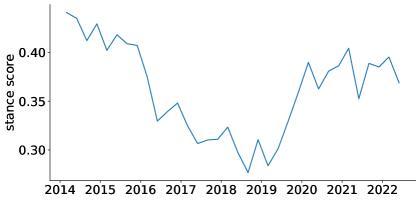
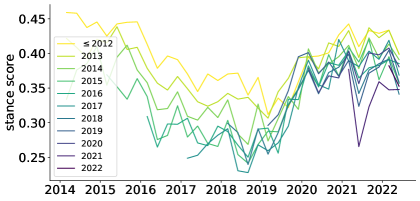
Macro-stance change. We begin by observing how stances on UBI have changed from 2014 to 2022 (Figure 1). Overall, comments that are supportive of UBI dominate comments that are against UBI. Furthermore, we find that stances on UBI became more negative from June 2016 to March 2019. This pattern aligns with the election of Donald Trump in 2016 and the rise of Andrew Yang in 2020. Nevertheless, this graph provides us with little context for why these shifts occurred.
Content-level. On a content-level, stance change be either driven by a shift in stances across various subtopics of UBI (which we refer to as the first counterfactual scenario), or a shift in distribution around which subtopics are being discussed (which we refer to as the second counterfactual scenario). An observed drop in stance may thus be either due to an actual shift in stance or a shift in what people discuss, moving to more negative topics.
We observe how distributions across and stances on UBI subtopics have changed from 2014 to 2022. The results are shown in Figure 2 and Figure 3.
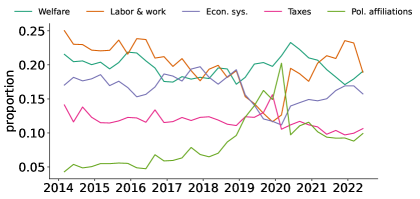
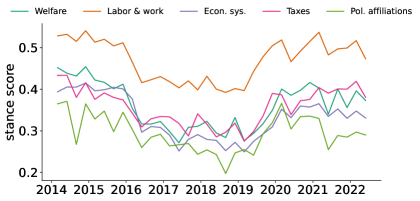
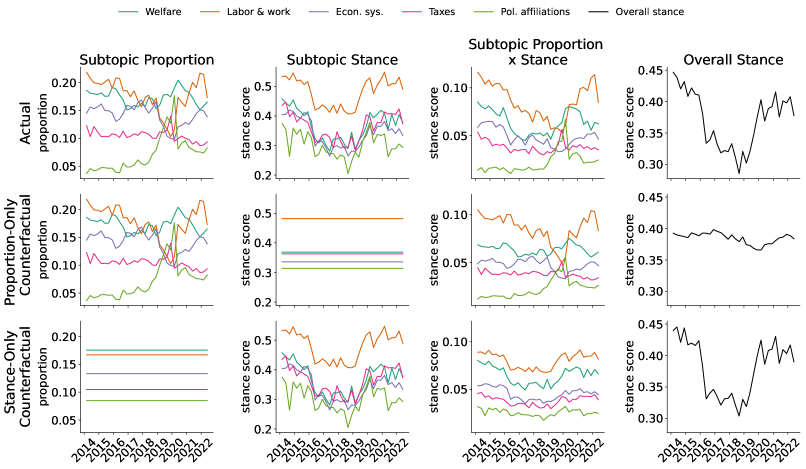
We see that subtopic stance appears to be more correlated with overall stance shifts in UBI than subtopic proportions. The two counterfactual scenarios for the top 5 subtopics are shown in Figure 4. To quantify this observation, we observe that the Pearson correlation coefficient between the first counterfactual and the true stance is only 0.126 () while the Pearson correlation coefficient between the second counterfactual and the true stance is 0.982 (). These calculations demonstrate that subtopic stance is more responsible for stance shifts in UBI than proportion of subtopics. In other words, stances are changing within most subtopics, rather than there being primarily negative and positive subtopics.
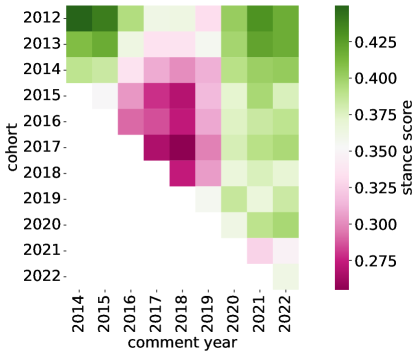
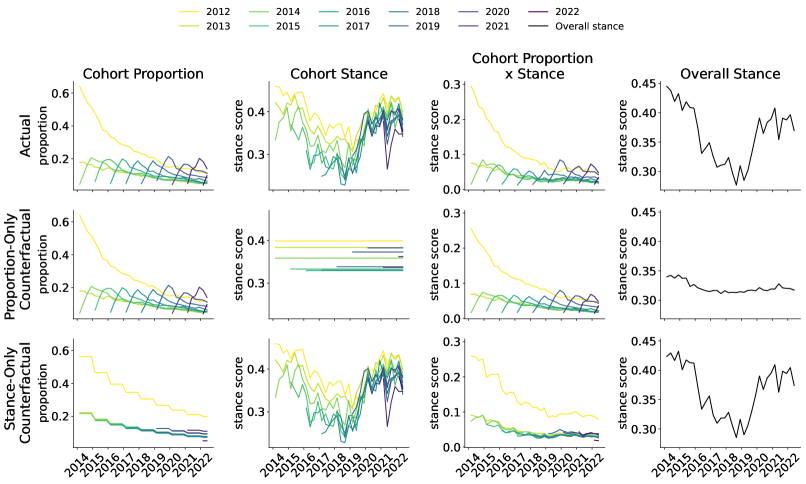
User-level analysis. In Figure 5, we observe how stances on UBI change over time for different cohorts.
We observe two effects. First, the individual cohorts change their stances over time, and in particular become negative from June 2016 to March 2019. Second, newer cohorts are more negative about UBI than older cohorts.
We again perform the counterfactual analyses on distribution vs. stance. An illustration of this calculation is in Figure 9. The Pearson correlation coefficient between the first counterfactual and the true stance is 0.791 (), while for the second it is 0.994 (). Thus, stance shift within each cohort is more responsible for stance shifts in UBI than proportion of comments made by each cohort.
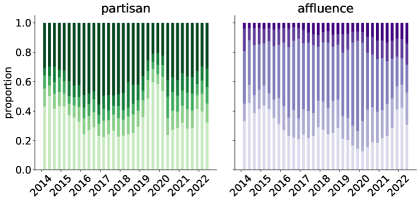
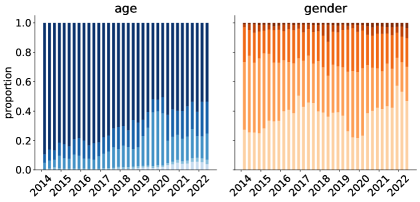
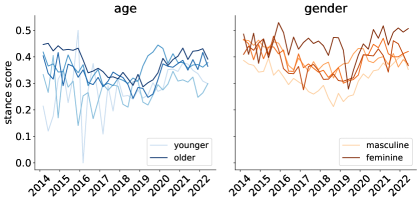
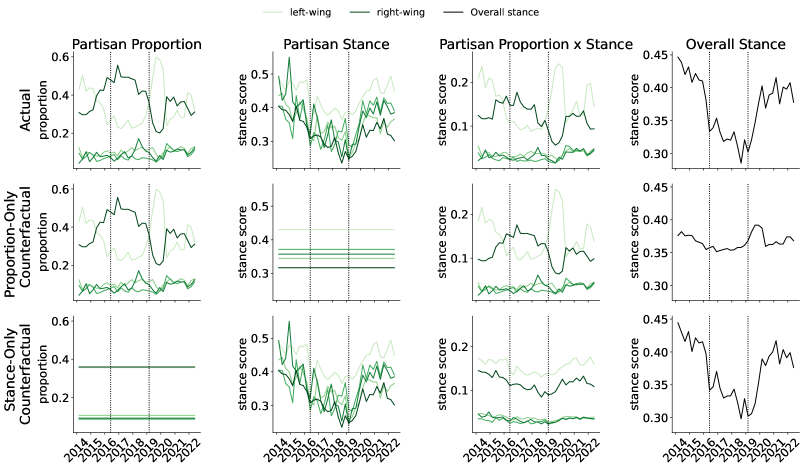
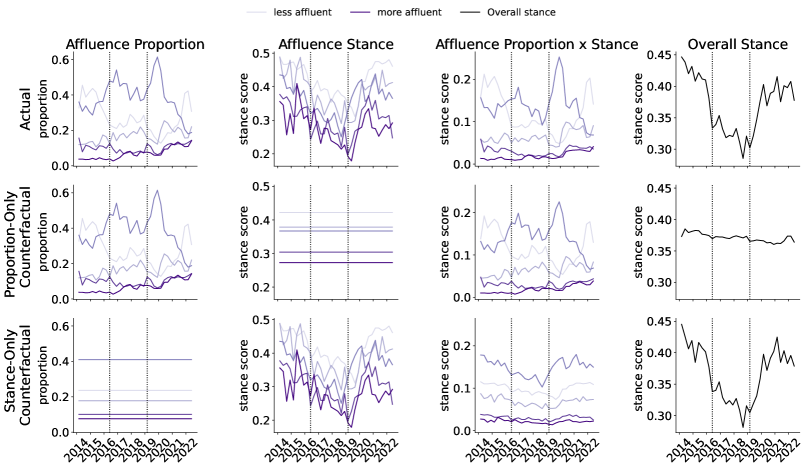
Community-level analysis. Using the bucketed scores for each Reddit community, we observe how the distribution of UBI comments changes over time. The results for the partisan and affluence dimensions are illustrated in Figure 7. We also observe how stances on UBI change over time in the different bins; the results for the partisan and affluence dimensions are illustrated in Figure 8. We also include the corresponding results for the age and gender dimensions in Figure 10 and Figure 11. An overwhelming majority of UBI comments occurred in older and masculine communities, leading to noise in the smaller bins in for the age and gender dimensions.
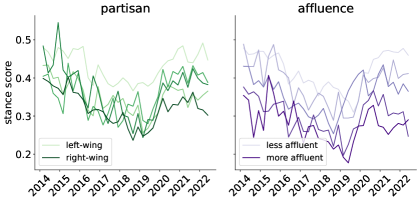
We again perform the counterfactual analyses on distribution vs. stance. An illustration of this calculation is in Figure 12 and Figure 13. For the partisan dimension, the Pearson correlation coefficient between the first counterfactual and the true stance is only 0.462 (), while for the second it is 0.971 (). For the affluence dimension, the Pearson correlation coefficient between the first counterfactual and the true stance is only 0.320 () while the Pearson correlation coefficient between the second counterfactual and the true stance is 0.984 (). These calculations demonstrate that for both the partisan and affluence dimensions, stance shift within each bin is more responsible for stance shifts in UBI than proportion of comments made in each bin. In other words, in determining overall stance on UBI, it matters less how much UBI discussion occurred left- v.s. right-wing and less v.s. more affluent; what matters more is the stance changes that occurred within left- v.s. right-wing and less v.s. more affluent communities.
Combining the analyses. In this section, we combine our analyses on the subtopics, cohorts, and communities to determine which of the three best explains overall stance change on UBI. We define the loss as sum of the absolute values of the difference between the true stance and the predicted stance under a counterfactual world from January 2014 to June 2022. We calculate this loss for each of the counterfactual worlds we explored in the previous sections. The results are illustrated in Table 1.
| Varying Property | Pearson | Loss |
|---|---|---|
| Subtopic Proportion | 0.126 | 1.315 |
| Subtopic Stance | 0.982 | 0.361 |
| Cohort Proportion | 0.791 | 1.640 |
| Cohort Stance | 0.993 | 0.172 |
| Partisan Proportion | 0.462 | 1.219 |
| Partisan Stance | 0.971 | 0.300 |
| Affluence Proportion | 0.320 | 1.292 |
| Affluence Stance | 0.984 | 0.227 |
Overall, we see that stance changes within subtopics and dimensions are better at describing overall stance change than proportion changes. This means that UBI is discussed both negatively and positively in across most subtopics, in both left- and right-wing and less and more affluent communities, and across different cohorts. The counterfactual world that best explains the overall stance change is the one in which we fix the proportions across the different cohorts, and let the stances vary.
6 Discussion
Content analysis approaches are achieving increasingly better performance. LLMs offer new potentials with both annotating data Gilardi et al. (2023) and generating synthetic data Veselovsky et al. (2023). Nevertheless, these approaches provide limited utility in making meaningful conclusions about temporal shifts. A surge in negative sentiments on a platform, for instance, might stem from various factors–such as an influx of pessimistic users, the gravitation towards more negative communities, or a transformation in the discussion framing itself.
Without a granular understanding of the forces that drive these changes, our ability to derive actionable insights is strained. To bridge this gap, our work presents a conceptual framework for studying the minor variations that drive the broader opinion shifts. Through counterfactual modelling and tracking the evolution in what is discussed, where discussions take place, and who is driving the discussions, we offer a lens that we can unravel the mechanisms underlying opinion shift.
We illustrate our framework by applying it to stance change towards UBI on Reddit using a combination of embedding techniques, cohort-level analysis, and a finetuned topic classifier. We find that macro stance shifts are in fact driven by micro variations in stance — change within different topics of discussion, different user cohorts, and different communities of discussion. In each of these cases, how the stance changed is more important than shifts in the proportion of discussion. Even though stance is more important, proportions for the partisan dimension and across user cohorts still play a statistically significant role in determining the overall stance of UBI discussions over time. The best counterfactual explanation for overall stance change is cohort stance change over time.
References
- Aslett et al. (2022) Kevin Aslett, Nora Webb Williams, Andreu Casas, Wesley Zuidema, and John Wilkerson. 2022. What was the problem in parkland? using social media to measure the effectiveness of issue frames. Policy Studies Journal, 50(1):266–289.
- Blei et al. (2003) David M Blei, Andrew Y Ng, and Michael I Jordan. 2003. Latent dirichlet allocation. Journal of machine Learning research, 3(Jan):993–1022.
- Card et al. (2022) Dallas Card, Serina Chang, Chris Becker, Julia Mendelsohn, Rob Voigt, Leah Boustan, Ran Abramitzky, and Dan Jurafsky. 2022. Computational analysis of 140 years of us political speeches reveals more positive but increasingly polarized framing of immigration. PNAS, 119(31):e2120510119.
- Delsen and Schilpzand (2019) Lei Delsen and Rutger Schilpzand. 2019. Individual Preferences for the Unconditional Basic Income in the European Union, pages 29–60. Springer International Publishing, Cham.
- Diaz et al. (2016) Fernando Diaz, Michael Gamon, Jake M. Hofman, Emre Kıcıman, and David Rothschild. 2016. Online and social media data as an imperfect continuous panel survey. PLOS ONE, 11(1):1–21.
- Dodds et al. (2011) Peter Sheridan Dodds, Kameron Decker Harris, Isabel M. Kloumann, Catherine A. Bliss, and Christopher M. Danforth. 2011. Temporal patterns of happiness and information in a global social network: Hedonometrics and twitter. PLOS ONE, 6(12):1–1.
- Gielens et al. (2022) Erwin Gielens, Femke Roosma, and Peter Achterberg. 2022. More than a free lunch: A content analysis of the controversies surrounding universal basic income on dutch twitter. Social Policy and Society, pages 1–21.
- Gilardi et al. (2023) Fabrizio Gilardi, Meysam Alizadeh, and Maël Kubli. 2023. Chatgpt outperforms crowd workers for text-annotation tasks. Proceedings of the National Academy of Sciences of the United States of America, 120.
- Gilberstadt (2021) Hannah Gilberstadt. 2021. More americans oppose than favor the government providing a universal basic income for all adult citizens.
- Hall et al. (2008) David Hall, Daniel Jurafsky, and Christopher D. Manning. 2008. Studying the history of ideas using topic models. In Proceedings of the 2008 Conference on Empirical Methods in Natural Language Processing, pages 363–371, Honolulu, Hawaii. Association for Computational Linguistics.
- Horta Ribeiro et al. (2023) Manoel Horta Ribeiro, Homa Hosseinmardi, Robert West, and Duncan J Watts. 2023. Deplatforming did not decrease Parler users’ activity on fringe social media. PNAS Nexus, 2(3):pgad035.
- Nettle et al. (2021) Daniel Nettle, Elliott Johnson, Matthew Johnson, and Rebecca Saxe. 2021. Why has the covid-19 pandemic increased support for universal basic income? Humanities and Social Sciences Communications, 8(1):79.
- Park et al. (2020) Baekkwan Park, Kevin Greene, and Michael Colaresi. 2020. Human rights are (increasingly) plural: Learning the changing taxonomy of human rights from large-scale text reveals information effects. American Political Science Review, 114(3):888–910.
- Robeyns (2001) Ingrid Robeyns. 2001. Will a basic income do justice to women? Analyse &; Kritik, 23(1):88–105.
- Röder et al. (2015) Michael Röder, Andreas Both, and Alexander Hinneburg. 2015. Exploring the space of topic coherence measures. In WSDM, page 399–408, New York, NY, USA. Association for Computing Machinery.
- Russo et al. (2023) Giuseppe Russo, Luca Verginer, Manoel Horta Ribeiro, and Giona Casiraghi. 2023. Spillover of antisocial behavior from fringe platforms: The unintended consequences of community banning. Proceedings of the International AAAI Conference on Web and Social Media, 17:742–753.
- Su et al. (2019) Lijuan Su, Svetlana Stepchenkova, and Andrei P. Kirilenko. 2019. Online public response to a service failure incident: Implications for crisis communications. Tourism Management, 73:1–12.
- Veselovsky et al. (2023) Veniamin Veselovsky, Manoel Horta Ribeiro, Akhil Arora, Martin Josifoski, Ashton Anderson, and Robert West. 2023. Generating faithful synthetic data with large language models: A case study in computational social science. arXiv preprint arXiv:2305.15041.
- Vlandas (2019) Tim Vlandas. 2019. The politics of the basic income guarantee: Analysing individual support in europe. Basic Income Studies, 14(1).
- Waller and Anderson (2019) Isaac Waller and Ashton Anderson. 2019. Generalists and specialists: Using community embeddings to quantify activity diversity in online platforms. WWW.
- Waller and Anderson (2021) Isaac Waller and Ashton Anderson. 2021. Quantifying social organization and political polarization in online platforms. Nature, 600(7888):264–268.
- Wang et al. (2022) Liang Wang, Nan Yang, Xiaolong Huang, Binxing Jiao, Linjun Yang, Daxin Jiang, Rangan Majumder, and Furu Wei. 2022. Text embeddings by weakly-supervised contrastive pre-training. arXiv preprint arXiv:2212.03533.
- Zhang and Counts (2015) Amy X Zhang and Scott Counts. 2015. Modeling ideology and predicting policy change with social media: Case of same-sex marriage. In CHI, pages 2603–2612.
Appendix A Appendix
A.1 Additional User-Level Analyses
A.2 Additional Community-Level Analyses
| Varying Property | Pearson | Loss |
|---|---|---|
| Age Proportion | -0.111 | 1.351 |
| Age Stance | 0.981 | 0.271 |
| Gender Proportion | 0.312 | 1.286 |
| Gender Stance | 0.988 | 0.198 |
A.3 Data Pre-processing
Exploration of more permissive approaches. First, we considered taking all the discussion trees of a submission or comment with the keyword; however, upon analyzing sample submissions, such as “Pope Calls for Universal Basic Income, Shorter Working Day,” we found that discussions deviated from the topic of UBI quite quickly; for instance, there were children of top-level comments that were solely about bishops’ retirement. Second, we considered a “snowball sampling” approach, similar to the one used by Su et al. Su et al. (2019). We found the top 100 words that had the highest tf-idf scores within the dataset collected using the previously-mentioned keywords, but found that the words (ex. “people,” “income,” “work”) were too general.
We also chose to focus on comments rather than submissions since comments usually contain more textual content and are more likely to occur in a wide-range of contexts, whereas submissions tend to center around a few communities and often link to external websites (such as news articles). These observations indicated that it was more likely for comments to contain organic discussions surrounding UBI, which was what we were most interested in capturing.
Additional filtering. To avoid comments that use “UBI” in the middle of a word, we filter for comments that contain “UBI” preceded and followed by a non-alphanumeric character, “UBI” at the beginning of a comment followed by a non-alphanumeric character, or “UBI” at the end of a comment preceded by a non-alphanumeric character. We also remove any comments containing the phrase “Ubisoft” (case insensitive). Reddit is comprised of many different communities, called “subreddits,” each dedicated to discussing a specific topic; each comment on Reddit is associated with exactly one subreddit. Upon looking at the top 100 subreddits with the most UBI comments, which account for 71.5% of all the UBI comments in the original dataset, a couple of subreddits seem irrelevant to UBI, such as r/Rainbow6, a subreddit dedicated to a video game. Many of these gaming subreddits use the phrase “UBI” to refer to Ubisoft. We identify six subreddits (r/Rainbow6, r/forhonor, r/thedivision, r/GhostRecon, r/Thread_crawler, r/assassinscreed) from the top 100 subreddits that were unlikely to use “UBI” to refer to universal basic income. To reduce irrelevant comments, we filter out any comments containing just “UBI” and not “basic income” from these communities since the phrase “basic income” is more specific. We remove comments from the bots u/AutoModerator, u/assessment_bot, u/subredditsummarybot, u/transcribot, u/SnapshillBot, u/sneakpeekbot, u/twitterInfo_bot, and u/autowikibot. Finally, we take comments from January 2014 onward since there was very little UBI discussion before this date.
A.4 Stance Detection
GPT-4 prompting strategy. We used the following prompt to label each comment. The prompt takes the text of the comment we want to label, and the text of the parent comment or submission.
Stance categories. A commenter’s attitude towards UBI can either be supportive (indicating that they support the implementation of the policy), against (indicating that they are against the implementation of UBI), or neutral, if the comment is a statement of fact, or a question, or if the commenter does not explicitly provide their own personal opinion on UBI.
Some comments could be interpreted as both supportive / neutral or neutral / against. An example is the following comment:
This comment was labelled by three different people. Two people labelled the comment as neutral and one person labelled it as supportive. Despite this ambiguity in some comments, when testing our classifier, we labelled each comment with only one stance.
A.5 Topic Modelling Details
Preprocessing steps. We first perform a sequence of preprocessing steps. First, we use the Python langdetect library to detect the language of the dataset using the first 15 words of each comment. We found 16,275 non-English comments. Since most of the comments in our dataset are in English, we translate all of the non-English comments so that the topic model does not group all the non-English comments into one topic. Second, we convert all text into lowercase and remove all URLs. Third, we remove the phrases “universal basic income”, “unconditional basic income”, “basic income”, and “ubi” from the comments, since we are interested in what subtopics lie within UBI discussion and do not want UBI to be a subtopic itself. We also remove all other stopwords in the nltk library, non-alphanumeric characters, and words shorter than 3 letters or longer than 15 letters. Sixth, we lemmatize the text. From the lemmatized text, we again filter out words shorter than 3 characters. Seventh, we compute all bigrams in the text using the gensim library, taking min_count 150 and threshold 25. Eighth, we filter out words used in fewer than 150 documents and words used in more than 50% of the documents.
Model parameters. We use the gensim library for LDA. We keep most of the default parameters provided by gensim for the model, and set passes to 5 and the hyperparameters alpha to ‘auto’ and eta to ‘auto’ to learn these values from the data.
To find the ideal number of topics, we experiment with various numbers of topics and determine the “goodness” of a certain number of topics using the topic coherence measure . The possible values of range from 0 to 1, with 1 denoting perfect coherence and 0 representing complete incoherence. We choose over other topic coherence measures since it correlates most with human judgements on the coherence of topics Röder et al. (2015).
To determine roughly the ideal number of topics, we first create LDA models with 5 to 95 topics, at increments of 10 topics. The topic coherence is highest at 15 topics and declines overall for higher values. To converge on an exact number of topics, we create LDA models with 5 to 25 topics. We find that setting the number of topics to 19 produces the model with the highest coherence ().
We manually validate the quality of the topics produced as follows. First, we name the topics based on the top 10 keywords. Second, borrowing from the manual validation methodology used by Aslett et al. Aslett et al. (2022), we choose a “threshold” probability of . Aslett et al. Aslett et al. (2022) use the probability threshold of in their work; we choose a higher value since we have less topics (19 v.s. 32). For each topic, we randomly sample 50 comments from the comments that pass this threshold probability for the topic, and determine whether they belong to the particular topic. For most topics, we found that at least 85% of the comments belong to the topic. In some cases, we find that some topic names can be broadened (within reason). For instance, we originally named a topic as “Wages” based on the top 10 keywords, but found that some comments from our random sample also mention a reduction in working hours. So, we rename the topic “Conditions for Work.” In other cases, we find that some topics cannot be broadened. For instance, we originally named a topic as “Common Words,” but found that the comments included discussions on automation, welfare, and human nature, which indicate that the topic is too broad to be coherent. So, we discarded this topic. We also discarded topics that were too narrow, such as topics containing a significant number of comments made by bots. All together, we discarded 4 topics, leaving us with a final topic model with 15 topics, which we highlight in Table 3.
| Subtopic Name | Top 10 Keywords |
|---|---|
| Living costs | price, rent, housing, cost, increase, land, landlord, demand, market, supply |
| Data analysis and research | study, read, book, show, data, effect, article, research, experiment, link |
| Education and family | child, kid, school, parent, family, woman, young, college, sex, student |
| Non-UBI government welfare programs | would, government, benefit, program, welfare, system, social, cost, current, cut |
| Budget and cost | year, month, per, million, dollar, every, billion, average, budget, trillion |
| Economic systems | system, society, capitalism, value, market, economic, economy, power, human, create |
| Labor wages and work conditions | job, work, wage, worker, minimum_wage, pay, hour, low, give, everyone |
| Public services and healthcare | healthcare, free, public, education, universal_healthcare, housing, law, drug, health_care, medical |
| Money and inflation | money, inflation, debt, economy, bank, currency, loan, print, growth, cause |
| Politics and elections | vote, party, politician, policy, political, win, election, politics, candidate, green |
| Global affairs | country, american, world, america, nation, war, global, china, usa, citizen |
| Auotmation and jobs | automation, job, automate, robot, human, technology, machine, replace, future, industry |
| Taxes | tax, income, pay, fund, rate, high, increase, low, rich, wealth |
| Political affiliations | conservative, anti, support, right, libertarian, liberal, left, pro, democrat, progressive |
| Businesses and profit | business, company, profit, corporation, owner, market, worker, stock, union, product |
gpt-3.5-turbo prompting strategy. We used the following prompt to label each comment. The prompt takes the top four LDA topics, a short description for each of them (which was created by reading the top 10 LDA words and comments and extracting the common themes), the text of the comment we want to label, and the text of the parent comment or submission. The descriptions of each topic are in 4 and the prompt is below:
| Subtopic Name | Description |
|---|---|
| Living costs | Comments in this class could discuss UBI’s impact on the housing market, rent, or the prices of essential goods. |
| They could also discuss the supply and price of land, UBI’s impact on landowners and renters, or whether UBI incentivizes people to move. | |
| Data analysis and research | Comments in this class could discuss UBI experiments, studies, and trials, or contain links to other UBI-related resources, such as news articles. |
| They could also debate whether there is evidence on whether UBI works or not. | |
| Education and family | Comments in this class could discuss UBI’s impact on different genders, parents, or child care. They could also discuss family planning. |
| Non-UBI government welfare programs | Comments in this class could discuss government welfare programs that are commonly seen as alternatives to UBI, such as social security, |
| food stamps, or unemployment insurance. | |
| They could compare UBI with these alternatives or discuss whether UBI will replace these alternatives. | |
| Budget and cost | Comments in this class could discuss the monetary cost and government spending required to implement UBI, |
| and whether is it affordable or not. | |
| Economic systems | Comments in this class could discuss economic systems such as socialism, communism, and capitalism. |
| They could also debate whether UBI is socialist or not. | |
| Labor wages and work conditions | Comments in this class could discuss UBI’s impact on wages and the incentive to work. |
| They could also discuss the employee’s bargaining power in the employee - employer relationship. | |
| They could also discuss the kinds of jobs people are free to choose from. | |
| Public services and healthcare | Comments in this class could discuss other public policies that are relevant today, such as healthcare, drug policy, prison reform, |
| public education, and student debt. | |
| Money and inflation | Comments in this class could discuss banks or the Federal Reserve. |
| They could also discuss the supply of money, whether printing money will cause inflation, or whether UBI will cause inflation. | |
| Politics and elections | Comments in this class could discuss different candidates and parties in a political election, the results of an election, or voting. |
| Global affairs | Comments in this class could discuss non-US countries or compare first and third-world countries. |
| They could also disscuss immigration, foreign relations, or war. | |
| Auotmation and jobs | Comments in this class could discuss job loss through automation and technological progress, and whether UBI is a solution to this problem. |
| Taxes | Comments in this class could discuss different types of taxes, such as progressive and regressive taxes, Negative Income Tax (NIT), |
| or Value Added Tax (VAT). | |
| Political affiliations | Comments in this class could compare views on specific political issues between political left and right. |
| They could also discuss people and parties that belong to the political left vs right. | |
| They could also contain the commenter’s political views. | |
| Businesses and profit | Comments in this class could discuss UBI’s impact on companies, their stocks, and their profits. |
| They could also discuss UBI’s impact on small vs large businesses. |
A.6 Community embeddings
Community embeddings position subreddits in a 150-dimensional space using the word2vec algorithm, treating communities as “words” and commenters as “contexts”. In the word2vec word embedding, the vectors of words used in similar contexts are closer together; analogously, the vectors of communities with similar users are closer together in the community embedding. In the community embedding, Waller and Anderson Waller and Anderson (2021) represent the largest 10,006 communities by the number of comments from 2005 to the end of 2018 by 150-dimensional vectors, accounting for 95.4% of all comments on Reddit in this timeframe. Notably, the closeness of any two communities within this embedding is entirely contingent on who comments in the communities and not what they comment.
We apply the exact methodology used by Waller and Anderson but extend the timeline to June 2022. Since the community embeddings include only a subset of the all Reddit communities, we take only the comments from our dataset that belong to a subreddit represented in the community embeddings for all our analyses involving the social dimensions. There were a total of comments that satisfied this criterion.
Using the community embeddings, we can define social dimensions. These social dimensions enable us to position any Reddit community across any social dimensions of interest; for instance, we can quantify how left- or right-leaning a community is. Social dimensions are found from the community embeddings by first seeding a pair of communities that differ in the social dimension of interest but are similar in other regards. These social dimensions provide further insight into the communities on Reddit, for instance, whether a community is more feminine or masculine. We consider the following relevant social dimensions: age (seeded with r/teenagers and r/RedditForGrownups), gender (seeded with r/AskMen and r/AskWomen), partisan (seeded with r/democrats and r/Conservative), and affluence (seeded with r/vagabond and r/backpacking) Waller and Anderson (2021). Waller and Anderson Waller and Anderson (2021) include additional steps such as the augmentation of seed pairs using nine other similar pairs of communities to make the social dimensions more robust. In the social dimensions, a higher social score for a community indicates that a community leans older, more feminine, more right-wing, and more affluent for the age, gender, partisan, and affluence dimensions, respectively.