Rescuing The Primordial Black Holes all-Dark Matter Hypothesis
from The Fast Radio Bursts Tension
Abstract
The primordial black holes (PBHs) as all-dark matter (DM) hypothesis has recently been demotivated by the prediction that these objects would source an excessive rate of fast radio bursts (FRBs). However, these predictions were based on several simplifying assumptions to which this rate is highly sensitive. In this article, we improve previous estimates of this rate arising from the capture of PBHs by neutron stars (NSs), aiming to revitalise this theory. We more accurately compute the velocity distribution functions of PBHs and NSs and also consider an enhancement in the NS and DM density profiles at galactic centers due to the presence of a central supermassive black hole. We find that previous estimates of the rate of FRBs sourced by the capture of PBHs by NSs were 3 orders of magnitude too large, concluding that the PBHs as all DM hypothesis remains a viable theory and that the observed FRB rate can only be entirely explained when considering a central, sufficiently spiky PBH density profile.
I Introduction
The nature of dark matter (DM) is one of the largest outstanding puzzles in modern physics. While it has been confirmed by astrophysical and cosmological observations, its fundamental properties remain unclear. Excepting the fact that it must interact gravitationally, its other properties—such as its mass, spin, and other potential interactions—remain a mystery Peebles (2015); Freese (2017); Bertone and Hooper (2018).
In the dark sector, the Weakly Interacting Massive Particle (WIMP) Jungman et al. (1996) and the axion Preskill et al. (1983); Abbott and Sikivie (1983); Dine and Fischler (1983); Kim and Carosi (2010) constitute two popular DM candidates, but they remain elusive despite three decades of collider d’Enterria (2021); Buchmueller et al. (2017) and direct DM searches Rybka and ADMX Collaboration (2014); Roszkowski et al. (2018); Schumann (2019). Another class of DM candidates is the primordial black hole (PBH) Hawking (1971); Chapline (1975). Being stable and cold on cosmological scales, PBHs make for an outstanding DM candidate. While most of the PBH parameter space has been ruled out by dynamical and relic observations, they can still account for the entirety of the DM content in the Universe if their masses lie in the range Inomata et al. (2017) due to uncertainties in certain bounds, such as those arising from microlensing and white dwarfs Nakamura (1998); Takahashi and Nakamura (2003); Carr et al. (2020). Indeed, if PBHs make up all of DM, a striking consequence is that we would not need to go beyond the Standard Model of particle physics to explain the DM in the Universe. Therefore, from the viewpoint of high-energy physics, the PBH all-DM scenario is a highly compelling theory.
However, the PBH all-DM hypothesis has recently been jeopardized. It has been predicted that these astrophysical objects would source a rate of fast radio bursts (FRBs) Katz (2018) exceeding that inferred from observations Abramowicz et al. (2018). Fast radio bursts are bright and brief radio frequency pulses whose origin remains unknown in spite of the great physics community effort.
Among the several proposed mechanisms for producing FRBs, neutron stars (NSs) are a popular possibility due to their large gravitational, magnetostatic, and electromagnetic energy densities Totani (2013); Lipunov and Pruzhinskaya (2014); Yamasaki et al. (2018); D. Gupta and Saini (2018); Dai et al. (2017); Waxman (2017); Zhang (2018); Buckley et al. (2021). The key idea is that encounters between NSs and PBHs in galaxies would lead to the capture of the PBH by the dense neutron star medium. The PBH would then swallow the host, resulting in a short, bright energy burst during the final stage of the NS collapse. Assuming a uniform distribution for the observed FRBs among galaxies, the authors of Ref. Abramowicz et al. (2018) predicted an FRB rate 3–4 orders of magnitude larger than the observed rate should the entirety of DM be composed of PBHs. Subsequently, based on the calculation of the PBH capture rate by NSs during close encounters performed in Ref. Génolini et al. (2020), one of the present authors and others in Ref. Kainulainen et al. (2021) concluded that the presumed tension between FRB observations and the PBH all-DM hypothesis is just an artifact of a PBH capture rate overestimation. With the goal of comparison with Ref. Abramowicz et al. (2018), authors in Ref. Kainulainen et al. (2021) used the same simplified toy model for the galaxy and velocity distributions. However, the rate of FRBs is highly sensitive to these assumptions, and more realistic modelling is needed for a robust estimate of it.
In this article, we make significant improvements to the previous estimates performed in Ref. Kainulainen et al. (2021) of the FRB rate arising from the PBH capture by NSs under the PBH all-DM hypothesis. In such a scenario, since the production of FRBs is closely linked to the galactic NS and DM density profiles and NS/PBH relative velocity distribution, we mainly focus on these features. First, as a benchmark model for a spiral galaxy, we consider the Milky Way model obtained in Ref. Bhattacharjee et al. (2013) (the BCKM-model), which is based on the most likely values of the relevant galactic parameters from a Markov Chain Monte Carlo analysis using data from galactic rotation curves. Secondly, we use the inversion Eddington formula and a series of Monte Carlo (MC) simulations to compute the relative velocity distribution function (RVDF) between PBHs and NSs in the outer regions of the galaxy and, for the inner regions, we use the Jeans equation.
Our results qualitatively confirm the previous estimates performed in Ref. Kainulainen et al. (2021) and further release the tension between FRBs and the PBH all-DM hypothesis reported in Ref. Abramowicz et al. (2018). In addition, our model improvements with respect to previous estimates lead us to conclude that the production of FRBs via PBH-NS encounters is orders of magnitude smaller than the observed FRB rate. The reason is that typical relative velocities between PBHs and NSs, more accurately computed via the method presented here, are too large to allow for the PBH capture by the NS.
Since the predicted FRB rate is highly dependent on the baryonic and DM density profiles at galactic centers, we also estimate such a rate considering density enhancements. For spiral galaxies, which dominate the signal, we find that if they host large enough spiky PBH central densities, the predicted FRB rate in the PBH all-DM hypothesis may be consistent for an order-of-magnitude estimate with the observed FRB rate.
II Galactic Model
We use the BCKM-model Bhattacharjee et al. (2013) for the Milky Way Galaxy as a benchmark model for a spiral galaxy. The density of the DM halo, , follows a Navarro-French-White profile Navarro et al. (1996) normalized to the DM density at the solar position, , according to
| (1) |
where is the galactic radius, is the scale radius, and is the solar distance from the center of the Galaxy. The visible matter is formed by a spheroidal bulge overlapped with an axisymmetric disk. The bulge decays with the galactic radius as for large distances and depends on the central density and the scale radius of the bulge. The galactic disk shows a double exponential decay as we depart from the galactic plane and center, respectively. The distribution densities of the bulge () and disk () are
| (2) | ||||
| (3) |
where and are the height and radius scale lengths for the disk, respectively, is the local surface density at the solar position, and in axisymmetric cylindrical coordinates. By performing a Markov Chain Monte Carlo analysis based on observed galactic rotation curve data, Ref. Bhattacharjee et al. (2013) found the most-likely values for these parameters, which we summarise in Table 1.
| 30.36 | 0.19 | 0.092 | 57.9 | 3.2 |
III Velocity Distribution Functions
III.1 Eddington formalism
We use the Eddington formula to compute the velocity distribution functions (VDFs) of PBHs and NSs at a given position within the galactic dark halo and bulge, respectively, by linking their spatial density to the total galactic gravitational potential, . In the spherical approximation Catena and Ullio (2012), this potential contains contributions from both dark and baryonic matter (BM) as
| (4) |
where and are the total masses of the dark and baryonic components of the Galaxy, respectively. For a spherically symmetric system composed of collisionless components with isotropic VDFs, there exists a unique correspondence between the isotropic spatial density distribution and its respective phase-space distribution function (PSDF) according to Eddington (1916); Binney and Tremaine (2008)
| (5) |
where is the relative energy defined in terms of the relative potential . From the PSDF in Eq. 5, the VDF at any radius is linked to the density profile via . Each VDF satisfies the normalisation condition
| (6) |
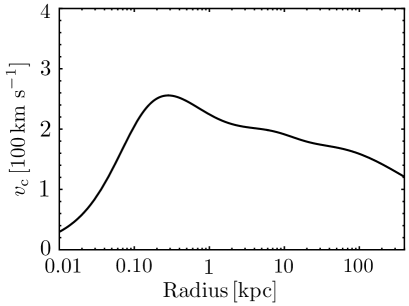
where is the normalized speed distribution (NSD). The circular speed is calculated via for the Galactic model parameters of the Milky Way given in Table 1. We show this in Fig. 1.
We calculate the VDF and NSD associated with PBHs in the Galactic dark halo by setting the density profile to in Eq. 1. Fig. 2 (top) shows a selection of NSDs for PBHs in our galactic model at different radii (solid lines) as well as the best-fit Maxwell-Boltzmann (MB) 3-d isotropic velocity distributions (dashed lines) with the corresponding goodness-of-fit metric values quoted. Though best suited for linear models, this quantity provides us with a comparative metric with which to judge each of our MB fits, and we use it only for illustrative purposes. As the radius decreases, the typical speeds move towards larger values and the distribution widens. We have verified that our distributions agree with those computed by Ref. Bhattacharjee et al. (2013).
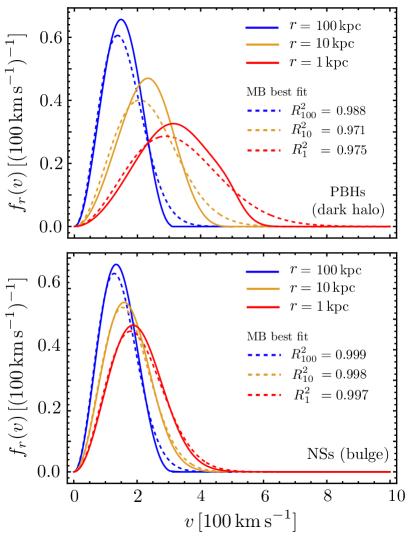
In the stellar bulge, we calculate the VDF and NSD associated with NSs by setting the density profile to in Eq. 2. Fig. 2 (bottom) shows a choice of NSDs for NSs in our galactic model at different radii (solid lines) as well as the best-fit MB 3-d isotropic velocity distributions (dashed lines) with the corresponding values. The NSDs are well-described by MB distributions at radius with a peak speed at .
In the disk, we cannot apply the Eddington formalism since the system is no longer spherically symmetric. In the limit of a razor-thin disk, we may assume that the VDF for NSs follows a bi-dimensional MB distribution in the galactic plane. We have numerically checked that the disk contribution to the final FRB rate is subdominant in comparison to that from the bulge, as previously pointed out in Kainulainen et al. (2021). We therefore only focus on the Galactic bulge.
III.2 Galactic Center
Most galactic centers host supermassive black holes (SMBHs) with masses around Kormendy and Ho (2000), which would have a strong impact on the dark and baryonic matter velocity distributions within certain characteristic galactic radii. This fact is relevant in the context of FRBs since the final FRB rate would receive a dominant contribution from inner galactic regions, as mentioned in Ref. Kainulainen et al. (2021). Since it is computationally intensive to apply the Eddington formalism in regions very close to the Galatic center, we estimate this contribution by using the Jeans equation and reasonable assumptions.
The so-called gravitational influence radius Peebles (1972) is defined as Peebles (1972), where is the stellar velocity dispersion of the host bulge. For the particular case of the Milky Way, we have and extends until Safdi et al. (2019). For galactic radii , the SMBH presence can be safely neglected as we did in Section III.1. For , we may estimate the velocity distributions for NSs and PBHs by solving the Jeans equation. We take both number densities to follow power-laws with an index and assume circular velocities , where is the total Galactic mass within a radius . We obtain Dehnen et al. (2006); Safdi et al. (2019)
| (7) |
where , is the 3-d velocity dispersion of an isotropic MB velocity distribution, , and we have taken . The relative velocity dispersion is readily calculated, for example, as .
IV Relative velocity distribution functions
The FRB rate is highly sensitive to the distribution of relative speeds between PBHs and NSs. While the NS-NS relative speed distribution is analytically tractable since their speeds follow an MB profile to a good approximation, those for NS-PBH and PBH-PBH must be found numerically. This is because the PBH VDF, , is itself found numerically via Eq. 5. To retrieve these distributions, we proceed via a series of Monte Carlo (MC) simulations.
We begin by sampling velocities from the relevant velocity distributions, . To find the distribution of relative speeds, we compute the magnitudes of the differences of these vectors to arrive at the relevant distribution function, or . We then employ Gaussian kernel density estimators to provide us with continuous functions of in terms of .
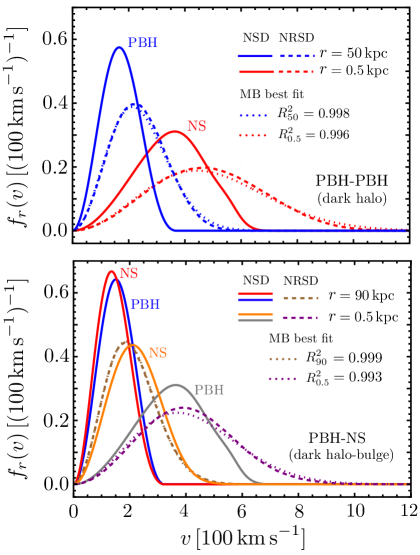
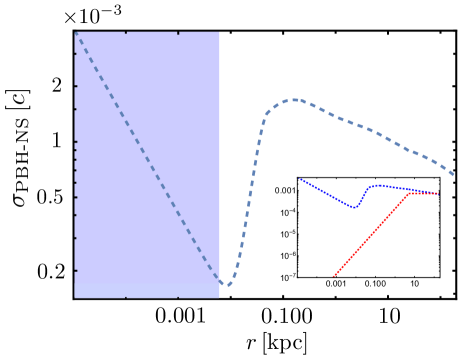
Fig. 3 shows the normalized relative speed distributions (top) and (bottom) for a given choice of galactic radii. In both cases, while solid lines refer to , the dashed lines show the corresponding . We observe that the normalized relative speed distributions tend to widen and peak at a higher speed in comparison to the original distributions. We also fit the relative speed distributions to MB profiles as in Sec. II, finding excellent agreement despite the speed distributions of individual species, especially those of PBHs, departing from MB profiles.
Neutron stars in the bulge have normalized speed distributions close to an MB profile, as Fig. 2 evinces. This explains why the corresponding normalized relative speed distributions also closely follow MB distributions.
Fig. 4 shows the three-dimensional relative velocity dispersion in light velocity units through the galaxy between PBHs and NSs in the bulge, , as obtained in our fits to MB profiles. As explained in Sec. III, while we use the Jeans equation for regions close to the Galactic center under the presence of the central SMBH (blue shaded region), we use the Eddington formalism for the outer ones. The presence of the SMBH has a large impact on , leading to for . This behavior departs from that assumed in Refs. Abramowicz et al. (2018); Kainulainen et al. (2021), where the 3-d relative velocity dispersion was taken to be proportional to in the galactic inner regions. This has a significant impact on the predicted FRB rate since the PBH capture from NSs is highly sensitive to . We will return to this point in Sec. VII.
V Fast Radio Bursts Rate Calculation
After a PBH is captured by an NS, the PBH swallows the NS, leading to the formation of a black hole (BH) and the burst emission of the initial NS magnetic field energy. Such a burst is the source of FRBs. To compute this rate, we follow a similar approach to that in Ref. Kainulainen et al. (2021). However, we introduce crucial improvements with respect to the galactic model and the corresponding velocity distributions of PBHs and NSs.
We take a PBH all-DM scenario with a non-monochromatic mass function with a mean PBH mass . The DM halo is composed of PBHs with . As NSs () are produced from the core-collapse of massive stars in the galactic disk and bulge, they will collide with PBHs, leading to a population of BHs (). For consistency, we also consider a population of stellar black holes () coming from stellar evolution. Table 2 summarizes the species involved in our scenario.
As initial conditions, we set all radial number densities to zero, but . We proceed to evolve in time all by solving the following system of first-order differential equations Kainulainen et al. (2021):
| (8) | |||
| (9) | |||
| (10) | |||
| (11) |
where and are the total creation rate for NSs and stellar BHs, respectively, is the ratio between the capture and collision rates for NS-PBH encounters, and is the effective collision cross section averaged over the relative velocity between the and species. The ratio is calculated in Génolini et al. (2020) for comparing the initial PBH energy with all sources of energy dissipation during an NS-PBH encounter. Crucially, depending on the relative velocity between both astrophysical objects (), such a ratio takes the form
| (12) |
where
| (13) |
with
| (14) |
| (Index) - Type | of astrophysical | species in the | galaxy |
|---|---|---|---|
| (N) NS | |||
| (P) PBH | |||
| (0) Light BH | |||
| (1) Stellar BH |
The effective collision cross section averaged over the relative velocities between and species reads as
| (15) |
where will depend on the interacting species.
The system of equations (8)-(10) is solved in the galactic bulge using the RVDFs obtained as indicated in Sec. III, where we assume that light and stellar BHs behave as NSs insofar as their velocity distributions are concerned. Since from Eq. (12) were assumed in Ref. Génolini et al. (2020) to follow an MB 3-d isotropic velocity distribution, we fit our and obtained numerically in the outer regions of the Galaxy to the closest MB distributions for consistency.
VI Enhanced DM density at Galactic centers
Most galactic centers host supermassive black holes. Apart from the effect on the NS and PBHs velocity distributions, we expect that the formation and presence of central SMBHs would dynamically affect both baryonic and DM densities in the most inner galactic regions. Since the FRB rate is dominated by inner galactic regions, a significant overdensity associated with NSs and/or PBHs at galactic centers may boost the FRB rate Kainulainen et al. (2021).
Here, we estimate the FRB rate arising from the sphere of gravitational influence around central SMBHs in spiral galaxies. This rate should be the order of the whole galactic rate. Although we use the Milky Way as a benchmark model for spiral galaxies, we strive to be as general as possible.
At galactic centers, NSs could hold a steeply-rising stellar density at radii , with Safdi et al. (2019) in the case of the Milky Way. If the typical relaxation time is short enough, via a two-body interaction, stars would exchange orbital energy leading to the formation of a Bahcall-Wolf density cusp Bahcall and Wolf (1976) around the SMBH. Numerical simulations Freitag et al. (2006) shows that there should be around NSs within 1 pc around after holding a number density that may be approximated by an “eta-model” Dehnen (1993); Tremaine et al. (1994); Safdi et al. (2019) with , e.g.
| (16) |
where , , and .
Similarly, DM may form a collisional cusp near galactic centers via the Bahcall-Wolf mechanism. Even though DM is considered to be collisionless, they would be scattered off by stars Ilyin et al. (2004); Merritt (2004); Gnedin and Primack (2004) leading to a number density close to the SMBH as , with . This feature would be valid even in the case that the galactic center undergoes a previous scouring by a binary SMBH Merritt et al. (2007).
On the other hand, if the SMBH is considered to grow adiabatically at the galactic center of the DM halo holding an initial singular power-law number density cusp, with as suggested by numerical simulations Navarro et al. (1996); Moore et al. (1998), DM may form spikes at galactic centers being a steep function of the galactic radius as with Gondolo and Silk (1999); Bertone et al. (2002). Even though the presence of such spikes requires particular initial conditions and they can be later weakened or destroyed Ullio et al. (2001), we will still consider them for completeness to estimate the effect on the FRB rate.
The actual form for the cuspy density profile at galactic centers, , that we consider takes the form
| (17) |
where is obtained from Eq. (1), and the valid radii range is .
For the spiky density profile, , we follow Gondolo and Silk (1999) and take the form
| (18) |
where and with and , respectively. Here depends on the -value and is obtained numerically.
To estimate the velocity dispersion for NSs and PBHs at galactic centers, we solve the Jeans equation Dehnen et al. (2006) as before and use the fact that both number densities are taken to follow power-laws with certain indices and assume circular velocities to obtain
| (19) |
where is the 3-d velocity dispersion of a isotropic MB velocity distribution, , as appropriate, and within the radius of interest. The relative velocity dispersion is readily calculated as as well as the effective collision cross section average over , Eq. (15), as Nurmi et al. (2021)
| (20) |
We estimate the FRB rate associated with a density enhanced environment at galactic centers by integrating the inner region as
| (21) |
where the NS number density is given by Eq. (16) and the PBH number density is chosen to hold a cuspy or spiky profile, e.g. and , respectively.
VII Results and Discussion
Numerical results based on previous sections are summarized in Fig. 5. The current number of FRBs per day and per galaxy in a typical spiral galaxy in terms of the PBH mass is shown as an orange shaded region, where (dashed orange line) and (solid orange line). This rate is calculated using a similar procedure to that in Ref. Kainulainen et al. (2021), but taking the Milky Way as the galactic model and calculating the relative velocity distributions between different astrophysical species (NSs, PBHs, and BHs) more accurately. For the outer galatic regions, we use the Eddington inversion formula and a series of MC simulations and MB-profile fits, while for the inner galactic regions we use the Jeans equation. In the parameter space of interest, where all DM can be composed of PBHs, (green shaded region), the predicted FRB rate is about 3-4 orders of magnitude smaller than the observed FRB rate, Champion et al. (2016); Petroff et al. (2019).
This result improves that from Ref. Kainulainen et al. (2021) (blue shaded region), where the calculation of relative velocities between PBH and NS in the galactic inner region is oversimplified. In detail, the assumed model was the piece-wise function for and for , where . As the red dashed line in the lower right corner of Fig. 4 shows, the relative velocity dispersion is highly underestimated in such a case, leading to an overestimation of the FRB rate, where the PBH capture from NSs strongly depends on via Eq. (12). Indeed, the presence of an SMBH at galactic centers fixes the total mass of the galaxy in the most inner regions, increasing the PBH-NS relative velocity dispersion, , and suppressing the PBH capture, , as one approaches the center.
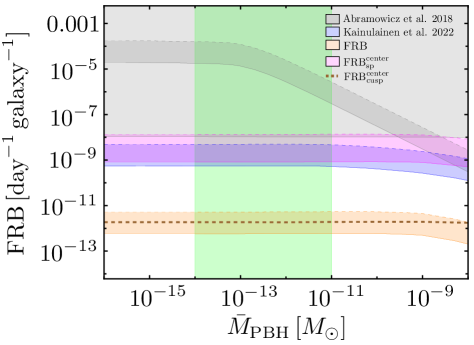
In addition, as was first pointed out in Ref. Kainulainen et al. (2021), we have shown that the very first estimates for the FRB rate due to the capture of PBHs performed in Ref. Abramowicz et al. (2018) (gray shaded region) largely overestimated the FRB signal due to NS–PBH captures. This is because they assumed all collisions lead to a PBH capture (), arriving at the controversial conclusion that the PBH all-DM scenario is ruled out.
Besides the effect on the NS-PBH velocity distributions, it is expected that the formation and presence of central SMBHs in spiral galaxies would dynamically affect their densities in the most inner region. To obtain an estimate of such an effect, we have calculated the rate for FRBs arising from the sphere of gravitational influence due to a central SMBH.
Considering cuspy NS and PBH density profiles, i.e. and , respectively, does not impact the final FRB rate for an order-of-magnitude estimate (dashed brown line). However, considering a cuspy NS density profile but a spiky PBH density profile, i.e. with and , the FRB rate may increase by several orders of magnitude. The shaded purple region corresponds to . We see that the predicted signal would be consistent with the observed rate for an order-of-magnitude estimate for a ‘spiky enough’ DM profile.
Nevertheless, this last statement should be taken with caution. Even though galactic centers may hold a DM spike, several conditions need to be satisfied for this to be true. Only if the SMBH is placed just at the center of the DM halo, a tiny initial mass may grow adiabatically in the pre-existent DM halo to its final mass at the present day. If the formation of the SMBH occurs away from the center and undergoes an inspiral motion, the central DM spike is weakened as or even transformed into a depletion rather than an enhancement Ullio et al. (2001).
We conclude that the PBH all-DM hypothesis is not in tension with the observed rate of FRB and, indeed, may be consistent with it given an order-of-magnitude estimate in the case that most spiral galaxies, which dominate the signal, host sufficiently spiky PBH central densities due to the presence of a central SMBH.
VIII Acknowledgments
EDS and DWPA thank Andrew J. Long (Rice University) for his comments and suggestions. EDS and DWPA thank Megan Reiter (Rice University) for discussions on the velocity distribution functions in galaxies. EDS thanks Kimmo Kainulainen (University of Jyvskl) and Sami Nurmi (University of Jyvskl and University of Helsinki) for useful comments about this manuscript. EDS was supported in part by the National Science Foundation under Award No. PHY-2114024. DWPA was supported by the National Science Foundation under award 2209444.
References
- Peebles (2015) P. J. E. Peebles, “Dark Matter,” Proc. Nat. Acad. Sci. 112, 2246 (2015), arXiv:1305.6859 [astro-ph.CO] .
- Freese (2017) K. Freese, “Status of Dark Matter in the Universe,” Int. J. Mod. Phys. 1, 325 (2017).
- Bertone and Hooper (2018) G. Bertone and D. Hooper, “History of dark matter,” Rev. Mod. Phys. 90, 045002 (2018).
- Jungman et al. (1996) Gerard Jungman, Marc Kamionkowski, and Kim Griest, “Supersymmetric dark matter,” Phys. Rept. 267, 195–373 (1996), arXiv:hep-ph/9506380 .
- Preskill et al. (1983) J. Preskill, M. B. Wise, and F. Wilczek, “Cosmology of the invisible axion,” Phys. Lett. B 120, 127 (1983).
- Abbott and Sikivie (1983) L.F. Abbott and P. Sikivie, “A cosmological bound on the invisible axion,” Phys. Lett. B 120, 133 (1983).
- Dine and Fischler (1983) M. Dine and W. Fischler, “The not-so-harmless axion,” Phys. Lett. B 120, 137 (1983).
- Kim and Carosi (2010) J. E. Kim and G. Carosi, “Axions and the Strong CP Problem,” Rev. Mod. Phys. 82, 557 (2010), [Erratum: Rev.Mod.Phys. 91, 049902 (2019)].
- d’Enterria (2021) David d’Enterria, “Collider constraints on axion-like particles,” in Workshop on Feebly Interacting Particles (2021) arXiv:2102.08971 [hep-ex] .
- Buchmueller et al. (2017) Oliver Buchmueller, Caterina Doglioni, and Lian Tao Wang, “Search for dark matter at colliders,” Nature Phys. 13, 217–223 (2017), arXiv:1912.12739 [hep-ex] .
- Rybka and ADMX Collaboration (2014) Gray Rybka and ADMX Collaboration, “Direct detection searches for axion dark matter,” Physics of the Dark Universe 4, 14–16 (2014).
- Roszkowski et al. (2018) L. Roszkowski, E. M. Sessolo, and S. Trojanowski, “WIMP dark matter candidates and searches—current status and future prospects,” Rep. Prog. Phys. 81, 066201 (2018).
- Schumann (2019) Marc Schumann, “Direct Detection of WIMP Dark Matter: Concepts and Status,” J. Phys. G 46, 103003 (2019), arXiv:1903.03026 [astro-ph.CO] .
- Hawking (1971) S. Hawking, “Gravitationally collapsed objects of very low mass,” Mon. Not. R. Astron. Soc. 152, 75 (1971).
- Chapline (1975) G. F. Chapline, “Cosmological effects of primordial black holes,” Nature 253, 251 (1975).
- Inomata et al. (2017) K. Inomata, M. Kawasaki, K. Mukaida, Y. Tada, and T. T. Yanagida, “Inflationary Primordial Black Holes as All Dark Matter,” Phys. Rev. D 96, 043504 (2017).
- Nakamura (1998) T. T. Nakamura, “Gravitational lensing of gravitational waves from inspiraling binaries by a point mass lens,” Phys. Rev. Lett. 80, 1138 (1998).
- Takahashi and Nakamura (2003) R. Takahashi and T. Nakamura, “Wave effects in gravitational lensing of gravitational waves from chirping binaries,” Astrophys. J. 595, 1039 (2003).
- Carr et al. (2020) Bernard Carr et al., “Constraints on Primordial Black Holes,” (2020), arXiv:2002.12778 [astro-ph.CO] .
- Katz (2018) J. I. Katz, “Fast radio bursts,” Prog. Part. Nucl. Phys. 103, 1 (2018).
- Abramowicz et al. (2018) M. A. Abramowicz, M. Bejger, and M. Wielgus, “Collisions of neutron stars with primordial black holes as fast radio bursts engines,” Astrophys. J. 868, 17 (2018).
- Totani (2013) T. Totani, “Cosmological Fast Radio Bursts from Binary Neutron Star Mergers,” Publ. Astron. Soc. Jpn. 65, L12 (2013).
- Lipunov and Pruzhinskaya (2014) V. M. Lipunov and M. V. Pruzhinskaya, “Scenario Machine: fast radio bursts, short gamma-ray burst, dark energy and Laser Interferometer Gravitational-wave Observatory silence,” Mon. Not. R. Astron. Soc. 440, 1193 (2014).
- Yamasaki et al. (2018) S. Yamasaki, T. Totani, and K. Kiuchi, “Repeating and Non-repeating Fast Radio Bursts from Binary Neutron Star Mergers,” Publ. Astron. Soc. Jpn. 70, 39 (2018).
- D. Gupta and Saini (2018) P. D. Gupta and N. Saini, “Collapsing supra-massive magnetars: FRBs, the repeating FRB121102 and GRBs,” J. Astrophys. Astron. 39, 14 (2018).
- Dai et al. (2017) Z. G. Dai, J. S. Wang, and Y. W. Yu, “Radio Emission from Pulsar Wind Nebulae without Surrounding Supernova Ejecta: Application to FRB 121102,” Astrophys. J. Lett. 838, L7 (2017).
- Waxman (2017) E. Waxman, “On the origin of fast radio bursts (FRBs),” Astrophys. J. 842, 34 (2017).
- Zhang (2018) B. Zhang, “Fast Radio Burst Energetics and Detectability from High Redshifts,” Astrophys. J. Lett. 867, L21 (2018).
- Buckley et al. (2021) J. H. Buckley, P. S. B. Dev, F. Ferrer, and F. P. Huang, “Fast radio bursts from axion stars moving through pulsar magnetospheres,” Phys. Rev. D 103, 043015 (2021).
- Génolini et al. (2020) Y. Génolini, P. Serpico, and P. Tinyakov, “Revisiting primordial black hole capture into neutron stars,” Phys. Rev. D 102, 083004 (2020).
- Kainulainen et al. (2021) Kimmo Kainulainen, Sami Nurmi, Enrico D. Schiappacasse, and Tsutomu T. Yanagida, “Can primordial black holes as all dark matter explain fast radio bursts?” Phys. Rev. D 104, 123033 (2021), arXiv:2108.08717 [astro-ph.HE] .
- Bhattacharjee et al. (2013) Pijushpani Bhattacharjee, Soumini Chaudhury, Susmita Kundu, and Subhabrata Majumdar, “Sizing-up the WIMPs of Milky Way : Deriving the velocity distribution of Galactic Dark Matter particles from the rotation curve data,” Phys. Rev. D 87, 083525 (2013), arXiv:1210.2328 [astro-ph.GA] .
- Navarro et al. (1996) Julio F. Navarro, Carlos S. Frenk, and Simon D. M. White, “The Structure of Cold Dark Matter Halos,” APJ 462, 563 (1996), arXiv:astro-ph/9508025 [astro-ph] .
- Freudenreich (1998) H. T. Freudenreich, “A COBE Model of the Galactic Bar and Disk,” APJ 492, 495–510 (1998), arXiv:astro-ph/9707340 [astro-ph] .
- Catena and Ullio (2012) Riccardo Catena and Piero Ullio, “The local dark matter phase-space density and impact on WIMP direct detection,” JCAP 05, 005 (2012), arXiv:1111.3556 [astro-ph.CO] .
- Eddington (1916) A. S. Eddington, “The distribution of stars in globular clusters,” MNRAS 76, 572–585 (1916).
- Binney and Tremaine (2008) James Binney and Scott Tremaine, Galactic Dynamics: Second Edition (2008).
- Kormendy and Ho (2000) John Kormendy and Luis C. Ho, “Supermassive black holes in inactive galaxies,” (2000), 10.1888/0333750888/2635, arXiv:astro-ph/0003268 .
- Peebles (1972) P. J. E. Peebles, “Star Distribution Near a Collapsed Object,” APJ 178, 371–376 (1972).
- Safdi et al. (2019) Benjamin R. Safdi, Zhiquan Sun, and Alexander Y. Chen, “Detecting Axion Dark Matter with Radio Lines from Neutron Star Populations,” Phys. Rev. D 99, 123021 (2019), arXiv:1811.01020 [astro-ph.CO] .
- Dehnen et al. (2006) Walter Dehnen, Dean McLaughlin, and Jalpesh Sachania, “The velocity dispersion and mass profile of the milky way,” Mon. Not. Roy. Astron. Soc. 369, 1688–1692 (2006), arXiv:astro-ph/0603825 .
- Bahcall and Wolf (1976) J. N. Bahcall and R. A. Wolf, “Star distribution around a massive black hole in a globular cluster.” APJ 209, 214–232 (1976).
- Freitag et al. (2006) Marc Freitag, Pau Amaro-Seoane, and Vassiliki Kalogera, “Stellar remnants in galactic nuclei: mass segregation,” Astrophys. J. 649, 91–117 (2006), arXiv:astro-ph/0603280 .
- Dehnen (1993) W. Dehnen, “A Family of Potential-Density Pairs for Spherical Galaxies and Bulges,” MNRAS 265, 250 (1993).
- Tremaine et al. (1994) Scott Tremaine, Douglas O. Richstone, Yong-Ik Byun, Alan Dressler, S. M. Faber, Carl Grillmair, John Kormendy, and Tod R. Lauer, “A Family of Models for Spherical Stellar Systems,” AJ 107, 634 (1994), arXiv:astro-ph/9309044 [astro-ph] .
- Ilyin et al. (2004) A. S. Ilyin, K. P. Zybin, and A. V. Gurevich, “Dark matter in galaxies and the growth of giant black holes,” Soviet Journal of Experimental and Theoretical Physics 98, 1–13 (2004), arXiv:astro-ph/0306490 [astro-ph] .
- Merritt (2004) David Merritt, “Evolution of the dark matter distribution at the galactic center,” Phys. Rev. Lett. 92, 201304 (2004).
- Gnedin and Primack (2004) Oleg Y. Gnedin and Joel R. Primack, “Dark matter profile in the galactic center,” Phys. Rev. Lett. 93, 061302 (2004).
- Merritt et al. (2007) David Merritt, Stefan Harfst, and Gianfranco Bertone, “Collisionally Regenerated Dark Matter Structures in Galactic Nuclei,” Phys. Rev. D 75, 043517 (2007), arXiv:astro-ph/0610425 .
- Navarro et al. (1996) Julio F. Navarro, Carlos S. Frenk, and Simon D. M. White, “The Structure of cold dark matter halos,” Astrophys. J. 462, 563–575 (1996), arXiv:astro-ph/9508025 .
- Moore et al. (1998) B. Moore, F. Governato, T. Quinn, J. Stadel, and G. Lake, “Resolving the Structure of Cold Dark Matter Halos,” APJL 499, L5–L8 (1998), arXiv:astro-ph/9709051 [astro-ph] .
- Gondolo and Silk (1999) Paolo Gondolo and Joseph Silk, “Dark matter annihilation at the galactic center,” Phys. Rev. Lett. 83, 1719–1722 (1999), arXiv:astro-ph/9906391 .
- Bertone et al. (2002) Gianfranco Bertone, Guenter Sigl, and Joseph Silk, “Annihilation radiation from a dark matter spike at the galactic center,” Mon. Not. Roy. Astron. Soc. 337, 98 (2002), arXiv:astro-ph/0203488 .
- Ullio et al. (2001) Piero Ullio, HongSheng Zhao, and Marc Kamionkowski, “A Dark matter spike at the galactic center?” Phys. Rev. D 64, 043504 (2001), arXiv:astro-ph/0101481 .
- Nurmi et al. (2021) S. Nurmi, E. D. Schiappacasse, and T. T. Yanagida, “Radio signatures from encounters between neutron stars and QCD-axion minihalos around primordial black holes,” J. Cosmol. Astropart. Phys. 09, 004 (2021).
- Champion et al. (2016) D. J. Champion et al., “Five new fast radio bursts from the HTRU high-latitude survey at Parkes: first evidence for two-component bursts,” Mon. Not. Roy. Astron. Soc. 460, L30–L34 (2016), arXiv:1511.07746 [astro-ph.HE] .
- Petroff et al. (2019) E. Petroff, J. W. T. Hessels, and D. R. Lorimer, “Fast Radio Bursts,” Astron. Astrophys. Rev. 27, 4 (2019).
- Champion et al. (2016) D. J. Champion et al., “Five new fast radio bursts from the HTRU high-latitude survey at Parkes: first evidence for two-component bursts,” Mon. Not. R. Astron. Soc. 460, L30 (2016).